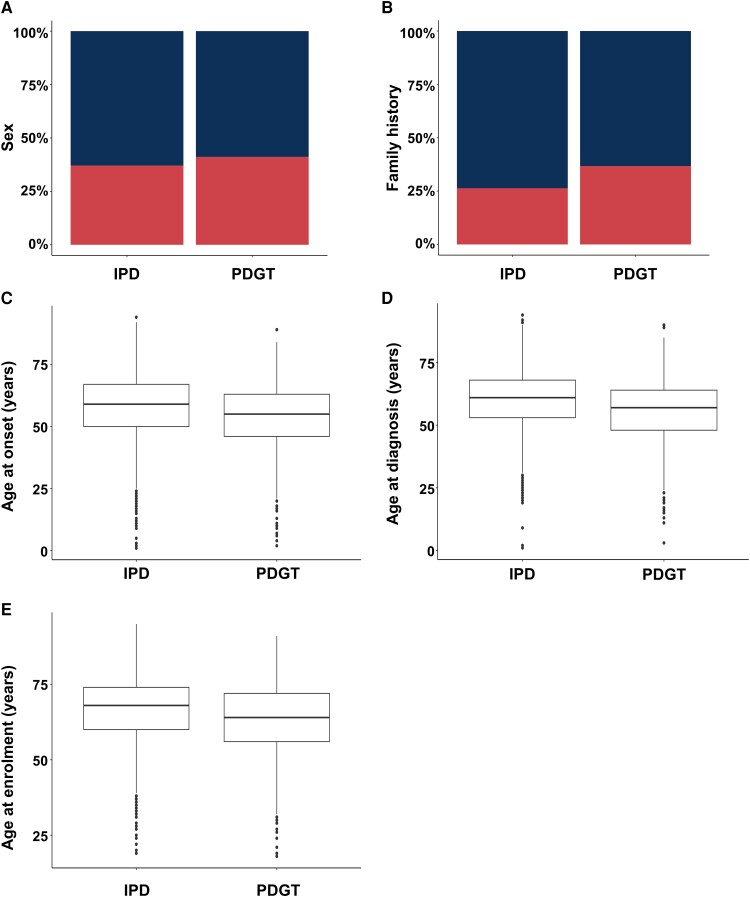
Figure 3.
Comparison of demographic and age-related variables between idiopathic Parkinson’s disease patients and those with a positive Parkinson’s disease-relevant genetic test (PDGT). (A) Sex (top section in blue = male; bottom section in red = female). (B) Fractions of patients with positive family history (bottom section in red = positive family history; top section in blue = negative family history). (C) Age at onset. (D) Age at diagnosis. (E) Age at enrolment. IPD = idiopathic Parkinson’s disease.

