

Abstract
Background and purpose:
To compare secondary malignancy risks of modern proton and photon therapy techniques for locally advanced breast cancer.
Methods and materials:
We utilized dosimetric data from 34 [10 photon-VMAT, 10 photon-3DCRT, 14 pencil beam scanning proton (PBS)] breast cancer patients who received comprehensive nodal irradiation. Employing a model based on organ equivalent dose to account for both inhomogeneous organ dose distributions and non-linear functional dose relationships, we estimated excess absolute risk, excess relative risk, and lifetime attributable risk (LAR) for secondary malignancies. The model uses dose distribution, number of fractions, age at exposure, attained age, the linear-quadratic dose response relationship for cell survival, repopulation factor, as well as gender specific age dependencies, and initial slopes of dose response curves.
Results:
The LAR for carcinoma at age 70 was estimated to be up to 3.64% for esophagus with an advantage of 3DCRT over PBS and VMAT. For the ipsilateral lung, risks were lowest for PBS (up to 5.56%), followed by 3DCRT (up to 6.54%) and VMAT (up to 7.7%). For the contralateral lung, there is a clear advantage of 3DCRT and PBS techniques (risk <0.86%) over VMAT (up to 4.4%). The risk for the contralateral breast is negligible for 3DCRT and PBS but was estimated as up to 1.2% for VMAT. Risks for the thyroid are overall negligible. Independently performed comparative treatment plans on 10 patients revealed that the risk for the contralateral lung and breast using VMAT can be more than an order of magnitude higher compared to PBS. Sarcoma risks were estimated as well showing similar trends but were overall lower compared to carcinoma.
Conclusion:
Conventional (3DCRT) techniques led to the lowest estimated risks of, thyroid and esophageal secondary cancers while PBS demonstrated a benefit for secondary lung and contralateral breast cancer risks, with the highest risks overall associated with VMAT techniques.
Keywords: Secondary malignancies, Outcome modelling, Breast cancer
The use of a specific treatment technique in radiation therapy is mainly motivated by the achievable dose conformity to the target and the overall integral dose. Proton therapy offers a highly conformal and comprehensive treatment option with a lower integral dose (reduced low-dose bath) to organs at risk (OARs). Consequently, given the proximity of cardiopulmonary structures, proton therapy has been discussed as a treatment alternative for breast cancer patients [1–3]. Treatment planning studies, comparing 3DCRT, IMRT, and proton therapy when irradiating the breast and regional nodes showed advantages of using proton therapy particularly in terms of dose to the heart [4–6].
Considering the good prognosis and long life expectancy of breast cancer patients, late toxicities such as cardiac toxicities or secondary cancers are of concern [7–15]. While there are many factors impacting the risk for developing a secondary cancer, such as smoking status or chemotherapy [12,16,17], it has been estimated that ~9% of the secondary cancers among breast cancer patients are attributable to radiation exposure [18,19]. Several observational population-based studies have assessed secondary cancer risks [9,12,17–26]. None of these studies have included proton therapy patients.
The aim of this study was to compare secondary cancer risks between 3DCRT, VMAT and PBS. In dosimetric planning studies comparing different modalities, the outcome might depend on the treatment planning consideration for each modality. Selecting patients that were previously treated using 3DCRT, VMAT or proton therapy might introduce a bias because patients might have been selected for specific modalities due to confounding factors and different constraints might have been used depending on the treatment modality. On the other hand, using a cohort of patients and subsequently planning each patient for all three modalities also might introduce a bias as specific patients might not have been selected for a specific modality due to confounding factors or dosimetric considerations. Consequently, this study did both, comparing secondary cancer risks based on a retrospective analysis of treatment plans for a cohort of patients treated with the three modalities as well as re-planning a cohort of patients with all three different modalities to compare risks of different treatment options for the same patient.
Methods
Modelling approach
Classical models to estimate the risk (excess relative risk (ERR) or excess absolute risk (EAR in risk per 10,000 Person Years (PY))) for a secondary cancer are based on the atomic bomb survivors [27–29]. In order to apply them to radiation therapy conditions with inhomogeneous and higher doses, these models have been expanded beyond a purely linear dose–response relationship [28,30–34]. Using a repopulation parameter, the number of fractions, and a cell kill parameter obtained from the tissue-dependent parameters of the linear quadratic model, an organ equivalent dose (OED) can be defined. The OED replaces the homogeneous low dose D in risk formalisms for low dose exposure [29]. The complete model to estimate ERR and EAR for a specific organ also includes gender and age specific parameters obtained from low dose data. In addition to ERR and EAR, the Lifetime Attributable Risk (LAR; percentage likelihood in excess of the baseline risk of secondary malignancy happening during one’s lifetime) can be estimated as an integral of excess risk for all attained ages up to a maximum age. The LAR can be calculated based on either the ERR or the EAR formalism. For details on the formalism, the reader is referred to the Supplementary Material.
Model parameters
We applied model parameters based on the analysis of Hodgkin’s patients published by Schneider et al. (Supplementary Material Table S3) [34]. While this might lead to an overestimation of cancer incidences due to the genetic susceptibility of the Hodgkin patient population with regard to cancer, estimated relative risks (photons versus protons) are less affected. In a study on radiation induced lung cancer in Hodgkin’s disease patients, Gilbert et al [35] found similar dose–response relationships as in breast cancer patients with an ERR of 15% per Gy. For comparison, we also applied parameters published in the BEIR VII report (Supplementary Material Table S4) [29]. The LAR was calculated based on EAR alone when using the Schneider et al. parameters. When using the BEIR VII parameters for ERR and EAR, we did estimate LAR using a log weighted average of the ERR and EAR based formalisms.
Patient cohort
After approval by the institutional review board a cohort of 34 patients was analyzed, 20 treated with photon techniques (10 3DCRT and 10 VMAT) and 14 treated with proton therapy (using pencil beam scanning (PBS)). The average age was 47.3 years,41.9 years, and 45.8 years for the 3DCRT, VMAT, and PBS cohort, respectively. All patients were treated at our institution and 10 for each modality were randomly selected. We then added 4 patients in the proton arm in order to reach a similar average age at exposure for the three groups. In addition, in order to allow for a one-to-one comparison between modalities for the same patient characteristics, 10 of the PBS patients (average age 38.9 years, range 20–54) were re-planned using both 3DCRT and VMAT techniques. The dose distribution for one of these patients is shown in Fig. 1
Fig. 1.
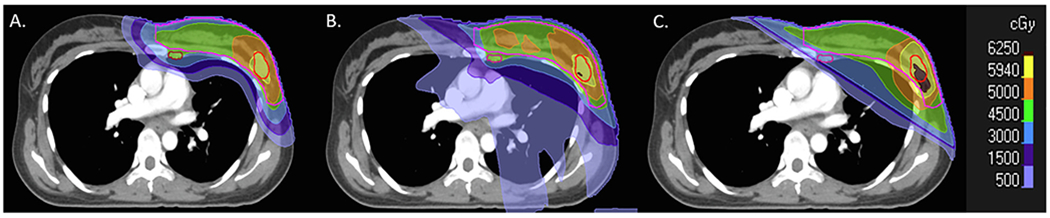
Treatment plans for a breast cancer patient using PBS (A), VMAT (B), and 3DCRT (C).
Of the total cohort of 34 patients who received treatment by modality, 3/14 (21%) had intact breast with PBS, 3/10 (30%) had intact breast with 3D, and 2/10 (20%) had intact breast with VMAT. Of the 10 patients selected for direct comparison planning between PBS, VMAT, and 3D, 8 patients received mastectomy and 2 had intact breasts (2/10, 20%), in keeping with the approximately percentages observed in the larger cohort by modality.
Treatment planning
For the purposes of this study, all treatment plans utilized institutional constraints for acceptability to OARs. These constraints vary by virtue of treatment modality. The RTOG breast and RadCOMP contouring atlases were used for delineation of both target structures and OARs. Target structures included the breast/chest wall (excluding ribs), supraclavicular (SCV), and internal mammary (IMN) lymph nodes, and axilla. For patients with breast reconstruction, the prosthesis and overlying skin were included in the chest wall target. OARs included the esophagus, thyroid, bilateral lungs, contralateral breast, and heart.
Across PBS, VMAT, and 3DCRT plans, the doses prescribed to each target were the same. Specifically, the chest wall and IMN dose was either 50 Gy in 25 daily fractions of 2.0 Gy, or 50.4 Gy in 28 daily fractions of 1.8 Gy, 5 days per week. The SCV and axilla received either 45 Gy or 50.4 Gy in 25 or 28 daily fractions of 1.8 Gy, 5 days per week. For patients with intact breasts, the whole breast was prescribed 45.0 Gy in 25 daily fractions of 1.8 Gy, 5 days per week, followed by a 14.4 Gy boost in 1.8 Gy per day to the lumpectomy cavity. In the case of PBS, Gy(RBE) were prescribed using an RBE (relative biological effectiveness) of 1.1. Target coverage was maximized while meeting the below normal tissue constraints.
For PBS, normal tissue constraints included a maximum esophageal dose of 40 Gy(RBE), a maximum thyroid dose of 50.4 Gy(RBE), a maximum mean heart dose of 1.5 Gy(RBE), and an ipsilateral lung volume of <20% receiving 20 Gy(RBE). The contralateral lung and breast dose is not designated with specific constraints for PBS, given the low overall exposure.
For VMAT, normal tissue constraints included a maximum esophageal dose of 40 Gy, a maximum thyroid dose of 50.4 Gy, a maximum mean heart dose of 5 Gy, the ipsilateral lung volume of <65% receiving 5 Gy and <30% receiving 20 Gy, and the contralateral breast volume of <5% receiving 10 Gy, and a mean contralateral breast dose maximum of 7 Gy. The contralateral lung is not designated with specific constraints.
For 3DCRT, normal tissue constraints include a maximum mean heart dose of 2.5 Gy and an ipsilateral lung volume of <35% receiving 20 Gy. For 3DCRT, we do not typically designate a maximum esophageal or thyroid dose as a traditional MAO field borders typically limit esophageal and thyroid exposure. We also do not typically designate a maximum contralateral breast or contralateral lung dose for 3DCRT as cardiac dose constraints typically limits contralateral organ exposure.
The planning process was homogeneous across patients. Please see Supplementary Material for more details.
Results
The three modalities considered in this study differ mainly in the distribution of dose in OARs and the total energy deposited in the patient (“integral dose”). Table 1 shows the average mean dose to the organ at risk and the correlation of the mean dose with LAR at an attained age of 70 (LAR70). The risks for the contralateral lung and contralateral breast scale very well with integral dose whereas the dose distribution combined with the patient’s age plays a bigger role for the other organs. The mean dose to the esophagus and the thyroid is lowest for 3DCRT. For the lungs, there is a clear advantage for PBS and a clear disadvantage for VMAT.
Table 1.
Average mean dose to different organs from different modalities for the patient cohort studied. Also shown is the linear correlation to LAR70 for carcinoma (using Table S3 (Schneider et al. parameters)/Table S4 (BEIR parameters), respectively).
| Average mean dose [Gy] 3DCRT | Average mean dose [Gy] VMAT | Average mean dose [Gy(RBE)] PBS | linear correlation (slope) of LAR70 as a function of mean dose | |
|---|---|---|---|---|
| Ipsilateral Lung | 11.86 | 13.57 | 8.22 | 0.45/0.44 |
| Contralateral Lung | 0.30 | 3.08 | 0.34 | 0.98/0.98 |
| Whole Lung | 5.80 | 8.22 | 4.17 | 0.67/0.67 |
| Esophagus | 2.18 | 9.50 | 10.91 | 0.77/0.80 |
| Thyroid | 9.15 | 21.21 | 19.72 | 0.01/0.24 |
| Contralateral breast | 0.52 | 5.16 | 0.40 | 0.89/0.86 |
Fig. 2 shows the LAR and EAR values for esophagus, thyroid, contralateral breast, ipsilateral lung, contralateral lung and whole lung using parameters from Table S3 (from Schneider et al. [36] and Santos et al. [13]). Curves for the parameter sets from Table S4 (from the BEIR VII report [29]) are not shown here as the two data sets show similar trends albeit different absolute values. This is shown in Tables 2 and 3 listing EAR and LAR at an attained age of 70 for both parameter sets. Values for LAR for lung and breast are very similar (within 20%) while LAR values for esophagus are a factor of two higher when using the BEIR parameters, which is mainly driven by EAR values predicted to be a factor of 10 higher for BEIR. For the ipsilateral and contralateral lung, the BEIR parameters predict an LAR 10% and 20% lower than with the Schneider parameter set, respectively.
Fig. 2.
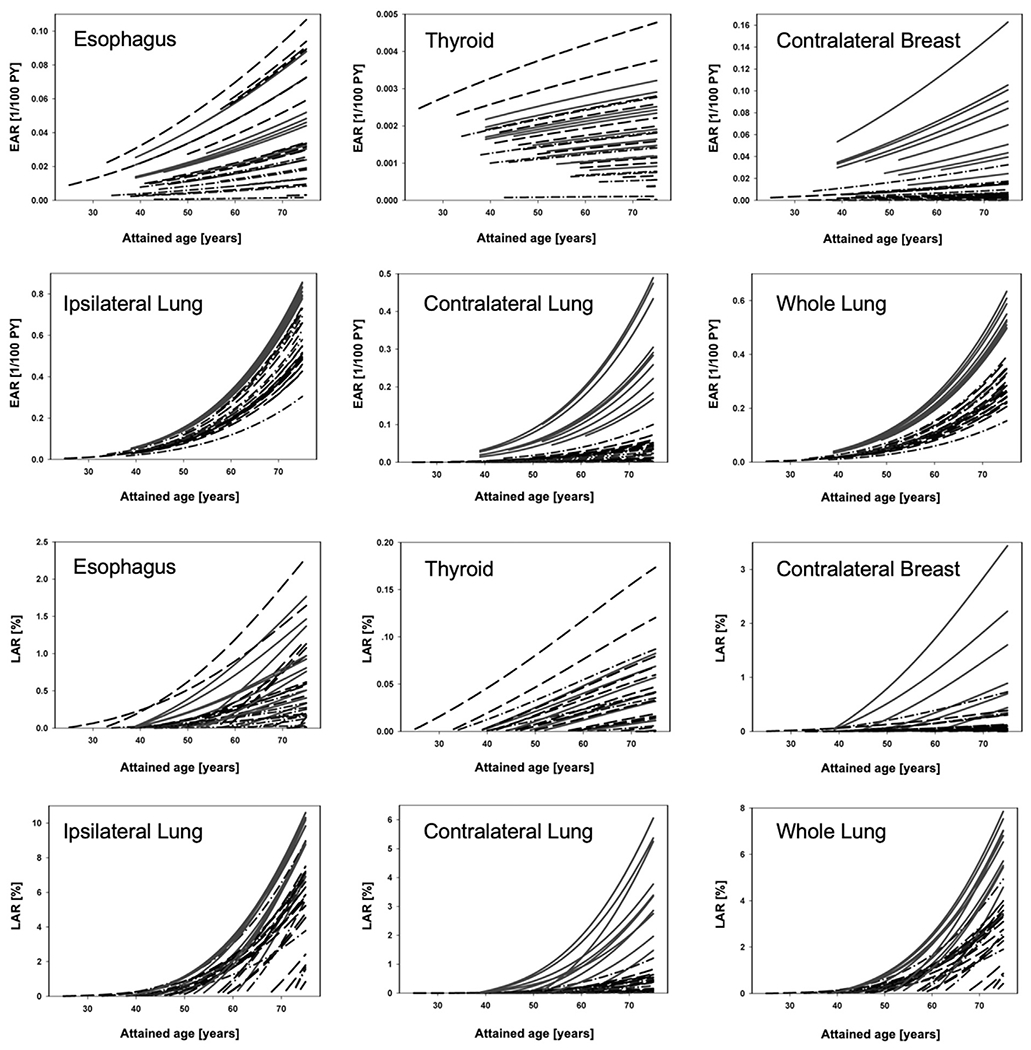
Upper panels: Excess absolute risk (EAR; carcinoma) for esophagus, thyroid, contralateral breast, ipsilateral lung, contralateral lung, and whole lung (right). Lower panels: Respective Lifetime attributable risk (LAR) as a function of attained age. The starting point for each curve is the patient’s age at the time of treatment plus a latency period of 5 years. Solid lines: VMAT; Dashed lines: PBS; Dashed-dotted lines: 3DCRT.
Table 2.
Average excess absolute risk for second carcinoma and sarcoma at age 70 and range in brackets for the patient cohort considered.
|
Table S3 parameters (Schneider et al.) |
Table S4 parameters (BEIR) |
|||||
|---|---|---|---|---|---|---|
| EAR70 [1/100 PY] 3DCRT | EAR70 [1/100 PY] VMAT | EAR70 [1/100 PY] PBS | EAR70 [1/100 PY] 3DCRT | EAR70 [1/100 PY] VMAT | EAR70 [1/100 PY] PBS | |
| CARCINOMA | ||||||
| Esophagus | 0.01 [0.0–0.03] | 0.05 [0.02–0.08] | 0.05 [0.01–0.09] | 0.10 [0.10–0.19] | 0.39 [0.18–0.65] | 0.44 [0.07–0.85] |
| Ipsilateral Lung | 0.46 [0.23–0.55] | 0.61 [0.58–0.64] | 0.39 [0.32–0.55] | 0.19 [0.10–0.24] | 0.26 [0.25–0.27] | 0.17 [0.13–0.24] |
| Contralateral Lung | 0.03 [0.0–0.08] | 0.23 [0.13–0.37] | 0.03 [0.00–0.05] | 0.01 [0.0–0.03] | 0.10 [0.01–0.16] | 0.01 [0.00–0.02] |
| Whole Lung | 0.23 [0.11–0.29] | 0.42 [0.37–0.47] | 0.20 [0.15–0.28] | 0.10 [0.05–0.13] | 0.18 [0.16–0.21] | 0.09 [0.07–0.12] |
| Thyroid | <0.005 | <0.005 | <0.005 | 0.04 [0.0–0.18] | 0.04 [0.0–0.14] | 0.10 [0.00–0.50] |
| Contralateral Breast | 0.01 [0.0–0.03] | 0.07 [0.02–0.14] | 0.01 [0.0–0.01] | 0.01 [0.0–0.01] | 0.04 [0.0–0.10] | <0.005 |
| SARCOMA | ||||||
| Esophagus | <0.005 | <0.005 | 0.01 [0.0–0.03] | <0.005 | 0.04 [0.0–0.14] | 0.07 [0.0–0.26] |
| Ipsilateral Lung | 0.16 [0.11–0.27] | 0.21 [0.19–0.22] | 0.13 [0.10–0.18] | 0.07 [0.05–0.12] | 0.09 [0.08–0.09] | 0.06 [0.04–0.09] |
| Contralateral Lung | <0.005 | 0.01 [0.0–0.04] | <0.005 | <0.005 | 0.01 [0.0–0.02] | <0.005 |
| Whole Lung | 0.08 [0.05–0.13] | 0.11 [0.09–0.13] | 0.07 [0.05–0.09] | 0.03 [0.02–0.06] | 0.05 [0.04–0.05] | 0.03 [0.02–0.04] |
| Thyroid | <0.005 | <0.005 | <0.005 | <0.005 | <0.005 | <0.005 |
| Contralateral Breast | <0.005 | <0.005 | <0.005 | <0.005 | <0.005 | <0.005 |
Table 3.
Lifetime attributable risk in % for secondary carcinoma and sarcoma at age 70 and range in brackets for the patient cohort considered.
|
Table S3 parameters (Schneider et al.) |
Table S4 parameters (BEIR) |
|||||
|---|---|---|---|---|---|---|
| £LAR70 3DCRT | £LAR70 VMAT | £LAR70 PBS | £LAR70 3DCRT | £LAR70 VMAT | £LAR70 PBS | |
| CARCINOMA | ||||||
| Esophagus | 0.18 [0.03–0.42] | 0.74 [0.22–1.45] | 0.70 [0.08–1.90] | 0.36 [0.05–0.79] | 1.46 [0.51–2.71] | 1.49 [0.20–3.64] |
| Ipsilateral Lung | 4.58 [2.75–6.54] | 6.56 [4.10–7.70] | 3.95 [0.82–5.23] | 3.92 [2.27–5.57] | 5.57 [3.73–6.37] | 3.50 [0.72–5.56] |
| Contralateral Lung | 0.28 [0.01–0.87] | 2.56 [0.87–4.40] | 0.26 [0.01–0.57] | 0.24 [0.01–0.73] | 2.16 [0.80–3.63] | 0.23 [0.01–0.49] |
| Whole Lung | 2.33 [1.38–3.60] | 4.49 [2.71–5.70] | 2.06 [0.44–2.78] | 2.01 [1.14–3.07] | 3.82 [2.47–4.80] | 1.83 [0.40–2.74] |
| Thyroid | 0.03 [0.00–0.08] | 0.04 [0.01–0.07] | 0.05 [0.00–0.16] | 0.05 [0.00–0.18] | 0.07 [0.01–0.11] | 0.10 [0.00–0.50] |
| Contralateral Breast | 0.18 [0.0–0.61] | 1.20 [0.28–2.84] | 0.09 [0.01–0.33] | 0.14 [0.0–0.55] | 0.92 [0.16–2.33] | 0.08 [0.0–0.35] |
| SARCOMA | ||||||
| Esophagus | <0.005 | 0.08 [0.0–0.32] | 0.12 [0.0–0.57] | <0.005 | 0.15 [0.01–0.60] | 0.25 [0.0–1.09] |
| Ipsilateral Lung | 1.61 [1.28–3.14] | 2.26 [1.55–2.55] | 1.32 [0.30–1.77] | 1.38 [1.07–2.67] | 1.92 [1.40–2.17] | 1.18 [0.27–1.85] |
| Contralateral Lung | <0.005 | 0.15 [0.02–0.44] | 0.02 [0.0–0.06] | <0.005 | 0.12 [0.02–0.36] | 0.02 [0.0–0.05] |
| Whole Lung | 0.77 [0.61–1.65] | 1.17 [0.89–1.42] | 0.66 [0.17–0.84] | 0.66 [0.55–1.40] | 0.99 [0.81–1.20] | 0.59 [0.15–0.89] |
| Thyroid | <0.005 | 0.01 [0.0–0.03] | 0.01 [0.00–0.05] | 0.01 [0.00–0.01] | 0.02 [0.01–0.06] | 0.03 [0.00–0.15] |
| Contralateral Breast | <0.005 | 0.02 [0.0–0.09] | <0.005 | <0.005 | 0.02 [0.0–0.07] | <0.005 |
Even though differences between modalities are driven also by differences in patient age, overall there is a clear disadvantage for VMAT mainly due to the higher mean dose. The LAR for VMAT reaches up to 11 and 6 per 100 patients per year in the ipsilateral and contralateral lung, respectively. The risk for the contralateral breast is also significantly higher when using VMAT. The risk for PBS is on average lower than for 3DCRT and VMAT for the lungs as well as contralateral breast. For the esophagus, 3DCRT shows an advantage even over PBS but the overall risk is quite low. The risk for sarcoma is overall lower than for carcinoma and negligible except for the ipsilateral lung where the LAR for sarcoma reaches about 1/3 of the carcinoma risk.
The range of values for the 34 patients in Tables 2 and 3 not only demonstrates differences between modalities but also patient specific differences due to age and dosimetric factors. To allow a one-to-one comparison we re-planned 10 of the PBS patients for 3DCRT and VMAT delivery carcinoma (Fig. S1 in the Supplementary Material shows average dose-volume histograms (DVH) for the 3DCRT, VMAT and PBS plans). We then calculated EAR, ERR and LAR values. Fig. 3 shows the ratios of LAR70 for the patients planned with all three modalities. For esophagus and thyroid 3DCRT offers an advantage over PBS while the risks are very similar between PBS and VMAT. For the ipsilateral lung an advantage is seen for PBS over both 3DCRT and VMAT. The most striking differences are for the contralateral lung and contralateral breast with a slight advantage of PBS over 3DCRT but a significantly higher risk compared to PBS when VMAT is used. The risk for the contralateral lung and breast using VMAT is on average about an order of magnitude higher compared to PBS.
Fig. 3.
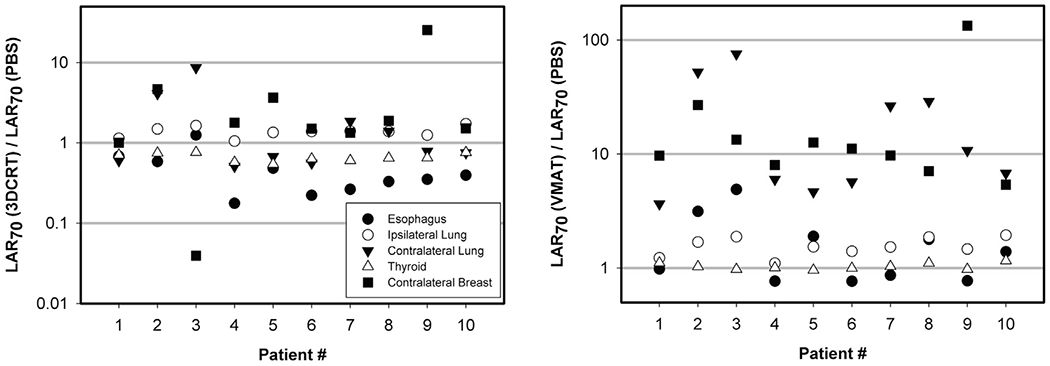
Ratio of LAR70 (carcinoma) for 3DCRT vs. PBS (left) and for VMAT vs. PBS (right).
Discussion
This dose modeling study was pragmatic in that it utilized patient treatment plans using different institutional constraints by modality. In order to minimize bias in the patient selection we not only retrospectively analyzed treatment plans from 3DCRT, VMAT and proton therapy patients but also compared treatment plans for all three modalities for the same cohort of patients. Both methods resulted in consistent findings regarding the relative differences between these three modalities with respect to secondary cancer risks.
One would expect varying degrees of both target coverage and dose to OAR across modalities for the same patient. The resulting secondary cancer risk estimates reflect modern planning constraints, but do not compare secondary cancer risks assuming the same degree of target coverage across modalities. It should be noted that further refinements to normal tissue constraints across treatment modalities could alter the estimates of secondary cancer risk modeled in this study. Furthermore, as in any treatment planning study, be it to simply compare dosimetric indices or risk indices, institutional guidelines as well as the experience of individual treatment planners can impact results. All patients considered in this study were planned and treated at the same institution under the same institutional guidelines and planned by experienced planners. However, we can’t rule out that other institutions or planners might have chosen different plan parameters. Furthermore, the plan quality certainly also depends on the treatment planning system, which could potentially impact secondary cancer risks. Nevertheless, we don’t expect our relative comparison between modalities and the drawn conclusions to be affected significantly.
This study focuses entirely on the risk for a secondary malignancy when comparing three modalities. This risk has to be interpreted in the context of other potential side effects as well as potential differences in tumor control [37,38]. This is beyond the scope of this study.
The dosimetric parameters used in the analysis assume a proton RBE of 1.1 based on current clinical practice. The RBE depends on physical as well as biological parameters and could potentially be higher especially at lower doses which would increase the risk from protons [39]. For the OED this increase could potentially be on the order of ~10–20%. Note that secondary radiation from neutrons is negligible in PBS [40].
One might expect large uncertainties in the model parameters and consequently the risk estimation. Quantification of these uncertainties is difficult as discussed in detail by Preston et al. [41]. The initial slope of the dose–response curve is obtained from the atomic bomb survivor data with uncertainties in terms of radiation field and location of the person during the incident. Furthermore, the high-dose risk parameters are mostly obtained from cancer incidences of Hodgkin’s patients, which might cause an overestimation of the risks. Shuryak et al. [42] have questioned their applicability in adult cancer induction estimates and concluded that excess relative risks for adults could be much higher compared to the risk after childhood irradiation. On the other hand, adults might have a negligible thyroid cancer risk after radiation therapy. Our results based on 2 different parameter sets provide some insight into potential modeling uncertainties. Furthermore, relative quantities when comparing proton versus photon radiations as done in this study will be associated with smaller uncertainties [43,44].
Only one previously published modeling study includes proton therapy [45]. Using the same formalism as used in this work (albeit with slightly different values for the high dose parameters α and R) the authors compare the risk for breast and lung cancer when treating breast cancer patients with VMAT and PBS. The results agree well with our results with EAR per 100-PY about one order of magnitude higher for VMAT than for PBS for contralateral structures (breast (0.1 versus 0.01); lung (0.14 versus 0.02)) and a factor of ~2 higher for the ipsilateral lung (0.35 versus 0.2). Also, our photon results agree well with other studies on photon techniques [7,8,10,11,13,46–49] (see Tables S6 and S7 in the Supplementary Material).
Doses were measured in anthropomorphic phantoms and then used in the BEIR formalism (with published parameters for esophagus [50]) by Hoekstra et al. [8]. The LAR values for women exposed at 40 were 0.04%, 0.03%, and 0.004% for thyroid using different photon radiation techniques (Whole Breast Irradiation, 3D conformal Accelerated Partial Breast Irradiation, VMAT). For the lung, the respective values were 3.69%, 2.09%, and 3.32%. For breast, LAR values of 0.52%, 0.08%, and 0.17%, respectively, were determined. Santos et al. [13] used the same formalism and model parameters as used in our study to estimate secondary cancer risk after different external beam photon breast radiation therapy. The LAR was between 0.20% and 0.54% for right sided and between 0.19% and 0.53% for left-sided targets for the contralateral lung. For the ipsilateral lung the ranges were 2.92% to 4.66% and 1.83% to 3.03%, respectively. For the contralateral breast and right-sided target, the LAR values were between 0.1% and 0.14% and for left sided target the risks were between 0.08% and 0.18%. Fogliata et al. [7] modeled the secondary cancer risk for breast and lung cancer after breast radiation therapy with VMAT using the same methodology as used in our study with model parameters based on Hodgkin’s patient cohorts deduced previously [51] from studies by Preston et al. [52], Travis et al. [53], Gilbert et al. [35] as well as Schneider et al. [28,31,36,54]. Accordingly, they determined EAR for contralateral breast cancer of 0.17, 0.02 and 0.08 per 100-PY for 3D-CRT, partial VMAT and full VMAT, respectively. For the contralateral lung, the EAR per 100-PY was estimated to be 0.01, 0.02 and 0.07, respectively. In another modeling study using the same formalism and parameters as in our work treatment plans for VMAT used to treat left breast carcinoma were evaluated [10]. 50 patients at around 50 years of age were assessed. The mean EAR values were 0.45, 0.11, for left lung and right lung, respectively, for IMRT treatments and 0.55, 0.30 for VMAT treatments in units of 1/100-PY. Respective values for contralateral breast were obtained as 0.05 and 0.14 for IMRT and VMAT, respectively. The BEIR VII model in combination with dosimetric measurements in phantoms were used by Donovan et al. [46] to assess the secondary cancer risk after 5 different photon treatment techniques. For an age at exposure of 40, the investigators determined LAR values between 0.02% and 0.04% for thyroid cancer, between 0.07% and 1.09% for contralateral lung, between 0.14% and 0.82% for contralateral breast, and between 0.02% and 0.41% for esophagus. Haciislamoglu et al. [47] also applied the OED formalism in combination with the EAR concept, using the same parameter set as used in our work. The EAR values were reported as 0.04 and 0.20 (contralateral breast), 0.04 and 0.22 (contralateral lung), 0.28 and 0.65 (ipsilateral lung), for 3DCRT and VMAT per 100-PY, respectively. Abo-Madyan et al. [11] reported EAR values for lung cancer as 0.27 and 0.31 per 100-PY for 3D-CRT and VMAT, respectively.
In summary, identifying the optimal treatment technique for each patient should incorporate consideration of cancer risks by patient age. Our methodology could be implemented to do so in routine planning. For our cohort, we conclude that 3DCRT leads to the lowest estimated risks of thyroid and esophageal secondary cancers while PBS demonstrated a benefit for secondary lung and breast cancer risks, with the highest secondary cancer risks overall associated with VMAT techniques. The risk values shown with VMAT were concerning and therefore VMAT plans should attempt to constrain dose to the lungs as much as possible.
Supplementary Material
Funding
The work was in part funded by NCI U19 CA-21239.
Footnotes
Conflict of interest
The authors have no conflicts of interest.
Appendix A. Supplementary data
Supplementary data to this article can be found online at https://doi.org/10.1016/j.radonc.2020.05.035.
References
- [1].Chowdhary M, Lee A, Gao S, Wang D, Barry PN, Diaz R, et al. Is proton therapy a “Pro” for breast cancer? A comparison of proton vs. non-proton radiotherapy using the National Cancer Database. Front Oncol 2018;8:678. [DOI] [PMC free article] [PubMed] [Google Scholar]
- [2].Teichman SL, Do S, Lum S, Teichman TS, Preston W, Cochran SE, et al. Improved long-term patient-reported health and well-being outcomes of early-stage breast cancer treated with partial breast proton therapy. Cancer Med 2018;7(12):6064–76. [DOI] [PMC free article] [PubMed] [Google Scholar]
- [3].Hug EB. Proton therapy for primary breast cancer. Breast Care (Basel) 2018;13(3):168–72. [DOI] [PMC free article] [PubMed] [Google Scholar]
- [4].Lomax AJ, Cella L, Weber D, Kurtz JM, Miralbell R. Potential role of intensity-modulated photons and protons in the treatment of the breast and regional nodes. Int J Radiat Oncol Biol Phys 2003;55:785–92. [DOI] [PubMed] [Google Scholar]
- [5].Jimenez RB, Goma C, Nyamwanda J, Kooy HM, Halabi T, Napolitano BN, et al. Intensity modulated proton therapy for postmastectomy radiation of bilateral implant reconstructed breasts: a treatment planning study. Radiother Oncol 2013;107(2):213–7. [DOI] [PubMed] [Google Scholar]
- [6].Depauw N, Batin E, Daartz J, Rosenfeld A, Adams J, Kooy H, et al. A novel approach to postmastectomy radiation therapy using scanned proton beams. Int J Radiat Oncol Biol Phys 2015;91(2):427–34. [DOI] [PubMed] [Google Scholar]
- [7].Fogliata A, De Rose F, Franceschini D, Stravato A, Seppala J, Scorsetti M, et al. Critical appraisal of the risk of secondary cancer induction from breast radiation therapy with volumetric modulated arc therapy relative to 3D conformal therapy. Int J Radiat Oncol Biol Phys 2018;100(3):785–93. [DOI] [PubMed] [Google Scholar]
- [8].Hoekstra N, Fleury E, Merino Lara TR, van der Baan P, Bahnerth A, Struik G, et al. Long-term risks of secondary cancer for various whole and partial breast irradiation techniques. Radiother Oncol 2018;128(3):428–33. [DOI] [PubMed] [Google Scholar]
- [9].Inskip PD, Stovall M, Flannery JT. Lung cancer risk and radiation dose among women treated for breast cancer. J Natl Cancer Inst 1994;86:983–8. [DOI] [PubMed] [Google Scholar]
- [10].Sakthivel V, Kadirampatti Mani G, Mani S, Boopathy R, Selvaraj J. Estimating second malignancy risk in intensity-modulated radiotherapy and volumetric-modulated arc therapy using a mechanistic radiobiological model in radiotherapy for carcinoma of left breast. J Med Phys 2017;42(4):234–40. [DOI] [PMC free article] [PubMed] [Google Scholar]
- [11].Abo-Madyan Y, Aziz MH, Aly MM, Schneider F, Sperk E, Clausen S, et al. Second cancer risk after 3D-CRT, IMRT and VMAT for breast cancer. Radiother Oncol 2014;110(3):471–6. [DOI] [PubMed] [Google Scholar]
- [12].Taylor C, Correa C, Duane FK, Aznar MC, Anderson SJ, Bergh J, et al. Estimating the risks of breast cancer radiotherapy: evidence from modern radiation doses to the lungs and heart and from previous randomized trials. J Clin Oncol 2017;35(15):1641–9. [DOI] [PMC free article] [PubMed] [Google Scholar]
- [13].Santos AM, Marcu LG, Wong CM, Bezak E. Risk estimation of second primary cancers after breast radiotherapy. Acta Oncol 2016;55(11):1331–7. [DOI] [PubMed] [Google Scholar]
- [14].Johansen S, Cozzi L, Olsen DR. A planning comparison of dose patterns in organs at risk and predicted risk for radiation induced malignancy in the contralateral breast following radiation therapy of primary breast using conventional, IMRT and volumetric modulated arc treatment techniques. Acta Oncol 2009;48(4):495–503. [DOI] [PubMed] [Google Scholar]
- [15].Kirova YM, De Rycke Y, Gambotti L, Pierga JY, Asselain B, Fourquet A, Institut Curie Breast Cancer Study G. Second malignancies after breast cancer: the impact of different treatment modalities. Br J Cancer 2008;98(5):870–4. [DOI] [PMC free article] [PubMed] [Google Scholar]
- [16].Kaufman EL, Jacobson JS, Hershman DL, Desai M, Neugut AI. Effect of breast cancer radiotherapy and cigarette smoking on risk of second primary lung cancer. J Clin Oncol 2008;26(3):392–8. [DOI] [PubMed] [Google Scholar]
- [17].Grantzau T, Thomsen MS, Vaeth M, Overgaard J. Risk of second primary lung cancer in women after radiotherapy for breast cancer. Radiother Oncol 2014;111(3):366–73. [DOI] [PubMed] [Google Scholar]
- [18].Grantzau T, Mellemkjaer L, Overgaard J. Second primary cancers after adjuvant radiotherapy in early breast cancer patients: a national population based study under the Danish Breast Cancer Cooperative Group (DBCG). Radiother Oncol 2013;106(1):42–9. [DOI] [PubMed] [Google Scholar]
- [19].Berrington de Gonzalez A, Curtis RE, Gilbert E, Berg CD, Smith SA, Stovall M, et al. Second solid cancers after radiotherapy for breast cancer in SEER cancer registries. Br J Cancer 2010;102(1):220–6. [DOI] [PMC free article] [PubMed] [Google Scholar]
- [20].Grantzau T, Overgaard J. Risk of second non-breast cancer after radiotherapy for breast cancer: a systematic review and meta-analysis of 762,468 patients. Radiother Oncol 2015;114(1):56–65. [DOI] [PubMed] [Google Scholar]
- [21].Grantzau T, Overgaard J. Risk of second non-breast cancer among patients treated with and without postoperative radiotherapy for primary breast cancer: a systematic review and meta-analysis of population-based studies including 522,739 patients. Radiother Oncol 2016;121(3):402–13. [DOI] [PubMed] [Google Scholar]
- [22].Huang YJ, Huang tW, Lin FH, Chung CH, Tsao CH, Chien WC. Radiation therapy for invasive breast cancer increases the risk of second primary lung cancer: a nationwide population-based cohort analysis. J Thoracic Oncol 2017;12(5):782–90. [DOI] [PubMed] [Google Scholar]
- [23].Clarke M, Collins R, Darby S, Davies C, Elphinstone P, Evans V, et al. Effects of radiotherapy and of differences in the extent of surgery for early breast cancer on local recurrence and 15-year survival: an overview of the randomised trials. Lancet 2005;366(9503):2087–106. [DOI] [PubMed] [Google Scholar]
- [24].Morton LM, Gilbert ES, Hall P, Andersson M, Joensuu H, Vaalavirta L, et al. Risk of treatment-related esophageal cancer among breast cancer survivors. Ann Oncol 2012;23(12):3081–91. [DOI] [PMC free article] [PubMed] [Google Scholar]
- [25].Wang R, Yin Z, Liu L, Gao W, Li W, Shu Y, et al. Second primary lung cancer after breast cancer: a population-based study of 6,269 women. Front Oncol 2018;8:427. [DOI] [PMC free article] [PubMed] [Google Scholar]
- [26].Obedian E, Fischer DB, Haffty BG. Second malignancies after treatment of early-stage breast cancer: lumpectomy and radiation therapy versus mastectomy. J Clin Oncol 2000;18:2406–12. [DOI] [PubMed] [Google Scholar]
- [27].Preston DL, Pierce DA, Shimizu Y, Cullings HM, Fujita S, Funamoto S, et al. Effect of recent changes in atomic bomb survivor dosimetry on cancer mortality risk estimates. Radiat Res 2004;162:377–89. [DOI] [PubMed] [Google Scholar]
- [28].Schneider U, Walsh L. Cancer risk estimates from the combined Japanese A-bomb and Hodgkin cohorts for doses relevant to radiotherapy. Radiat Environ Biophys 2008;47(2):253–63. [DOI] [PubMed] [Google Scholar]
- [29].BEIR: Health risks from exposure to low levels of ionizing radiation, BEIR VII, Phase 2. National Research Council, National Academy of Science; 2006. [Google Scholar]
- [30].Schneider U, Kaser-Hotz B. Radiation risk estimates after radiotherapy: application of the organ equivalent dose concept to plateau dose-response relationships. Radiat Environ Biophys 2005;44(3):235–9. [DOI] [PubMed] [Google Scholar]
- [31].Schneider U, Kaser-Hotz B. A simple dose-response relationship for modeling secondary cancer incidence after radiotherapy. Z Med Phys 2005;15(1):31–7. [DOI] [PubMed] [Google Scholar]
- [32].Schneider U, Lomax A, Besserer J, Pemler P, Lombriser N, Kaser-Hotz B. The impact of dose escalation on secondary cancer risk after radiotherapy of prostate cancer. Int J Radiat Oncol Biol Phys 2007;68(3):892–7. [DOI] [PubMed] [Google Scholar]
- [33].Schneider U, Zwahlen D, Ross D, Kaser-Hotz B. Estimation of radiation-induced cancer from three-dimensional dose distributions: concept of organ equivalent dose. Int J Radiat Oncol Biol Phys 2005;61(5):1510–5. [DOI] [PubMed] [Google Scholar]
- [34].Schneider U, Sumila M, Robotka J. Site-specific dose-response relationships for cancer induction from the combined Japanese A-bomb and Hodgkin cohorts for doses relevant to radiotherapy. Theoretical Biol Med Model 2011. in press. [DOI] [PMC free article] [PubMed] [Google Scholar]
- [35].Gilbert ES, Stovall M, Gospodarowicz M, Van Leeuwen FE, Andersson M, Glimelius B, et al. Lung cancer after treatment for Hodgkin’s disease: focus on radiation effects. Radiat Res 2003;159(2):161–73. [DOI] [PubMed] [Google Scholar]
- [36].Schneider U, Sumila M, Robotka J. Site-specific dose-response relationships for cancer induction from the combined Japanese A-bomb and Hodgkin cohorts for doses relevant to radiotherapy. Theoretical Biol Med Model 2011;8:27. [DOI] [PMC free article] [PubMed] [Google Scholar]
- [37].Bekelman JE, Lu H, Pugh S, Baker K, Berg CD, de Gonzalez AB, et al. Pragmatic randomised clinical trial of proton versus photon therapy for patients with non-metastatic breast cancer: the Radiotherapy Comparative Effectiveness (RadComp) Consortium trial protocol. BMJ Open 2019;9(10):e025556. [DOI] [PMC free article] [PubMed] [Google Scholar]
- [38].Jimenez RB, Hick SB, Depauw N, Yeap BY, Batin E, Gadd MA, et al. A phase II study of proton beam therapy for breast cancer patients requiring regional nodal irradiation. J Clin Oncol 2019;37(30):2778–85. [DOI] [PMC free article] [PubMed] [Google Scholar]
- [39].Paganetti H Relative biological effectiveness (RBE) values for proton beam therapy. Variations as a function of biological endpoint, dose, and linear energy transfer. Phys Med Biol 2014;59(22):R419–472. [DOI] [PubMed] [Google Scholar]
- [40].Schneider U, Agosteo S, Pedroni E, Besserer J. Secondary neutron dose during proton therapy using spot scanning. Int J Radiat Oncol Biol Phys 2002;53(1):244–51. [DOI] [PubMed] [Google Scholar]
- [41].Preston RJ, Boice JD Jr, Brill AB, Chakraborty R, Conolly R, Hoffman FO, et al. Uncertainties in estimating health risks associated with exposure to ionising radiation. J Radiol Prot 2013;33(3):573–88. [DOI] [PubMed] [Google Scholar]
- [42].Shuryak I, Sachs RK, Brenner DJ. Cancer risks after radiation exposure in middle age. J Natl Cancer Inst 2010;102(21):1628–36. [DOI] [PMC free article] [PubMed] [Google Scholar]
- [43].Fontenot JD, Bloch C, Followill D, Titt U, Newhauser WD. Estimate of the uncertainties in the relative risk of secondary malignant neoplasms following proton therapy and intensity-modulated photon therapy. Phys Med Biol 2010;55(23):6987–98. [DOI] [PMC free article] [PubMed] [Google Scholar]
- [44].Nguyen J, Moteabbed M, Paganetti H. Assessment of uncertainties in radiation-induced cancer risk predictions at clinically relevant doses. Med Phys 2015;42(1):81–9. [DOI] [PMC free article] [PubMed] [Google Scholar]
- [45].De Rose F, Cozzi L, Meattini I, Fogliata A, Franceschini D, Franzese C, et al. The potential role of intensity-modulated proton therapy in the regional nodal irradiation of breast cancer: a treatment planning study. Clin Oncol (R Coll Radiol) 2020;32(1):26–34. [DOI] [PubMed] [Google Scholar]
- [46].Donovan EM, James H, Bonora M, Yarnold JR, Evans PM. Second cancer incidence risk estimates using BEIR VII models for standard and complex external beam radiotherapy for early breast cancer. Med Phys 2012;39(10):5814–24. [DOI] [PMC free article] [PubMed] [Google Scholar]
- [47].Haciislamoglu E, Cinar Y, Gurcan F, Canyilmaz E, Gungor G, Yoney A. Secondary cancer risk after whole-breast radiation therapy: field-in-field versus intensity modulated radiation therapy versus volumetric modulated arc therapy. Br J Radiol 2019;20190317. [DOI] [PMC free article] [PubMed] [Google Scholar]
- [48].Mazonakis M, Stratakis J, Lyraraki E, Damilakis J. Risk of contralateral breast and ipsilateral lung cancer induction from forward-planned IMRT for breast carcinoma. Phys Med 2019;60:44–9. [DOI] [PubMed] [Google Scholar]
- [49].Simonetto C, Rennau H, Remmele J, Sebb S, Kundrat P, Eidemuller M, et al. Exposure of remote organs and associated cancer risks from tangential and multi-field breast cancer radiotherapy. Strahlenther Onkol 2019;195(1):32–42. [DOI] [PubMed] [Google Scholar]
- [50].Berrington de Gonzalez A, Iulian Apostoaei A, Veiga LH, Rajaraman P, Thomas BA, Owen Hoffman F, et al. RadRAT: a radiation risk assessment tool for lifetime cancer risk projection. J Radiol Prot 2012;32(3):205–22. [DOI] [PMC free article] [PubMed] [Google Scholar]
- [51].Berrington de Gonzalez A, Gilbert E, Curtis R, Inskip P, Kleinerman R, Morton L, et al. Second solid cancers after radiation therapy: a systematic review of the epidemiologic studies of the radiation dose-response relationship. Int J Radiat Oncol Biol Phys 2013;86(2):224–33. [DOI] [PMC free article] [PubMed] [Google Scholar]
- [52].Preston DL, Ron E, Tokuoka S, Funamoto S, Nishi N, Soda M, et al. Solid cancer incidence in atomic bomb survivors: 1958–1998. Radiat Res 2007;168(1):1–64. [DOI] [PubMed] [Google Scholar]
- [53].Travis LB, Hill DA, Dores GM, Gospodarowicz M, van Leeuwen FE, Holowaty E, et al. Breast cancer following radiotherapy and chemotherapy among young women with Hodgkin disease. JAMA 2003;290(4):465–75. [DOI] [PubMed] [Google Scholar]
- [54].Schneider U, Sumila M, Robotka J, Gruber G, Mack A, Besserer J. Dose-response relationship for breast cancer induction at radiotherapy dose. Radiat Oncol 2011;6:67. [DOI] [PMC free article] [PubMed] [Google Scholar]
Associated Data
This section collects any data citations, data availability statements, or supplementary materials included in this article.