

Abstract
Bioluminescence is a fascinating natural phenomenon, wherein organisms produce light through specific biochemical reactions. Among these organisms, Renilla luciferase (RLuc) derived from the sea pansy Renilla reniformis is notable for its blue light emission and has potential applications in bioluminescent tagging. Our study focuses on RLuc8, a variant of RLuc with eight amino acid substitutions. Recent studies have shown that the luminescent emitter coelenteramide can adopt multiple protonation states, which may be influenced by nearby residues at the enzyme’s active site, demonstrating a complex interplay between protein structure and bioluminescence. Herein, using the quantum mechanical consistent force field method and the semimacroscopic protein dipole-Langevin dipole method with linear response approximation, we show that the phenolate state of coelenteramide in RLuc8 is the primary light-emitting species in agreement with experimental results. Our calculations also suggest that the proton transfer (PT) from neutral coelenteramide to Asp162 plays a crucial role in the bioluminescence process. Additionally, we reproduced the observed emission maximum for the amide anion in RLuc8-D120A and the pyrazine anion in the presence of a Na+ counterion in RLuc8-D162A, suggesting that these are the primary emitters. Furthermore, our calculations on the neutral emitter in the engineered AncFT-D160A enzyme, structurally akin to RLuc8-D162A but with a considerably blue-shifted emission peak, aligned with the observed data, possibly explaining the variance in emission peaks. Overall, this study demonstrates an effective approach to investigate chromophores’ bimolecular states while incorporating the PT process in emission spectra calculations, contributing valuable insights for future studies of PT in photoproteins.
Graphical Abstract
1. INTRODUCTION
Bioluminescence is a remarkable phenomenon in which living organisms emit light as a result of a specific biochemical reaction. In recent years, bioluminescent proteins have garnered considerable attention owing to their potential applications in a variety of fields, including biosensors, biothreat assessment, and, notably, as a sought-after reporter gene to observe gene expression, promoter activity, and post-translational regulation assays as well as in the realm of protein engineering.1–6 Organisms with bioluminescence properties produce light through the oxidation of a substrate known as luciferin, a reaction that is catalyzed by a specific class of enzymes referred to as luciferases.2,7 Among the array of bioluminescent proteins, Renilla luciferase (RLuc) is particularly appropriate for its applications as bioluminescent tags.2 Unlike other bioluminescent proteins that depend on ATP, these enzymes function without ATP reliance. Instead, they require only the substrate and molecular oxygen, setting them apart in the field of bioluminescence. This 36 kDa enzyme, derived from the sea pansy Renilla reniformis, catalyzes the oxidation of the substrate coelenterazine, an aromatic compound specifically characterized as 2-(-hydroxybenzyl)-6-(-hydroxyphenyl)-8-benzylimidazo(1,2-a)pyrazine-3-(7H)-one. During the catalytic process, the substrate undergoes oxidative decarboxylation reaction, which results in the opening of the imidazole ring. This step initiates the release of carbon dioxide and the production of coelenteramide in the first singlet excited state . The return of coelenteramide to the ground state triggers the release of blue light, a phenomenon known as bioluminescence8–11 (see Scheme 1).
Scheme 1. Bioluminescence and Chemiluminescence Path Showing Coelenteramide Light Emitter in Different Protonation Statesa.

aThe asterisk indicates molecule in the excited state (ES). The final product is relaxed to the ground state (GS) with the emission of light (hv).
Several bioluminescent proteins utilize coelenterazine as a substrate, and high-resolution crystal structures have been determined for calcium-stimulated photoproteins like aequorin and obelin.12–16 Within these proteins, coelenterazine, although not covalently attached, resides in a snug cavity. It interacts with multiple residues that contribute to the efficiency of light emission and the modulation of its color. Typically, coelenteramide, the light emitter, is thought to be deprotonated at the 6-para hydroxyphenyl group (forming a phenolate ion), a process likely facilitated by a neighboring histidine residue (His22).14,16,17 This results in the emission of blue light in the range of 470–490 nm. However, if the emitter remains protonated, it emits a photon of purple light (405 nm)13,16,17 Additionally, earlier studies by McCapra et al.18 and Shimomura et al.19 have also explored the possibility of the amide anion formed as a result of chemiluminescence20,21 as the potential emitter. Consequently, coelenteramide is believed to exist in various bimolecular states, distinguished by its protonation state (either neutral or anionic) and the specific site of deprotonation (either phenolate or amide ion). In the presence of alkali metals, coelenteramide can also adopt a pyrazine form, where the alkali metal acts as a counterion to the phenolate emitter, facilitating the formation of the pyrazine structure through resonance (vide infra).19
Since RLuc utilizes the same substrate as the aequorin and obelin proteins, produces identical products, and emits light with similar spectral characteristics, the reaction mechanisms are likely analogous. However, understanding the detailed catalytic mechanisms and spectral properties of RLuc has proven to be a significant challenge largely due to the scarce availability of structural data for substrate- and product-bound enzyme complexes. To address this issue, mutagenesis experiments were conducted to create mutants that are more conducive to crystallization. In one of the earlier investigations, Loening et al.22 determined the structure of a stabilized form of RLuc, which contains eight amino acid substitutions (RLuc8), both with and without the coelenteramide product bound. While the coelenteramide was found in one of these structures (PDB ID: 2PSJ), its location on the outer edge of the active site was interpreted as a nonproductive binding mode.23 Recently, Schenkmayerova et al.24 cocrystallized the coelenteramide-bound RLuc8 complex with a resolution of 1.9 Å (PDB ID: 6YN2) in the presence of excess of the substrate coelenterazine, providing biological relevant structural insights. In another recent study conducted by Schenkmayerova et al.,1 a crystal structure of the RLuc8-coelenteramide complex was obtained with a high resolution of 1.5 Å (PDB ID: 7OMR). The authors of this work carried out a detailed mechanistic study for this complex, taking into account multiple cocrystal structures of the stabilized AncFT surrogate enzyme and RLuc8 luciferases, given their structural similarities. This study was backed by mutagenesis, experimental approaches, and molecular dynamics (MD) studies. Furthermore, they assigned the bioluminescence states of the coelenteramide emitter in RLuc8 and its mutants, which are the main focus of our work.
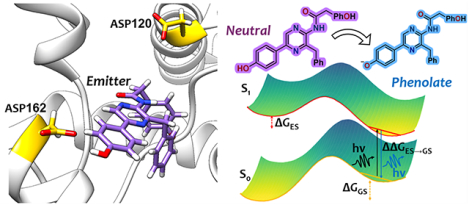
In a study by Schenkmayerova et al.,11 the phenolate form of coelenteramide was identified as a potential emitter in RLuc8. This emission is hypothesized to be attributed to the deprotonation of the R2 6-(p-hydroxyphenyl) substituent, influenced by the nearby aspartic acid D162, which is only 2.9 Å from the catalyst (see Figure 1). On the other hand, the RLuc8-D162A and RLuc8-D120A mutants see the pyrazine and amide ion as light emitters, as shown in Scheme 1. This latter finding corroborates earlier research by Shimomura and Teranishi,20 who investigated the luminescence of various biomolecular states of coelenteramide in different solvent polarities and in the absence of the protein environment. While the X-ray crystallography method used in the above study has provided insights into the luminescence mechanism, it is crucial to understand the molecular details associated with the luminescent reaction. This is because X-ray crystallography captures either a single spatial structure or, in the presence of defects, an average of different conformations at a specific moment in time. In particular, the previous studies did not explore the relationship between the proton transfer (PT) coordinate and the emission spectra.
Figure 1.

Schematic representation of RLuc8 with coelenteramide as the emitter, and nearby Asp162, and Asp120 residues are in sticks.
In this study, we explore the various biomolecular states of coelenteramide in RLuc8 and its variants, along with their corresponding emission spectra. Furthermore, we examine the emission spectra that occur during the PT process, which facilitates the transition of the chromophore from a neutral state to an ionic state in RLuc8. Utilizing the quantum mechanical consistent force field (QCFF/PI) along with the semimacroscopic protein dipole-Langevin dipole (PDLD/S) method, combined with the linear response approximation (LRA), our findings affirm the significance of the phenolate and pyrazine states of coelenteramide in RLuc8 and its D162A mutant. These states, resulting from PTs of a neutral emitter to D162 and the presence of a counterion, respectively, are pivotal for consistent bioluminescence emission energy. Notably, our computed emission wavelength for the amide ion in D120A matches closely with experimental results. Additionally, our approach offers a robust mechanism for integrating the energetics of PT in bioluminescence reactions. This is done by determining the free energy of the reaction landscape by assessing the differences of the donor—acceptor PT process in both ES and GS using the PDLD/S-LRA method (see Sections 2.2 and 3). This deprotonation energy is then added to the emission spectra derived from QCFF/PI (see Section 2.1). This combined approach proves to be the most effective in studying the bioluminescence process that involves PT.
2. COMPUTATIONAL METHODS
2.1. QCFF/PI Method.
Understanding the bioluminescence process of the chromophore in a protein environment requires a reliable quantum mechanics/molecular mechanics (QM/MM) model to accurately map the ES potential energy surface. While high-level ab initio calculations have been applied to study the spectroscopic properties of the coelenteramide emitter in the absence of a protein environment, their application to studying RLuc8 with various protonation states of the emitter requires immense computational resources. A pragmatic approach is using a QM/MM variant of the semiempirical QCFF/PI method25–27 developed in our group, which we utilized in our prior studies. For our current study, we leveraged the QCFF/PI quantum mechanical potential surface26,28,29 combined with the protein force field of the ENZYMIX program interfaced in the MOLARIS-XG software suite.30 Our previous study has shown the success of this method, which integrates ENZYMIX31 and QCFF/PI, to investigate conjugated molecules in solutions or in the presence of a protein environment. An overview of our potential surface and simulation methodologies is provided below. For a deeper understanding of the QCFF/PI method, the readers are referred to the specified refs 26–28 and 32.
The combined QM/MM potential surface for the emitter’s th electronic ES within its protein active site is expressed as follows
| (1) |
where S and s denote the “solute”, the emitter, and the “solvent”, respectively. The “solvent” which involves in our case is the protein and its internal and surrounding water molecules. The -electron contribution to the emitter’s ES is represented by , while is the -electron contribution to the chromophore surface. is the potential that couples the protein (solvent) and the chromophore and is the protein force field of the protein and solvent system. The surfaces and are derived by using the QCFF/PI method, which employs the zero differential overlap approximation. This approximation sets and to zero for under the Pariser−Parr−Pople approximation. This method assumes a separation between and electrons in , while is represented by an empirical force field. This approach makes the computational process more practical, facilitating the modeling of conjugated heteroatomic molecules in both ground and excited states by theoretically disentangling and electrons. The QCFF/PI method is well documented and widely available.32 It has been used extensively in studies of retinal and related systems28,33,34 and is more efficient than QM/MM approaches. In this study, all coelenteramide atoms are included within the QM region. The QM treatment involves a configuration interaction treatment of all the single excitations for the three highest occupied orbitals and the three lowest unoccupied orbitals. The full parameters for our systems used are those from our earlier study.26
The coupling potential between the solute and the solvent, denoted as , is derived using the method presented in detail in our prior studies.34,35 This integration involves including the electrostatic potential from the solvent (or protein) to the solute Hamiltonian, as explained in ref 34, using
| (2) |
Here, is the corresponding element of the solute’s SCF matrix and spans over the solvent atoms. and represent the residual charge and induced dipole on the th atom of the solvent. Overall, the second term in captures the potential on the th atom from its environment. The induced dipoles are determined self-consistently and are an important part of our treatment. The solute charges are computed at each MD step with the current vector components, mirroring the solvent setup. Concurrently, the solvent molecules respond at each step to the solute charges in the electronic state whose surface drives the given MD simulation. The approach for handling the solvent and protein-induced dipoles in ES calculations is modeled on the procedure from eq 17 in ref 34. Within this framework, we let the solvent’s permanent and induced dipoles adapt to the charge distribution of the considered electronic state. It is important to highlight that no existing QM/MM method offers a completely consistent way of polarizing the solvent across every ES, as discussed in ref 34. A perturbation approach, though suitable under certain conditions (refer to the appendix in ref 34), does not yield results matching those from eq 17 in ref 34. In the latter, induced dipoles are polarized distinctively in each electronic state. Regardless, our approach to solvent-induced dipoles gives a more nuanced depiction of ESs within proteins and solutions.
The interaction term between the solute and the solvent in eq 2 encompasses the classical van der Waals interactions between solute and solvent atoms. The potentials of the combined protein and solvent, , are characterized by the ENZYMIX force field. This includes the polarization constraints from the surface-constrained all-atom solvent (SCAAS) model31,36 and the local reaction field approach for long-range interactions.37 The reference system was immersed in an SCAAS sphere with an 18 Å radius to solvate the system. The surface-constrained water sphere was surrounded by a 2 Å surface of Langevin dipoles and then by a bulk. The nitrogen atom in the chromophore’s amide functional group was taken as the center of the water sphere.
Furthermore, to ensure accurate mapping of the ES potential energy surface in the emission spectra calculations, we supplemented our approach with reference time-dependent density functional theory (TD-DFT) calculations for the chromophore in a water environment. We then adjusted the QCFF/PI emission spectra calculated within the protein environment by incorporating any differences observed between our QCFF/PI and the relative TD-DFT emission wavelength in the water environment. The adjustment is quantified as follows
| (3) |
In this equation, represents the total emission spectrum in the protein environment. is the emission spectrum calculated within the protein environment using the QCFF/PI method. and are the emission wavelengths calculated in water using the QCFF/PI and TD-DFT methods, respectively.
The ionization states of the protein residues were determined using the PDLD/S-LRA titration method (see Section 2.2 for details) for RLuc8 and its variants. Starting with the high-resolution X-ray structure of ref 11 (PDB ID: 7OMR), we conducted an overall 200 ps relaxation run in the GS by slowly heating the system from 5 to 300 K. The same relaxation protocol was applied to other mutants. Following the relaxation runs, we performed QCFF/PI MD simulations, consisting of 20,000 MD steps with a time step of 0.5 fs, at a temperature of 300 K. QCFF/PI excitation energies were recorded for both an isolated chromophore and a chromophore polarized by MM charges. The collected data points (2000 values) were sorted into 20 bins, ranging from the lowest to highest encountered wavelength. The intensity was then calculated as the fraction of hits per bin, normalized to the total number of samples. Notably, our benchmark analysis with longer MD steps yielded similar excitation energies, indicating convergence in the emission energy during the production run (Supporting Information).
The GS and ES charges of the chromophore used in our QCFF/PI calculations were determined using the DFT method (detailed further in Section 2.3). Following this, we employed antechamber to obtain the restrained electrostatic potential (RESP) charges used in the calculations for the QM region.
2.2. PDLD/S-LRA Method.
The term ionization configuration (IC) is defined as the most favored combination of protonation states of ionizable residues in a protein at a certain pH. It is crucial to have a knowledge of the protonation states of the residues around the emitter as it can significantly influence the spectroscopic properties of the emitter. The IC of the studied enzyme-emitter complexes was obtained by calculations using the PDLD method within the LRA framework.38 of the ionizable residue in protein can be calculated by eq 4
| (4) |
where refers to intrinsic of the residue, while all the other residues are kept neutral, and refers to the change of the residue due to the interaction with other ionizable residues. The intrinsic of the residue can be represented as eq 5
| (5) |
where refers to of the th residue in water, refers to the charge of the residue in its ionized form (+1 for the cation, −1 for the anion), and represents the solvation free energy change by moving the charged form of the th amino acid residue from water to its position in the protein when all other amino acids are neutral. This free energy change was calculated using the PDLD method. The second term in eq 4 can be obtained by eq 6
| (6) |
where refers to electrostatic interactions between the th amino acid in the ionized form and all other amino acids when they are assigned to be charged, as determined by the titration PDLD calculation. This correction is necessary because the intrinsic deviates from the actual by how the solvation of the amino acid is influenced by the presence of all other ionized residues in the protein at a given pH. The total energetics of the combination of the protonation state can be expressed by eq 7
| (7) |
where denotes the free energy change of the protein transitioning from a hypothetical reference state, where all amino acids are neutral, to the ionization state. The free energy change across various ionization states was determined using the Monte Carlo method. These calculations contribute to constructing the partition function and enable the determination of ensemble-averaged charges for each ionizable residue. It is important to note that this free energy change considers only electrostatic contributions, as other effects are accounted for within the intrinsic values included in the initial summation. The and terms refer to the th and th charges in the th charge configuration of the protein, refers to the distance between the centers of the th and th residues, and is the effective dielectric constant defined as eq 8
| (8) |
Equation 7 can be used to calculate the partition function of the protein system and hence the average charge of th residue as shown in eq 9
| (9) |
The average charge of all ionizable residues at certain pH values is a good description of IC of a protein. To make the calculation practical and reliable, only ionizable residues within 15 Å of the binding pocket were included in the search for combinations of protonation states of the protein. In the calculation of the total energetics, intrinsic of the most ionizable residues were assumed to be equal to their in water. For ionizable residue clusters containing Asp120, Asp158, and Asp162, intrinsic calculations were done when the emitter was in the neutral form and applied to the following average charge calculations. The reference values for the aspartate residue and various states of the emitter in water, in both GS and ES, essential for PDLD/S-LRA calculations within the enzyme−emitter complex, were derived from DFT calculations, as outlined in Section 2.3.
The PT mechanism involved in the bioluminescence process was obtained by calculations using the PDLD method. The calculations for specific PT donor−acceptor pairs should be considered together, which means in most of the calculations, of the residue was calculated, while the emitter was in the neutral form. The exception was the PT process for RLuc8, in which (Asp162) was calculated, while the emitter is in the charged phenolate form. In these calculations, the corresponding IC was used because the protonation states of nearby residues can affect of interest significantly. In each calculation, the value was obtained by averaging over 10 configurations sampled over 2 ps MD simulation with a 0.1 fs time step at 300 K and a constraint with respect to the corresponding initial structure.
2.3. DFT Calculations.
For the reference in water (the first term in eq 5), we utilized DFT to determine of the ionizable group in the emitter and the acid species in both the ground and first excited singlet states using eq 10 shown below. For the GS, all geometries, whether in the gas or solvent phase, were optimized using the CAM-B3LYP39/Def2-SVP level of theory. TD-CAM-B3LYP was employed for optimizing the first ES and calculating the emission energies of the first three singlet ESs ( states = 3). The SMD solvation model40 was applied for solvent phase calculations, and the GD3BJ method41 was used for dispersion correction. Electronic and thermal energies, calculated at 298.15 K, were determined by using standard statistical thermodynamic methods, incorporating unscaled frequencies and the ideal gas, rigid rotor, and harmonic oscillator approximations. The Gaussian 16 software suite42 was used to carry out all electronic structure calculations. The charges of the chromophore in the GS and ES used in PDLD and QCFF/PI calculations were obtained using the DFT method described above. From the resulting charges, we generated the RESP-fitted charges43–45 using AmberTools17.46
Using the thermodynamic cycle (see Figure S1 in the Supporting Information), the free energy of deprotonation for the acid species in the solution, given by , can be calculated using
| (10) |
and the corresponding is given by
| (11) |
The concentration of bulk water is taken as 55.4 M. It has been shown that a potential source of error in eq 10 is the solvation free energy of hydronium. To address this, a value of 4.5447 is subtracted from derived from eq 11.
The DFT-calculated values for the ionizable amide, phenol, and acetic acid (which serves as a truncated model for aspartic acid) in both the GS and ES are presented in Table S4 of the Supporting Information
3. RESULTS AND DISCUSSION
In our study, we utilized the high-resolution X-ray structure of RLuc8 (PDB ID: 7OMR), which was complexed with the coelenteramide chromophore, to perform a QCFF/PI MD simulation on the first excited singlet-state surface. It is important to note that in the X-ray crystal structure of RLuc8, the residue at position 162 is an alanine, resulting from a mutation of the native aspartate (referred to as RLuc8-D162A). Given that the emission spectra for the phenolate forms of the emitter have been experimentally reported in RLuc8, we reverted this alanine to its original aspartate (Asp) using a rotamer library within the Chimera software suite. Prior to analyzing the emission spectra of the studied systems, we first rigorously examined the ionization states of the protein residues.
3.1. Emission Energy of the Phenolate Anion.
We began by identifying the ionizable protein residues in the proximity of the chromophore in its phenolate form within 15 Å, calculating their ionization states by employing the PDLD/S-LRA method. At a pH of 7, our calculations revealed 11 ionized residues that are depicted in Figure 2. Ion pairs within the protein were ionized, while distant residues remained neutral. It is crucial to mention that for the phenolate form of the emitter in RLuc8, the proximate Asp162 residue is presumed to be protonated. This is under the assumption of a PT between them on the first ES surface, given that the distance between the oxygen atom of the 6-para hydroxyphenyl group of the emitter and the protonated Asp162 residue is 2.9 Å. This close proximity suggests the likelihood of a PT process and is discussed below.
Figure 2.

Assignment of ionization states to nearby ionizable residues of the chromophore in the phenolate form in RLuc8 (PDB ID: 7OMR) at pH=7.
Upon establishing the ionization states, we proceeded with QM/MM MD simulations. Our calculated emission maximum for the phenolate form in RLuc8, after correcting for the water reference value using eq 3 (also refer to Table S6 for the reference emission wavelength in water), was determined to be 467 nm. This closely matches the experimentally observed value of 480 nm. Our calculated QCFF/PI vertical emission spectrum is depicted in Figure 3. Additionally, we examined the neutral chromophore while keeping Asp162 un-ionized. Our calculations using the QCFF/PI approach yielded an emission maximum of 383 nm. This finding is in good accordance with the reported emission maximum of neutral coelenteramide (400 nm) observed in other bioluminescent proteins such as -regulated photoprotein.14,16,17 However, this value is significantly different from that of the observed emission in RLuc8. This discrepancy, along with the good agreement between the experimental and calculated emission maxima of the phenolate anion, emphasizes the importance of the Asp162 protonation state. It strongly suggests that in RLuc8, the coelenteramide emitter exists in the phenolate form during its photochemical and photophysical processes.
Figure 3.

Calculated probability profiles for the emission spectra transition from the first excited singlet state to the GS. The profile was obtained by running trajectories on the ES surfaces of the phenolate as the emitter (when Asp162 is protonated) and evaluating the histograms of the calculated emission spectra.
3.2. PT Mechanism.
Using gas-phase TD-DFT calculations, we carried out a preliminary investigation to study the PT process using the neutral emitter and acetate as a model system. We computed the emission maximum at several fixed points along the PT reaction coordinate, which is defined by the transfer of a proton from the OH group of the phenolic fragment to the oxygen atom of the acetate (Figure 4). A significant red shift was observed as the neutral emitter is converted to the phenolate form, indicating that the deprotonation process has a considerable impact on the emission properties.
Figure 4.

TD-DFT calculated the emission maximum (nm) of the emitter transitioning from neutral to phenolate form at specific fixed points along the O–H bond breaking process.
Subsequently, we focused on evaluating the primary influence of the protein on the emission energy and the PT process between the neutral emitter and Asp162 by employing the PDLD/S-LRA method. This required a meticulous analysis of the PT process across both the GS and ES free energy surfaces and the integration of the free energy change between these surfaces into the QCFF/PI emission energy calculations, as illustrated in Figure 4. To delineate these free energy surfaces, we estimated the deprotonation free energy using the calculated values of the neutral emitter and Asp162 in the GS and the first excited singlet state , applying eq 12
| (12) |
In this equation, (HA)* and HA represent the phenolic – OH group of the neutral emitter in the ES and GS, respectively, while and denote the proton acceptor Asp162 in the GS and ES, correspondingly.
Our consensus PDLD/S-LRA -calculated values for the emitter and D162 at pH 7 in RLuc8 are 7.6 and 4.9, respectively, in the GS and −0.8 and 5.1 in the ES. Utilizing eq 12, this translates to reaction free energies of mol in the GS and −8.1 kcal in the ES, signifying that the PT reaction is energetically more favored in the ES. It should be noted that our analysis focuses solely on thermodynamic aspects, and the depicted barrier in Figure 5 serves an illustrative purpose only. Nevertheless, the PT process in the ES is typically associated with an energy barrier of a few kcal/mol, as observed in other bioluminescent proteins.48,49 To estimate the emission spectra during the PT reaction, we incorporated the free energy change into our calculated QCFF/PI emission maximum for the neutral emitter. This yielded an emission maximum of 455 nm, which is in reasonable agreement with the observed value of 480 nm and closely matches with our calculated emission maximum of 467 nm predicted for the phenolate ion, thus providing evidence of the ES PT process in RLuc8 and that the emitter exclusively is in a phenolate form.
Figure 5.

PT reaction profile in the ground and excited states. HA and represent ionizable groups of the emitter and proton acceptor (Aspartate in our case) in the GS. The asterisk sign indicates the species in the excited state . The PT process is based on the difference calculated using PDLD/S-LRA (see Section 2.2). The term here represents the PT correction that is added to the emission wavelength in eq 3. The -axis shows the IC of the protein environment, while the diagonal axis indicates the overall incorporation of the PT reaction coordinate during the bioluminescence process.
3.3. Emission Energy of the Amide Anion.
In the bioluminescence mechanism, the ES of the amide anion is an intermediate, as outlined in the proposed reaction pathway depicted in Scheme 1. The emission peak corresponding to this intermediate species is reported for the RLuc8-D120A mutant. Our PDLD titration calculations for this mutant revealed that the ionization states of the amino acids closely resemble those in RLuc8. However, notable exceptions include the neutral state of His142 and the ionized state of Asp162 (refer to Table S2 in the Supporting Information for full ICs). This suggests that preceding the transition of the amide ion to a neutral emitter via a PT process (see Scheme 1), Asp162 remains in its ionized form. The un-ionized state of His142 implies a more intricate network of PT processes potentially involving nearby residues or the bulk solvent, as the emitter transitions from the amide ion to the neutral or phenolate form.
Moving on to our findings for the emission energy of the RLuc8-D120A mutant, the calculated emission spectra (Figure 6) have a maximum at 456 nm. The position of this maximum represents a modest red shift of 26 nm, which aligns well with the experimentally observed value of 430 nm. Notably, our calculated value is consistent with the luminescence results obtained by Shimomura and Teranishi,19 who reported an emission maximum for the amide-deprotonated emitter in the range of 435–458 nm. The correlation between the calculated emission energy and the experimental data strongly suggests that the amide ion is the principal luminescent species in this mutant. This is attributed to the Asp120 position being unoccupied by aspartate, which precludes the usual PT, making the formation of neutral or phenolate emitter unfavorable.
Figure 6.
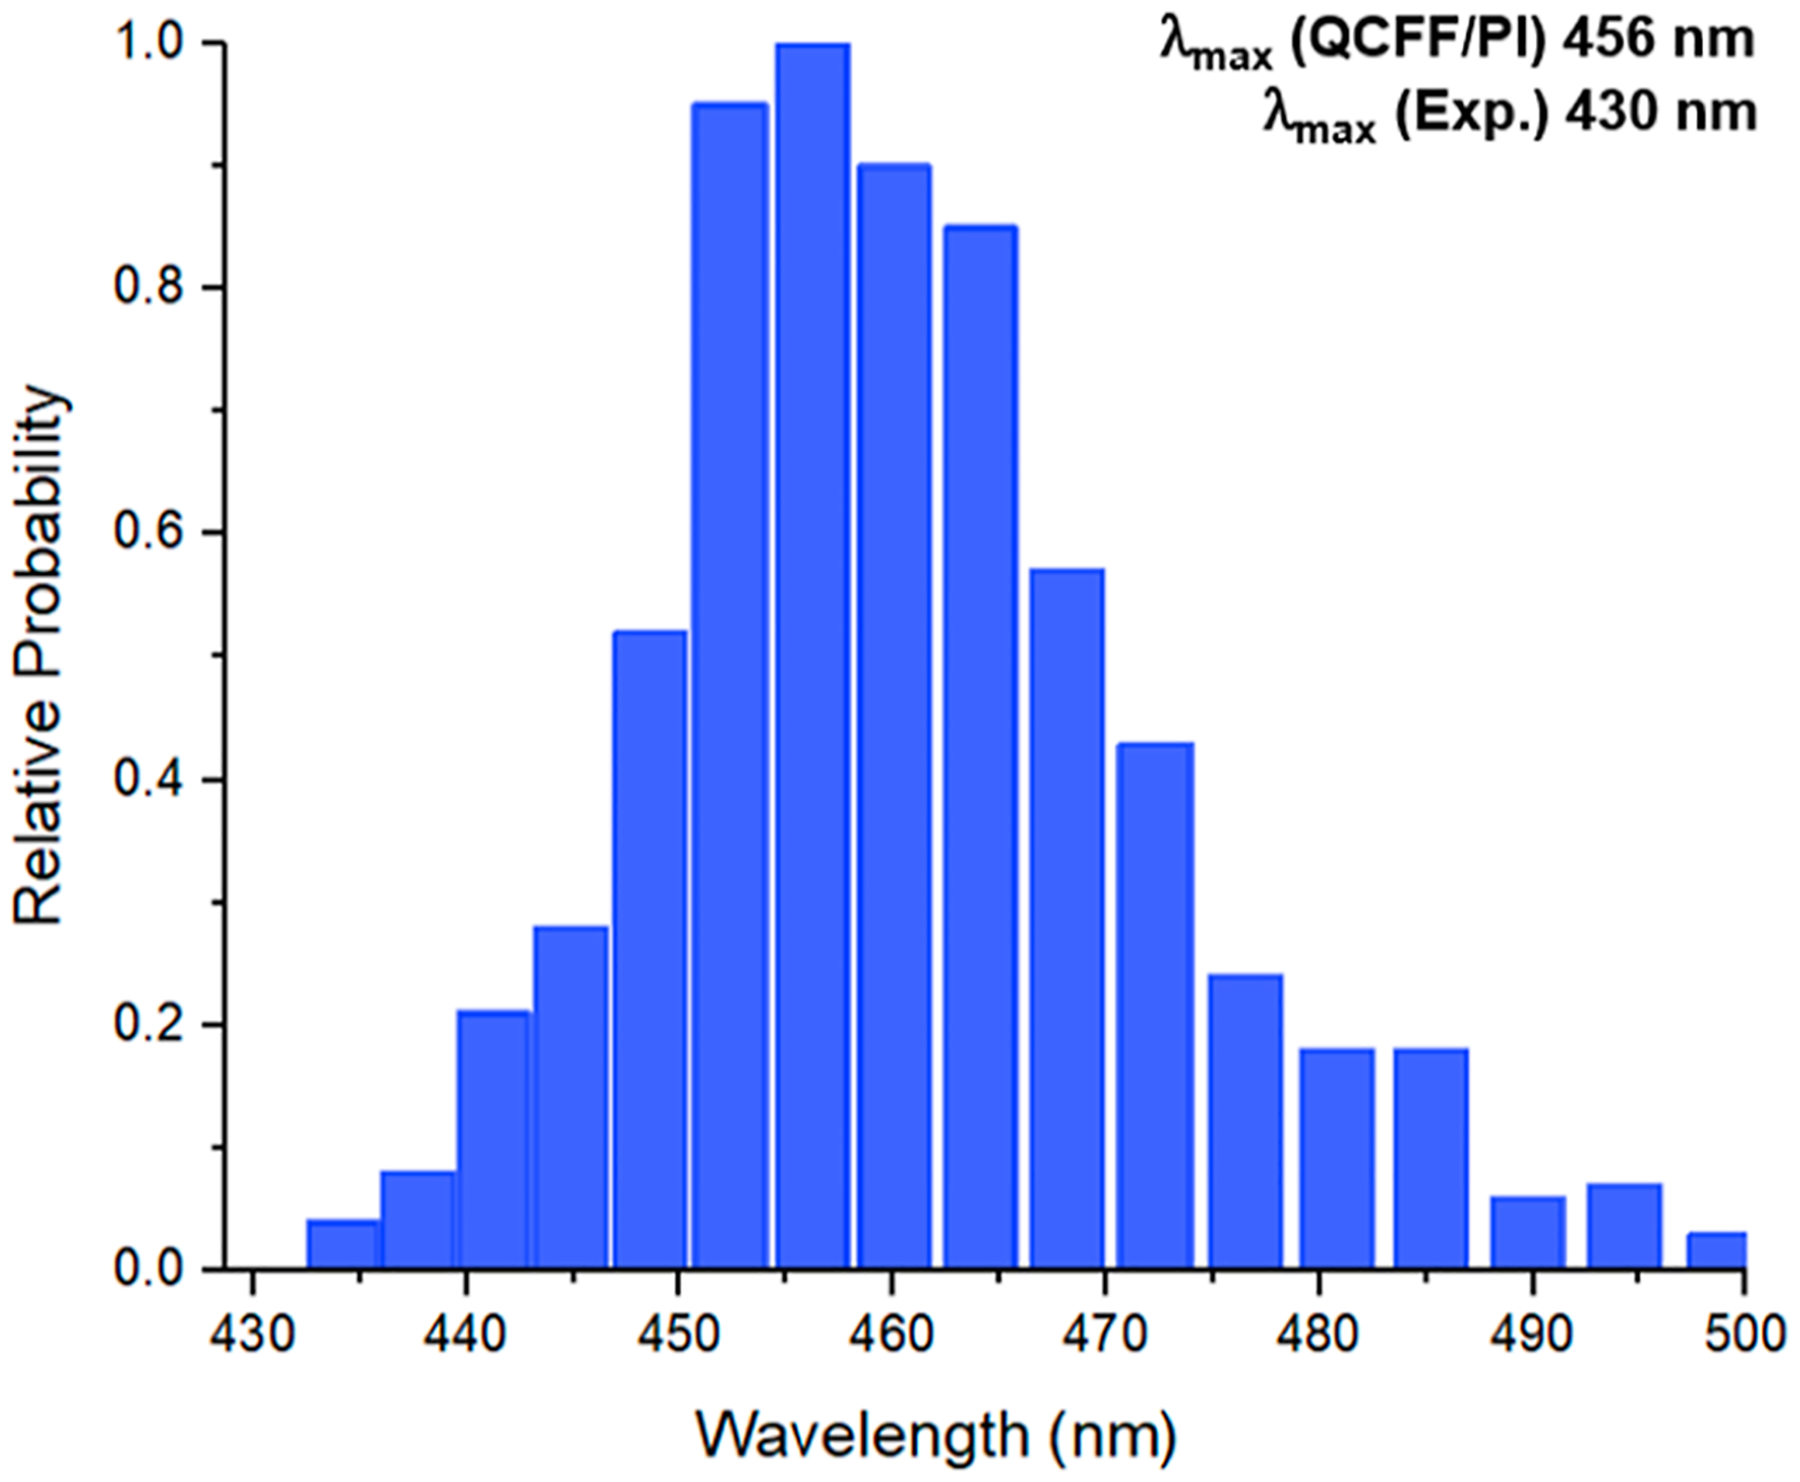
Calculated probability profiles for the emission from the first excited singlet state to the GS in RLuc8-D120A. The profile was obtained by running trajectories on the ES surfaces of the amide ion as an emitter and evaluating the histograms of the calculated emission spectra.
3.4. Emission Energy of the Pyrazine Anion.
We next explored the pyrazine anion as a potential emitter, as identified for RLuc8-D162A. Previous research by Shimomura and colleagues19 demonstrated that in various solvents and with alkali metals, the phenolate ion can transition to a pyrazine ion, a resonance structure of phenolate. However, this experiment was observed in the absence of a protein environment. In the recent study of RLuc8-D162A,11 the experiment was conducted in 100 mM potassium phosphate buffer, providing a high concentration of potassium ions, and therefore, the resonance structure of the phenolate emitter might form due to the presence of this alkali metal ion. The potassium ion thus acts as a counterion near the pyrazine ring, creating a polarized bond. This interaction subsequently leads to the phenolate oxygen transitioning to a keto form, a process driven by charge delocalization (refer to Scheme 2).
Scheme 2. Resonance Form between Phenolate and the Pyrazine Iona.

a For our system, we employed as a counter ion in the formation of the pyrazine anion.
We modeled the pyrazine ion with an explicit positioned 2.3 Å from the pyrazine ring’s nitrogen with a constraint of 3.0 kcal/mol/Å2 in RLuc8-D162A. This specific distance is based on the DFT-optimized geometry of the pyrazine ion in the first singlet ES in water. The formation of the pyrazine ion necessitates the deprotonation of the OH group, initially yielding a phenolate ion, which then undergoes resonance shifting to the pyrazine ion (as depicted in Scheme 2). Examining the X-ray crystal structure of RLuc8-D162A reveals that the nearest proton-accepting residue Asp158 is located 4.9 Å from the oxygen of the phenolic group of the emitter. This donor−acceptor gap is considerably lengthy for efficient PT, hinting at an unfavorable process. The deprotonation of the phenolic group could potentially occur to the bulk solvent or through a Grotthuss-type water-mediated PT involving the phenolic group of the emitter and Asp158. To assess the proposed hypothesis, we investigated the emission maximum of the pyrazine ion with Asp158 in both its protonated and unprotonated states.
In the RLuc8-D162A variant, when Asp158 is unprotonated, our calculated emission maximum for the pyrazine ion is 552 nm. Conversely, when Asp158 is protonated, the emission maximum shifts to 555 nm. These predicted values, while slightly red-shifted by 32 and 35 nm, respectively, align closely with the experimental value of 520 nm. This agreement suggests the presence of the pyrazine ion in this variant. Furthermore, our findings imply that D158 may serve as a proton acceptor from the chromophore, facilitated by a water-assisted Grotthuss-type mechanism, as previously mentioned. It is important to note, however, that while our emission maximum is in good agreement with the observed value, the experimental study did also report a smaller peak at 400 nm, which was absent in our simulated spectra (see Figure 7). This discrepancy may be attributed to additional structural changes in the emitter, likely caused by alterations in protein conformation due to the flexibility of the active-site pocket. This process may involve additional to transitions. Furthermore, prior experimental study19 conducted in the absence of the protein environment has demonstrated that the presence of a counterion can toggle the biomolecular state of the emitter, resulting in two distinct peaks. The higher peak corresponds to the pyrazine anion, while the lower peak is linked to the amide anion. Further investigation is necessary to explore the significance of these intriguing findings within the protein environment. Additionally, considering that the experiment used a higher concentration of a potassium phosphate buffer solution, as mentioned above, further experimental studies focusing on the impact of buffer solution concentration effect on the emission spectra could provide insights into the biomolecular state of the emitter in RLuc8-D162A.
Figure 7.

Calculated probability profiles for the emission spectra of the pyrazine anion transition from the first excited singlet state to the GS for RLuc8-D162A.
Our study also extended to the engineered design AncFT-D160A enzyme (PDB ID: 7QXQ), known for its similarities to RLuc8-D162A in structure and active-site chemistry, yet displaying a strikingly different emission wavelength. Specifically, AncFT-D160A demonstrated a blue-shifted emission maximum at 390 nm, in stark contrast to the RLuc8-D162A emission at 520 nm. The underlying cause of this shift is likely due to the absence of an adjacent Aspartate residue, which would typically deprotonate the hydroxyl group of the R2 6-(-hydroxyphenyl) substituent, thereby maintaining the chromophore in a neutral state. Our calculations for the neutral chromophore’s emission spectra in AncFT-D160A yield a value of 375 nm, remarkably consistent with experimental observations. This finding highlights the pivotal role of hydrogen bond proton acceptor residues in determining the enzyme’s emission characteristics.
4. CONCLUSIONS
In this study, we investigated the origins of bioluminescence in RLuc mutants. Our findings reveal that in RLuc8, the chromophore (coelenteramide) predominantly exists in its phenolate form when nearby Asp162 is protonated. This conclusion is supported by our QCFF/PI calculations, which match closely the experimental values of the emission maxima. Furthermore, we studied the PT process that leads to the formation of the primary emitter in the RLuc8’s bioluminescent reaction utilizing both PDLD/S-LRA and QCFF/PI methods. Our calculations demonstrate that incorporating the deprotonation reaction energy of the neutral emitter and Asp162 in both ES and GS, our calculations accurately replicate the emission maximum of the phenolate ion. This strongly indicates that Asp162 serves as a potential proton acceptor, making the phenolate ion the dominant emitting species in RLuc8.
This study also sheds light on an important aspect of the PT process, i.e., its dependency on the PT process. In certain bioluminescent organisms like the firefly luciferin,48,49 the PT of the firefly chromophore D-luciferin is known to take place in picoseconds, while the fluorescence emission takes place over nanoseconds. Considering that Asp162 in RLuc8 is merely 2.9 Å from the hydroxyl group of the emitter, it provides the shorter pathway for PT. This proximity results in the neutral emitter being a transient species, leading to the formation of the phenolate anion. Consequently, this might explain why the emission maximum of the neutral emitter in RLuc8 was not experimentally detected.
Moreover, our calculations also provide theoretical evidence supporting the bioluminescence mechanism in the RLuc8-D120A mutant, where the light emitter is in its amide ion form. The emission maximum of this form aligns well with the experimental findings. Further investigation into the bioluminescence of the RLuc8-D162A mutant reveals that the presence of a counterion is essential for the formation of the pyrazine anion, with its emission maximum closely matching observed value. However, our method did not replicate the second, lower emission peak reported for RLuc8-D162A. This peak might be associated with another biomolecular state of the emitter that our approach did not capture, suggesting a need for further investigation. More sophisticated theoretical approaches are required to fully understand and assess the significance of these intriguing results. Additionally, our analysis of the AncFT-D160A engineered enzyme, which is structurally analogous to RLu8-D162A yet exhibits a distinctly blue-shifted emission maximum, shows it lacks aspartate residues on the rim of the catalytic pocket that can accept protons. This inhibits the deprotonation of the hydroxyl group on the R2 6-(-hydroxyphenyl) substituent of the emitter, thereby maintaining the emitter in a neutral state. Our predicted emission spectra for this neutral form align well with the experimental results, and this might explain the differences in the observed emission spectra. In summary, our methods offer efficient means to study the bioluminescence properties, as well as the PT mechanism, in a manner that is considerably less resource-intensive than conventional QM/MM methods and proves to be a valuable tool for studying PT processes in the luminescent reactions of photoproteins.
Supplementary Material
ACKNOWLEDGMENTS
This work is supported by the National Institute of Health R35 GM122472 and the National Science Foundation Grant MCB 2142727
Footnotes
The authors declare no competing financial interest.
Supporting Information
The Supporting Information is available free of charge at https://pubs.acs.org/doi/10.1021/jacs.4c00963.
Output results from DFT, PDLD/S-LRA, and QCFF/PI calculations (PDF)
Complete contact information is available at: https://pubs.acs.org/10.1021/jacs.4c00963
Contributor Information
Ashim Nandi, Department of Chemistry, University of Southern California, Los Angeles, California 90089-1062, United States.
Aoxuan Zhang, Department of Chemistry, University of Southern California, Los Angeles, California 90089-1062, United States.
Zhen Tao Chu, Department of Chemistry, University of Southern California, Los Angeles, California 90089-1062, United States.
Wen Jun Xie, Department of Medicinal Chemistry, Center for Natural Products, Drug Discovery and Development (CNPD3), Genetics Institute, University of Florida, Gainesville, Florida 32610, United States.
Zhongxin Xu, State Key Laboratory of Natural and Biomimetic Drugs, Chemical Biology Center, and School of Pharmaceutical Sciences, Peking University, Beijing 100191, China.
Suwei Dong, State Key Laboratory of Natural and Biomimetic Drugs, Chemical Biology Center, and School of Pharmaceutical Sciences, Peking University, Beijing 100191, China.
Arieh Warshel, Department of Chemistry, University of Southern California, Los Angeles, California 90089-1062, United States.
Data Availability Statement
The QCFF/PI input files and control parameters are available at https://github.com/nandiashim/JACS2024.git.
REFERENCES
- (1).Lorenz WW; McCann RO; Longiaru M; Cormier MJ Isolation and Expression of a cDNA Encoding Renilla Reniformis Luciferase. Proc. Natl. Acad. Sci. U.S.A 1991, 88 (10), 4438–4442. [DOI] [PMC free article] [PubMed] [Google Scholar]
- (2).Syed AJ; Anderson JC Applications of Bioluminescence in Biotechnology and Beyond. Chem. Soc. Rev 2021, 50 (9), 5668–5705. [DOI] [PubMed] [Google Scholar]
- (3).Xu T; Close D; Handagama W; Marr E; Sayler G; Ripp S The Expanding Toolbox of In Vivo Bioluminescent Imaging. Front. Oncol 2016, 6, 150. [DOI] [PMC free article] [PubMed] [Google Scholar]
- (4).Carrasco-López C; Lui NM; Schramm S; Naumov P The Elusive Relationship between Structure and Colour Emission in Beetle Luciferases. Nat. Rev. Chem 2021, 5 (1), 4–20. [DOI] [PubMed] [Google Scholar]
- (5).Khakhar A; Starker CG; Chamness JC; Lee N; Stokke S; Wang C; Swanson R; Rizvi F; Imaizumi T; Voytas DF Building Customizable Auto-Luminescent Luciferase-Based Reporters in Plants. eLife 2020, 9, No. e52786. [DOI] [PMC free article] [PubMed] [Google Scholar]
- (6).Xie WJ; Liu D; Wang X; Zhang A; Wei Q; Nandi A; Dong S; Warshel A Enhancing Luciferase Activity and Stability through Generative Modeling of Natural Enzyme Sequences. Proc. Natl. Acad. Sci. U.S.A 2023, 120 (48), No. e2312848120. [DOI] [PMC free article] [PubMed] [Google Scholar]
- (7).Navizet I QM/MM Study of Bioluminescent Systems. In QM/MM Studies of Light-Responsive Biological Systems; Andruniów T, Olivucci M, Eds.; Challenges and Advances in Computational Chemistry and Physics; Springer International Publishing: Cham, 2021; pp 227–270. [Google Scholar]
- (8).Hori K; Wampler JE; Matthews JC; Cormier MJ Bioluminescence of Renilla Reniformis. XIII. Identification of the Product Excited States during the Chemiluminescent and Bioluminescent Oxidation of Renilla (Sea Pansy) Luciferin and Certain of Its Analogs. Biochemistry 1973, 12 (22), 4463–4468. [DOI] [PubMed] [Google Scholar]
- (9).Matthews JC; Hori K; Cormier MJ Purification and Properties of Renilla Reniformis Luciferase. Biochemistry 1977, 16 (1), 85–91. [DOI] [PubMed] [Google Scholar]
- (10).Matthews JC; Hori K; Cormier MJ Substrate and Substrate Analog Binding Properties of Renilla luciferase. Biochemistry 1977, 16 (24), 5217–5220. [DOI] [PubMed] [Google Scholar]
- (11).Schenkmayerova A; Toul M; Pluskal D; Baatallah R; Gagnot G; Pinto GP; Santana VT; Stuchla M; Neugebauer P; Chaiyen P; Damborsky J; Bednar D; Janin YL; Prokop Z; Marek M Catalytic Mechanism for Renilla-Type Luciferases. Nat. Catal 2023, 6 (1), 23–38. [Google Scholar]
- (12).Head JF; Inouye S; Teranishi K; Shimomura O The Crystal Structure of the Photoprotein Aequorin at 2.3 A Resolution. Nature 2000, 405 (6784), 372–376. [DOI] [PubMed] [Google Scholar]
- (13).Liu ZJ; Vysotski ES; Chen CJ; Rose JP; Lee J; Wang BC Structure of the -Regulated Photoprotein Obelin at 1.7 A Resolution Determined Directly from its Sulfur Substructure. Protein Sci. 2000, 9 (11), 2085–2093. [DOI] [PMC free article] [PubMed] [Google Scholar]
- (14).Vysotski ES; Lee J -Regulated Photoproteins: Structural Insight into the Bioluminescence Mechanism. Acc. Chem. Res 2004, 37 (6), 405–415. [DOI] [PubMed] [Google Scholar]
- (15).Vysotski ES; Liu Z-J; Markova SV; Blinks JR; Deng L; Frank LA; Herko M; Malikova NP; Rose JP; Wang B-C; Lee J Violet Bioluminescence and Fast Kinetics from W92F Obelin: Structure-Based Proposals for the Bioluminescence Triggering and the Identification of the Emitting Species. Biochemistry 2003, 42 (20), 6013–6024. [DOI] [PubMed] [Google Scholar]
- (16).Deng L; Markova SV; Vysotski ES; Liu Z-J; Lee J; Rose J; Wang B-C Crystal Structure of a -Discharged Photoprotein: Implications for Mechanisms of the Calcium Trigger and Bioluminescence. J. Biol. Chem 2004, 279 (32), 33647–33652. [DOI] [PubMed] [Google Scholar]
- (17).Chen S; Navizet I; Lindh R; Liu Y; Ferré N Hybrid QM/ MM Simulations of the Obelin Bioluminescence and Fluorescence Reveal an Unexpected Light Emitter. J. Phys. Chem. B 2014, 118 (11), 2896–2903. [DOI] [PubMed] [Google Scholar]
- (18).McCapra F; Hart R The Origins of Marine Bioluminescence. Nature 1980, 286 (5774), 660–661. [Google Scholar]
- (19).Shimomura O; Teranishi K Light-Emitters Involved in the Luminescence of Coelenterazine. Luminescence 2000, 15 (1), 51–58. [DOI] [PubMed] [Google Scholar]
- (20).Shimomura O; Masugi T; Johnson FH; Haneda Y Properties and Reaction Mechanism of the Bioluminescence System of the Deep-Sea Shrimp Oplophorus Gracilorostris. Biochemistry 1978, 17 (6), 994–998. [DOI] [PubMed] [Google Scholar]
- (21).Ohmiya Y; Hirano T Shining the Light: The Mechanism of the Bioluminescence Reaction of Calcium-Binding Photoproteins. Chem. Biol 1996, 3 (5), 337–347. [DOI] [PubMed] [Google Scholar]
- (22).Loening AM; Fenn TD; Wu AM; Gambhir SS Consensus Guided Mutagenesis of Renilla Luciferase Yields Enhanced Stability and Light Output. Protein Eng. Des. Sel 2006, 19 (9), 391–400. [DOI] [PubMed] [Google Scholar]
- (23).Loening AM; Fenn TD; Gambhir SS Crystal Structures of the Luciferase and Green Fluorescent Protein from Renilla Reniformis. J. Mol. Biol 2007, 374 (4), 1017–1028. [DOI] [PMC free article] [PubMed] [Google Scholar]
- (24).Schenkmayerova A; Pinto GP; Toul M; Marek M; Hernychova L; Planas-Iglesias J; Daniel Liskova V; Pluskal D; Vasina M; Emond S; Dörr M; Chaloupkova R; Bednar D; Prokop Z; Hollfelder F; Bornscheuer UT; Damborsky J Engineering the Protein Dynamics of an Ancestral Luciferase. Nat. Commun 2021, 12 (1), 3616. [DOI] [PMC free article] [PubMed] [Google Scholar]
- (25).Warshel A The QCFF/PI + MCA Program Package Efficiency and Versatility in Molecular Mechanics. Comput. Chem 1977, 1 (3), 195–202. [Google Scholar]
- (26).Warshel A; Lappicirella A Calculations of Ground- and Excited-State Potential Surfaces for Conjugated Heteroatomic Molecules. J. Am. Chem. Soc 1981, 103 (16), 4664–4673. [Google Scholar]
- (27).Warshel A Quantum Mechanical Consistent Force Field (QCFF/PI) Method: Calculations of Energies, Conformations and Vibronic Interactions of Ground and Excited States of Conjugated Molecules. Isr. J. Chem 1973, 11 (5), 709–717. [Google Scholar]
- (28).Warshel A; Karplus M Calculation of .Pi.Pi.* Excited State Conformations and Vibronic Structure of Retinal and Related Molecules. J. Am. Chem. Soc 1974, 96 (18), 5677–5689. [DOI] [PubMed] [Google Scholar]
- (29).Warshel A; Karplus M Calculation of Ground and Excited State Potential Surfaces of Conjugated Molecules. I. Formulation and Parametrization. J. Am. Chem. Soc 1972, 94 (16), 5612–5625 [Google Scholar]
- (30).Warshel A; Chu ZT; Villa J; Strajbl M; Schutz C; Shurki A; Vicatos S; Plotnikov N; Schopf P Molaris-Xg, Version 9.15; University of Southern California: Los Angeles, 2012. [Google Scholar]
- (31).Lee FS; Chu ZT; Warshel A Microscopic and Semimicroscopic Calculations of Electrostatic Energies in Proteins by the POLARIS and ENZYMIX Programs. J. Comput. Chem 1993, 14 (2), 161–185. [Google Scholar]
- (32).Warshel A; Levitt M Program for the Consistent Force Field Evaluation of Equilibrium Geometries and Vibrational Frequencies of Molecules; Quantum Chemistry Program Exchange; Indiana University: Bloomington, IN, 1974; Vol. QCPE 247. [Google Scholar]
- (33).Warshel A; Chu ZT Nature of the Surface Crossing Process in Bacteriorhodopsin: Computer Simulations of the Quantum Dynamics of the Primary Photochemical Event. J. Phys. Chem. B 2001, 105 (40), 9857–9871. [Google Scholar]
- (34).Luzhkov V; Warshel A Microscopic Calculations of Solvent Effects on Absorption Spectra of Conjugated Molecules. J. Am. Chem. Soc 1991, 113 (12), 4491–4499. [Google Scholar]
- (35).Warshel A Bicycle-Pedal Model for the First Step in the Vision Process. Nature 1976, 260 (5553), 679–683. [DOI] [PubMed] [Google Scholar]
- (36).King G; Warshel A A Surface Constrained All-atom Solvent Model for Effective Simulations of Polar Solutions. J. Chem. Phys 1989, 91 (6), 3647–3661. [Google Scholar]
- (37).Lee FS; Warshel A A Local Reaction Field Method for Fast Evaluation of Long-range Electrostatic Interactions in Molecular Simulations. J. Chem. Phys 1992, 97 (5), 3100–3107. [Google Scholar]
- (38).Sham YY; Chu ZT; Warshel A Consistent Calculations of pKa’s of Ionizable Residues in Proteins: Semi-Microscopic and Microscopic Approaches. J. Phys. Chem. B 1997, 101 (22), 44584472. [Google Scholar]
- (39).Yanai T; Tew DP; Handy NC A New Hybrid Exchange-Correlation Functional Using the Coulomb-Attenuating Method (CAM-B3LYP). Chem. Phys. Lett 2004, 393 (1–3), 51–57. [Google Scholar]
- (40).Marenich AV; Cramer CJ; Truhlar DG Performance of SM6, SM8, and SMD on the SAMPL1 Test Set for the Prediction of Small-Molecule Solvation Free Energies. J. Phys. Chem. B 2009, 113 (14), 4538–4543. [DOI] [PubMed] [Google Scholar]
- (41).Grimme S Supramolecular Binding Thermodynamics by Dispersion-Corrected Density Functional Theory. Chem.−Eur. J 2012, 18 (32), 9955–9964. [DOI] [PubMed] [Google Scholar]
- (42).Frisch MJ Gaussian 16, Revision A03; Gaussian Inc.: Wallingford CT, 2016. [Google Scholar]
- (43).Bayly CI; Cieplak P; Cornell W; Kollman PA A Well-Behaved Electrostatic Potential Based Method Using Charge Restraints for Deriving Atomic Charges: The RESP Model. J. Phys. Chem 1993, 97 (40), 10269–10280. [Google Scholar]
- (44).Cieplak P; Cornell WD; Bayly C; Kollman PA Application of the Multimolecule and Multiconformational RESP Methodology to Biopolymers: Charge Derivation for DNA, RNA, and Proteins. J. Comput. Chem 1995, 16 (11), 1357–1377. [Google Scholar]
- (45).Cornell WD; Cieplak P; Bayly CI; Kollman PA Application of RESP Charges to Calculate Conformational Energies, Hydrogen Bond Energies, and Free Energies of Solvation. J. Am. Chem. Soc 1993, 115 (21), 9620–9631. [Google Scholar]
- (46).Case DA; Cheatham TE III; Darden T; Gohlke H; Luo R; Merz KM Jr.; Onufriev A; Simmerling C; Wang B; Woods RJ The Amber Biomolecular Simulation Programs. J. Comput. Chem 2005, 26 (16), 1668–1688. [DOI] [PMC free article] [PubMed] [Google Scholar]
- (47).Pliego JR Thermodynamic Cycles and the Calculation of pKa. Chem. Phys. Lett 2003, 367 (1–2), 145–149. [Google Scholar]
- (48).Presiado I; Erez Y; Huppert D Excited-State Intermolecular Proton Transfer of Firefly Luciferin III. Proton Transfer to a Mild Base. J. Phys. Chem. A 2010, 114 (51), 13337–13346. [DOI] [PubMed] [Google Scholar]
- (49).Erez Y; Presiado I; Gepshtein R; Huppert D Excited-State Intermolecular Proton Transfer of Firefly Luciferin IV. Temperature and pH Dependence. J. Phys. Chem. A 2011, 115 (9), 1617–1626. [DOI] [PubMed] [Google Scholar]
Associated Data
This section collects any data citations, data availability statements, or supplementary materials included in this article.
Supplementary Materials
Data Availability Statement
The QCFF/PI input files and control parameters are available at https://github.com/nandiashim/JACS2024.git.