Abstract
Video-based monitoring is essential nowadays in cattle farm management systems for automated evaluation of cow health, encompassing body condition scores, lameness detection, calving events, and other factors. In order to efficiently monitor the well-being of each individual animal, it is vital to automatically identify them in real time. Although there are various techniques available for cattle identification, a significant number of them depend on radio frequency or visible ear tags, which are prone to being lost or damaged. This can result in financial difficulties for farmers. Therefore, this paper presents a novel method for tracking and identifying the cattle with an RGB image-based camera. As a first step, to detect the cattle in the video, we employ the YOLOv8 (You Only Look Once) model. The sample data contains the raw video that was recorded with the cameras that were installed at above from the designated lane used by cattle after the milk production process and above from the rotating milking parlor. As a second step, the detected cattle are continuously tracked and assigned unique local IDs. The tracked images of each individual cattle are then stored in individual folders according to their respective IDs, facilitating the identification process. The images of each folder will be the features which are extracted using a feature extractor called VGG (Visual Geometry Group). After feature extraction task, as a final step, the SVM (Support Vector Machine) identifier for cattle identification will be used to get the identified ID of the cattle. The final ID of a cattle is determined based on the maximum identified output ID from the tracked images of that particular animal. The outcomes of this paper will act as proof of the concept for the use of combining VGG features with SVM is an effective and promising approach for an automatic cattle identification system
Subject terms: Image processing, Machine learning, Computer science, Information technology
Introduction
In the current era of precision agriculture, the agricultural sector is undergoing a significant change driven by technological advancements1. With the rapid growth of the world population, there is an increasingly urgent need for farming systems that are both sustainable and efficient. Within this paradigm shift, livestock management emerges as a focal point for reevaluation and innovation. Ensuring the continuous growth of this industry is vital to mitigate the increasing difficulties faced by farmers, which are worsened by variables such as the aging population and the size of their businesses. Farmers have significant challenges due to the constant need for livestock management. A wide range of digital technologies are used as crucial farming implements in modern agriculture. The implementation of these technologies not only decreases the need for manual labor but also minimizes human errors resulting from factors such as fatigue, exhaustion, and a lack of knowledge of procedures. Livestock monitoring techniques mostly utilize digital instruments for monitoring lameness, rumination, mounting, and breeding. Identifying these indications is crucial for improving animal output, breeding, and overall health2.
Monitoring the health of dairy animals is also essential in dairy production. Historically, farmers and veterinarians evaluate the health of animals by directly seeing them, a process that can be somewhat time-consuming3. Regrettably, not all livestock are monitored on a daily basis due to the significant amount of time and work involved. Neglecting daily health maintenance can lead to substantial economic losses for dairy farms4. Hence, automatic, robust, accurate and reliable identification of individuals is an increasingly crucial point in several aspects of cattle management, such as in in behavior analysis, wellness monitoring, health observation, progress assessment of the cattle and many others5. At the heart of livestock growth is the necessity of individually identifying cattle, which is crucial for optimizing output and guaranteeing animal well-being. Cattle identification has thus been becoming an ongoing and active research area since it demands for those kinds of highly reliable cattle monitoring systems.
The cattle identification system is a critical tool used to accurately recognize and track individual cattle. Identification refers to the act of assigning a predetermined name or code to an individual organism based on its physical attributes6. For instance, a system for automatic milking and identification was created to simplify farmer tasks and enhance cow welfare7. The precision of livestock counts and placements was assessed using the utilization of a time-lapse camera system and an image analysis technique8. An accurate identification technique was developed to identify individual cattle for the purpose of registration and traceability, specifically for beef cattle9.
Throughout decades, conventional techniques such as ear tagging and branding have served as the foundation for cattle identification10. Although these strategies were sufficient in the past, the current agricultural environment requires a more refined and advanced approach. Traditional approaches are plagued by inherent limitations, including the need for extensive manual effort, the possibility of inaccuracies, and the potential for inducing stress in animals11.
Cattle can be identified using biometric features such as muzzle print image12, iris patterns13, and retinal vascular patterns14. While the utilization of biometric sensors could reduce the burden on human experts, it still presents certain obstacles in terms of individual cattle identification, processing time, identification accuracy, and system operation. Animal facial recognition is a biometric technology that utilizes image analysis tools. Cattle can be identified by analyzing cow face images, similar to how human face recognition works, due to the absence of distinct patterns on their bodies15. Nevertheless, capturing photos of the cow's face automatically becomes challenging when the cow's head is in motion. An identification method based on body patterns could be advantageous for the identification of dairy cows, as the body pattern serves as a biometric characteristic of cows16. Individual cattle recognition procedures that rely on physical contact have a substantial financial burden, provide a notable danger of causing stress and disease in animals, and have a considerable likelihood of encountering misidentification problems.
Consequently, there is still a desire for more advanced identifying systems that offer greater accuracy17. Computer vision technology is increasingly utilized for contactless identification of individual cattle to tackle these issues. This method enhances animal welfare by providing accurate contactless identification of individual cattle through the use of cameras and computing technology, eliminating the necessity for extra wearable devices. The use of RGB image-based individual cattle identification represents a significant advancement in precision, efficiency, and humane treatment in livestock management, acknowledging the constraints of traditional methods. With the ongoing development of technology and agriculture, there is a growing demand for accurate identification of individual cattle. Therefore, by taking all of the above concepts into consideration, we develop a computer-aided identification system to identify the cattle based on RGB images from a single camera. In order to implement cattle identification, the back-pattern feature of the cattle has been exploited18. The suggested method utilizes a Tracking-Based identification approach, which effectively mitigates the issue of ID-switching during the tagging process with cow ground-truth ID. Hence, the suggested system is resistant to ID-switching and exhibits enhanced accuracy as a result of its Tracking-Based identifying method. Additionally, it is cost-effective, easily monitored, and requires minimal maintenance, thereby reducing labor costs19. Our approach eliminates the necessity for calves to utilize any sensors, creating a stress-free cattle identification system.
There are five sections in this paper: introduction, related studies, methodology, experimental results and analysis, and conclusion.
Related studies
The progress in computer vision and machine learning has created significant opportunities in precision agriculture, namely in the field of livestock management. The incorporation of RGB (Red, Green, Blue) imaging for individual cow identification signifies a point at which technology harmoniously merges with the welfare and efficiency goals of established farming processes. In literature, a tremendous amount of research has been done on identification of cattle by approaching various aspects. This literature review provides a thorough analysis of important studies and significant developments in the field of individual cattle identification systems. Numerous studies have explored various elements of cattle identification, including detection, tracking, identification, and the integration of deep learning and machine learning algorithms. Some of them are provided in this section.
There are many other cattle identification systems based on different parts of the body of the cow. The study conducted by Zin et al., 201820 focused on developing a cow identification system using deep learning and image technology. The system analyzed images of the cattle's backs, captured from a top-down perspective at the cattle farm. The research focused on two primary stages: cattle detection and identification, which were conducted on a sample of 45 distinct cattle. To detect the cattle, the positions of the boundary poles for each cattle were determined by calculating the differences between two consecutive frames of the cattle video. Subsequently, the inter-frame differencing outcome is transformed into a binary image by using a pre-established threshold. Next, determine the number of white pixels (with a threshold of 350 pixels) in the horizontal histogram of the binary image in order to obtain the position of the pole in pixels. The cattle image was cropped using certain dimensions of 400 pixels and 840 pixels to delineate the bounding box of the livestock within the boundary pole. Subsequently, the cattle photos that were trimmed down were employed as a dataset for the purpose of training and pattern identification in Deep Convolutional Neural Network (DCNN), a cutting-edge technique in object recognition. Next, a potential identification number for the identified animals was forecasted. This research is said to handle the two challenges, the rotation invariant, and various illumination changing environments.
There is also research studied by Andrew et al., 201621 on the identification of Holstein Friesian cattle using coat pattern matching in RGB-D (Red, Green, Blue plus Depth data) images. These images were obtained using Kinetic 2 sensors. Holstein Friesian cattle exhibit unique and identifiable black and white (or brown and white) patterns and markings on their bodies. The SIFT method was used to characterize the coat of each individual animal. The video frames contain segmented cattle that have been separated from the background and adjusted for rotation. In order to do this, the depth maps are first subjected to thresholding at the maximum and minimum distances detected by the sensor, and subsequently converted into binary form. Subsequently, silhouettes were produced for the cattle present in the frame. Subsequently, any silhouettes that seemed smaller than the dimensions of the animals as observed by the camera were eliminated. The cattle characteristics were obtained using the Affine-SIFT method. The extracted characteristics are refined to restrict the focus to the animal region by eliminating any characteristics outside the segmentation border. The retrieved features from ASIFT were trained using the RBG-SVM. The identification was conducted by image-to-image comparison using ASIFT feature matching. Sequentially, matching results are generated by doing feature-to-feature matching between all feasible pairings of images. Image-to-image matches are geometrically confirmed by aligning pairs of images using vertical lines that connect matching features within a range of n ± 3 degrees from the median. The trained SVM was used to filter the features. Features that correspond to a match in an image pair are classified as either − 1 or 1. The research utilized a training dataset of 83 photographs of 10 cattle. The testing dataset, on the other hand, consisted of 40 individual cattle and a total of 294 images. This configuration yielded roughly 86,000 potential test image pairs. The research study attained a 97% accuracy rate in identifying the aforementioned facts.
The research performed by Li et al., 201716 introduced a cattle identification method that utilizes tailhead photos to automatically identify individual Holstein dairy cows. The two cameras were positioned above the adjacent parallel channels (left and right channels) of the milking parlor. The image of the cattle tailhead was cropped inside a region of interest (ROI) measuring 400 × 320 pixels. The ROI was manually selected for the purpose of performing the identification process. The photos that were saved on a local hard disk were preprocessed using binary segmentation, translation, and scaling techniques. The white pattern in the images was converted into a binary format. Following preprocessing, shape characteristics were recovered from the binarized pictures using Zernike moments. These moments were divided into two groups: low-order and high-order Zernike moments, depending on the "n" number (order of the moment), with 10 moments classified as low-order and 17 moments classified as high-order. Four classifiers, namely SVM, ANN, LDA, and QDA, were assessed for feature classification. Among the low-order features, QDA demonstrated the best accuracy rate of 99.7%, followed by SVM with 99.5%. ANN and LDA attained accuracy rates of 98.0 and 94.4% respectively. Among the high-order features, Support Vector Machine (SVM) achieved the highest accuracy rate of 99.3%. Quadratic Discriminant Analysis (QDA) achieved an accuracy rate of 96.4%, while Artificial Neural Network (ANN) achieved an accuracy rate of 90.8%. Lastly, Linear Discriminant Analysis (LDA) resulted in an accuracy rate of 89.5% for classification. The author manually selected the images for detection and classification. Additionally, the author proposed incorporating object tracking or enhancing the hardware by including an infrared detector. This would enable the camera to select the image containing the cow for the detection and identification procedure.
In 2021, Qiao et al.22 conducted a study on Individual Cattle Identification. They employed a deep learning-based framework to analyze the rear perspective of the cattle. The sequential photos of each calf were recorded within the specified regions of interest (ROIs) within the lane. Subsequently, a Convolutional Neural Network (CNN) model called Inception-V3 was employed to extract features from the captured cattle images. This study utilized the final pool layer of the Inception-V3 model to extract convolutional neural network (CNN) features. Each image was represented by a set of 2048-dimensional CNN features. The characteristics derived from the subsequence cattle photos are subsequently trained using LSTM (long short-term memory networks). LSTM is an extension of the Recurrent Neural Network (RNN) that incorporates memory cells. It is a widely used network for processing space–time data, known for its exceptional capacity to learn and retain information from lengthy sequences of input data in Karim et al., 201923. The LSTM network utilized the extracted CNN features as input and effectively captured the distinctive temporal properties of each cattle for every frame. The experiment utilized a dataset consisting of 8370 cattle images extracted from 439 training videos and 1540 photos from 77 testing videos. In total, the dataset included 41 cattle. The research obtained an accuracy of 88 and 91% when using video lengths of 15 frames and 20 frames, respectively. This performance surpassed the framework that just relies on CNN, which reached an identification accuracy of 57%. The research asserts that achieving high accuracy is attributed to the ability of LSTM to acquire valuable temporal information, such as the gait or movement pattern of calves, hence improving the performance of visual cow identification.
Alternatively, the identification can be performed by using biometric features such as iris patterns, muzzle images and eyes retina of animals. Muzzle pattern image scanning for biometric identification has now been extensively applied for identification. Animal recognition via muzzle pattern image for different applications has been proliferating gradually. One of those applications includes the identification of fake insurance claims under livestock insurance. Fraudulent animal owners tend to lodge fake claims against livestock insurance with proxy animals. The paper by Ahmad et al., 202324 proposes a novel AI-driven system for livestock identification and insurance management, utilizing muzzle pattern recognition for individual animal identification and fraud detection in insurance claims. The system proposed the solution to avoid and/or discard fraudulent claims of livestock insurance by intelligently identifying the proxy animals. Data collection of animal muzzle patterns remained challenging. In this AI-Driven livestock identification and insurance management system, the author used the Face, Nose, Nose-Dirty and Not-cow classes to identify the cattle. The system first registers each cattle with their tag and muzzle printing and created unique identification string for each cattle. In the detection stage, the cattle face is detected by YOLOv7 and detect the nose inside the face area of cattle with YOLOv7 again. Then applied SIFT to extract the muzzle Features from the detected cattle in the form of key points and Descriptors. To precisely locate the key points in the image, the SIFT algorithm’s key-point localization is used. It is performed by examining the images scale-space representation, which is created by applying a number of scale-space transformations. FLANN-based matcher is used to match the key points and descriptors of the query image in the data and if the match image exits in the data, it will return the associated tag with the mage image in data, identifying the animal. The system can detect face and muzzle point of cow/buffalo with mAP of 99%, not only that but the system has the capability to differentiate cows/buffalos from other cattle as well as humans. The system was able to recognize the animal with 100% accuracy.
Existing literature has established that there are numerous cow identification systems that make use of varied sets of cattle data. In addition, it still has issues to explore the new innovation to improve the performance of cattle identification system for real world use effectively.
Therefore, this paper focused mainly on highlighting the accuracy and robustness of automatic cattle identification system. We accomplished this by implementing two key innovations: (1) Feature extraction from single-camera detection: We developed a method that detects and tracks cattle using RGB images from a single camera and extracts distinctive features from the tracked cattle's masked region for identification purposes. (2) Pattern-based identification with robust tracking: By utilizing the unique back patterns of cattle observed in our test farms, made possible by the overhead camera arrangement, we have developed a system that can accurately identify individual cattle based on these patterns. This system employs a tracking-based approach, making it resistant to occasional misidentifications and preventing "ID-switching", the issue of incorrect IDs being assigned to different cattle over time.
Methodology
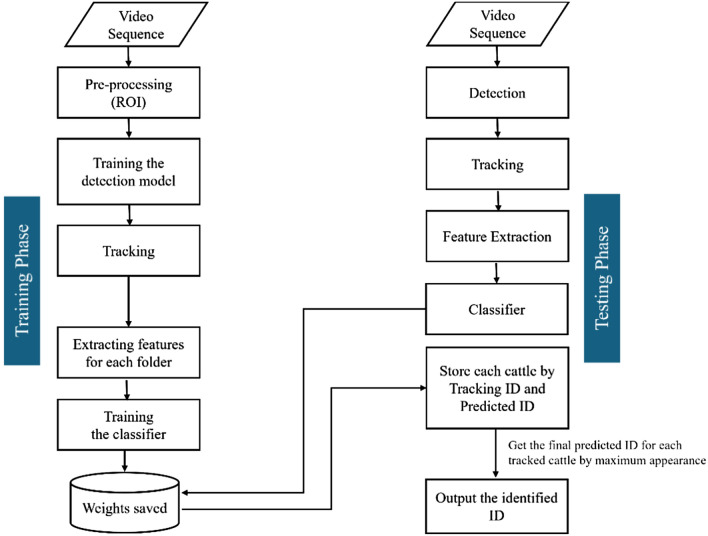
The purpose of the research is to employ automated methods to recognize, track, and identify individual cattle as they move along a lane and stand in the rotary milking parlor in video footage. Therefore, our proposed system is composed of three main components: (1) cattle detection, (2) cattle tracking and (3) cattle identification. The primary goal of this first phase is to collect relevant information regarding the locations and regions of cattle. The photos of cattle that are detected are then saved for further examination. Following identification, each identified cattle is traced using a customized tracking algorithm that employs Intersection over Union (IOU) tracking. Each cattle are assigned a unique local ID for effective monitoring. The tracked photos of each cattle are then systematically stored according to their unique IDs into distinct folders, which expedites the identification process that follows. A feature extractor is used to extract features for identifying purposes. The ultimate ID for each cattle is determined by selecting the maximum identified output ID from the tracked images of that specific animal. The detailed proposed system is explained in Fig. 1.
Figure 1.
Detailed Proposed System.
Data collection
To carry out the research on this system, we possess datasets obtained from three farms, as outlined in Table 1. The proposed system was tested using video data from three cattle farms. The initial dataset originated from the Kunneppu Demonstration Farm (a medium-scale cattle farm) in Hokkaido Prefecture, Japan, and we will define this farm as Farm A. This Farm A consisted of experimental video sequences that played a crucial role in our research. The data-gathering period lasted a full year, starting in January 2022 and ending in January 2023.
Table 1.
Information of three test environments.
| No | Cattle farm | Name | Farm location | Camera setup |
|---|---|---|---|---|
| 1 | Farm A | Kunneppu Demonstration Farm | Hokkaido, Japan | Passing lane after milk production process |
| 2 | Farm B | Sumiyoshi Livestock Science Station | Miyazaki, Japan | Passing lane after milk production process |
| 3 | Farm C | Honkawa Farm | Oita, Japan | Rotating milking parlor |
The second source was the Sumiyoshi Farm (a small-scale cattle farm) located in Miyazaki Prefecture, Japan and will be defined as Farm B. Farm B contributed cattle videos to the collection and has a similar environment to the Kunneppu Demonstration Farm.
The third farm, defined as Farm C, located in Oita Prefecture, Japan, known as the Honkawa Farm (a large-scale cattle farm), possesses a different environment in comparison to the aforementioned two farms. The datasets obtained from Kunneppu Demonstration and Sumiyoshi farm were collected in the passing lane from the milking parlor, whereas the datasets from Honkawa farm were recorded from the rotary milking parlor.
Test environment 1 (Farm A)
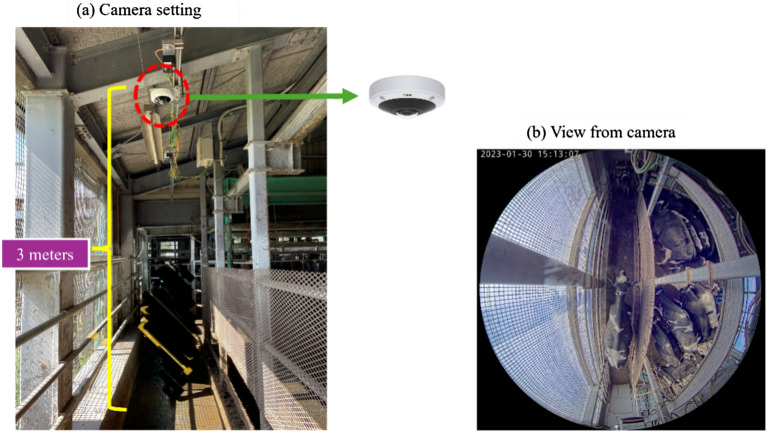
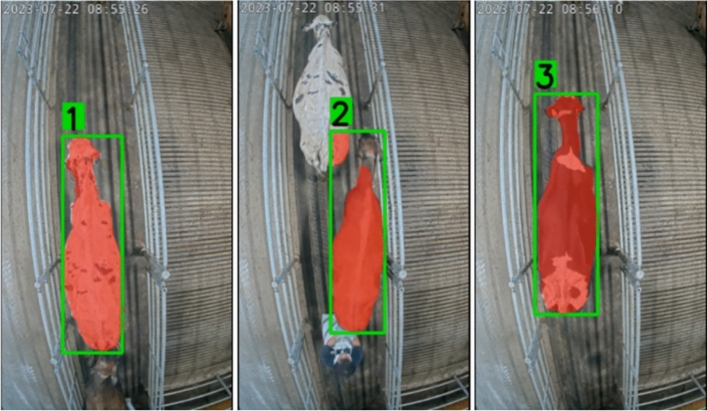
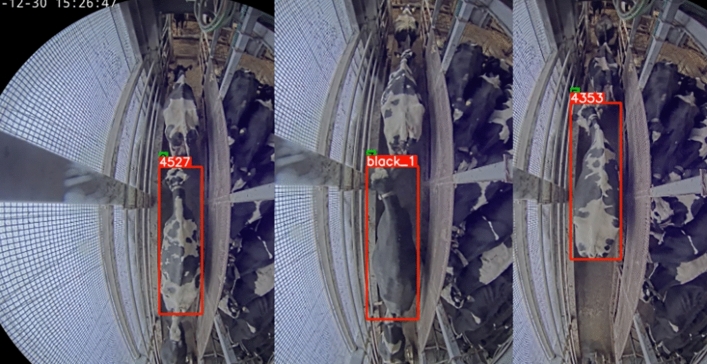
The experimental setup of Farm A was on the lane located at the exit lane of the milking parlor where cattle used to walk through after the milking process. A 360° (AXIS M3058-PLVE) camera is set up above the 3 m from the ground to capture the cattle which were passing through the exit lane of milking parlor. In Fig. 2, the test environment is displayed. The video resolution is 2992*2992 pixels, and the frame rate of the video is 13 frames per second. The camera was able to capture the whole body of cattle and even cover the entrance and exit of the lane. The top view of each cattle and cattle’s movements were recorded on the video and there are total of 147 cattle for the dataset.
Figure 2.
Experimental setup of test environment 1.
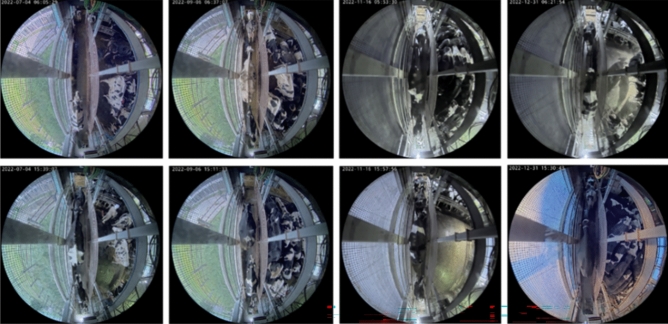
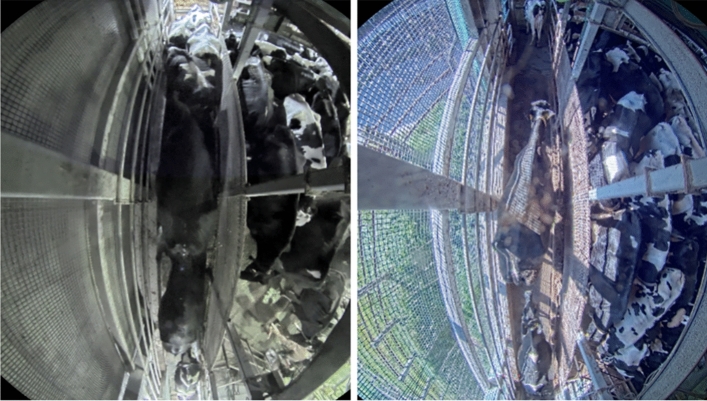
The processing of data from Farm A in Hokkaido poses specific obstacles, despite the system's efficient identification of cattle. Some cattle exhibit similar patterns, and distinguishing black cattle, which lack visible patterns, proves to be challenging. The farm's placement in Hokkaido Prefecture presents challenges stemming from diminished illumination and rapid shifts in ambient lighting as in Fig. 3. Insufficient illumination in morning footage reduces the capacity to distinguish black cattle. Furthermore, in dimly lit conditions, the combination of mud on the lane and the shadows created by cattle can often be mistaken for actual cattle, resulting in incorrect identifications25.
Figure 3.
Lighting conditions variation between morning and nighttime.
Test environment 2 (Farm B)
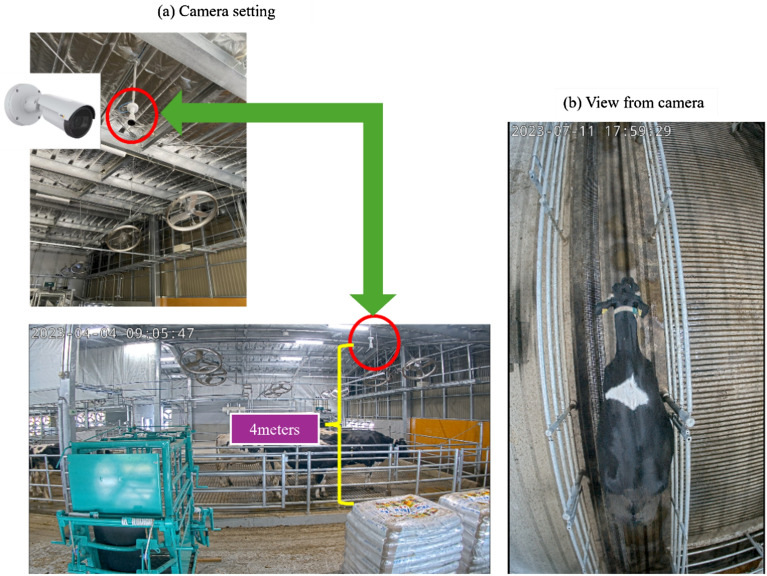
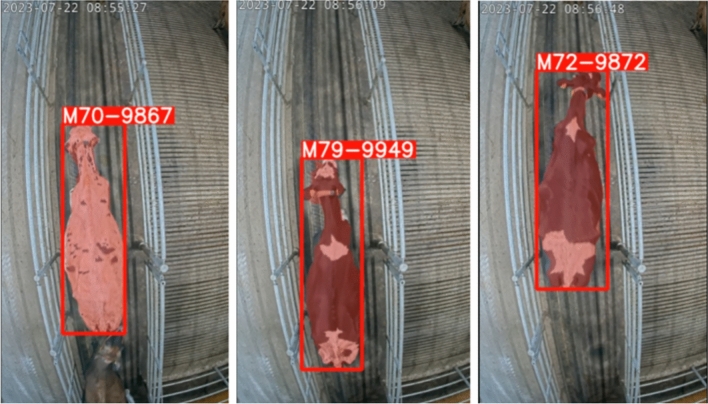
The setup of Farm B is similar to the setup with Farm A, a 360° (AXIS M3058-PLVE) camera is located above the 4 m off the ground, the same camera as Farm A. The camera also records the cattle walking through the exit lane of the milking parlor and there are total of 13 cattle in the dataset. The video resolution is 2160*3840 pixels, and the frame rate of the video is 20 frames per second. The experimental setup of Farm B is described in Fig. 4.
Figure 4.
Experimental setup of test environment 2.
Test environment 3 (Farm C)
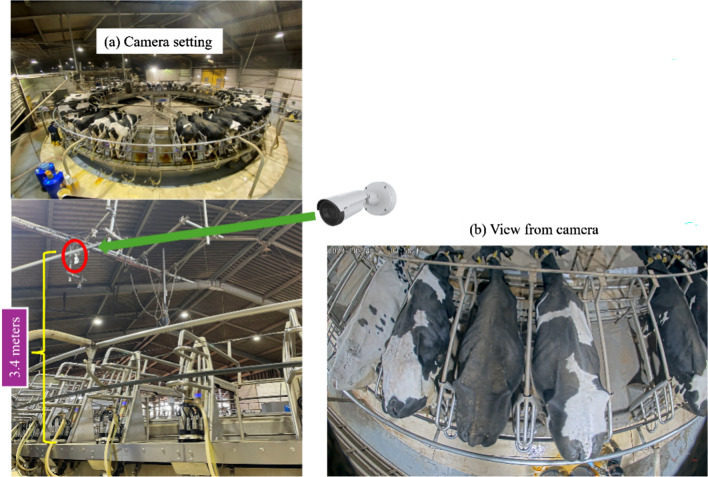
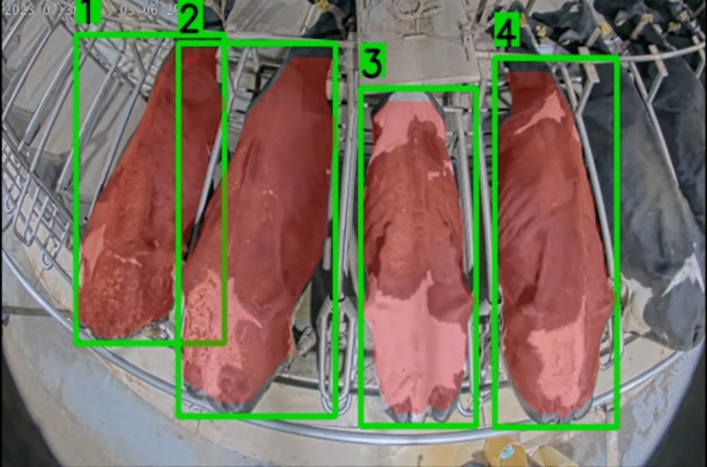
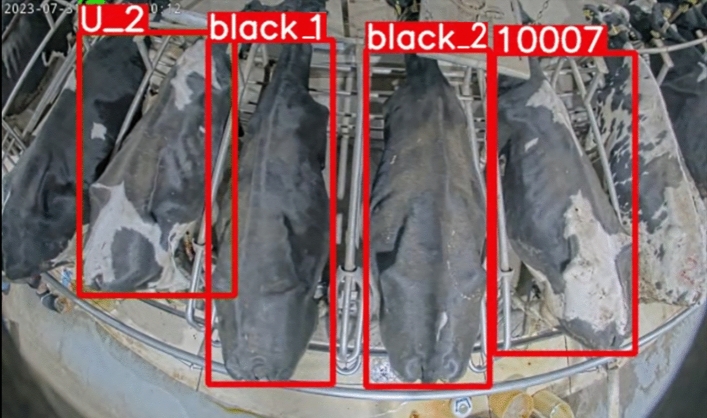
In the test environment3, Farm C, a 4 K camera (AXIS P1448-LE) is set up 3.4 m above the rotary milking machine where the cattle are doing milk production process. The video resolution is 1920*1080 pixels with 10 frames per second. There are total of 1103 cattle in the dataset and the largest dataset in this research. The test environment of Farm C is shown in Fig. 5.
Figure 5.
Experimental setup of test environment 3.
Data processing
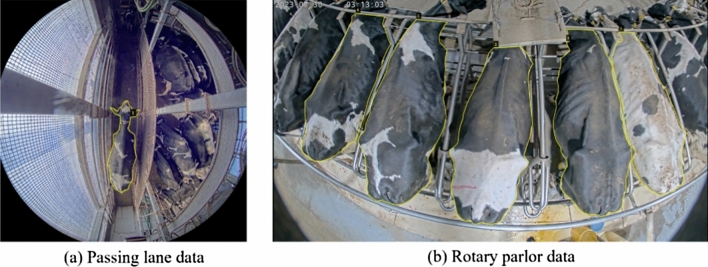
In this system, the identification of the individual cattle is based on the top view of the cattle because the camera is set up above the ground. After gathering the dataset from the video, the subsequent step is to annotate each individual object in the image. The VGG annotation tool will be employed at this stage to segment each individual cattle in the image. The videos which contained the cattle were chosen and split into images by 1 frame per second. Cattle with fully visible body were annotated as shown in Fig. 6. The annotated datasets were converted into trainable dataset for YOLOv8 and split into a 7:3 ratio for training and validation respectively. We annotated 1,027 images for Farm A and 421 images for Farm C, described in Table 2. Farm B data was excluded due to similar cattle walking patterns to Farm A.
Figure 6.
Illustration of the visual annotation.
Table 2.
Dataset used for data annotation.
| No | Date | Data used for annotation | Number of frames |
|---|---|---|---|
| 1 | Farm A | 30th January 2022 | 1,027 |
| 2 | Farm C | 30th July 2023 | 421 |
Setting region of interest (ROI)
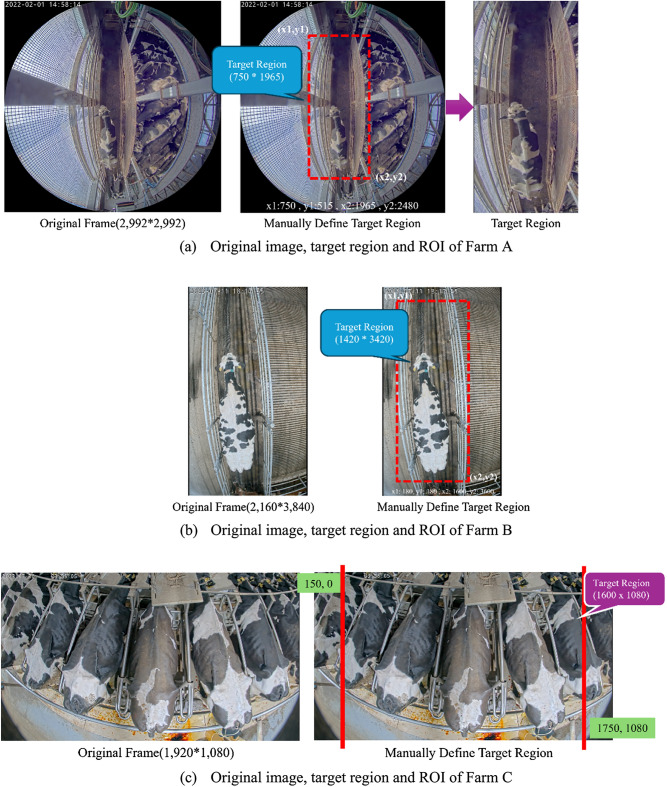
At Farm A and Farm B, the 360-camera's wide-angle output resulted in the exclusion of cattle located outside the top 515 pixels and bottom 2,480 pixels positions. These positions do not capture the entire body of the cattle, making identification impossible. Consequently, any cattle detected outside of this range were disregarded or not considered. The system exclusively focuses on detecting animals within the designated lane, disregarding any cattle outside of it. The lane is defined by the leftmost pixel at position 1120 and the rightmost pixel at position 1870. The combined detection area had a width of 750 pixels and a height of 1965 pixels.
The region of interest for Farm C is limited to the leftmost 150 pixels and the rightmost position at 1750 pixels. We discard any cattle that have a bounding box height and width of less than 600 pixels and 250 pixels, as these dimensions do not encompass the entire body of the cattle. Figure 7 provides a description of the ROI (region of interest) of all the test environments.
Figure 7.
ROI region of three test environments.
Cattle detection
In the detecting stage, YOLOv8 object detection is applied to detect cattle within the region of interest (ROI) of the lane. The YOLOv8 architecture has been selected for its superior mean average precisions (mAPs) and reduced inference speed on the COCO dataset, establishing it as the presumed cutting-edge technology (Reis et al., 2023)26. The architecture exhibits a structure comprising a neck, head, and backbone, similar to the YOLOv5 model27,28. Due to its updated architecture, enhanced convolutional layers (backbone), and advanced detecting head, it is a highly commendable choice for real-time object detection. YOLOv8 supports instance segmentation, a computer vision technique that allows for the recognition of many objects within an image or video. The model utilizes the Darknet-53 backbone network, which supersedes the YOLOv729–31 network, to achieve improved speed and accuracy. YOLOv8 utilizes an anchor-free detection head to make predictions about bounding boxes. The enhanced convolutional network and expanded feature map of the model result in improved accuracy and faster performance, rendering it more efficient than previous versions. YOLOv8 incorporates feature pyramid networks32 to effectively recognize objects of different sizes. The Tables 3 and 4 describe the model performance on both the training and testing sets for Farm A and Farm C.
Table 3.
Performance matric of Farm A on training and testing dataset.
| Dataset | Precision | Recall | F1 Score | mAP50 | mAP50:95 |
|---|---|---|---|---|---|
| Training testing | 0.99 | 1.00 | 1.00 | 0.99 | 0.96 |
| 0.93 | 0.97 | 0.95 | 0.98 | 0.90 |
Table 4.
Performance matric of Farm C on training and testing dataset.
| Dataset | Precision | Recall | F1 Score | mAP50 | mAP50:95 |
|---|---|---|---|---|---|
| Training testing | 0.94 | 0.94 | 0.94 | 0.98 | 0.97 |
| 0.97 | 0.94 | 0.95 | 0.98 | 0.98 |
Cattle tracking
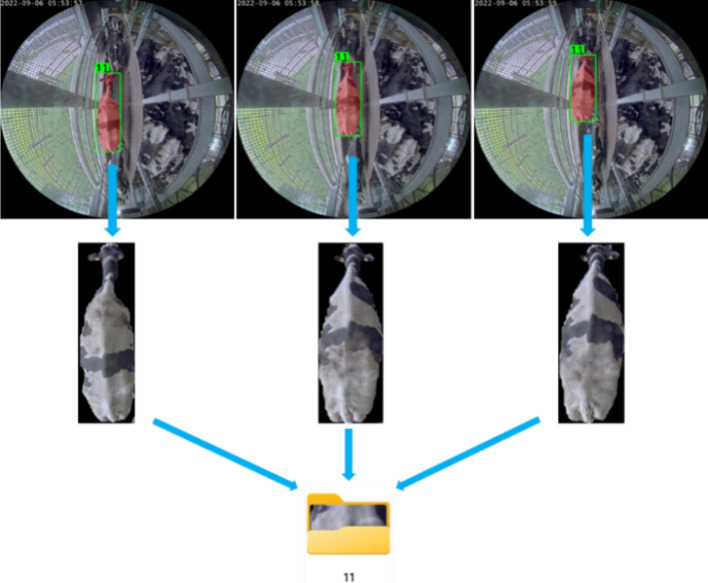
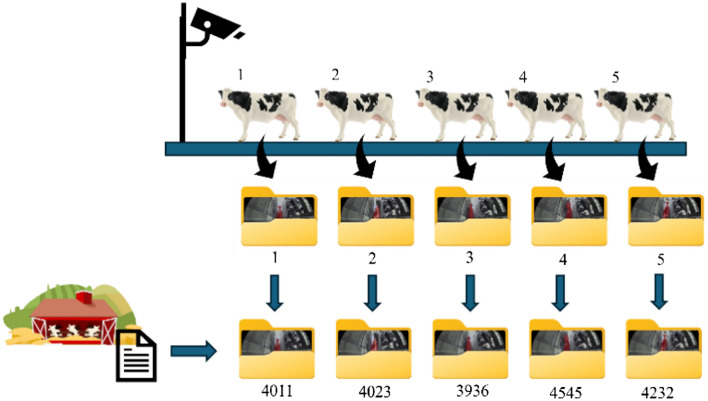
During this tracking phase, detected cattle are tracked and assigned a unique local identifier, such as 1, 2… N. Additionally, it is beneficial for counting livestock, particularly cattle. Cattle tracking in this system was used for two stages, the same as the detection stage, data collection for training, and improving the identification process. For data collection, the detected cattle were labeled by locally generated ID. Locally labeled detected cattle were categorized into individual folders followed by their local ID as shown in Fig. 8.
Figure 8.
Sample result of creating folder and saving images based on the tracked ID.
The categorized folders were re-named according to the ground truth ID provided by the Farm. The re-named folders were used as the dataset for the identification process. Figure 9 illustrates the tracking process of the proposed system.
Figure 9.
Illustration of the tracking process.
Tracking in farm A and farm B
For tracking the cattle in Farm A and Farm B, the top and bottom positions of the bounding box are used stead of centroid because the cattle are moving from bottom to top, and there are no parallel cattle in the lane.
Tracking in farm C
For tracking the cattle in Farm C, left and right positions of the bounding boxes are used due to the fact that the cattle dataset are on the rotary milking machine which is rotating right to left whereas cattle moving bottom to top in other two farm.
Tracking method
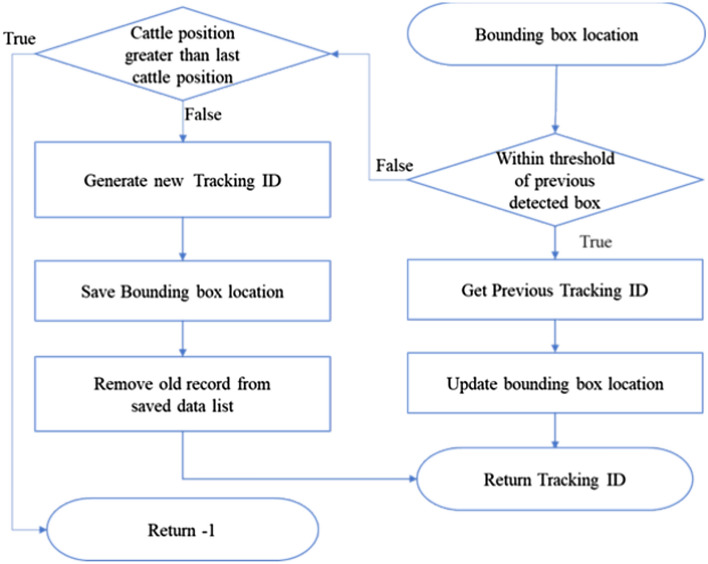
The tracking used in this system is a customized method and it is based on the either top and bottom or left and right position of each bounding box instead of the whole box. It is because even though the cattle are going in one direction, they are not stacked inside the lane or the rotary machine. The bounding box boundaries in Farm A and Farm B sometimes overlapped over 70% of the bounding box. The tracking method was calculated based on the difference between the y1 (top pixel position of the bounding box) and the y2 (bottom pixel position of the bounding box) for Kunneppu Demonstration Farm and Sumiyoshi Farm, and x1 (left pixel position of the bounding box) and the x2 (right pixel position of the bounding box) with previous frames. If the current bounding box position is within the + or − of threshold (200 pixels), then we can take the previously saved tracking ID and update the existing y1/ x1 and y2/ x2 locations. Otherwise, generate a new tracking ID and save the y1/ x1, and y2/ x2 positions of the bounding box. Before generating a new cattle ID, we check the new cattle position because the newly detected cattle can also be old cattle which was discarded due to missed count reaching the threshold. When this happens then the new Cattle ID is not generated, and the cattle is ignored. The flowchart of the cattle tracking process can be seen in Fig. 10.
Figure 10.
Flowchart of the tracking process for the proposed system.
Improving identification result with tracking
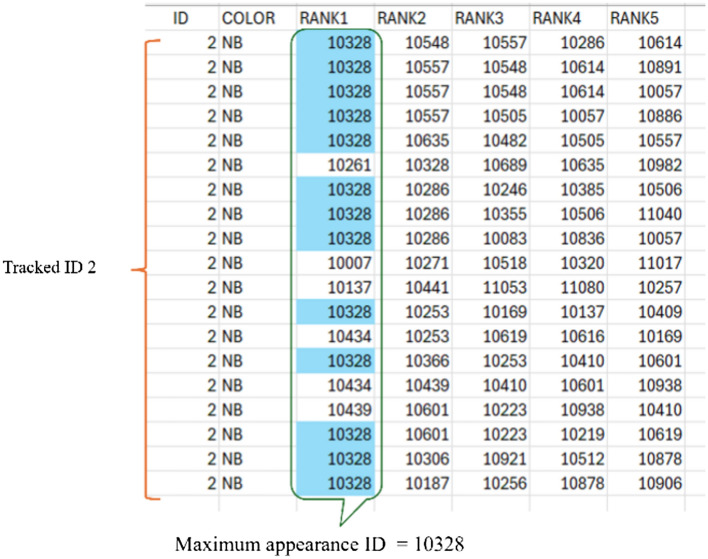
In the identification process, some cattle do not have constant predicted results from the classifier. It can be due to the poor light source, dirt on the camera, lighting being too bright, and other cases that might disturb the clarity of the images. In such cases, the tracking process is used to generate local ID which is used to save along with the predicted cattle ID to get finalized ID for each detected cattle. The finalized ID is obtained by taking the maximum appeared predicted ID for each tracking ID as shown in Fig. 11 and used to label each tracked cattle in individual videos. By doing this way, the proposed system not only solved the ID switching problem in the identification process but also improved the classification accuracy of the system.
Figure 11.
Improving identification result with tracking.
Feature extraction
In the feature extraction stage, VGG16 is applied to extract cattle features in each tracked folder. VGG16 is a deep convolutional neural network (CNN) widely used for image classification, proposed by Simonyan and Zisserman (2014), achieved impressive results in large-scale image recognition. Their paper, titled "Very Deep Convolutional Networks for Large-Scale Image Recognition," explored the impact of network depth on accuracy34. Its architecture, depicted in Fig. 12, incorporates 16 weight layers: 13 convolutional layers and 3 fully connected layers. All convolutional layers utilize a 3 × 3 kernel size, 1-pixel padding, and the ReLU activation function. Five max-pooling layers with a 2 × 2 filter and stride 2 reduce spatial resolution progressively. A flattened layer precedes the fully connected layers, which culminates in the final output layer with 1000 neurons and the SoftMax activation function for 1000 output classes. This model contains a total of 138,357,544 trainable parameters35.
Figure 12.
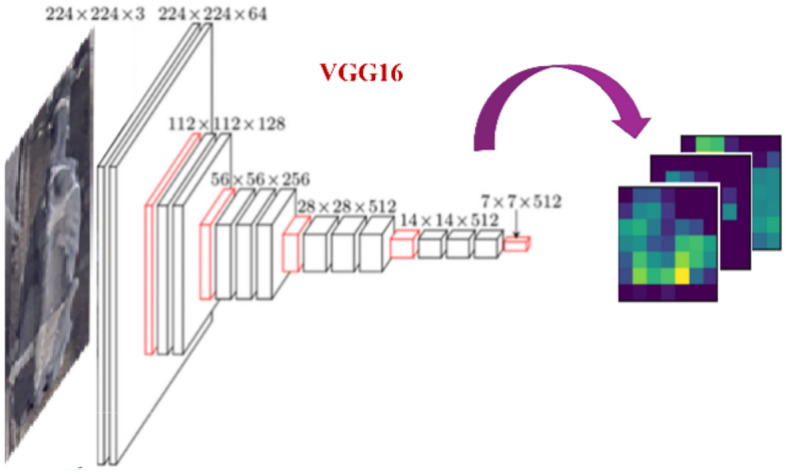
VGG16 architecture.
Cattle identification
In the identification process, SVM classifier is used in this research. The SVM classifier is a powerful supervised learning algorithm used for classification and regression tasks. SVM works by finding the hyperplane in a high-dimensional space that maximally separates the different classes36. Support Vector Machines (SVM) effectively define decision boundaries by optimizing the distance between different data classes. They demonstrate exceptional proficiency in categorizing data that can be separated by a straight line, but their adaptability extends to more complex data sets with the use of kernel techniques. SVMs aim to find a hyperplane37 that can be expressed as in (1):
| 1 |
where w determines the orientation of the hyperplane and b adjusts its position relative to the origin. The data points are on either side of the line, and their placement is decided by the sign of . The brilliance of the hyperplane resides in its ability to maximize the margin, which refers to the wide gap between the hyperplane and the nearest data points, known as support vectors.
For image classification, the high-dimensional space is typically the space of features extracted from the images. The SVM classifier can be trained using a set of labeled cattle IDs in the ground truth in this thesis, where each example is represented as a feature vector and associated with a class label42 .
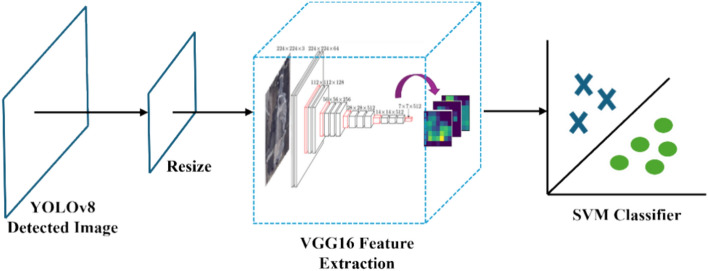
In the VGG16 model, the SoftMax activation function was used to classify the final output at the last layer. Connect the SVM classifier as shown in Fig. 13 in place of the SoftMax activation function in VGG16 to utilize the VGG16-SVM model.
Figure 13.
VGG16-SVM architecture.
The collected cattle images which were grouped by their ground-truth ID after tracking results were used as datasets to train in the VGG16-SVM. VGG16 extracts the features from the cattle images inside the folder of each tracked cattle, which can be trained with the SVM for final identification ID. After extracting the features in the VGG16 the extracted features were trained in SVM. When the training is done, the trained SVM can be used to predict the cattle ID by extracting features from the feature extractor or input image.
Identification of black and non-black cattle
Detecting black cattle is crucial for cattle identification, especially when distinguishing patterns on black coats proves challenging for the human eye. The cattle dataset was partitioned into two subsets: black cattle and non-black cattle. Each subgroup was then trained separately using the VGG16-SVM model.
In our methodology, we employed the non-black weight as a predictor for non-black cattle and the black weight as a predictor for black cattle. Prior to producing predictions in VGG16-SVM, it was necessary to define a threshold for differentiating between black and white pixels following the conversion of the image to grayscale. Considering the variation in lighting conditions for each individual cattle, we established a dynamic threshold for each particular instance. In order to determine this threshold, we performed a multiplication operation between the highest pixel intensity value in the grayscale image and a pre-established threshold factor (0.75) as in Eq. (2):
| 2 |
where max_intensity represents the brightness or color value of a pixel in an image. In grayscale images, the intensity usually represents the level of brightness, where higher values correspond to brighter pixels. In an 8-bit grayscale image, each pixel is assigned a single intensity value ranging from 0 to 255. A value of 0 corresponds to black, indicating no intensity, while a value of 255 represents white, indicating maximum intensity. The level of brightness at a particular pixel dictates the degree of grayness in that area of the image.
Subsequently, we computed the count of white pixels by distinguishing pixels with values above the specified threshold. Furthermore, we determined the percentage of white pixels by using the following formula (3):
| 3 |
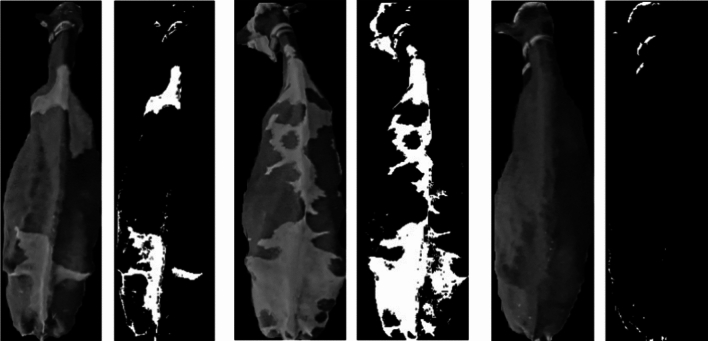
If the percentage of white pixels is lower than a predetermined threshold of 1%, we categorize the cattle as black. Otherwise, we make a prediction for the cattle using the weight of the non-black VGG16-SVM model. By utilizing an adaptive technique, we are able to accurately detect black cattle by dynamically determining grayscale thresholds. The below Fig. 14 represents the sample of determining the cattle into black or non-black cattle. The left two pairs of cattle images are non-black cattle, and the right one is black cattle by taking account into the white pixel percentage of individual cattle image.
Figure 14.
Cattle images in gray scale (left) and applying threshold(right) on each cattle.
Identification of unknown cattle
Even though we have collected dataset for the whole day in the farm, there are many unknown cattle in different day. To identify these "Unknown" cattle, we implemented a simple rule based on the frequency of predicted IDs. We analyze the final predicted ID list for each cattle. If the most frequently appearing ID for a given cattle falls below a pre-defined threshold (10), we classify it as Unknown. Otherwise, the most frequent ID becomes the identified label. For the known cattle, the predicted IDs are stable and there are not too many switches while predicted ID for Unknown cattle are switching frequently and max predicted occurrence is lower compared to known cattle.
This approach leverages the observation that known cattle exhibit consistent predicted IDs across the images, whereas unknowns tend to show more frequent switching between different IDs. By setting a threshold based on analysis of known versus unknown cattle behavior, we effectively filter out individuals do not present in our training data. These unknowns are readily recognizable in the system by their designated labels, "Unknown 1…N."
Model evaluation
To evaluate the robustness of our classification model, we used the k-fold cross-validation method and employed fivefold cross-validation. This method ensures that each fold of the dataset maintains the same class distributions as the original dataset, reducing potential biases in model evaluation. The procedure involves training the model on four folds and validating it on the remaining fold, iterating this process five times means that each fold serves as a validation set exactly once.
The performance of the model was assessed using accuracy and precision metrics for each fold. The mean and standard deviation of these metrics provide a measure of the model’s stability and reliability. The dataset was split into 5 folders as A, B, C, D, and E. When A is serving as a validation dataset, the remaining 4 folders serve as a training dataset. Each folder served as validation once in turn. In the Table 5, Fold represents each fold of the cross-validation (1–5), Accuracy represents the accuracy score obtained for each fold, Precision represents the precision score obtained for each fold, Mean represents the mean accuracy and precision across all folds, Std represents the standard deviation of accuracy and precision scores across all folds.
Table 5.
Fivefold cross-validation results.
| Fold | Accuracy | Precision |
|---|---|---|
| 1 | 0.94 | 0.95 |
| 2 | 0.95 | 0.95 |
| 3 | 0.96 | 0.96 |
| 4 | 0.94 | 0.95 |
| 5 | 0.96 | 0.96 |
| Mean | 0.95 | 0.95 |
| Std | 0.01 | 0.01 |
The fivefold cross-validation results, with a mean accuracy of 0.95 and precision of 0.95, along with their respective standard deviations of 0.01, provide strong evidence of the proposed model’s robustness and reliability. The consistent performance across different folds suggests that the model is likely to perform well, effectively balancing correctness and precision in identification.
Experimental results and analysis
This session explains all the experiments involved in pursuing this research, with the respective results of the three primary phases of the system: detection, tracking, and identification. The robustness of our approach is demonstrated by the experimental findings obtained from the given video sequences.
Cattle detection
In our test farms, cattle motion patterns differed across farms; Farm A and Farm B followed a bottom-to-top approach, while Farm C featured right-to-left movement. The training parameters of two farms for YOLOv8 detector are outlined in Table 6. For training with YOLOv8, the training parameters separation is the same for all environments in this research. The datasets were split in to 7:3 for training and validation as in Table 7. Following training, the generated weights were saved for deployment in the testing phase.
Table 6.
Dataset used for training of cattle detection.
| No | Data | Parameter | Value |
|---|---|---|---|
| 1 | Farm A | Network image size | 640*640 |
| Class | cow | ||
| #Epoch | 150 | ||
| Batch Size | 16 | ||
| Initial Learning rate | 0.01 | ||
| 2 | Farm C | Network image size | 640*640 |
| Class | cow | ||
| #Epoch | 300 | ||
| Batch Size | 16 | ||
| Initial Learning rate | 0.01 |
Table 7.
Data preparation for YOLOv8 model.
| No | Date | Total images (100%) | Training set (70%) | Validation set(70%) | Network model |
|---|---|---|---|---|---|
| 1 | Farm A | 1,027 | 719 | 308 | YOLOv8n |
| 2 | Farm C | 421 | 295 | 126 |
The performance of the detection is evaluated by calculating precision, recall, and mAP at an IOU threshold of 0.5. The equation used to calculate the precision, recall, and accuracy are shown as in (4), (5) and (6):
| 4 |
| 5 |
| 6 |
where TP (True Positive) represents the bounding boxes with the target object that were correctly detected, and FN (False Negative) means the existing target object was not detected. FP (False Positive) is represented when the background was wrongly detected as cattle. TN (True Negative) indicates the probability of a negative class in image classification. In this study, only True Positive and False Positive will be used to evaluate the performance.
Detection results of farm A and farm B
For training of detection in Farm A, a total number of 1,027 images were selected from the video as dataset for YOLOv8 and trained. The trained weight is also applied at Farm B due to the similarity in cattle walking direction and body structure, despite the difference in farms and cattle. For detecting result of the cattle can be seen in Table 8.
Table 8.
Testing performance of detection in Farm A and Farm B.
| Model | mAP@0.5 (%) | mAP@0.5:0.95 (%) | Precision(%) | Recall (%) |
||
|---|---|---|---|---|---|---|
| Mask | Box | Mask | Box | |||
| YOLOv8n | 98.6 | 98.5 | 92.4 | 93.4 | 98.3 | 99.3 |
Detection result of farm C
A total of 421 cattle images were selected from the videos for training on the Farm C dataset, using the YOLOv8n model. Due to the difference between the cattle images obtained from Farm A, Farm B, and Farm C, it is not possible to utilize the previously trained weight. Consequently, a different weight has to be trained specifically for Farm C. The detection result on cattle is presented in Tables 8, 9.
Table 9.
Testing performance of detection in Farm C.
| Model | mAP@0.5 (%) | mAP@0.5:0.95 (%) | Precision(%) | Recall (%) |
||
|---|---|---|---|---|---|---|
| Mask | Box | Mask | Box | |||
| YOLOv8n | 97.2 | 97.1 | 95.3 | 96.2 | 97.1 | 98.2 |
Cattle tracking
For the tracking, it is used in both generating training dataset and testing for the identification method. The usage of tracking in this research is to collect the training dataset to train in feature extraction and identification, to improve the accuracy of the identification system by taking the finalize predicted cattle ID based on the number appearance of predicted cattle ID for each cattle, and to solve the ID-switching problem. ID-switching occurs when the identification system incorrectly predicted the cattle ID, and the cattle is labeled with incorrect ID. In this system, the ID-switching problem was solved by taking the consideration of the number of max predicted ID from the system.
The performance of cattle tracking system is evaluated by the following Eq. (7):
| 7 |
where TP is the number of correctly tracked cattle and Number of cattle is the total number of cattle in the testing video.
Tracking result of farm A
To evaluate the tracking accuracy of the system for Farm A, a total of 71 videos (355 min long) in the Morning and 75 videos (375 min long) in the Evening. These videos specifically included cattle and were recorded on the 22nd and 23rd of July, as well as the 4th and 5th of September, and the 29th and 30th of December 2022. Morning and Evening videos of each day contained the total cattle from a range of 56–65. According to the results, there were some ID-switched cattle due to the False Negative from the YOLOv8 detector. This issue was more common in morning recordings due to poor lighting conditions. The result of the cattle tracking sample is presented in Fig. 15.
Figure 15.
Example of cattle tracking results in Farm A.
The tracking results for both the Morning and Evening of each day, as detected through the utilization of the YOLOv8 detection model can be seen in Table 10. The table describes the date used to test, total number of cattle (also defined as GT: Ground Truth), correctly and incorrectly tracked cattle count, and the accuracy of the tracking phase.
Table 10.
Testing performance of tracking in Farm A.
| No | Date | #Cattle (GT) | #CorrectlyTracked Cattle | #IncorrectlyTracked Cattle | Accuracy (%) |
|---|---|---|---|---|---|
| 1 | 22nd July 2022 Morning | 65 | 65 | 0 | 100 |
| 2 | 22nd July 2022 Evening | 65 | 65 | 0 | 100 |
| 3 | 23rd July 2022 Morning | 64 | 64 | 0 | 100 |
| 4 | 23rd July 2022 Evening | 56 | 56 | 0 | 100 |
| 5 | 4th Sept 2022 Morning | 56 | 56 | 0 | 100 |
| 6 | 4th Sept 2022 Evening | 64 | 64 | 0 | 100 |
| 7 | 5th Sept 2022 Morning | 64 | 64 | 0 | 100 |
| 8 | 5th Sept 2022 Evening | 64 | 64 | 0 | 100 |
| 9 | 29th Dec 2022 Morning | 61 | 57 | 4 | 93.44 |
| 10 | 29th Dec 2022 Evening | 61 | 60 | 1 | 98.36 |
| 11 | 30th Dec 2022 Morning | 61 | 60 | 1 | 98.36 |
| 12 | 30th Dec 2022 Evening | 61 | 55 | 6 | 90.16 |
Tracking result of farm B
There are 12 cattle in Farm B in each day's recordings, and we have conducted our testing on Morning and Evening of 21st, 22nd, 23rd, 24th and 25th of the July 2023 as testing data. The tracking results for the cattle of Farm B are presented in Fig. 16. Table 11 describes the date used to test, total number of cattle (also defined as GT: Ground Truth), correctly and incorrectly tracked cattle count, and the accuracy of the tracking phase.
Figure 16.
Example of cattle tracking results in Farm B.
Table 11.
Testing performance of tracking in Farm B.
| No | Date | #Cattle (GT) | #CorrectlyTracked Cattle |
#IncorrectlyTracked Cattle |
Accuracy (%) |
|---|---|---|---|---|---|
| 1 | 21st July 2023 Morning | 12 | 12 | 0 | 100 |
| 2 | 21st July 2023 Evening | 12 | 11 | 1 | 91.67 |
| 3 | 22nd July 2023 Morning | 12 | 12 | 0 | 100 |
| 4 | 22nd July 2023 Evening | 12 | 12 | 0 | 100 |
| 5 | 23rd July 2023 Morning | 12 | 12 | 0 | 100 |
| 6 | 23rd July 2023 Evening | 12 | 12 | 0 | 100 |
| 7 | 24th July 2023 Morning | 12 | 12 | 0 | 100 |
| 8 | 24th July 2023 Evening | 12 | 12 | 0 | 100 |
| 9 | 25th July 2023 Morning | 12 | 12 | 0 | 100 |
| 10 | 25th July 2023 Evening | 12 | 11 | 1 | 91.67 |
Tracking result of farm C
The tracking in Farm C is different from Farm A and Farm B in the movement and the image of cattle body. Therefore, the tracking method was adjusted to track cattle from right to left of the detected bounding box. The testing date is on 31st of July and 1st of Aug and recorded videos include a total of 252 and 258 cattle respectively. The sample result of the cattle tracking in Honkawa Farm is described in Fig. 17. Table 12 illustrates the date used to test, total number of cattle (also defined as GT: Ground Truth), correctly and incorrectly tracked cattle count, and the accuracy of the tracking phase.
Figure 17.
Example of cattle tracking results in Farm C.
Table 12.
Testing performance of tracking in Farm C.
| No | Date | #Cattle (GT) | #CorrectlyTrackedCattle | #IncorrectlyTrackedCattle | Accuracy (%) |
|---|---|---|---|---|---|
| 1 | 31st July 2023 | 252 | 252 | 0 | 100 |
| 2 | 1st Aug 2023 | 258 | 258 | 0 | 100 |
Comparative analysis of results for tracking
Among the three farms, Farm C has the highest tracking accuracy. This is mostly because the illumination is consistently maintained and there are no issues of excessive or insufficient brightness on the rotary milking machine. The videos taken at Farm A throughout certain parts of the morning and evening have too bright and inadequate illumination as in Fig. 18.
Figure 18.
Poor brightness and over brightness condition.
Cattle identification
For identification, the datasets were split into black and non-black cattle. This allowed the VGG16-SVM pair to identify black cattle within the black-weight category. VGG16 extracts features from detected and tracked cattle, and these features are then fed into the SVM for cattle ID recognition. The predicted cattle IDs, along with their corresponding tracking IDs, are ranked and captured in the "RANK1," "RANK2," …, "RANK5" columns of an Excel spreadsheet. This sample CSV file demonstrates the storage format for predicted cattle IDs and their associated tracking IDs as shown in Fig. 19.
Figure 19.
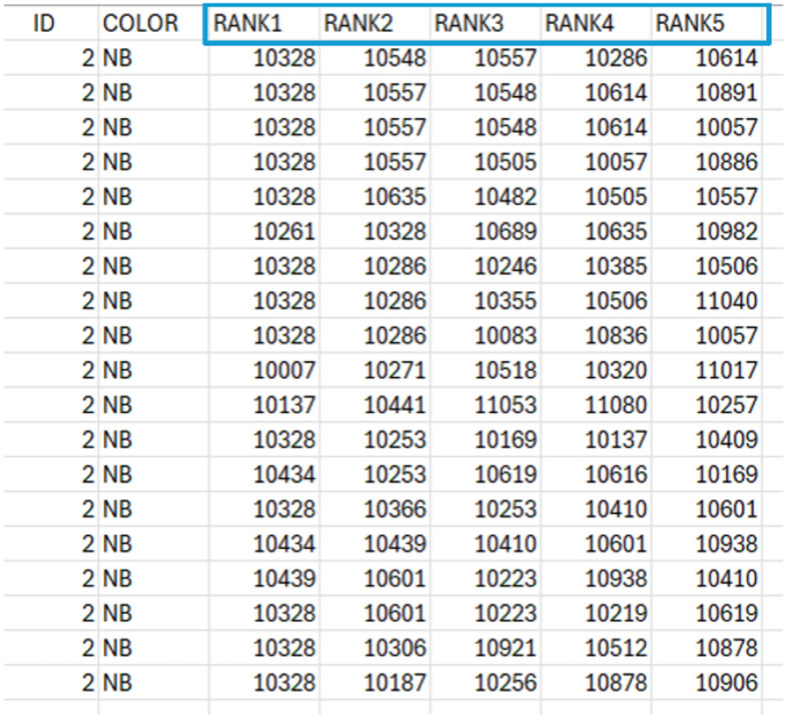
Data format of Tracking ID, color and predicted IDs’ ranks in a CSV file.
To determine the final ID for each tracked cattle, we count the appearances of each predicted ID within the region of interest for that cattle. The ID with the highest count is then assigned as the final cattle ID. For example, the final predicted ID for tracked ID 2 of Fig. 20 is 10,328 because the total number of 10328 is higher than the other predicted IDs in RANK1, the sample result is shown in Fig. 20.
Figure 20.
Taking final cattle ID based on maximum appearance ID of tracked cattle.
The performance of cattle identification system is evaluated by the following Eq. (8):
| 8 |
where TP is the number of correctly identified cattle and Number of cattle is the total number of cattle in the testing video.
Identification result of farm A
In Farm A, there were no Unknown cattle included in testing data, only Black cattle and Non-Black cattle contained. The testing videos were same date as the testing videos from tracking stage, total of 6 days. The identification results for the cattle of Farm A are presented in Fig. 21. Table 13 describes the date used to test, total number of cattle (also defined as GT: Ground Truth), correctly and incorrectly identified cattle count, and the accuracy of the identification on the cattle of Farm A.
Figure 21.
Example of cattle identification results in Farm A.
Table 13.
Testing performance of identification in Farm A.
| No | Date | #Cattle (GT) | #CorrectlyIdentifiedCattle | #IncorrectlyIdentifiedCattle | Accuracy (%) |
|---|---|---|---|---|---|
| 1 | 22nd July 2022 Morning | 65 | 57 | 8 | 87.69 |
| 2 | 22nd July 2022 Evening | 65 | 59 | 6 | 90.77 |
| 3 | 23rd July 2022 Morning | 64 | 61 | 3 | 95.31 |
| 4 | 23rd July 2022 Evening | 56 | 51 | 5 | 91.07 |
| 5 | 4th Sept 2022 Morning | 56 | 54 | 2 | 96.43 |
| 6 | 4th Sept 2022 Evening | 64 | 52 | 8 | 81.25 |
| 7 | 5th Sept 2022 Morning | 64 | 60 | 4 | 93.75 |
| 8 | 5th Sept 2022 Evening | 64 | 62 | 2 | 96.88 |
| 9 | 29th Dec 2022 Morning | 61 | 57 | 4 | 93.44 |
| 10 | 29th Dec 2022 Evening | 61 | 56 | 5 | 91.80 |
| 11 | 30th Dec 2022 Morning | 61 | 59 | 2 | 96.72 |
| 12 | 30th Dec 2022 Evening | 61 | 55 | 6 | 90.16 |
Identification result of farm B
In Farm B, there are only a total of 13 cattle, and the cattle dataset does not include the Unknown cattle and Black cattle. The datasets are a total of 5 day testing videos. The result of the cattle identification sample in Farm B is presented in Fig. 22. Table 14 illustrates the date used to test, total number of cattle (also defined as GT: Ground Truth), correctly and incorrectly identified cattle count, and the accuracy of the identification on the cattle of Farm B.
Figure 22.
Example of cattle identification results in Farm B.
Table 14.
Testing performance of identification in Farm B.
| No | Date | #Cattle (GT) | #CorrectlyIdentifiedCattle | #IncorrectlyIdentifiedCattle | Accuracy (%) |
|---|---|---|---|---|---|
| 1 | 21st July 2023 Morning | 12 | 12 | 0 | 100 |
| 2 | 21st July 2023 Evening | 12 | 11 | 1 | 91.67 |
| 3 | 22nd July 2023 Morning | 12 | 12 | 0 | 100 |
| 4 | 22nd July 2023 Evening | 12 | 12 | 0 | 100 |
| 5 | 23rd July 2023 Morning | 12 | 12 | 0 | 100 |
| 6 | 23rd July 2023 Evening | 12 | 12 | 0 | 100 |
| 7 | 24th July 2023 Morning | 12 | 12 | 0 | 100 |
| 8 | 24th July 2023 Evening | 12 | 12 | 0 | 100 |
| 9 | 25th July 2023 Morning | 12 | 11 | 1 | 91.67 |
| 10 | 25th July 2023 Evening | 12 | 11 | 1 | 91.67 |
Identification result of farm C
In Farm C, the testing videos contained both Unknown and Black cattle. The testing was conducted on 31st July and 1st Aug, 2023 and there are 252 and 258 cattle in the testing videos respectively. The sample result of the cattle identification in Farm C is described in Fig 23. Table 15 describes the date used to test, total number of cattle (also defined as GT: Ground Truth), correctly and incorrectly identified cattle count, and the accuracy of the identification on the cattle of Farm C.
Figure 23.
Example of cattle identification results in Farm C.
Table 15.
Testing performance of identification in Farm C.
| No | Date | #Cattle (GT) | #CorrectlyTrackedCattle | #IncorrectlyTrackedCattle | Accuracy (%) |
|---|---|---|---|---|---|
| 1 | 31st July 2023 | 252 | 252 | 0 | 100 |
| 2 | 1st Aug 2023 | 258 | 255 | 3 | 98.83 |
Overall performance analysis
From the analysis of experimental results, final performance of the system in tracking and identification are evaluated by taking the average from three farms. The equation to calculate the overall performance for each stage is described as in Eqs. (9) and (10):
| 9 |
| 10 |
By the above equations, over a three farms average, the proposed system achieved tracking accuracy of 98.90% and identification accuracy of 96.34%.
Conclusion
This automatic cattle identification system for identifying the cattle by their back pattern from the images captured by the camera above the cattle. Notably, the system exhibits robustness against challenging cases like black cattle and previously unseen individuals ("Unknown"). Its effectiveness has been demonstrated through extensive testing on three distinct farms, tackling tasks ranging from general cattle identification to black cattle identification and unknown cattle identification.
The system employs the cutting-edge YOLOv8 algorithm for cattle detection. YOLOv8 demonstrates impressive speed surpassing the likes of YOLOv5, Faster R-CNN, and EfficientDet. The accuracy of the model is also remarkable, with a mean average precision (mAP) of 0.62 at an intersection over union (IOU) threshold of 0.5 on the test dataset. This outperforms its nearest rival, YOLOv5, by a margin of 0.04. EfficientDet and Faster R-CNN get mAP@0.5 scores of 0.47 and 0.41, respectively.
In order to effectively track the movement of cattle, we have developed a customized algorithm that utilizes either top-bottom or left-right bounding box coordinates. The selection of these coordinates is made dynamically, taking into consideration the observed patterns of movement within each individual farm. This method tackles the issue of ID-switching, a prevalent obstacle in tracking systems. To enhance identification accuracy, we concluded the process of assigning cattle IDs by choosing the ID that was predicted most frequently. This approach ensures consistency and minimizes misidentifications.
We utilized the powerful combination of VGG16 and SVM to completely recognize and identify individual cattle. VGG16 operates as a feature extractor, systematically identifying unique characteristics from each cattle image. These characteristics are subsequently inputted into a Support Vector Machine (SVM), which is tightly connected to the final SoftMax layer of VGG16, in order to achieve accurate identification. The predicted ID and its related tracking ID are carefully recorded in a CSV file, creating a thorough database for determining the final ID in the future. To address the potential presence of unknown cattle, we thoughtfully store additional RANK2 data, ensuring comprehensive coverage of various identification scenarios.
There are Black and Non-Black cattle in testing videos. The process of differentiating between black and non-black cattle during testing yielded significant advantages. This separation not only reduced the occurrence of misidentifications for both groups, but also improved the accuracy of identification specifically for black cattle. Identifying unknown cattle, however, presented a significant challenge. To address this issue, we resolved it by implementing a threshold that is determined by the frequency of the most commonly predicted ID (RANK1). If the count drops below a pre-established threshold, we do a more detailed examination of the RANK2 data to identify another potential ID that occurs frequently. The cattle are identified as unknown only if both RANK1 and RANK2 do not match the threshold. Otherwise, the most frequent ID (either RANK1 or RANK2) is issued to ensure reliable identification for known cattle.
Acknowledgements
We would like to thank the persons concerned from Kunneppu Demonstration Farm, Sumiyoshi Farm and Honkawa Farm for giving every convenience of the study on the farm and their valuable advice.
Author contributions
Conceptualization, S.L.M., T.T.Z. and P.T.; methodology, S.L.M., T.T.Z. and P.T.; software, S.L.M; investigation, S.L.M., T.T.Z., P.T., M.A., T.O. and I.K.; resources, T.T.Z. and I.K.; data curation, T.T.Z., M.A. and T.O.; writing—original draft preparation, S.L.M.; writing—review and editing, T.T.Z. and P.T.; visualization, S.L.M., T.T.Z. and P.T.; supervision, T.T.Z.; project administration, T.T.Z. All authors reviewed the manuscript.
Funding
This work was supported in part by “The Development and demonstration for the realization of problem-solving local 5G” from the Ministry of Internal Affairs and Communications and the Project of “the On-farm Demonstration Trials of Smart Agriculture” from the Ministry of Agriculture, Forestry and Fisheries (funding agency: NARO). This publication is subsidized by JKA through its promotion funds from KEIRIN RACE.
Data availability
The datasets used and/or analysed during the current study available from the corresponding author on reasonable request.
Competing interests
The authors declare no competing interests.
Footnotes
Publisher's note
Springer Nature remains neutral with regard to jurisdictional claims in published maps and institutional affiliations.
References
- 1.Smith, J. Technological innovations in agriculture: A comprehensive overview. J. Agric. Technol.45(2), 112–129 (2023). [Google Scholar]
- 2.Berckmans, D. Precision livestock farming technologies for welfare management in intensive livestock systems. Rev. Sci. Tech. Int. Off. Epizoot.33, 189–196 (2014). 10.20506/rst.33.1.2273 [DOI] [PubMed] [Google Scholar]
- 3.Zhang, R. et al. A cascaded individual cow identification method based on DeepOtsu and efficientnet. Agriculture13, 279. 10.3390/agriculture13020279 (2023). 10.3390/agriculture13020279 [DOI] [Google Scholar]
- 4.Okura, F. et al. RGB-D video-based individual identification of dairy cows using gait and texture analyses. Comput. Electron. Agric.165, 104944. 10.1016/j.compag.2019.104944 (2019). 10.1016/j.compag.2019.104944 [DOI] [Google Scholar]
- 5.Qiao, Y., Su, D., Kong, H., Sukkarieh, S., Lomax, S., Clark, C. Individual cattle identification using a deep learning based framework. In IFAC-Pap., 6th IFAC Conference on Sensing, Control and Automation Technologies for Agriculture AGRICONTROL 52, 318–323 (2019). 10.1016/j.ifacol.2019.12.558.
- 6.Kashiha, M. et al. Automatic identification of marked pigs in a pen using image pattern recognition. Comput. Electron. Agric.93, 111–120. 10.1016/j.compag.2013.01.013 (2013). 10.1016/j.compag.2013.01.013 [DOI] [Google Scholar]
- 7.Drach, U., Halachmi, I., Pnini, T., Izhaki, I. & Degani, A. Automatic herding reduces labour and increases milking frequency in robotic milking. Biosyst. Eng.155, 134–141. 10.1016/j.biosystemseng.2016.12.010 (2017). 10.1016/j.biosystemseng.2016.12.010 [DOI] [Google Scholar]
- 8.Behroozi Khazaei, N., Tavakoli, T., Ghassemian, H., Khoshtaghaza, M. H. & Banakar, A. Applied machine vision and artificial neural network for modeling and controlling of the grape drying process. Comput. Electron. Agric.98, 205–213. 10.1016/j.compag.2013.08.010 (2013). 10.1016/j.compag.2013.08.010 [DOI] [Google Scholar]
- 9.Nadimi, E. S., Jørgensen, R. N., Blanes-Vidal, V. & Christensen, S. Monitoring and classifying animal behavior using ZigBee-based mobile ad hoc wireless sensor networks and artificial neural networks. Comput. Electron. Agric.82, 44–54. 10.1016/j.compag.2011.12.008 (2012). 10.1016/j.compag.2011.12.008 [DOI] [Google Scholar]
- 10.Johnson, A. & Brown, L. Historical perspectives on cattle identification methods. Livestock Sci.72(4), 221–236 (2019). [Google Scholar]
- 11.Williams, R. et al. Challenges and limitations of traditional cattle identification methods. J. Animal Husb.88(3), 145–162 (2020). [Google Scholar]
- 12.Sian, C., Jiye, W., Ru, Z. & Lizhi, Z. Cattle identification using muzzle print images based on feature fusion. IOP Conf. Ser. Mater. Sci. Eng.853, 012051. 10.1088/1757-899X/853/1/012051 (2020). 10.1088/1757-899X/853/1/012051 [DOI] [Google Scholar]
- 13.Lu, Y., He, X., Wen, Y. & Wang, P. S. P. A new cow identification system based on iris analysis and recognition. Int. J. Biom.6, 18–32. 10.1504/IJBM.2014.059639 (2014). 10.1504/IJBM.2014.059639 [DOI] [Google Scholar]
- 14.Allen, A. et al. Evaluation of retinal imaging technology for the biometric identification of bovine animals in Northern Ireland. Livest. Sci.116, 42–52. 10.1016/j.livsci.2007.08.018 (2008). 10.1016/j.livsci.2007.08.018 [DOI] [Google Scholar]
- 15.Kim, H. T., Ikeda, Y. & Choi, H. L. The identification of Japanese black cattle by their faces. Asian-Australas. J. Anim. Sci.18, 868–872. 10.5713/ajas.2005.868 (2005). 10.5713/ajas.2005.868 [DOI] [Google Scholar]
- 16.Li, W., Ji, Z., Wang, L., Sun, C. & Yang, X. Automatic individual identification of Holstein dairy cows using tailhead images. Comput. Electron. Agric.142, 622–631. 10.1016/j.compag.2017.10.029 (2017). 10.1016/j.compag.2017.10.029 [DOI] [Google Scholar]
- 17.Hossain, M. E. et al. A systematic review of machine learning techniques for cattle identification: Datasets, methods, and future directions. Artif. Intell. Agric.6, 138–155. 10.1016/j.aiia.2022.09.002 (2022). 10.1016/j.aiia.2022.09.002 [DOI] [Google Scholar]
- 18.Mon SL, Zin TT, Tin P, Kobayashi I. Video-based automatic cattle identification system. In Proc. of 2022 IEEE 11th Global Conference on Consumer Electronics (GCCE), 490–491, (2022). 10.1109/GCCE56475.2022.10014109.
- 19.Phyo CN, Zin TT, Hama H, Kobayashi I A hybrid rolling skew histogram-neural network approach to dairy cow identification system. In 2018 International Conference on Image and Vision Computing New Zealand (IVCNZ), 1–5, (2018). 10.1109/IVCNZ.2018.8634739.
- 20.Zin, T.T., Phyo, C.N., Tin, P., Hama, H. and Kobayashi, I. Image technology based cow identification system using deep learning. In Proc. of the international multiconference of engineers and computer scientists, 1, 236–247 (2018).
- 21.Andrew, W., Hannuna, S., Campbell, N., Burghardt, T., Automatic individual holstein friesian cattle identification via selective local coat pattern matching in RGB-D imagery. In Proc. of the 2016 IEEE International Conference on Image Processing (ICIP), 484–488 (2016). 10.1109/ICIP.2016.7532404.
- 22.Qiao, Y. et al. Automated individual cattle identification using video data: A unified deep learning architecture approach. Front. Anim. Sci.2, 751947. 10.3389/fanim.2021.759147 (2021). 10.3389/fanim.2021.759147 [DOI] [Google Scholar]
- 23.Karim, F., Majumdar, S., Darabi, H. & Harford, S. Multivariate LSTM-FCNs for time series classification. Neural Netw.116, 237–245 (2019). 10.1016/j.neunet.2019.04.014 [DOI] [PubMed] [Google Scholar]
- 24.Ahmad, M. et al. AI-Driven livestock identification and insurance management system. Egypt. Inform. J.24(3), 100390 (2023). 10.1016/j.eij.2023.100390 [DOI] [Google Scholar]
- 25.Myat, N. S., Zin, T. T., Tin, P. & Kobayashi, I. Comparing state-of-the-art deep learning algorithms for the automated detection and tracking of black cattle. Sensors23, 532. 10.3390/s23010532 (2023). 10.3390/s23010532 [DOI] [PMC free article] [PubMed] [Google Scholar]
- 26.Reis, T., Milanese, R., & Secchi, S., Real-time pedestrian detection for aerial image surveillance with YOLOv8. In Proc. of the International Conference on Computer Vision, 7518–7527 (2023).
- 27.Aboah, A. K., Anyidoho, S. K. & Asante, O. Improved real-time vehicle detection and tracking using modified YOLOv5 model. Int. J. Adv. Comput. Sci. Appl.12(3), 389–400 (2021). [Google Scholar]
- 28.Shoman, H., Abu-El-Haija, S., & Qi, X. Real-time object detection using YOLOv5 and deep SORT. arXiv preprint arXiv:2202.03565, (2022).
- 29.Wang, C.-Y., Bochkovskiy, A. & Liao, H.-Y.M. YOLOv7: Trainable bag-of-freebies sets new state-of-the-art for real-time object detectors. In Proceedings of the IEEE/CVF conference on computer vision and pattern recognition, 7464–7475 (2023).
- 30.Zeng, Y., Zhang, T., He, W. & Zhang, Z. YOLOv7-UAV: An unmanned aerial vehicle image object detection algorithm based on improved YOLOv7. Electronics12, 3141. 10.3390/electronics12143141 (2023).
- 31.Wang, J., Wu, J., Wu, J., Wang, J. & Wang, J. YOLOv7 optimization model based on attention mechanism applied in dense scenes. Appl. Sci.13(16), 9173. 10.3390/app13169173 (2023).
- 32.Armstrong, A., Wang, B., Bagci, U. and Adu-Gyamfi, Y. Real-time multi-class helmet violation detection using few-shot data sampling technique and yolov8. In Proc. of the IEEE/CVF Conference on Computer Vision and Pattern Recognition, 5349–5357 (2023).
- 33.Karna, N. B., Putra, M. A., Rachmawati, S. M., Abisado, M. & Sampedro, G. A. Towards accurate fused deposition modeling 3D printer fault detection using improved YOLOv8 with hyperparameter optimization. IEEE Access11, 74251–74262 (2023). 10.1109/ACCESS.2023.3293056 [DOI] [Google Scholar]
- 34.Simonyan, K., & Zisserman, A., Very deep convolutional networks for large-scale image recognition. arXiv preprint arXiv:1409.1556, 2014.
- 35.Nuanmeesri, S. A hybrid deep learning and optimized machine learning approach for rose leaf disease classification. Eng. Technol. Appl. Sci. Res.11(5), 7678–7683 (2021). 10.48084/etasr.4455 [DOI] [Google Scholar]
- 36.Cortes, C. & Vapnik, V. N. Support-vector networks. Mach. Learn.20(3), 273–297 (1995). 10.1007/BF00994018 [DOI] [Google Scholar]
- 37.Bishop, C. M. Pattern recognition and machine learning (Springer, NewYork, 2016). [Google Scholar]
- 38.Chandra, A. & Bedi, S. S. Cattle identification and tracking using machine learning and computer vision. J. King Saud Univ. Comput. Inform. Sci.33(8), 3263–3276 (2021). [Google Scholar]
- 39.Hastie, T., Tibshirani, R. & Friedman, J. H. The elements of statistical learning: Data mining, inference, and prediction (Springer, Berlin, 2009). [Google Scholar]
- 40.Schölkopf, B. & Smola, A. J. Learning with kernels: Support vector machines, regularization, optimization, and beyond (MIT press, Cambridge, 2002). [Google Scholar]
- 41.Suykens, J. A. K. & Vandewalle, J. Least squares support vector machine classifiers. Neural Process. Lett.9(3), 29–39 (1999). 10.1023/A:1018628609742 [DOI] [Google Scholar]
- 42.Chandra, M. A. & Bedi, S. S. Survey on SVM and their application in image classification. Int. J. Inf. Technol.13, 1–11. 10.1007/s41870-017-0080-1 (2021).33527094 10.1007/s41870-017-0080-1 [DOI] [Google Scholar]
Associated Data
This section collects any data citations, data availability statements, or supplementary materials included in this article.
Data Availability Statement
The datasets used and/or analysed during the current study available from the corresponding author on reasonable request.


