

Abstract
Background:
Feeding challenges are a significant concern for autistic children. Literature has yet to comprehensively characterize feeding challenges for autistic children. Further research is needed to understand predictors of feeding severity and identify opportunities for screening and intervention. The purpose of this study was to characterize the presentation of feeding challenges in autistic children and identify predictors of feeding challenge classification and severity.
Methods:
Data from a national cross-sectional survey of caregivers (n=427) of autistic children with feeding challenges was used. Feeding challenges were characterized using descriptive statistics. Autism diagnosis age and age of onset of feeding challenges was compared using non-parametric testing. Bi-directional stepwise multivariate linear regression was used to identify significant predictors of feeding challenge scores.
Results:
Sensory-based feeding challenges were the most common. Age of onset of feeding challenges was significantly lower than the age of autism diagnosis. Early feeding challenges differentially predicted feeding challenge severity and classification scores.
Conclusion:
The results of this study identify the relationships among early feeding challenges and the severity and classification of feeding challenges in later childhood. Results demonstrate the importance of early monitoring of feeding challenges. These findings can be used to inform the identification of critical timepoints for intervention.
The characterization of feeding challenges in autistic children and relationships between feeding severity and early feeding challenges
Feeding challenges are a significant concern for autistic1 children and their families with prevalence estimated to be as high as 84% (Leader et al., 2020). They can include a child’s selective intake of foods, limited food variety, or mealtime responses to foods (e.g. food refusal behaviors) as well as any difficulty that interferes with the acceptance of food or mealtime participation (Leader et al., 2020; Page et al., 2021; St. John et al., 2022). Children with feeding challenges are at an increased risk of negative health, nutrition, developmental, family, and social outcomes (Leader et al., 2020; Page et al., 2021; Thullen & Bonsall, 2017). A comprehensive understanding of how feeding challenges present in autistic children and identification of predictors of feeding challenge severity could inform the development of early interventions to alleviate the impacts of feeding challenges on children and their families.
A large body of research has emerged identifying a variety of feeding concerns for autistic children while also discussing potential implications for the child and family. Available research is limited by small sample sizes and studies that focus on a singular factor related to feeding challenges (e.g., sensory processing or acceptance of a bite). When synthesized into review papers and book chapters, the mixed findings from these smaller singular focused studies support that feeding challenges are complex and heterogenous (Ledford et al., 2018; Marshall et al., 2014; St. John et al., 2022). However, gaps exist in our understanding of the presentation of feeding challenges and to date research has yet to adequately capture the heterogeneity and complexity of factors contributing to feeding challenges in a large sample.
Feeding problems in the first year of life have been documented as predictors of childhood restrictive eating for the general population (Micali et al., 2016), yet few studies have explored this relationship for autistic children. A few studies have suggested that feeding challenges may begin in infancy or early childhood for autistic children (Ashley et al., 2020; Emond et al., 2010; Gray et al., 2018). Ashley et al., (2020) found that the frequency of difficulties increased more rapidly for children with early feeding challenges who were later identified as autistic. Findings from Emond and colleagues (2010) identified that children with early feeding challenges who were later identified as autistic showed a late introduction to solid foods, were described as slow feeders, had a less varied diet, and were described as “difficult to feed. These findings may support that feeding challenges are identifiable prior to an autism diagnosis and may develop across early childhood. Exploring the relationships of early feeding indicators and the severity of feeding challenges in later childhood may contribute important information about how feeding challenges change or progress with age.
Current literature exploring relationships between feeding challenges and child age present mixed results, highlighting the need to identify additional predictors of feeding challenge severity to better identify autistic children most in need of early feeding intervention. One recent study by Peverill et al. (2019) identified four distinct feeding challenge trajectories in a group of 396 autistic children. Many of the children in the study had either low levels of feeding challenges that remained stable over time (26.3%), or moderate levels of challenge that improved over time (26.5%). A third trajectory captured children whose feeding challenges were high in preschool and declined to the average range by school age (26.5%). A small percentage of children (8.3%) in the study displayed severe chronic feeding challenges that persisted into school age (Peverill et al., 2019). Another study by Bandini et al., (2017) found at the group level, food refusal declined with age, however, there was high variability among the sample, and 44% of the sample had high food selectivity at baseline that remained high at follow-up. These results suggest that there is an important group of children who’s feeding challenges do not improve with time and for whom intervention may be essential. In contrast, a few studies have found no relationship between age and feeding challenges (Sharp et al., 2018; Smith et al., 2020; Suarez et al., 2014). Together the findings of these studies highlight the importance of simultaneously considering the heterogeneity in feeding challenges and potential early predictors across childhood.
Comprehensive characterization of the presentation of feeding challenges including early childhood feeding challenges, and how feeding challenges develop over time could inform tailored and multifocal intervention approaches. Research is needed to distinguish underlying factors that contribute to feeding challenge heterogeneity, understand predictors of feeding severity, and identify critical timepoints for intervention. The purpose of this study was to (1) characterize the presentation of feeding challenges in young autistic children in a large national sample using caregiver report; and (2) identify predictors of feeding challenge severity and type of feeding challenge (sensory, behavioral, oral motor, and gastrointestinal) using data from the Survey for Characterization of Feeding Challenges in Autistic Children – US; a national cross-sectional survey of caregivers of autistic children with feeding challenges in the United States.
Methods
This study used data from the Survey for Characterization of Feeding Challenges in Autistic Children – US, a national cross-sectional survey of caregivers of autistic children ages 2 to 12 years with feeding challenges. Within the survey caregivers completed seven assessments including the Feeding and Eating in AutiSm Together (FEAST) questionnaire (Ausderau, 2022). In this study, caregiver responses to the FEAST were used to characterize feeding challenges and identify predictors of feeding challenge severity. Informed consent was collected digitally from all participants and all methods were approved by the University of Wisconsin – Madison institutional review board (IRB Approval Number 2014–0945).
Participants
426 primary caregivers of autistic children with feeding challenges completed the Survey for Characterization of Feeding Challenges in Autistic Children – US. Survey respondents were recruited nationally from the Interactive Autism Network (IAN) online research registry (IAN Interactive Autism Network, 2016), and through the distribution of recruitment materials at local clinics and community organizations that serve families with autistic children; a university research recruitment registry; and an additional university listserv. Caregivers were screened for inclusion criteria prior to completion of informed consent. To participate in the Survey for Characterization of Feeding Challenges in Autistic Children – US, respondents were required to be a primary caregiver (lives with child at least 50%) of an autistic child (ages 2 to 12 years) with caregiver reported feeding challenges. Child’s autism diagnosis and presence of feeding challenges was reported by caregivers. Caregivers were asked to provide information on when and where they received their child’s autism diagnosis. A separate study demonstrated that 98% of caregivers registered in the IAN registry were able to provide verification of a professional autism diagnosis for their child (Daniels et al., 2012). Participants within the IAN registry were recruited if they had a Social Communication Questionnaire score above 15, indicating a high likelihood of an autism diagnosis (Rutter et al., 2003). Respondents were excluded if the child was diagnosed with a co-occurring developmental condition including Rett syndrome, Childhood Disintegrative Disorder, primary sensory impairment (e.g., blindness), genetic condition (e.g., Down syndrome) or physical impairment such as cerebral palsy. Survey responses were excluded if caregivers completed less than 90% of the Feeding and Eating in Autism Together (FEAST) assessment. Child and family characteristics are presented in Table 1.
Table 1.
Participant Characteristics
| Sex (n=427) (%) | |
|
| |
| Male | 82.90 |
|
| |
| Chronological Age (SD) (n=396) | 8.42 (2.95) years |
|
| |
| SRS/SRS-P Total T Score (SD) (n=354) | 82.08 (8.42) |
|
| |
| Maternal Education (n=427) (%) | |
|
| |
| Partial High School or Lower | 0.46 |
| High School or GED | 14.29 |
| Associates Degree/Partial College | 22.72 |
| Bachelor or Master’s Degree | 54.80 |
| Advanced Degree such as Doctorate | 6.56 |
| Choose not to answer | 1.17 |
|
| |
| Annual Household Income (n=427) (%) | |
|
| |
| Less than $20,000 | 10.30 |
| $20,000 to $39,999 | 11.94 |
| $40,000 to $59,999 | 13.58 |
| $60,000 to $79,999 | 14.52 |
| $80,000 to $99,999 | 8.67 |
| $100,000 or more | 31.62 |
| Choose not to answer | 9.37 |
|
| |
| Race / Ethnicity (allowed to select more than one) (n=427) (%) | |
|
| |
| Black/African American | 7.03 |
| American Indian/Alaskan Native | 4.45 |
| Asian | 4.92 |
| Native Hawaiian/Pacific Islander | 1.17 |
| Other | 3.98 |
| White | 88.52 |
| Hispanic or Latino Origin | 13.11 |
|
| |
| Therapy Services Received by Child (n=427) (%) | |
|
| |
| Occupational Therapy | 83.37 |
| Speech Therapy | 88.29 |
| Physical Therapy | 40.74 |
| Applied Behavior Analysis | 54.80 |
| DIR - Floortime | 10.07 |
| Relationship Development Intervention (RDI) | 3.27 |
| TEACCH | 9.36 |
| Other Behavioral | 6.32 |
Measures
Family Demographics Questionnaire.
A family demographic questionnaire was created specifically for the Survey for Characterization of Feeding Challenges in Autistic Children – US to collect demographic information about the child and family. Demographic variables included child’s race and ethnicity, child’s chronological age, child’s age of autism diagnosis, child’s sex, family household income, caregiver education, and therapy and behavioral intervention services received by the child.
Feeding and Eating in Autism Together Questionnaire 1.1; (FEAST; Ausderau, 2022).
The FEAST is a 2-part, 84-item caregiver-report questionnaire. The FEAST was developed by a team of experts and clinicians based on previous research, clinical expertise, and extensive literature review. The FEAST has demonstrated construct validity for the measurement of four underlying constructs (Sensory, Behavior, Oral Motor, and Gastrointestinal) contributing to feeding challenges (Ausderau, 2022). Part 1 of the FEAST assessment includes 32-items used to measure the severity of a child’s feeding challenges and classify feeding challenges across the four underlying constructs contributing to a child’s feeding challenges (e.g., Sensory: Does your child gag or vomit when the smell certain foods; Oral Motor: Does your child have difficulty chewing foods?). In FEAST part 1, 31 items are rated on a 5-point Likert scale from never/almost never to almost always/always and one item has a binary response (yes, no).
Questions included in FEAST Part 2 (52 items) provide clinically relevant information to describe the child’s challenges in their environmental context, feeding history, and family mealtime structure (e.g., Do you need to make a separate food/meal for your autistic child?). Responses in FEAST part 2 include 33 questions rated on the 5-point Likert scale used in FEAST part 1. The remaining 19 questions include 7 questions with yes no binary responses, 5 select all that apply questions, 5 questions with unique scales (e.g., never, within the last 6 months, 7 to 11.99 months, 1 to 1.99 years, 2 to 2.99 years, more than 3 years ago), and two open ended free text response questions asking about caregivers most significant feeding concerns and an opportunity to share any additional information.
Responses to FEAST Part 1 were used to calculate feeding challenge severity (FEAST Total Score) and feeding challenge classification subscale scores (Sensory, Behavior, Oral Motor and Gastrointestinal). The Sensory subscale focuses on the child’s response to the sensory properties of the food or environment. The Behavior subscale focuses on overt child behaviors at mealtime or while eating such as throwing food or eating utensils, spitting out food, or refusing to eat. The Oral Motor subscale focuses on how the child manipulates food and drink. The Gastrointestinal subscale focused on the child’s gastrointestinal functioning such as vomiting, diarrhea, or constipation. FEAST Total scores can range from 32 to 160. Subscale raw scores were converted into mean item scores ranging from 1 to 5 to allow for comparison across subscales with different numbers of items. Responses to items on the Part 2 of the FEAST questionnaire were used to further characterize the presentation of feeding challenges and feeding history in the sample.
Social Responsiveness Scale (SRS-2; Constantino & Gruber, 2012).
The SRS-2 and SRS Preschool (SRS-P) are norm-referenced caregiver report measures of a child’s autism traits in social settings including rigidity, social communication, and repetitive behaviors. SRS-2 and SRS-P T Scores were used as a measure of autism traits. T scores represent classification categories of mild (60–65), moderate (66–75), or severe (76 and above) deficits in reciprocal social behavior (Constantino et al., 2003).
Procedures
Caregivers completed a screening questionnaire to determine eligibility for participation in the study. All screening, consent, and questionnaires were completed electronically using Qualtrics survey software (Qualtrics Labs, 2013). Online administration of all assessments was approved by the publisher or copyright holder. Caregivers had the option to complete the survey across multiple sessions if needed using the same invitation link to return to where they left off in the survey. A $5.00 gift card was offered to respondents in appreciation of their participation.
Duplicate survey responses were identified through collected metadata (IP address and geographic location) or provided caregiver contact information (name and phone number). The first completed survey response was used when a duplicate was identified. After removing duplicate and partial responses, all remaining survey response were de-identified and assigned a unique identification number. Assessments were scored according to administrative manuals by two research team members and scores were compared to confirm accuracy. Data was stored on an encrypted drive accessed on a lab computer in a locked office.
Data Analytic Plan
All analyses were performed using R version 4.2.0 (R Core Team, 2021) using p < 0.05 for statistical significance. To characterize the presentation of feeding challenges, descriptive statistics were run on FEAST Total Score and FEAST subscale scores to describe the range of overall feeding challenges present in the sample as well as the distribution across types of feeding challenge. Descriptive statistics were run on select items from FEAST Part 2 to explore specific characterization across areas of early feeding challenges, independent feeding skills, family mealtime routine, caregiver strategies and responses to feeding challenges, mealtime schedule and length, reported sensitivities, diet variety, and progression of feeding challenges. Age of feeding challenge onset was compared to age of autism diagnosis to determine if feeding challenges were present significantly earlier than autism diagnosis. Non-parametric Wilcoxon signed-rank test was used due to violation of the assumption of normality in both the distribution of age of feeding challenge onset and age of autism diagnosis.
Bi-directional stepwise multivariate linear regression was used to identify significant predictors of overall feeding challenge severity and classification (FEAST Total and Subscale scores). Assumptions of linearity, multivariate normality, and no multicollinearity were assessed and met prior to completing analysis. Model predictors were identified to represent a child’s early onset feeding challenges during defined feeding transitions, the age of onset of feeding challenges, and a measure of the child continuing to restrict their diet over time.
Five models were run using participant scores from part 1 of the FEAST (FEAST Total Score, and Sensory, Behavior, Oral Motor, Gastrointestinal subscale scores) as dependent variables. Only participants with complete responses for predictor variables (n=406) were included in the regression analysis. A composite score for early feeding challenges was used as a predictor of overall level of feeding challenge (FEAST Total Score). The composite score for early feeding challenges was a sum score of all three early feeding challenge items (difficulty with breast or bottle feeding, difficulty transitioning to baby foods, difficulty transitioning to table or family foods). Individual early feeding items were used as predictors to identify differential predictors of FEAST Subscale scores. All models included the predictors of age of onset of feeding challenges and child continues to restrict diet over time.
To control for demographic factors of age and autistic traits, all 5 models were run again controlling for child age and SRS T-Score. Participants with incomplete SRS data were excluded from the controlled analysis. All models included 354 participants when controlling for autistic traits due to incomplete or missing SRS data.
Community involvement
There was no community involvement in the reported study.
Results
Participants reported a wide range of feeding challenge severity for the autistic children as indicated in Table 2. Mean subscale scores were highest in sensory-based feeding challenges. Table 3 presents descriptive statistics from FEAST items related to early feeding challenges, independent feeding, family mealtime routine, caregiver strategies and responses, mealtime schedule and length, reported food and environmental sensitivities, diet variety, and progression of feeding challenges over time. A Wilcoxon signed rank test revealed that age caregivers reported the onset of feeding challenges (Median = 1–1.99 years, n= 388) was significantly lower than the age of autism diagnosis (Median = 2–2.99 years, n= 388), z = −12.524, p = .001 with a medium effect size, r = .45. Figure 1 presents a comparison of the distribution of age of autism diagnosis and age of onset for feeding challenges. Table 4 presents the results for all linear regression models and contributions of each significant predictor.
Table 2.
Distribution of Feeding Challenge Severity (FEAST Total Score) and FEAST Subscale Scores
| FEAST Score | Min | Max | Mean | SD |
|---|---|---|---|---|
|
| ||||
| FEAST Total Score (n = 427) | 32 | 137 | 74.49 | 15.77 |
| FEAST Subscale Scores | ||||
| Sensory | 1.00 | 4.88 | 2.80 | 0.73 |
| Behavior | 1.00 | 4.27 | 2.26 | 0.66 |
| Oral Motor | 1.00 | 4.25 | 2.01 | 0.70 |
| Gastrointestinal | 1.00 | 4.67 | 2.18 | 0.76 |
Note: Feast Total Score is a raw score within a possible range of 32 to 160. FEAST Subscale raw scores are converted into mean item scores ranging from 1 to 5 to allow for comparison across subscales with different numbers of items.
Table 3.
Characterization of Presentation of Feeding Challenges in Autistic Children with Feeding Challenges ages 2–12 years
| FEAST Item | Responses % (n) | |||||
|---|---|---|---|---|---|---|
|
| ||||||
| Never/Almost Never | Once in a While | Sometimes | Frequently | Almost Always | Missing or N/A | |
|
|
||||||
| Early Feeding Challenges | ||||||
| Difficulty with Breast/Bottle Feeding | 2.1% (9) | 44.7% (191) | 13.1% (56) | 16.9% (72) | 19.0% (81) | 4.2% (18) |
| Difficulty Transitioning to Baby Foods | 36.3% (155) | 20.6% (88) | 19.7% (84) | 12.2% (52) | 11.0% (47) | 0.2% (1) |
| Difficulty Transitioning to Table Foods | 31.6% (135) | 14.8% (63) | 20.4% (87) | 15.2% (65) | 17.8% (76) | 0.2% (1) |
| Min | Max | Mean (SD) | ||||
|
|
||||||
| Early Feeding Challenge Composite Score | 2 | 15 | 8.06 (3.13) | |||
| Never/Almost Never | Once in a While | Sometimes | Frequently | Almost Always | Missing or N/A | |
|
|
||||||
| Independent Feeding | ||||||
| Independently uses a Spoon | 8.0% (34) | 10.3% (44) | 18.0% (77) | 17.6% (75) | 46.1% (197) | -- |
| Independently uses a Fork | 8.9% (38) | 13.1% (56) | 9.9% (85) | 18.3% (78) | 39.8% (170) | -- |
| Independently Drinks from a Straw | 2.6% (11) | 2.6% (11) | 5.4% (23) | 9.8% (42) | 79.4% (339) | -- |
| Independently Uses an Open Cup | 11.0% (47) | 5.2% (22) | 14.3% (61) | 11.5% (49) | 58.1% (248) | 0.2% (1) |
| Adult needs to physically feed child | 65.3% (279) | 15.5% (66) | 11.2% (48) | 3.7% (16) | 4.2% (18) | -- |
| Child eats independently | 3.7% (16) | 6.3% (27) | 10.8% (46) | 18.7% (80) | 60.4% (258) | -- |
| Family Mealtime Routine | ||||||
| Caregivers Preparing Separate Meal for Family and Child | 7.0% (30) | 9.6% (41) | 16.4% (70) | 19.4% (83) | 47.5% (203) | -- |
| Child Prefers to Eat Alone | 33.0% (141) | 17.3% (74) | 24.4% (104) | 15.2% (65) | 9.6% (41) | 0.4% (2) |
| Child Eats the Same Food as Family | 36.5% (156) | 23.4% (100) | 20.4% (87) | 23.1% (56) | 6.6% (28) | -- |
| Child Takes a Bite and Roams | 26.7% (114) | 11.5% (49) | 19.4% (83) | 24.1% (103) | 17.8% (76) | 0.4% (2) |
| Child’s Challenges Disrupt Family Mealtime | 11.0% (47) | 16.4% (70) | 34.9% (149) | 23.0% (98) | 14.5% (62) | 0.2% (1) |
| Sibling Imitates Behavior of Child | 60.7% (259) | 14.5% (62) | 13.6% (58) | 7.5% (32) | 1.4% (6) | 2.3% (10) |
| Caregiver Strategies and Responses | ||||||
| Caregiver Offers a New Food | 3.0% (13) | 16.2% (69) | 33.5% (143) | 38.4% (164) | 8.9% (38) | -- |
| Caregiver Offers a Food the Child Has Been Offered and Doesn’t Like | 2.8% (12) | 20.6% (88) | 36.5% (156) | 33.3% (142) | 6.8% (29) | -- |
| Caregiver Plays with Child During Meals: | 45.9% (196) | 20.6% (88) | 22.5% (96) | 7.3% (31) | 3.5% (15) | 0.2% (1) |
| Caregiver Uses Positive Encouragement During Mealtime | 3.3% (14) | 5.4% (23) | 16.9% (72) | 34.7% (148) | 39.8% (170) | -- |
| Caregiver Uses Rewards to Support Eating | 26.9% (115) | 17.8% (76) | 22.5% (96) | 18.0% (77) | 14.8% (63) | -- |
| Caregiver Uses Negative Consequences During Mealtime | 61.6% (263) | 20.1% (86) | 12.4% (53) | 4.4% (19) | 1.4% (6) | -- |
| Child Provided with Distractions During Meals | 22.0% (94) | 13.1% (56) | 15.5% (66) | 22.0% (94) | 27.4% (117) | -- |
| Child Provided with Sensory Strategies During Meals | 59.7% (255) | 9.4% (40) | 15.7% (67) | 8.7% (37) | 6.1% (26) | 0.4% (2) |
| Mealtime Schedule and Length | ||||||
| Child Eats at Designated Snack and Mealtimes | 7.0% (30) | 12.4% (53) | 22.2% (95) | 35.6% (152) | 22.7% (97) | -- |
| Child Eat all Throughout the Day (grazing) | 20.1% (86) | 17.6% (75) | 23.4% (100) | 24.4% (104) | 14.5% (62) | -- |
| Child continues to Eat if Preferred Foods are Available | 8.9% (39) | 11.9% (51) | 21.8% (93) | 26.9% (115) | 30.4% (130) | -- |
| 0–15 Min | 15–30 min | 30–45 min | 45–60 min | 1–2 Hours | 2+ Hours | |
|
|
||||||
| Average Mealtime Length for Child | 36.1% (154) | 36.8% (157) | 14.5% (62) | 9.1% (39) | 2.8% (12) | 0.7% (3) |
| Reported Sensitivities | Taste | Texture | Flavor | Smell | Temperature | None |
|
|
||||||
| Sensitivities to Properties of Food (select all that apply) | 61.8% (264) | 84.5% (361) | 54.1% (231) | 56.9% (243) | 44.7% (191) | 2.8% (12) |
| Location | People | Sounds | Smells | Light | None | |
|
|
||||||
| Sensitivity to Components of the Mealtime Environment (select all that apply) | 34.9% (149) | 44.7% (191) | 59.3% (253) | 34.4% (147) | 25.3% (108) | 17.6% (75) |
| Diet Variety | Dairy | Vegetable | Fruit | Protein | Carb | Sweets |
|
|
||||||
| Child Consistently Eats 2+ Foods from Category (select all that apply) | 70.0% (299) | 35.1% (150) | 59.5% (254) | 58.8% (251) | 85.7% (366) | 72.8% (311) |
| Progression of feeding challenges | Never/Almost Never | Once in a While | Sometimes | Frequently | Almost Always | Missing or N/A |
|
|
||||||
| Child has Continued to Restrict Their Diet Over Time | 3.3% (14) | 5.9% (25) | 14.5% (62) | 31.9% (136) | 44.5% (190) | -- |
| Gotten Worse | Stayed the Same | Improved | ||||
|
|
||||||
| Over Time Child’s Feeding Challenges Have... | 35.8% (153) | 31.9% (136) | 32.3% (138) | |||
Note: The response category representing the largest proportion for each item has been bolded. Early Feeding Challenge Composite Score is a sum of all the early feeding challenge variables (difficulty with breast or bottle feeding, difficulty transitioning to baby foods, difficulty transitioning to table foods).
Figure 1. Comparison of Distribution of Age of Autism Diagnosis and Age of Feeding Challenge Onset.
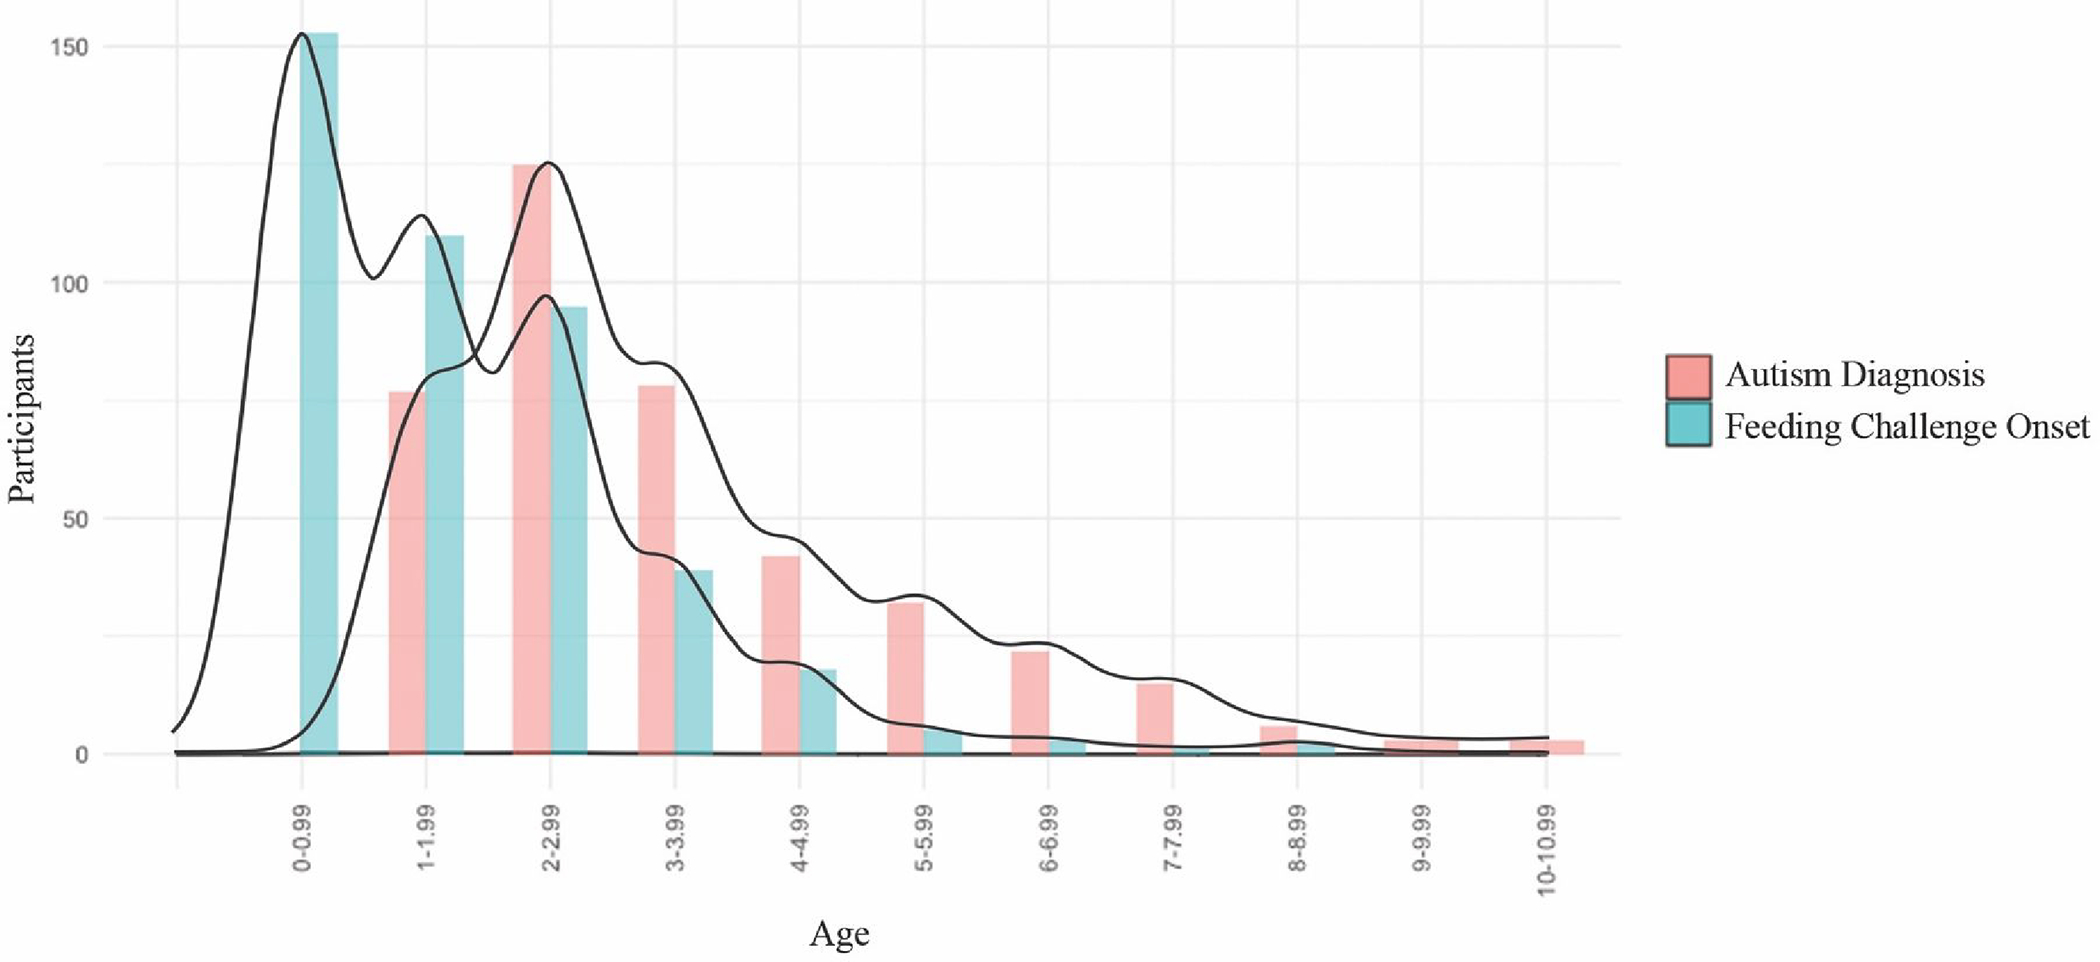
Note: This figure presents a bar graph distribution of the age of onset of feeding challenges and age of autism diagnosis. Density curve lines are provided to illustrate the compared distributions. Age categories are in years.
Responses were provided in categories and ages 0–6 months and 7–12 months were condensed to 0–0.99 years for consistency across the scale.
Table 4.
Multivariate Linear Regression Models Predicting FEAST Total Score and FEAST Subscale Scores from Early Feeding Challenges, Age of Onset of Feeding Challenges, and Child Continues to Restrict Diet Over Time
| Variable | Estimate (S.E.) | P | Partial R2 | F (DF) | P | Multiple R2 | f 2 |
|---|---|---|---|---|---|---|---|
|
| |||||||
| Model 1.1: FEAST Total Score | 43.61 (2,420) | <.001 | 0.172 | 0.208 | |||
| Intercept | 50.29 (3.14) | <.001 | |||||
| Early Feeding Challenges Composite Score | 1.84 (0.23) | <.001 | 0.136 | ||||
| Continue to restrict over time | 2.30 (0.67) | <.001 | 0.028 | ||||
| Predictors not Included in final model: Age of Onset of Feeding Challenges | |||||||
| Model 1.2: FEAST Total Score Controlled for SRS and Age | 30.47 (4,345) | <.001 | 0.261 | 0.353 | |||
| Intercept | 19.78 (6.49) | 0.002 | |||||
| Early Feeding Challenges Composite Score | 1.78 (0.24) | <.001 | 0.140 | ||||
| Continue to restrict over time | 2.22 (0.67) | 0.001 | 0.031 | ||||
| SRS | 0.45 (0.08) | <.001 | 0.086 | ||||
| Age of Child | −0.05 (0.02) | 0.013 | 0.018 | ||||
| Predictors not Included in final model: Age of Onset of Feeding Challenges | |||||||
| Model 2.1: Sensory Subscale Score | 22.86(4,418) | <.001 | 0.180 | 0.220 | |||
| Intercept | 11.79 (1.19) | <.001 | |||||
| Difficulty Breast/Bottle Feeding | 0.40 (0.19) | 0.04 | 0.01 | ||||
| Difficulty Transitioning to Baby Foods | 0.52 (0.25) | 0.04 | 0.01 | ||||
| Difficulty Transitioning to Table/Family Foods | 0.47 (0.23) | 0.04 | 0.01 | ||||
| Continue to restrict over time | 1.70 (0.25) | <.001 | 0.10 | ||||
| Predictors not Included in final model: Age of Onset of Feeding Challenges | |||||||
| Model 2.2: Sensory Subscale Score controlled for SRS and Age | 22.43 (4,345) | <.001 | 0.206 | 0.259 | |||
| Intercept | 6.08 (2.47) | 0.014 | |||||
| Difficulty Breast/Bottle Feeding | 0.38 (0.20) | 0.062 | 0.010 | ||||
| Difficulty Transitioning to Table/Family Foods | 0.78 (0.19) | <.001 | 0.046 | ||||
| Continue to restrict over time | 1.64 (0.26) | <.001 | 0.106 | ||||
| SRS | 0.08 (0.03) | 0.005 | 0.022 | ||||
| Predictors not Included in final model: Difficulty Transitioning to Baby Foods, Age of Onset of Feeding Challenges, Age of Child | |||||||
| Model 3.1: Behavior Subscale Score | 11.54 (3,419) | <.001 | 0.076 | 0.082 | |||
| Intercept | 17.11 (1.55) | <.001 | |||||
| Difficulty Breast/Bottle Feeding | 0.59 (0.25) | 0.02 | 0.01 | ||||
| Difficulty Transitioning to Table/Family Foods | 0.87 (0.24) | <.001 | 0.03 | ||||
| Continue to restrict over time | 0.89 (0.33) | <.001 | 0.02 | ||||
| Predictors not Included in final model: Difficulty Transitioning to Baby Foods, Age of Onset of Feeding Challenges | |||||||
| Model 3.2: Behavior Subscale Score Controlled for SRS and Age | 13.37 (5,344) | <.001 | 0.163 | 0.195 | |||
| Intercept 7.14 (3.17) | 0.025 | ||||||
| Difficulty Breast/Bottle Feeding 0.58 (0.26) | 0.026 | 0.014 | |||||
| Difficulty Transitioning to Table/Family Foods 0.79 (0.24) | 0.001 | 0.030 | |||||
| Continue to restrict over time 0.94 (0.33) | 0.004 | 0.023 | |||||
| SRS 0.18 (0.04) | <.001 | 0.058 | |||||
| Age of Child -0.04 (0.01) | <.001 | 0.052 | |||||
| Predictors not Included in final model: Difficulty Transitioning to Baby Foods, Age of Onset of Feeding Challenges | |||||||
| Model 4.1: Oral Motor Subscale Score | 15.33 (3,419) | <.001 | 0.099 | 0.110 | |||
| Intercept 11.49 (0.75) | <.001 | ||||||
| Difficulty Breast/Bottle Feeding 0.60 (0.25) | 0.002 | 0.030 | |||||
| Difficulty Transitioning to Baby Foods 0.55 (0.24) | 0.02 | 0.007 | |||||
| Difficulty Transitioning to Table/Family Foods 0.54 (0.23) | 0.02 | 0.011 | |||||
| Predictors not Included in final model: Continue to Restrict Over Time, Age of Onset of Feeding Challenges | |||||||
| Model 4.2: Oral Motor Subscale Score Controlled for SRS and Age | 11.58 (6,343) | <.001 | 0.169 | 0.203 | |||
| Intercept | 1.53 (2.56) | 0.552 | |||||
| Difficulty Breast/Bottle Feeding | 0.72 (0.20) | <.001 | 0.035 | ||||
| Difficulty Transitioning to Baby Foods | 0.79 (0.28) | 0.004 | 0.023 | ||||
| Difficulty Transitioning to Table/Family Foods | 0.52 (0.25) | 0.03 | 0.013 | ||||
| Age of Onset of Feeding Challenges | 0.29 (0.21) | 0.161 | 0.006 | ||||
| SRS | 0.12 (0.03) | <.001 | 0.044 | ||||
| Age of Child | −0.02 (0.01) | 0.053 | 0.011 | ||||
| Predictors not Included in final model: Continue to Restrict Over Time | |||||||
| Model 5.1: Gastrointestinal Subscale Score | 14.44 (2,420) | <.001 | 0.064 | 0.068 | |||
| Intercept | 10.38 (0.60) | <.001 | |||||
| Difficulty Breast/Bottle Feeding | 0.36 (0.16) | 0.03 | 0.011 | ||||
| Difficulty Transitioning to Baby Foods | 0.71 (0.16) | <.001 | 0.044 | ||||
| Predictors not Included in final model: Difficulty Transitioning to Table Foods, Continue to Restrict Over Time, Age of Onset of Feeding Challenges | |||||||
| Model 5.2: Gastrointestinal Subscale Score Controlled for SRS and Age | 11.58 (4,345) | <.001 | 0.118 | 0.134 | |||
| Intercept 3.60 (2.20) | 0.102 | ||||||
| Difficulty Breast/Bottle Feeding 0.35 (0.18) | 0.046 | 0.011 | |||||
| Difficulty Transitioning to Baby Foods | 0.55 (0.21) | 0.009 | 0.020 | ||||
| Age of Onset of Feeding Challenges | −0.27 (0.18) | 0.13 | 0.007 | ||||
| SRS | 0.09 (0.02) | <.001 | 0.046 | ||||
| Predictors not Included in final model: Difficulty Transitioning to Table Foods, Continue to Restrict Over Time, Age of Child | |||||||
Note: Models 1.1 and 1.2 use an early feeding composite score, Models 2.1–5.2 use individual early feeding variables to consider differential relationships between early feeding challenges and feeding challenge classification scores. All models run without control variables and then controlling for child age and autism traits using SRS-T Score.
All models generated during the bi-directional stepwise multivariate linear regression were significant with and without controlling for child age and autistic traits (See Table 4). Early feeding challenge composite and continued diet restriction significantly predicted FEAST Total Scores while controlling for child age and autistic traits, F (4,345) = 30.47, p < 0.001, with a large effect size f2 = .353. Differential relationships between early feeding predictors were identifiable across the 4 subscale score models with and without controlling for age and autistic traits (SRS T scores). Effect sizes for subscale score models ranged from small (f2 = .068) for Model 5.1 to large (f2 = .353) for Model 2.2. Controlling for age and autistic traits strengthened the effect size of all models and left significant predictors unchanged for Models predicting FEAST Total Score, and Behavior Subscale score. After controlling for child age and autistic traits, difficulty transitioning to baby foods was no longer a significant predictor of Sensory Subscale scores. Controlling for child age and autistic traits identified an additional significant predictor (age of onset of feeding challenges) for Oral Motor and Gastrointestinal Subscale scores.
Discussion
This study presents a comprehensive characterization of feeding challenges in a large sample of 427 autistic children (2 to 12 years). Results demonstrate that feeding challenges for autistic children are widely heterogenous with some autistic children experiencing severe and persistent challenges. Further, the results presented here demonstrate the importance of attending to feeding challenges in early childhood as important predictors for future feeding challenge severity and classification (e.g., sensory, behavior, oral motor, and gastrointestinal). Together these results highlight the need for comprehensive feeding assessment and emphasize the need for early monitoring of feeding challenges to guide targeted intervention.
Feeding challenges are emerging early for autistic children, specifically during early feeding transitions and for many prior to receiving an autism diagnosis. Reported onset of feeding challenges was significantly earlier than age of autism diagnosis in this study. These results are aligned with previous literature that suggests feeding challenges begin in infancy and early childhood at increased rates for children later identified as autistic (Ashley et al., 2020; Emond et al., 2010; Gray et al., 2018). A recent study by Xiang et al., (2023) identified that children with higher autistic traits had shorter durations of breastfeeding, later introductions of solid foods, and lower acceptability of introduced foods. Both the results of the current study and findings from Xiang et al., (2023) point to early feeding transitions as key opportunities to identify feeding challenges in early childhood. Future research should expand on the results of the current and previous studies to explore if feeding concerns in early childhood may serve as a useful indicator for autism diagnosis.
Findings from this study identified that specific early feeding challenges were related to the severity of feeding challenges as well as differentially predicted feeding challenge classification. Within the current sample, 33% of children frequently or always had difficulty with at least one early feeding transition, and 44.5% of families reported their child continued to restrict their diet over time. Previous literature documenting the trajectories of feeding challenges has identified that while at a group level feeding challenges appear to improve over time for autistic children, there are important subgroups who have persistent and chronic feeding challenges into childhood (Bandini et al., 2017; Peverill et al., 2019). The results of this study are consistent with these finding and emphasize that a small group of autistic children experience feeding challenges early in childhood, do not experience improvement over time, and experience more severe and persistent challenges into later childhood. Early feeding challenge composite scores predicted overall Feeding Challenge Severity suggesting that children who have difficulty with early feeding are more likely to experience more severe feeding challenges in later childhood. In addition, early feeding challenges differentially predicted Sensory, Behavior, Oral Motor, and Gastrointestinal Subscale scores. These results suggest that screening for early feeding challenges may provide insight into identifying groups of children at risk for more severe feeding challenges and offer opportunities for early intervention. The differential relationships between specific early feeding challenges and specific subscale scores may offer an opportunity to consider targeted intervention approaches for specific types of feeding difficulties.
Continuing to restrict diet over time was a significant predictor of Feeding Challenge Severity scores and both Sensory Subscale and Behavior Subscale scores but was not significant for predicting Oral Motor Subscale scores or Gastrointestinal Subscale scores. This specific feeding challenge of dropping previously eaten foods and having difficulty adding a new food into their repertoire represents a complex feeding concern that encompasses both sensory and behavioral considerations. While directionality of these findings cannot be confirmed without further investigation, the relationship between caregiver reported ongoing diet restriction and feeding challenge severity suggests diet restriction may be an important clinical indicator. Measurement of continued restriction of diet may offer a simple screening tool to identify a risk for persistent and chronic feeding challenges or be used to track the progression of feeding concerns. Age of onset of feeding challenges was only significant for the prediction of Oral Motor Subscale scores suggesting that children with the earliest feeding challenges should potentially be screened and monitored for oral motor development. In addition, all early feeding transitions (breast or bottle feeding, baby foods, and table or family foods) were significant predictors of the Oral Motor Subscale scores. This aligns with what is known about oral motor development. Oral motor skills develop sequentially over the first 2–3 years of life and required skills increase in complexity with each new feeding transition and as the variety of foods increases (Marcus & Breton, 2022). Therefore, difficulty at all transitions would be likely for children with oral motor difficulties from birth.
Gastrointestinal Subscale scores were significantly predicted by the two earliest feeding challenges (breast or bottle and transitioning to baby foods) and age of onset of feeding challenges. A recent systematic review of population based studies identified that for 25% of all children Gastroesophageal Reflux Disease (GERD) is present between 0–12 months of age (Singendonk et al., 2019), during breast and bottle feeding and for many during the early introduction of baby foods. Additionally, GERD symptom severity decreased steadily as children age (Singendonk et al., 2019). Autistic children are three times more likely to have gastrointestinal disorders than non-autistic children (Leader et al., 2020; Restrepo et al., 2020). Together these findings emphasize the importance of considering gastrointestinal concerns, especially in early childhood, when addressing feeding challenges. Symptoms of gatrointestinal challenges and GERD may have decreased in severity yet could continue to be impacting the child’s feeding responses and mealtime participation.
Across all models in this study, the largest effects were identified for the prediction of sensory based feeding challenges (models 2.1 and 2.2). A child’s continued restriction of their diet and difficulty transitioning to table or family foods were significant predictors of Sensory Subscale scores when controlling for age and autistic traits. A child’s transition to table foods rapidly expands their exposure to family foods and diverse sensory aspects including more variability in texture and mixed texture foods. These results are aligned with previous literature showing that food selectivity based on the sensory properties of food, and primarily texture, is the most common reported feeding challenge (Chistol et al., 2018; Hubbard et al., 2014; Mayes & Zickgraf, 2019). Sensory based feeding challenges were also the most common in our sample (see table 2 and 3) with mean item scores on the Sensory Subscale significantly higher than mean item scores on any other subscale. On clinical utility items, 84.5% reported sensitivity to the texture of foods, 61.8% reported sensitivity to taste and 56.9% reported sensitivities to the smell of foods. Only 2.8% of our sample reported no sensitivity to any sensory property of the food. Sensory sensitivities are clearly a prominent contributor to feeding challenges in this sample of autistic children.
Expanding from considering the sensory properties of the food alone, our results highlight the need to consider a child’s sensitivity to the mealtime environment. Specifically, 59.3% of the sample reported sensitivity to sounds during mealtime and 44.7% reported sensitivity to the people in the environment. Together previous literature highlighting the key contribution of sensory processing to feeding challenges and the results of this study demonstrate the need of intervention to consider the sensory preferences and needs and modification of the mealtime environment to support the participation of a child in feeding. In addition, our sample expands on previous literature to highlight a multitude of other child and family considerations in addition to sensory based challenges (see Table 3). The results presented in table 3 captures the heterogeneity in how feeding challenges present for autistic children and their families.
Strengths and Limitations
This is the first study of its kind to identify significant predictors of both feeding challenge classification and severity in a large national sample. Strengths of this study include the large national sample and a detailed comprehensive measurement of feeding challenges using the newly developed FEAST assessment. Limitations of the study should be considered when applying findings. Early feeding challenges were reported through caregiver recall. Future longitudinal studies may be able to identify additional factors or further clarify critical timepoints early in feeding development. This sample is also limited by the age (2 to 12 years; m=8.42 years) representing a wider developmental range and skewed older. The sample recruited through a research registry (IAN Interactive Autism Network, 2016) provided a sample that was not necessarily representational of autistic children and their families. Future research should expand recruitment methods and seek a diversified representative sample.
Conclusion
Results of this study identify significant predictors of both feeding challenge classification and severity in a large national sample of 427 autistic children. Findings from this study emphasize the importance of comprehensive feeding assessment and monitoring of early feeding challenges to guide targeted intervention. The results of this study identify the relationships among difficulty during early feeding transitions, a child continuing to restrict their diet over time, and the age of onset of feeding challenges with the severity and classification of feeding challenges in later childhood. Together these findings could be used to consider critical timepoints for feeding intervention and opportunities for identification of children most at risk for severe feeding challenges in later childhood.
Acknowledgements:
Thank you to the families who shared valuable information through their participation in this study. Thank you also to Ausderau Lab students who have contributed to this project.
Funding:
The study was funded by the Wisconsin Alumni Research Foundation/MSN PRJ89QZ and supported in part by a core grant to the Waisman Center from the National Institute of Child Health and Human Development (P30 HD03352).
Footnotes
Declaration of Conflicts of Interest:
The authors have no conflicts to declare
Identity first language is used to align with the majority of the autism community (Bury et al., 2020; Kenny et al., 2016; Lei et al., 2021)
References
- Ashley K, Steinfeld MB, Young GS, & Ozonoff S (2020). Onset, Trajectory, and Pattern of Feeding Difficulties in Toddlers Later Diagnosed with Autism. Journal of Developmental & Behavioral Pediatrics, 41(3), 165–171. 10.1097/DBP.0000000000000757 [DOI] [PMC free article] [PubMed] [Google Scholar]
- Ausderau KK (2022). Feeding and Eating in AutiSm Together assessment and scoring manual. University of Wisconsin-Madison. [Google Scholar]
- Ausderau KK, St. John BM, Kwaterski KN, Nieuwenhuis B, & Bradley E (2019). Parents’ strategies to support mealtime participation of their children with autism spectrum disorder. American Journal of Occupational Therapy, 73(1), 7301205070p1–7301205070p10. 10.5014/ajot.2019.024612 [DOI] [PMC free article] [PubMed] [Google Scholar]
- Bandini L, Curtin C, Phillips S, Anderson SE, Maslin M, & Must A (2017). Changes in food selectivity in children with autism spectrum disorder. Journal of Autism and Developmental Disorders, 47(2), 439–446. 10.1007/s10803-016-2963-6 [DOI] [PMC free article] [PubMed] [Google Scholar]
- Bury SM, Jellett R, Spoor JR, & Hedley D (2020). “It Defines Who I Am” or “It’s Something I Have”: What Language Do [Autistic] Australian Adults [on the Autism Spectrum] Prefer? Journal of Autism and Developmental Disorders. 10.1007/s10803-020-04425-3 [DOI] [PubMed] [Google Scholar]
- Chistol LT, Bandini LG, Must A, Phillips S, Cermak SA, & Curtin C (2018). Sensory sensitivity and food selectivity in children with autism spectrum disorder. Journal of Autism and Developmental Disorders, 48(2), 583–591. 10.1007/s10803-017-3340-9 [DOI] [PMC free article] [PubMed] [Google Scholar]
- Constantino JN, Davis SA, Todd RD, Schindler MK, Gross MM, Brophy SL, Metzger LM, Shoushtari CS, Splinter R, & Reich W (2003). Validation of a brief quantitative measure of autistic traits: Comparison of the Social Responsiveness Scale with the Autism Diagnostic Interview-Revised. Journal of Autism and Developmental Disorders, 33(4), 427–433. 10.1023/A:1025014929212 [DOI] [PubMed] [Google Scholar]
- Constantino JN, & Gruber CP (2012). Social Responsiveness Scale–Second Edition (SRS-2). Western Psychological Services. [Google Scholar]
- Daniels AM, Rosenberg RE, Anderson C, Law JK, Marvin AR, & Law PA (2012). Verification of parent-report of child autism spectrum disorder diagnosis to a web-based autism registry. Journal of Autism and Developmental Disorders, 42(2), 257–265. 10.1007/s10803-011-1236-7 [DOI] [PubMed] [Google Scholar]
- Emond A, Emmett P, Steer C, & Golding J (2010). Feeding Symptoms, Dietary Patterns, and Growth in Young Children With Autism Spectrum Disorders. Pediatrics, 126(2), e337–e342. 10.1542/peds.2009-2391 [DOI] [PubMed] [Google Scholar]
- Gray HL, Sinha S, Buro AW, Robinson C, Berkman K, Agazzi H, & Shaffer-Hudkins E (2018). Early History, Mealtime Environment, and Parental Views on Mealtime and Eating Behaviors among Children with ASD in Florida. Nutrients, 10(12), Article 12. 10.3390/nu10121867 [DOI] [PMC free article] [PubMed] [Google Scholar]
- Hubbard KL, Anderson SE, Curtin C, Must A, & Bandini LG (2014). A comparison of food refusal related to characteristics of food in children with autism spectrum disorder and typically developing children. Journal of the Academy of Nutrition and Dietetics, 114(12), 1981–1987. 10.1016/j.jand.2014.04.017 [DOI] [PMC free article] [PubMed] [Google Scholar]
- IAN Interactive Autism Network. (2016). https://iancommunity.org/
- Kenny L, Hattersley C, Molins B, Buckley C, Povey C, & Pellicano E (2016). Which terms should be used to describe autism? Perspectives from the UK autism community. Autism, 20(4), 442–462. 10.1177/1362361315588200 [DOI] [PubMed] [Google Scholar]
- Leader G, Tuohy E, Chen JL, Mannion A, & Gilroy SP (2020). Feeding Problems, Gastrointestinal Symptoms, Challenging Behavior and Sensory Issues in Children and Adolescents with Autism Spectrum Disorder. Journal of Autism and Developmental Disorders, 50(4), 1401–1410. 10.1007/s10803-019-04357-7 [DOI] [PubMed] [Google Scholar]
- Ledford JR, Whiteside E, & Severini KE (2018). A systematic review of interventions for feeding-related behaviors for individuals with autism spectrum disorders. Research in Autism Spectrum Disorders, 52, 69–80. 10.1016/j.rasd.2018.04.008 [DOI] [Google Scholar]
- Lei J, Jones L, & Brosnan M (2021). Exploring an e-learning community’s response to the language and terminology use in autism from two massive open online courses on autism education and technology use. Autism: The International Journal of Research and Practice, 25(5), 1349–1367. 10.1177/1362361320987963 [DOI] [PMC free article] [PubMed] [Google Scholar]
- Marcus S, & Breton S (2022). Development of Oral-Motor Skills. In Marcus S & Breton S, Infant and Child Feeding and Swallowing: Occupational Therapy Assessment and Intervention (2nd ed.). American Occupational Therapy Association, Incorporated. [Google Scholar]
- Marquenie K, Rodger S, Mangohig K, & Cronin A (2011). Dinnertime and bedtime routines and rituals in families with a young child with an autism spectrum disorder. Australian Occupational Therapy Journal, 58(3), 145–154. 10.1111/j.1440-1630.2010.00896.x [DOI] [PubMed] [Google Scholar]
- Marshall J, Hill RJ, Ziviani J, & Dodrill P (2014). Features of feeding difficulty in children with autism spectrum disorder. International Journal of Speech-Language Pathology, 16(2), 151–158. 10.3109/17549507.2013.808700 [DOI] [PubMed] [Google Scholar]
- Mayes SD, & Zickgraf H (2019). Atypical eating behaviors in children and adolescents with autism, ADHD, other disorders, and typical development. Research in Autism Spectrum Disorders, 64, 76–83. 10.1016/j.rasd.2019.04.002 [DOI] [Google Scholar]
- Micali N, Rask CU, Olsen EM, & Skovgaard AM (2016). Early Predictors of Childhood Restrictive Eating: A Population-Based Study. Journal of Developmental & Behavioral Pediatrics, 37(4), 314–321. 10.1097/DBP.0000000000000268 [DOI] [PubMed] [Google Scholar]
- Page SD, Souders MC, Kral TVE, Chao AM, & Pinto-Martin J (2021). Correlates of Feeding Difficulties Among Children with Autism Spectrum Disorder: A Systematic Review. Journal of Autism and Developmental Disorders. 10.1007/s10803-021-04947-4 [DOI] [PubMed] [Google Scholar]
- Peverill S, Smith IM, Duku E, Szatmari P, Mirenda P, Vaillancourt T, Volden J, Zwaigenbaum L, Bennett T, Elsabbagh M, Georgiades S, & Ungar WJ (2019). Developmental Trajectories of Feeding Problems in Children with Autism Spectrum Disorder. Journal of Pediatric Psychology, 44(8), 988–998. 10.1093/jpepsy/jsz033 [DOI] [PMC free article] [PubMed] [Google Scholar]
- Qualtrics Labs. (2013). Qualtrics research suite (Version 21269). Qualtrics Labs Inc. http://www.qualtrics.com [Google Scholar]
- R Core Team. (2021). R: A language and environment for statistical computing. R Foundation for Statistical Computing. https://www.R-project.org/ [Google Scholar]
- Restrepo B, Angkustsiri K, Taylor SL, Rogers SJ, Cabral J, Heath B, Hechtman A, Solomon M, Ashwood P, Amaral DG, & Nordahl CW (2020). Developmental–behavioral profiles in children with autism spectrum disorder and co-occurring gastrointestinal symptoms. Autism Research, 13(10), 1778–1789. 10.1002/aur.2354 [DOI] [PMC free article] [PubMed] [Google Scholar]
- Rutter M, Bailey A, & Lord C (2003). The Social Communication Questionnaire: Manual. Western Psychological Services. [Google Scholar]
- Sharp WG, Postorino V, McCracken CE, Berry RC, Criado KK, Burrell TL, & Scahill L (2018). Dietary Intake, Nutrient Status, and Growth Parameters in Children with Autism Spectrum Disorder and Severe Food Selectivity: An Electronic Medical Record Review. Journal of the Academy of Nutrition and Dietetics, 118(10), 1943–1950. 10.1016/j.jand.2018.05.005 [DOI] [PubMed] [Google Scholar]
- Singendonk M, Goudswaard E, Langendam M, van Wijk M, van Etten-Jamaludin F, Benninga M, & Tabbers M (2019). Prevalence of Gastroesophageal Reflux Disease Symptoms in Infants and Children: A Systematic Review. Journal of Pediatric Gastroenterology and Nutrition, 68(6), 811–817. 10.1097/MPG.0000000000002280 [DOI] [PubMed] [Google Scholar]
- Smith B, Rogers SL, Blissett J, & Ludlow AK (2020). The relationship between sensory sensitivity, food fussiness and food preferences in children with neurodevelopmental disorders. Appetite, 150, 104643. 10.1016/j.appet.2020.104643 [DOI] [PubMed] [Google Scholar]
- St. John BM, Hladik L, Novak P, Gartland S, & Ausderau KK (2022). Assessment and treatment of Feeding challenges in children with autism. In Marcus S & Breton S, Infant and Child Feeding and Swallowing: Occupational Therapy Assessment and Intervention (2nd ed.). American Occupational Therapy Association, Incorporated. [Google Scholar]
- Suarez MA, Nelson NW, & Curtis AB (2014). Longitudinal follow-up of factors associated with food selectivity in children with autism spectrum disorders. Autism, 18(8), 924–932. 10.1177/1362361313499457 [DOI] [PubMed] [Google Scholar]
- Thullen M, & Bonsall A (2017). Co-Parenting quality, parenting stress, and feeding challenges in families with a child diagnosed with autism spectrum disorder. Journal of Autism and Developmental Disorders, 47(3), 878–886. 10.1007/s10803-016-2988-x [DOI] [PubMed] [Google Scholar]
- Xiang X, Yang T, Chen J, Chen L, Dai Y, Zhang J, Li L, Jia F, Wu L, Hao Y, Ke X, Yi M, Hong Q, Chen J, Fang S, Wang Y, Wang Q, Jin C, & Li T (2023). Association of feeding patterns in infancy with later autism symptoms and neurodevelopment: A national multicentre survey. BMC Psychiatry, 23(1), 174. 10.1186/s12888-023-04667-2 [DOI] [PMC free article] [PubMed] [Google Scholar]