Abstract
Diabetic nephropathy (DN) is a prototypical chronic energy metabolism imbalance disease. The AMPK/Sirt1/PGC-1α signaling pathway plays a pivotal role in regulating energy metabolism throughout the body. Gut microbiota ferment indigestible carbohydrates to produce a variety of metabolites, particularly short-chain fatty acids (SCFAs), which exert positive effects on energy metabolism. However, the potential for SCFAs to ameliorate DN-associated renal injury via the AMPK/Sirt1/PGC-1α pathway remains a matter of debate. In this study, we investigated the effects of sodium butyrate (NaB), a SCFA, on energy metabolism in mice with spontaneous DN at two different doses. Body weight, blood glucose and lipid levels, urinary protein excretion, liver and kidney function, interleukin-6 (IL-6) levels, and the expressions of AMPK, phosphorylated AMPK (p-AMPK), mitofusin 2 (MFN2), optic atrophy 1 (OPA1), and glucagon-like peptide-1 receptor (GLP-1R) were monitored in mice. Additionally, butyrate levels, gut microbiota composition, and diversity in colonic stool were also assessed. Our findings demonstrate that exogenous NaB supplementation can improve hyperglycemia and albuminuria, reduce renal tissue inflammation, inhibit extracellular matrix accumulation and glomerular hypertrophy, and could alter the gut microbiota composition in DN. Furthermore, NaB was found to upregulate the expressions of MFN2, OPA1, p-AMPK, and GLP-1R in DN renal tissue. These results suggest that NaB could improve the composition of gut microbiota in DN, activate the AMPK/Sirt1/PGC-1α signaling pathway, and enhance mitochondrial function to regulate energy metabolism throughout the body. Collectively, our findings indicate that NaB may be a novel therapeutic agent for the treatment of DN.
Keywords: Diabetic nephropathy, Short-chain fatty acids, Sodium butyrate, Gut microbiota, AMPK/Sirt1/PGC-1α signaling pathway
Subject terms: Molecular biology, Endocrinology, Nephrology
Introduction
Diabetes (DM) is a group of inherited metabolic diseases caused by multiple etiologies. The number of diabetes has increased dramatically worldwide in recent years. It is estimated that by 2045, the total number of diabetes will reach 784 million1,2. As the most common cause of death and a common microvascular complication of diabetes, diabetic nephropathy (DN) has increasingly attracted widespread attention. The pathogenesis of diabetic nephropathy is exceedingly intricate and remains incompletely understood. However, chronic inflammation, oxidative stress, and dysregulation of glucose and lipid metabolism are generally considered to be the most important factors contributing to its progression3–5. In recent years, a plethora of studies have demonstrated that gut microbes and their metabolites were engaged in intricate bidirectional communication with multiple organs, such as the heart, brain, liver, and kidney, via a complex network of interactions, thereby influencing the host's pathophysiological condition. This intricate interplay has been aptly termed the “gut–organ” axis6. In the context of diabetic nephropathy (DN), this interaction is particularly salient. The hyperglycemic milieu associated with diabetes provides a favorable environment for bacterial growth. The resultant decrease in intestinal probiotics and concomitant increase in opportunistic pathogens in DN culminate in the disruption of the intestinal epithelial barrier function. This disruption facilitates the translocation of toxins and opportunistic pathogens into the bloodstream, leading to toxin accumulation. Furthermore, pathogenic bacteria can directly or indirectly activate the intestinal mucosal immune system, inducing systemic inflammatory responses. The ensuing deposition of abnormal glycosylated immune complexes in the glomerular mesangium further exacerbates kidney damage7,8.
Intestinal beneficial bacteria decompose undigested carbohydrates and proteins to produce a series of metabolites, mainly including short-chain fatty acids, hydrogen sulfide, indole, endotoxin, choline, phenol and amine9. Short-chain fatty acids (SCFAs) are organic fatty acids with less than 6 carbon atoms, including acetic acid (60%), propionic acid (25%), butyric acid (15%) and others10, SCFAs are able to bind to GPR43/41, a G-protein coupled receptor on the surface of islet cells, hepatocytes and adipocytes, thereby regulating glucose and lipid metabolism11. Recent studies have reported that butyrate can up-regulate the expression of the intestinal tight junction protein TJP, improve the intestinal mucosal barrier function to prevent the accumulation of gut-derived toxins in the blood12, and further reduce the levels of inflammatory factors such as IL- 1 and TNF-α13. In addition, some scholars have also found that sodium butyrate can increase the expression of Nrf2 and its downstream factor Ho-1, an important antioxidant factor. In vitro experiments have confirmed that sodium butyrate plays a significant role in improving oxidative stress and inhibiting inflammatory responses14,15. The above results indicate that sodium butyrate can improve the intestinal barrier function, reduce the oxidative damage and fibrosis of the kidney, and inhibit the inflammatory response. However, there are few studies on the recovery of mitochondrial damage and the improvement of renal function by sodium butyrate, especially in diabetic nephropathy.
In this study, db/db diabetic nephropathy mice were used as the research objects to explore the protective mechanism of butyrate on mitochondria and kidneys, in order to provide clues for finding new strategies to treat diabetes nephropathy.
Materials and methods
Animal model
Thirteen-week-old specific pathogen-free (SPF) grade male db/db mice and their littermate db/m mice were obtained from Cavens Laboratory Animal Co., Ltd. (Changzhou, Jiangsu). All experimental procedures were performed in accordance with the guidelines of the Institutional Animal Care and Use Committee of Wenzhou Medical University and ethical approval was obtained for the animal experiments conducted in the study. All mice were acclimated for two weeks prior to the commencement of the experiment. Successful model establishment was defined as fasting blood glucose values exceeding 16.7 mmol/L for three consecutive days. Db/db mice were randomly assigned to three groups: diabetic nephropathy group (DN group, n = 10), sodium butyrate 500 mg/kg/day group (NaB1 group, n = 7), and sodium butyrate 1000 mg/kg/day group (NaB2 group, n = 7). Fresh sodium butyrate solutions were prepared daily based on body weight. The DN group and the normal control (NC) group received oral gavage with equal volumes of normal saline once daily for 8 weeks. Throughout the experiment, all mice were fed a standard diet from Jiangsu Synergy Pharmaceutical and Biological Engineering Co., Ltd. (product No. 1010009), and their body weight and fasting blood glucose were measured every two weeks. Intravenous anesthesia with 3% Pentobarbital sodium (1 ml/kg body weight) was used before kidneys harvests.
Monitoring of biochemical indicators
On the penultimate day of the experiment, mice were fasted and provided with water ad libitum for 24-h urine collection. Following anesthesia, blood was collected via enucleation and serum was separated. The tissues of the same weight were put into the same volume of phosphate buffered saline (PBS) solutions, then cut up the tissues as much as possible, and put into the homogenizer to fully dissolve the proteins in PBS solutions. After centrifugation, the supernatants were removed. Enzyme-linked immunosorbent assay (ELISA) kits (Shanghai, China) were used to determine the urinary albumin-to-creatinine ratio (UACR) and interleukin-6 (IL-6) levels in kidney and colon tissues. In accordance with the manufacturer’s (Nanjing, China) instructions, the levels of blood urea nitrogen (BUN), serum creatinine (SCR), triglyceride (TG), total cholesterol (TC), alanine aminotransferase (ALT), and aspartate aminotransferase (AST) were measured. Also, glucagon-like peptide-1 (GLP-1) of serum in mice were described according to the instruction of ELISA kit (American Millipore).
Western blot detection
Kidney tissue was minced in RIPA lysis buffer containing a mixture of phosphatase and protease inhibitors, and then homogenized. Following complete lysis of the tissue, the supernatant was collected, and protein concentration was determined using the BCA protein quantification kit (Biyuntian, Shanghai, China). Samples (40 μg/10 μL/well) were separated by 10% sodium dodecyl sulfate polyacrylamide gel electrophoresis (SDS-PAGE) and transferred to polyvinylidene fluoride membranes (PVDF membranes, Millipore, USA). After blocking with 5% skim milk for 2 h, the PVDF membranes were incubated overnight at 4 °C with the following primary antibodies: anti-AMPK (#5831, Cell Signaling), anti-p-AMPK (#2535, Cell Signaling), anti-GLP-1R (ab218532, Abcam), anti-NADPH oxidase 4 (ab133303, Abcam), and β-actin (AF7018, Affinity). After washing, the membranes were incubated with a specific horseradish peroxidase (HRP)-conjugated secondary antibody (#S0001, Affinity) for 2 h at room temperature. The bands were developed using the ultrasensitive chemiluminescence detection kit (Epizyme, China) and captured by the ChemiDocXRS + gel imaging system (Bio-Rad, USA). Band intensity was measured using Image Lab software and analyzed by optical density.
Immunohistochemistry staining
The kidneys were fixed in 4% paraformaldehyde for 48 h, dehydrated by alcohol gradient, and then paraffin embedded after xylene was transparent. Tissue sections with a thickness of 4 μm were taken and placed in an oven at 60 °C for 2 h. Dewaxed and hydrated according to the kit instructions, placed in boiling sodium citrate solution for antigen retrieval. After PBS washing, added dropwise with 1% hydrogen peroxide solution at room temperature for peroxidase sealing.
And then wash again, blocking with 10% goat serum, after drying, the primary antibody was added dropwise and incubated overnight at 4 °C. HRP-conjugated secondary antibody was added, and after chemical development with DAB, counterstaining, dehydration, transparency. Five fields were randomly selected for filming under the microscope, and then the average optical density (AOD) and its integrated optical density value (IOD) value was measured by Image Pro Plus 6.0 analysis software.
Quantitative real-time PCR analysis
Follow the instructions of the RNA extraction kit (Thermo Fisher Scientific) to extract the total RNA of kidney tissue. The sample containing 1000 ng RNA was reverse to transcribed according to the Prime Script™ RT Master mix kit (Takara), and then TB Green™ Premix Ex Taq™ kit (Takara) was used for two-step real-time fluorescent quantitative PCR (RT qPCR). The reaction conditions were as follows: 95 °C for 30 s, 95 °C for 5 s and 60 °C 30 s, and lasting 40 cycles. Using GADPH as the internal reference gene, the 2−ΔΔCt method was used to quantitatively analyze the expression of PGC-1α, Mfn1 and OPA1 mRNA. The primer sequences used are shown in Table 1.
Table 1.
Primer sequences for qRT-PCR.
| Genes | Forward sequence (5′–3′) | Reverse sequence (5′–3′) | ||
|---|---|---|---|---|
| OPA1 | GACGACAAAGGCATCCAC | GCAATCATTTCCAGCACA | ||
| GAPDH | AAGAAGGTGGTGAAGCAGG | GAAGGTGGAAGAGTGGGAGT | ||
| Mfn2 | CTGGGGACCGGATCTTCTTC | CTGCCTCTCGAAATTCTGAAACT | ||
| PGC-1α | AAGTGGTGTAGCGACCAATCG | AATGAGGGCAATCCGTCTTCA | ||
Pathological evaluation
After paraffin-embedded kidney and colon tissue sections, 4 μm sections were stained with routine HE, and the pathological changes of kidney and colon were observed under high magnification (400×). After renal sections were stained with PAS, 5 fields were randomly selected under high power microscope. Image pro plus 6.0 software was used to measure and calculate the relative area of mesangial matrix, that is, the proportion of the area of PAS positive staining and total area of glomerular capillary loops.
Metabonomic analysis of feces and serum
Fecal samples were homogenized in distilled water containing 0.5% phosphoric acid. The supernatant was collected after centrifugation. N-butanol was added for extraction. Eight short-chain fatty acid standards were added to fresh n-butanol and mixed well. The resulting solution was designated as mixed standard stock solution A. Internal standard stock solution B was prepared by adding 2-ethylbutyric acid to fresh n-butanol and vortexing. Mixed standard solutions A and B were diluted with n-butanol to obtain seven working solutions of different concentrations for gas chromatography–mass spectrometry (GC–MS) analysis. Acetonitrile was added to the serum samples, the supernatant was obtained after centrifugation, and then mixed with 3NPH.HCL and EDC.HCL solution. Eight short-chain fatty acids were added to acetonitrile, then mixed with 3NPH.HCL and EDC.HCL solution and diluted into 14 concentration gradients for liquid chromatography-mass spectrometry tandem electrospray analysis (LC–ESI–MS/MS). GC–MS and LC–ESI–MS/MS (Agilent Technologies Inc., CA, USA) were performed under the corresponding chromatographic conditions. The scanning mode was selected ion scanning mode (SIM). The default parameters of Masshunter quantitative software and AB Sciex quantitative software were used to automatically identify and integrate each ion fragment of the target short-chain fatty acid. A standard curve was drawn, and the actual content of short-chain fatty acids in the sample was determined.
Analysis of intestinal flora
The DNA of intestinal flora was extracted from stool samples according to the instructions of the kit, and the DNA content of each sample was quantified by qubit fluorometer and microplate reader, and electrophoresis was carried out for quality inspection. Take qualified genomic DNA samples for PCR amplification, and use Agincourt ampure xp magnetic beads to purify the PCR amplification products and dissolve them in elution buffer. The Agilent 2100 bio analyzer was used to detect the fragment range and concentration of the library, and the qualified sample library was sequenced on the HISEQ platform. The high-quality clean data after data filtering is used for later analysis. The reads are spliced into tags through the overlap relationship between the reads, and then the tags are clustered into OTUs and compared with the database, species annotation. Based on OTU and annotation results, analysis the model’s complexity analysis, species difference analysis between groups, as well as association analysis and model prediction, etc.
Data analysis
The mean ± standard deviation ( ± SD) was used to describe the body weight, UACR, blood glucose, creatinine, blood urea nitrogen and other measurement data in each group. One-way analysis of variance (ANOVA) was used for comparison between multiple groups, and LSD-t method and Dunnett’s T3 test were used for comparison between two groups, while the fasting blood glucose (FBG) and body weight (BW) measured by repeated measurement analysis of variance. Using SPSS26.0 statistical software for data analysis and processing, and p < 0.05 was considered statistically significant.
Ethics statement
The manuscript is in accordance with ARRIVE guidelines.
Results
Sodium butyrate reduces body mass weight, renal weight and fasting blood glucose level in db/db mice
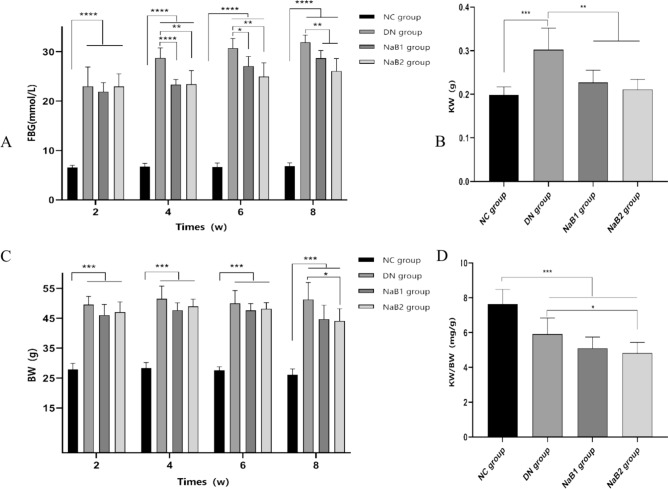
During the experiment, blood glucose and body weight were measured every two weeks. Results showed that body weight and blood glucose were significantly higher in the DN, NaB1, and NaB2 groups than in the NC group (Fig. 1). Compared with the DN group, both indices were reduced in the NaB1 and NaB2 groups, with a greater reduction observed in the NaB2 group (p < 0.05). Additionally, sodium butyrate intervention was found to reduce kidney weight (KW) and renal hypertrophy index (KW/BW), with the NaB2 group exhibiting a more significant effect on reducing (KW/BW) (p < 0.05).
Figure 1.
The effect of sodium butyrate on FBG, BW, KW and KE/BW. (A) Measurement of blood glucose in mice. (B) Measurement of kidney weight in mice. (C) Measurement of body weight in mice. (D) Measurement of renal hypertrophy index in mice. *p < 0.05, **p < 0.01, ***p < 0.001. FBG blood glucose, KW kidney weight, BW body weight, KW/BW renal hypertrophy index.
Sodium butyrate improves kidney injury and increases GLP-1 level of serum in db/db mice
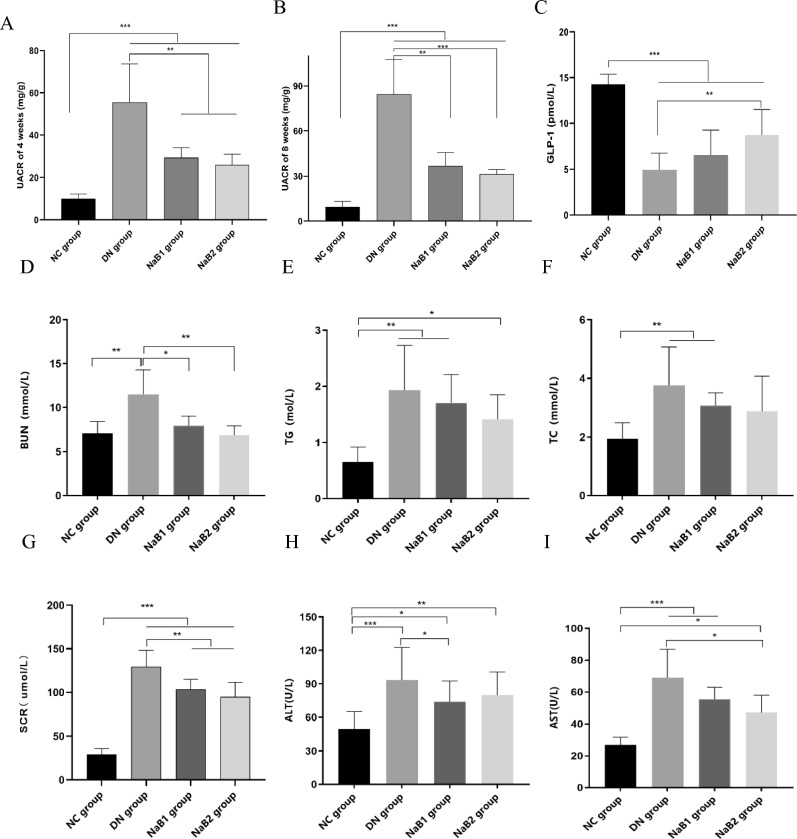
Db/db mice were continuously given sodium butyrate by gavage for 8 weeks, and the changes of UACR, GLP-1, BUN, SCR, TG and TC of the mice were detected (Fig. 2). The results showed that the UACR of the mice in the DN group increased significantly, no matter 4 weeks or 8 weeks. After sodium treatment, the UACR in NaB1 group and NaB2 group were significantly decreased (p < 0.05), and the difference was statistically significant, but there was no significant difference between the two treatment groups. After the serum was separated, blood biochemical indexes of the mice in each group were detected. The result showed that the level of GLP-1 of serum decreased significantly in DN group, but sodium butyrate could partially restore this effect, especially in NaB2 group (p < 0.05). We found that the BUN, SCR, TG, TC, ALT and AST of the db/db mice were significantly higher than those of the db/m mice (p < 0.05). After 8 weeks of treatment with two doses of sodium butyrate, the above serum indexes decreased to varying degrees, especially BUN and CR (p < 0.05).
Figure 2.
The effect of sodium butyrate on UACR, GLP-1, renal function, blood lipids, and liver function. (A) The level of UACR of 4 weeks in mice. (B) The level of UACR of 8 weeks in mice. (C) The level of GLP-1 of serum in mice. (D) Measurement of BUN in mice. (E) Measurement of TG in mice. (F) Measurement of TC in mice. (G) Measurement of SCR in mice. (H) Measurement of ALT in blood. (I) Measurement of AST in blood. *p < 0.05, **p < 0.01, ***p < 0.001.
Sodium butyrate inhibits inflammatory response of intestine and kidney
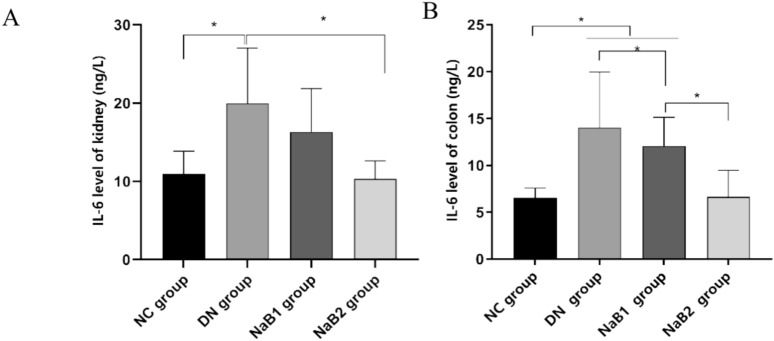
At the same time, we also detected the expression of interleukin 6 (IL-6) in the kidney and colon tissue (Fig. 3). Our study found that the expression of IL-6 in the kidney and colon tissue of db/db mice was significantly increased, and sodium butyrate treatment could reduce the expression in the kidney and colon, and compared with the 500 mg/kg·d sodium butyrate treatment dose, the 1000 mg/kg·d treatment dose seemed to be more effective in reducing IL-6 expression (p < 0.05).
Figure 3.
The effect of sodium butyrate on IL-6. (A) The level of IL-6 in kidney. (B) The level of IL-6 in colon.
Sodium butyrate inhibits oxidative stress, inflammation, and activates AMPK signaling
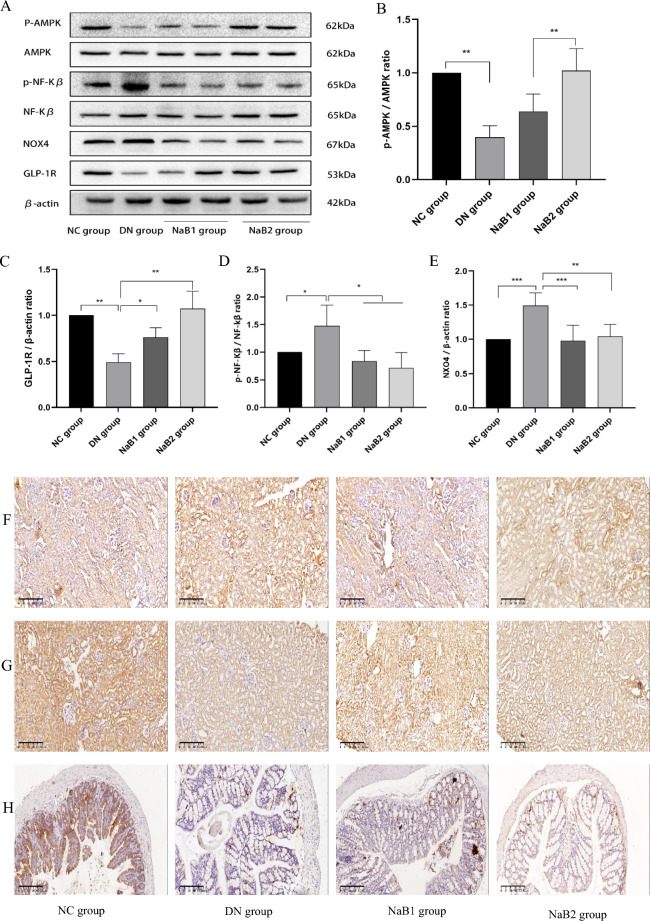
The expression of GLP-1R, AMPK, NOX4, and NF-κB proteins in mouse kidneys was detected by immunohistochemistry (IHC) and Western blot (WB) (Fig. 4). Results showed that GLP-1R protein expression was significantly reduced in the DN group compared to the NC group. However, GLP-1R expression was abundantly expressed in the NaB1 and NaB2 groups (p < 0.05). IHC and WB analyses indicated that NADPH oxidase 4 (NOX4) protein expression was significantly enhanced in the DN group. After 8 weeks of treatment with sodium butyrate, NOX4 protein expression in the treatment groups decreased. Similarly, NF-κB protein expression was elevated in the DN group. However, NF-κB protein expression decreased in the NaB1 and NaB2 groups, and the difference was statistically significant. The p-AMPK/AMPK ratio in the DN group was significantly lower than that in the NC, NaB1, and NaB2 groups (p < 0.05).
Figure 4.
Effect of sodium butyrate on protein expression. (A) Protein bands of western blotting. (B) Renal P-AMPK and AMPK protein ratio. (C) Relative expression of GLP-1R protein in kidney. (D) Renal P-NF-KB and NF-KB protein ratio. (E) Relative expression of NOX4 protein in kidney. (F) Protein expression levels of P-NF-KB in kidneys of mice measured by immunohistochemical staining (100×). (G) Protein expression levels of GLP-1R in kidneys of mice measured by immunohistochemical staining in mice (100×). (H) Protein expression levels of GLP-1 in colons of mice measured by immunohistochemical staining (100×). (I) Relative expression of P-NF-KB protein in kidney. (J) Relative expression of GLP-1R protein in kidney. (K) Relative expression of GLP-1 protein in colon. *p < 0.05, **p < 0.01, ***p < 0.001.
These findings suggest that sodium butyrate can inhibit oxidative stress, inflammation, and activate AMPK signaling in the kidneys of mice with diabetic nephropathy.
Sodium butyrate improves mitochondrial function in kidney tissue
Kidney tissue RNA was extracted for qRT-PCR experiments (Fig. 5). Peroxisome proliferator (PPAR)-activated receptor gamma co-stimulatory factor 1α (PGC-1α) is an important transcription factor regulating mitochondrial function and structural integrity. Compared with the NC group, the mRNA levels of PGC-1α and its downstream mitochondrial fusion genes Mfn1/2 and Opa1 in DN group were significantly decreased (p < 0.05), while the expressions of NaB1 and NaB2 groups were significantly increased (p < 0.05). Interestingly, the expression in latter group is more abundant.
Figure 5.
Effect of sodium butyrate on kidney mitochondria fusion genes. (A) Level of renal fusion gene PGC-1α. (B) Level of renal fusion gene OPA1. (C) Level of renal fusion gene MFN2.
Sodium butyrate improves kidney and intestinal histopathology in diabetic nephropathy mice
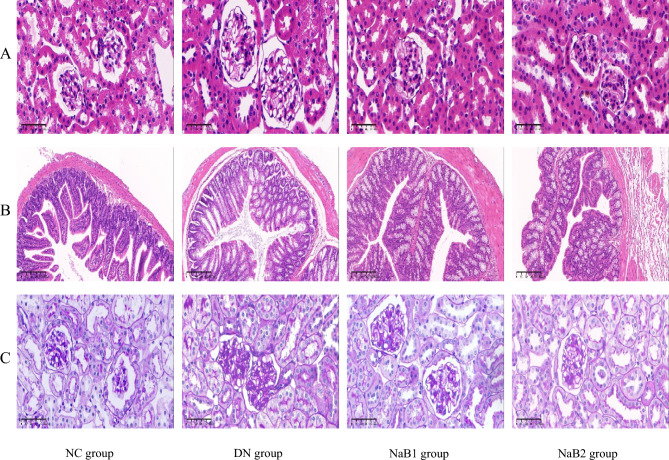
Compared with the NC group, the typical pathological changes of diabetic nephropathy appeared in the DN group, which was manifested by increased kidney size and glomerular area, swelling of renal tubular epithelium with lumen expansion, mesangial hyperplasia and basement membrane thickening. However, the degree of glomerular hypertrophy and interstitial matrix expansion in NaB1 and NaB2 treatment groups were reduced (Fig. 6). We also performed HE staining on the colon tissues of mice in each group. Compared with the NC group, the colonic epithelial cells in the DN group were disordered and infiltrated by inflammatory cells, the villi became sparse and shorter, the gap became wider, and the goblet cells increased significantly. Fortunately, the above conditions of the group have improved after sodium butyrate treatment. In the NaB1 and NaB2 groups, the colonic epithelial cells were arranged more neatly, the infiltration of inflammatory cells was reduced, the villi became denser and longer, the gaps became narrower, and the number of goblet cells decreased. These results suggest that sodium butyrate can improve the intestinal histopathological changes in diabetic nephropathy mice.
Figure 6.
The effect of sodium butyrate on pathological changes of kidney and colon. (A) HE staining of renal tissue (400×). (B) HE staining of colon tissue (100×). (C) PAS staining of renal tissue (400×).
Sodium butyrate increases the content of short chain fatty acids in feces of diabetes nephropathy mice
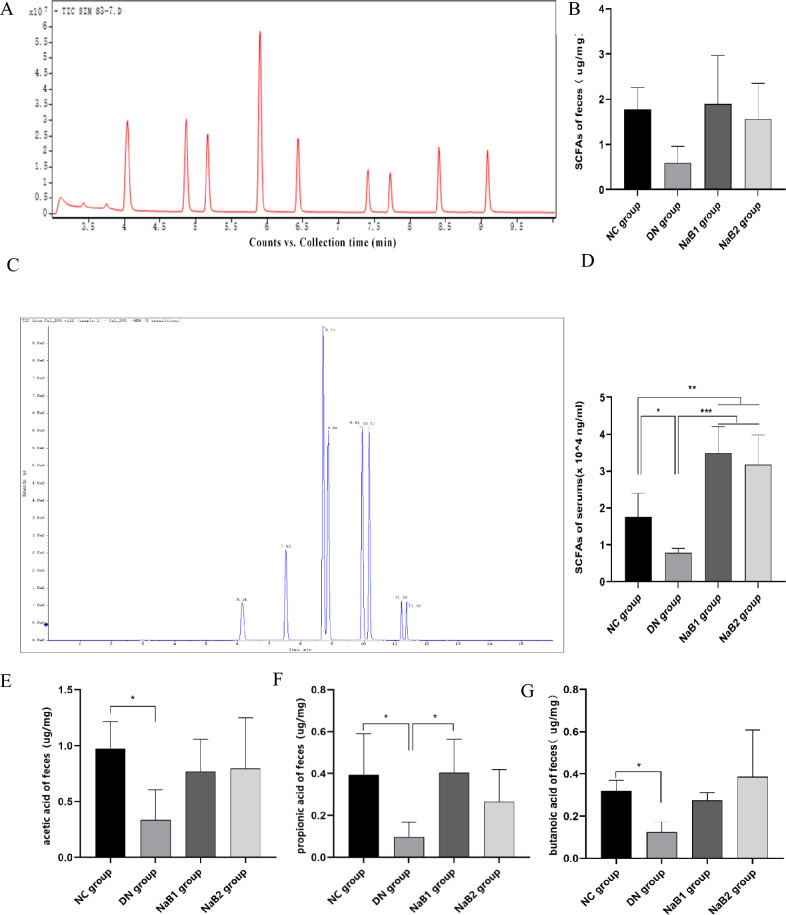
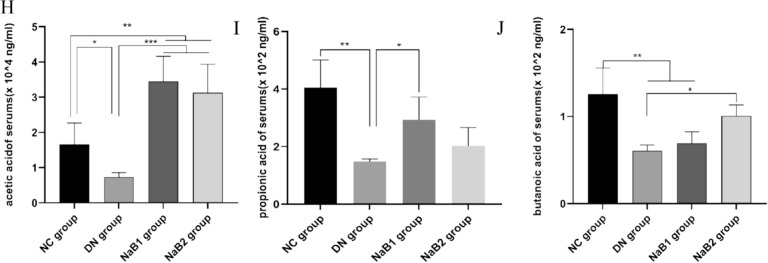
The GC–MS and LC–ESI–MS/MS methods were used to detect and analyze eight types of short-chain fatty acids (SCFAs) in the standard and samples. Total ion chromatography (TIC) results showed that each analyte had high resolution and good peak shape (Fig. 7). A linear regression standard curve was drawn with the ratio of the chromatographic peak area of the target analyte to the peak area of the internal standard as the ordinate and the concentration as the abscissa. The linear correlation coefficient (R2) of all analytes was greater than 0.99, indicating good linearity. Quality control (QC) samples were used to evaluate the stability of the analytical system. The results showed that the relative standard deviation (RSD) of the stability of each target compound was less than 15%, indicating that the method and analytical system were stable and reliable, and could be used for quantitative detection of samples.
Figure 7.
Effects of sodium butyrate on short-chain fatty acids in serum and feces. (A) TIC diagram of feces. (B) Measurement of SCFAs in feces. (C) TIC diagram of serum. (D) Measurement of SCFAs in serum. (E) Measurement of acetic acid content in feces. (F) Measurement of propionic acid content in feces. (G) Measurement of butanic acid content in feces. (H) Measurement of acetic acid content in serum. (I) Measurement of propionic acid content in serum. (J) Measurement of butanic acid content in serum.
The results showed that the content of SCFAs in serum and feces decreased in DN group. After treatment with sodium butyrate, the two all increased in varying degrees, especially acetic acid, propionic acid and butyric acid, and this effect was more obvious in serum: compared with DN group, propionic acid was significantly up-regulated in NaB1 group, and acetic acid and butyric acid were significantly increased in NaB2 group. However, this effect on the regulation of fecal SCFAs was weakened.
Sodium butyrate regulates intestinal microbiota structure in mice with diabetic nephropathy
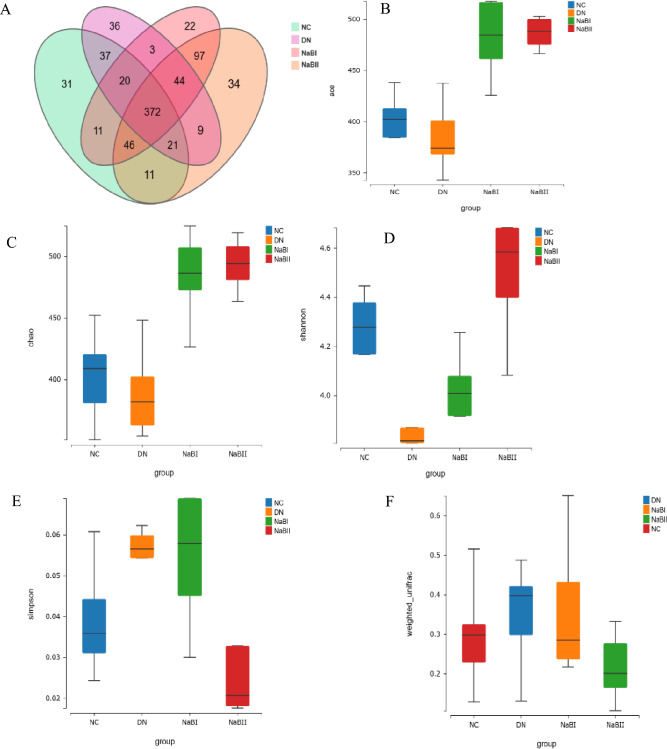
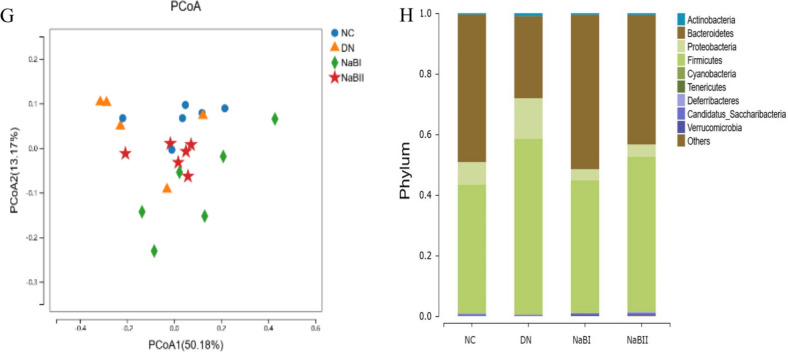
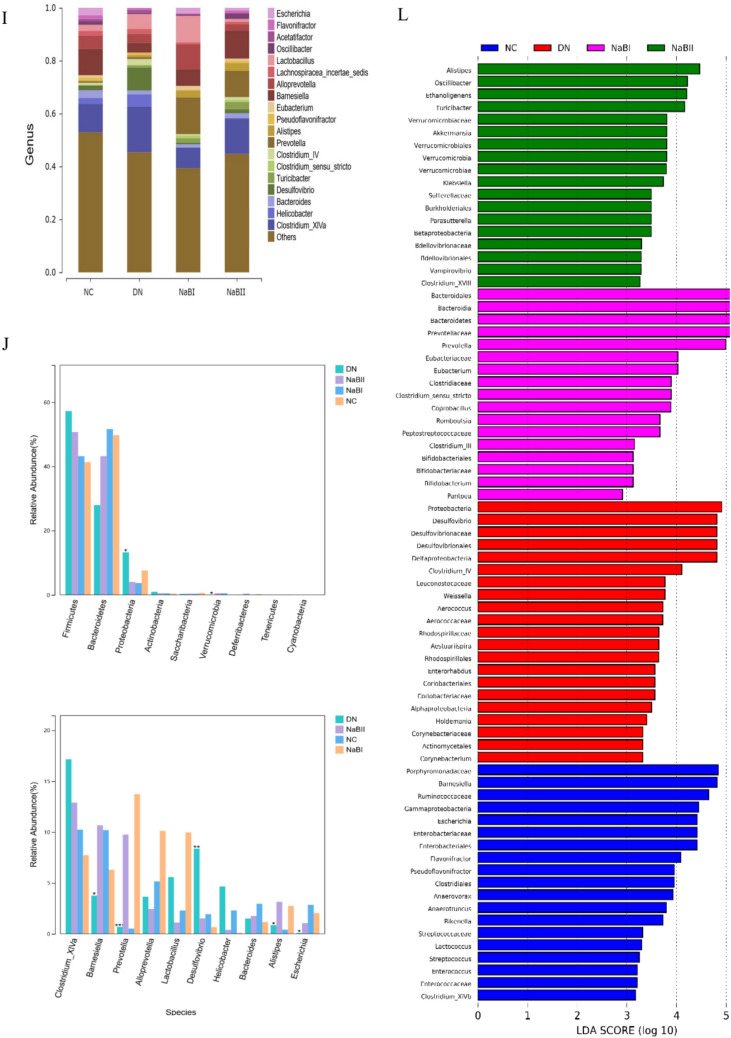
To investigate the abundance and composition of gut microbiota, fecal samples were collected from 24 mice for 16S rRNA analysis (Fig. 8). Compared with the DN group, the NC, NaB1, and NaB2 groups had higher intestinal flora Chao1, ACE, and Shannon indices (p < 0.01), and decreased β diversity indices (p < 0.01). Similarly, the abundance and diversity of fecal dominant bacteria in the colon of mice were significantly changed after sodium butyrate treatment.
Figure 8.
The fecal microbial α-diversity and differentially abundant taxa in four groups. (A) α diversity of fecal intestinal flora in four groups. (B) The fecal microbial richness calculated by ACE among four groups. (C) The fecal microbial richness calculated by Chao among four groups. (D) The fecal microbial richness calculated by Shannon among four groups. (E) The fecal microbial uniformity calculated by Simpson among four groups. (F) Four groups of fecal microorganisms β diversity box diagram. (G) Fecal microbial β diversity calculated by principal coordinate analysis among four groups. (H) Histogram of species composition at the phylum level. (I) Histogram of species composition at the genus level. (J) Analysis of bacteria groups with significant difference at phylum level. (K) Analysis of significantly different flora at genus level. (L) LDA effect size among four groups.
Linear discriminant analysis (LDA) was performed at the phylum and genus levels using the linear discriminant analysis effect size (LEfSe) method. Significant differences were found at both levels of the flora, including Proteobacteria, Firmicutes, Bacteroidetes, Barnesiella, Prevotella, Allobaculum, and Desulfovibrio. Further analysis found that Bacteroidetes, Eubacterium, Barnesiella, and Bifidobacteria were the dominant bacteria in the NC, NaB1, and NaB2 groups, but Proteobacteria, Firmicutes, and Desulfovibrio were more abundant in the DN group.
These findings suggest that sodium butyrate may regulate the intestinal microbiota structure in mice with diabetic nephropathy.
Discussion
The results of this study showed that after 8 weeks of treatment, although we were unable to detect a significant increase in SCFAs concentration in the feces, serum SCFAs were differentially altered between the two treatment groups, especially acetic acid, propionic acid and butyric acid, but there was no significant difference between them. In addition, we also found that the changes in the composition of intestinal microflora, mainly manifested as an increase of butyrate-rich bacteria.
The vast array of intestinal microbiota, known as the “second brain” or even the “organ” of the human body, is closely linked to overall health and the development and progression of immune, respiratory, digestive, cardiovascular, urinary, and nervous system diseases.
Studies have shown that DN patients exhibit significant intestinal flora imbalance, characterized by decreased microbial diversity and increased opportunistic pathogens. This flora imbalance is primarily manifested in the reduction of butyrate-producing bacteria, such as Roseburia, Turicibacter, Clostridium, Rothia, and Faecalibacterium prausnitzii16,17.
Fortunately, relevant studies have demonstrated that fecal microbiota transplantation (FMT) can partially reverse intestinal microbiota imbalance18,19. A study showed there were significant differences in the pattern of intestinal flora between patients with diabetes and patients with normal glucose tolerance (NGT). After 10 weeks of FMT in DN mice, the richness and diversity of intestinal microorganisms increased, and hyperlipidemia and insulin resistance improved18.
Several recent studies have shown that (SCFAs), metabolites of intestinal flora, act as a “bridge” between the intestine and the kidney. Xu et al. found that early administration of sodium butyrate in DN can partially reverse endotoxemia, oxidative stress, and restore intestinal flora structure20. These findings are consistent with our research. Our research found that db/db mice have a different intestinal structure from db/m mice. Specifically, Proteobacteria and Desulfovibrio bacteria are enriched in DN mice, while the intestinal microflora of DN mice treated with butyric acid changed, showing an increase in biodiversity, a decrease in F/B and Proteobacteria. In addition, we also found that the number of butyrate-rich bacteria increased, such as Bifidobacterium, Eubacterium and Pasteurella, which indicated that sodium butyrate treatment could reverse the imbalance of intestinal flora in DN to some extent. The results support that butyrate could improve the richness and diversity of intestinal microflora, reshape the structure of intestinal microflora and maintain the homeostasis of intestinal microflora, which need more experimental data to prove in the future.
Some studies suggest that the detrimental effects of diabetes mellitus (DM) on the kidney may be associated with the inhibition of glucagon-like peptide (GLP-1) action. When diabetic nephropathy (DN) occurs, the secretion of GLP-1 by intestinal L-cells decreases21. Furthermore, the GLP-1 receptor (GLP-1R) on glomerular endothelial cells is activated through the ubiquitination or angiotensin II-mediated degradation pathway, resulting in increased GLP-1R degradation22.
Recent studies have shown that butyrate can bind to G-protein coupled receptors 41 (GPR41) and 43 (GPR43) on the cell surface to regulate the secretion of intestinal hormones23–25, such as glucose-dependent insulinotropic polypeptide (GIP) and GLP-1. Our study confirmed that supplementation with exogenous sodium butyrate increased GLP-1 secretion and reduced GLP-1R degradation, thereby playing a role in lowering blood glucose and promoting weight loss. These findings suggest that sodium butyrate may exert renoprotective effects in DN by upregulating GLP-1R expression and enhancing GLP-1 signaling.
A study demonstrated that dietary butyrate and butyrate produced from resistant starch can reduce abdominal fat in rodents in different ways-there was no cecal butyrate increase for dietary butyrate26. Similarly, in our experiment, it was seemed to us that the abdominal fat (epididymal, perirenal and retroperitoneal) in the DN group was more obvious than that in the NaB1 group and NaB2 group, but the data were not measured. However, we measured the BW, TC and TG of mice and found that they all decreased in some degrees in the two experimental groups, and a similar phenomenon was found in inulin-a natural dietary fiber that could be fermented by intestinal microorganisms to produce SCFAs and balance intestinal microbiota27.
Butyrate can not only provide the material energy required by colonic epithelial cells but also induce colonic epithelial cell proliferation, which is important for maintaining the integrity and functionality of the intestinal barrier. Studies have confirmed that sodium butyrate can reduce renal fibrosis in diabetic nephropathy mice and inhibit the expression of inflammatory factors in the kidneys of db/db mice by regulating the miR-7a-5p/P311/TGF-β1 pathway28. Huang et al.29 observed that supplementation with butyric acid in a certain concentration range can inhibit oxidative stress and inflammatory damage of mesangial cells induced by high glucose. Additionally, under high glucose conditions, the expression of caspase-1 protein in glomerular endothelial cells promotes the hydrolysis of gasdermin D (GSDMD) and forms pores in the cell membrane to trigger cell death. However, supplementation with sodium butyrate reduces the expression of caspase-1 protein in glomerular endothelial cells, thereby reducing endothelial cell damage and apoptosis30.
Our study found that the expression of NF-κB, NOX4, and other factors in the kidney tissue of mice in the DN group was significantly increased, and the expression decreased after sodium butyrate treatment. At the same time, we also detected the expression of interleukin-6 (IL-6) in the kidney and intestinal tissues of mice, which is consistent with previous results, suggesting that short-chain fatty acids (SCFAs) can inhibit oxidative stress, inflammation, and reduce the damage of renal tissues in DN. In addition, we also performed metabolomic analysis on the serum and feces and found that sodium butyrate could significantly increase the total SCFAs, acetic acid, propionic acid and butyric acid in serum, with no significant effect on the content of butyric acid in feces, which was consistent with some studies31,32. The balance between intestinal tract and butyric acid is difficult to be accurately measured after the rapid use of SCFAs as an energy source of colonic epithelium and the characteristics of volatile32,33. But there are also some studies have found that sodium butyrate can significantly affect the content of SCFAs in feces34. However, combined with the results of biochemistry, pathology and SCFAs in serum, we could think that sodium butyrate intervention therapy was effective.
These findings suggest that sodium butyrate may exert renoprotective effects in DN by regulating the expression of inflammatory factors, inhibiting oxidative stress, and reducing apoptosis of renal cells. Additionally, sodium butyrate can increase the abundance of beneficial bacteria in the gut, which may contribute to its renoprotective effects.
Kang35 confirmed that fatty acid oxidation is inhibited in diabetic nephropathy (DN). Glomerular peroxisome proliferator-activated receptor (PPAR) gamma coactivator 1α (PGC-1α) mRNA expression is significantly reduced in DN. PPAR and PGC-1α are key regulators of the transcription of proteins related to fatty acid uptake and oxidation36. Mitochondria are important sites for biogenesis and synthesis, fatty acid oxidation, and energy metabolism. Opa1 protein and fusion genes Mfn1 and Mfn2, which encode mitochondrial fusion proteins, are important downstream factors of PGC-1α and are essential for maintaining mitochondrial function. Studies have shown that decreased PGC-1α expression can lead to mitochondrial dysfunction and structural abnormalities. Additionally, excessive reactive oxygen species (ROS) are generated, which act on biological membranes and macromolecules to cause lipid peroxidation damage, thereby promoting the progression of DN. Some scholars have pointed out that when mitochondrial fusion genes are deficient, mitochondria become fragmented, tubular structure is lost, and mitochondrial function is impaired37.
Butyrate can activate AMP-activated kinase (AMPK) under certain conditions. AMPK has the function of promoting the synthesis of the downstream factor PGC-1α. Therefore, butyrate can regulate PGC-1α and its downstream signaling factors, thereby affecting mitochondrial function. Our study found that the expression of p-AMPK/AMPK protein in DN group mice was significantly reduced. However, the expression of p-AMPK/AMPK protein was increased in mice after butyrate supplementation treatment. Further analysis of the expression of fusion genes in mitochondria revealed that the levels of mitochondrial fusion gene Mfn2 and OPA1 mRNA were increased. These findings confirm that butyric acid can restore the function of damaged mitochondria through the AMPK/Sirt1/PGC-1α signaling pathway. This can increase mitochondrial metabolites, interfere with body metabolism, reduce renal fatty acid accumulation, and alleviate renal tissue damage.
Conclusion
In conclusion, our findings demonstrate that sodium butyrate intervention can reduce blood glucose and urinary albumin-to-creatinine ratio (UACR) in db/db mice, alleviate kidney damage in diabetic nephropathy (DN) mice, improve mitochondrial function, and regulate energy metabolism. Based on the “gut–kidney axis”, this study explored the protective effect of sodium butyrate on the kidney from the perspective of metabolites and intestinal flora, providing a preliminary basis for its therapeutic effect on DN.
Weaknesses:
We believe that butyrate affects the body's energy metabolism through the AMPK/Sirt1/PGC-1α signaling pathway. Further detection of PGC-1α and its downstream MFN2 and OPA1 protein levels is required to confirm this hypothesis.
The efficacy of intestinal flora metabolite butyrate in improving DN still needs to be determined through more clinical trials.
Supplementary Information
Author contributions
Ye Kaili and Zhao Yanling designed the research.Ye Kaili and Zhu Yonglin did the research. Ye Kaili and Huang Wen wrote the main manuscript text. Zhu Yonglin revised the main manuscript text. All authors reviewed the manuscript.
Data availability
Data is provided within the manuscript or supplementary information files. See the original data in the attached files.
Competing interests
The authors declare no competing interests.
Footnotes
Publisher's note
Springer Nature remains neutral with regard to jurisdictional claims in published maps and institutional affiliations.
Supplementary Information
The online version contains supplementary material available at 10.1038/s41598-024-68227-8.
References
- 1.Zheng, Y., Ley, S. H. & Hu, F. B. Global aetiology and epidemiology of type 2 diabetes mellitus and its complications. J. Nat. Rev. Endocrinol.14(2), 88–98 (2018). 10.1038/nrendo.2017.151 [DOI] [PubMed] [Google Scholar]
- 2.Saeedi, P. et al. Global and regional diabetes prevalence estimates for 2019 and projections for 2030 and 2045: Results from the International Diabetes Federation Diabetes Atlas, 9(th) edition. J. Diabetes Res. Clin. Pract.157, 107843 (2019). 10.1016/j.diabres.2019.107843 [DOI] [PubMed] [Google Scholar]
- 3.Victor, P. et al. Crosstalk between endoplasmic reticulum stress and oxidative stress in the progression of diabetic nephropathy. J. Cell Stress Chaperones26(2), 311–321 (2021). 10.1007/s12192-020-01176-z [DOI] [PMC free article] [PubMed] [Google Scholar]
- 4.Fernandes, R. et al. Diabetic gut microbiota dysbiosis as an inflammaging and immunosenescence condition that fosters progression of retinopathy and nephropathy. J. Biochim. Biophys. Acta Mol. Basis Dis.185(7), 1876–1897 (2019). 10.1016/j.bbadis.2018.09.032 [DOI] [PubMed] [Google Scholar]
- 5.Samsu, N. Diabetic nephropathy: Challenges in pathogenesis, diagnosis, and treatment. J. Biomed Res. Int.2021, 1497449 (2021). [DOI] [PMC free article] [PubMed] [Google Scholar]
- 6.He, M. & Shi, B. Gut microbiota as a potential target of metabolic syndrome: The role of probiotics and prebiotics. Cell Biosci.7, 54 (2017). 10.1186/s13578-017-0183-1 [DOI] [PMC free article] [PubMed] [Google Scholar]
- 7.Tao, Y. et al. The gut microbiota and the brain–gut–kidney axis in hypertension and chronic kidney disease. J. Nat. Rev. Nephrol.14(7), 442–456 (2018). 10.1038/s41581-018-0018-2 [DOI] [PMC free article] [PubMed] [Google Scholar]
- 8.Barrios, C. et al. Gut–microbiota–metabolite axis in early renal function decline. PLoS One10(8), e0134311 (2015). 10.1371/journal.pone.0134311 [DOI] [PMC free article] [PubMed] [Google Scholar]
- 9.Sabatino, A. et al. Intestinal microbiota in type 2 diabetes and chronic kidney disease. J. Curr. Diabetes Rep.17(3), 16 (2017). 10.1007/s11892-017-0841-z [DOI] [PubMed] [Google Scholar]
- 10.Huang, W. et al. Short-chain fatty acids ameliorate diabetic nephropathy via GPR43-mediated inhibition of oxidative stress and NF-kappaB signaling. J. Oxid. Med. Cell. Longev.2020, 4074832 (2020). [DOI] [PMC free article] [PubMed] [Google Scholar]
- 11.Tang, C. et al. Loss of FFA2 and FFA3 increases insulin secretion and improves glucose tolerance in type 2 diabetes. J. Nat. Med.21(2), 173–177 (2015). 10.1038/nm.3779 [DOI] [PubMed] [Google Scholar]
- 12.Morrison, D. J. & Preston, T. Formation of short chain fatty acids by the gut microbiota and their impact on human metabolism. Gut Microbes7(3), 189–200 (2016). 10.1080/19490976.2015.1134082 [DOI] [PMC free article] [PubMed] [Google Scholar]
- 13.Zhang, W. Q. et al. Sodium butyrate improves liver glycogen metabolism in type 2 diabetes mellitus. J. Agric. Food Chem.67(27), 7694–7705 (2019). 10.1021/acs.jafc.9b02083 [DOI] [PubMed] [Google Scholar]
- 14.Dong, W. et al. Sodium butyrate activates NRF2 to ameliorate diabetic nephropathy possibly via inhibition of HDAC. J. Endocrinol.232(1), 71–83 (2017). 10.1530/JOE-16-0322 [DOI] [PubMed] [Google Scholar]
- 15.Tang, X. et al. Sodium butyrate protects against oxidative stress in high-fat-diet-induced obese rats by promoting GSK-3beta/Nrf2 signaling pathway and mitochondrial function. J. Food Biochem.46(10), e14334 (2022). 10.1111/jfbc.14334 [DOI] [PubMed] [Google Scholar]
- 16.Larsen, N. et al. Gut microbiota in human adults with type 2 diabetes differs from non-diabetic adults. PLoS One5(2), e9085 (2010). 10.1371/journal.pone.0009085 [DOI] [PMC free article] [PubMed] [Google Scholar]
- 17.Weihong, C. et al. The profile and function of gut microbiota in diabetic nephropathy. J. Diabetes Metab. Syndr. Obes.14, 4283–4296 (2021). 10.2147/DMSO.S320169 [DOI] [PMC free article] [PubMed] [Google Scholar]
- 18.Zhang, P. P. et al. Fecal microbiota transplantation improves metabolism and gut microbiome composition in db/db mice. J. Acta Pharmacol. Sin.41(5), 678–685 (2020). 10.1038/s41401-019-0330-9 [DOI] [PMC free article] [PubMed] [Google Scholar]
- 19.Vrieze, A. et al. Transfer of intestinal microbiota from lean donors increases insulin sensitivity in individuals with metabolic syndrome. J. Gastroenterol.143(4), 913-916 e7 (2012). [DOI] [PubMed] [Google Scholar]
- 20.Xu, Y. H. et al. Sodium butyrate supplementation ameliorates diabetic inflammation in db/db mice. J. Endocrinol.238(3), 231–244 (2018). 10.1530/JOE-18-0137 [DOI] [PubMed] [Google Scholar]
- 21.Drucker, D. J. Mechanisms of action and therapeutic application of glucagon-like peptide-1. Cell Metab.27(4), 740–756 (2018). 10.1016/j.cmet.2018.03.001 [DOI] [PubMed] [Google Scholar]
- 22.Mima, A. et al. Protective effects of GLP-1 on glomerular endothelium and its inhibition by PKCbeta activation in diabetes. J. Diabetes61(11), 2967–2979 (2012). 10.2337/db11-1824 [DOI] [PMC free article] [PubMed] [Google Scholar]
- 23.Feng, Y. et al. Modulating the gut microbiota and inflammation is involved in the effect of Bupleurum polysaccharides against diabetic nephropathy in mice. Int. J. Biol. Macromol.132, 1001–1011 (2019). 10.1016/j.ijbiomac.2019.03.242 [DOI] [PubMed] [Google Scholar]
- 24.Byrne, C. S. et al. The role of short chain fatty acids in appetite regulation and energy homeostasis. Int. J. Obes. (Lond)39(9), 1331–1338 (2015). 10.1038/ijo.2015.84 [DOI] [PMC free article] [PubMed] [Google Scholar]
- 25.Forbes, S. et al. Selective FFA2 agonism appears to act via intestinal PYY to reduce transit and food intake but does not improve glucose tolerance in mouse models. J. Diabetes64(11), 3763–3771 (2015). 10.2337/db15-0481 [DOI] [PubMed] [Google Scholar]
- 26.Vidrine, K. et al. Resistant starch from high amylose maize (HAM-RS2) and dietary butyrate reduce abdominal fat by a different apparent mechanism. Obesity (Silver Spring, MD)22(2), 344–348 (2014). 10.1002/oby.20501 [DOI] [PubMed] [Google Scholar]
- 27.Li, K. et al. Dietary inulin alleviates diverse stages of type 2 diabetes mellitus via anti-inflammation and modulating gut microbiota in db/db mice. Food Funct.10(4), 1915–1927 (2019). 10.1039/C8FO02265H [DOI] [PubMed] [Google Scholar]
- 28.Du, Y. et al. Butyrate alleviates diabetic kidney disease by mediating the miR-7a-5p/P311/TGF-beta1 pathway. FASEB J.34(8), 10462–10475 (2020). 10.1096/fj.202000431R [DOI] [PubMed] [Google Scholar]
- 29.Huang, W. et al. Short-chain fatty acids inhibit oxidative stress and inflammation in mesangial cells induced by high glucose and lipopolysaccharide. Exp. Clin. Endocrinol. Diabetes125(2), 98–105 (2017). 10.1055/s-0042-121493 [DOI] [PubMed] [Google Scholar]
- 30.Ren, X. et al. Influence of dipeptidyl peptidase-IV inhibitor sitagliptin on extracellular signal-regulated kinases 1/2 signaling in rats with diabetic nephropathy. J. Pharmacol.100(1–2), 1–13 (2017). [DOI] [PubMed] [Google Scholar]
- 31.Bouter, K. et al. Differential metabolic effects of oral butyrate treatment in lean versus metabolic syndrome subjects. Clin. Transl. Gastroenterol.9(5), 155 (2018). 10.1038/s41424-018-0025-4 [DOI] [PMC free article] [PubMed] [Google Scholar]
- 32.Zhai, S. et al. Effect of lactulose intervention on gut microbiota and short chain fatty acid composition of C57BL/6J mice. Microbiol. Open7(6), e00612 (2018). 10.1002/mbo3.612 [DOI] [PMC free article] [PubMed] [Google Scholar]
- 33.Zhu, L. et al. Inulin with different degrees of polymerization modulates composition of intestinal microbiota in mice. FEMS Microbiol. Lett.10.1093/femsle/fnx075 (2017). 10.1093/femsle/fnx075 [DOI] [PubMed] [Google Scholar]
- 34.Zhai, S. et al. Dietary butyrate suppresses inflammation through modulating gut microbiota in high-fat diet-fed mice. FEMS Microbiol. Lett.366(13), fnz153 (2019). 10.1093/femsle/fnz153 [DOI] [PubMed] [Google Scholar]
- 35.Kang, H. M. et al. Defective fatty acid oxidation in renal tubular epithelial cells has a key role in kidney fibrosis development. J. Nat. Med.21(1), 37–46 (2015). 10.1038/nm.3762 [DOI] [PMC free article] [PubMed] [Google Scholar]
- 36.Qi, W. et al. Pyruvate kinase M2 activation may protect against the progression of diabetic glomerular pathology and mitochondrial dysfunction. J. Nat. Med.23(6), 753–762 (2017). 10.1038/nm.4328 [DOI] [PMC free article] [PubMed] [Google Scholar]
- 37.Yapa, N. M. B. et al. Mitochondrial dynamics in health and disease. FEBS Lett.595(8), 1184–1204 (2021). 10.1002/1873-3468.14077 [DOI] [PubMed] [Google Scholar]
Associated Data
This section collects any data citations, data availability statements, or supplementary materials included in this article.
Supplementary Materials
Data Availability Statement
Data is provided within the manuscript or supplementary information files. See the original data in the attached files.


