

Abstract
Resistance to poly (ADP-ribose) polymerase inhibitors (PARPi) limits the therapeutic efficacy of PARP inhibition in treating breast cancer susceptibility gene 1 (BRCA1)-deficient cancers. Here we reveal that BRCA1 has a dual role in regulating ferroptosis. BRCA1 promotes the transcription of voltage-dependent anion channel 3 (VDAC3) and glutathione peroxidase 4 (GPX4); consequently, BRCA1 deficiency promotes cellular resistance to erastin-induced ferroptosis but sensitizes cancer cells to ferroptosis induced by GPX4 inhibitors (GPX4i). In addition, nuclear receptor coactivator 4 (NCOA4)-mediated ferritinophagy and defective GPX4 induction unleash potent ferroptosis in BRCA1-deficient cancer cells upon PARPi and GPX4i co-treatment. Finally, we show that xenograft tumors derived from BRCA1-mutant breast cancer patients with PARPi resistance exhibit decreased GPX4 expression and high sensitivity to PARP and GPX4 co-inhibition. Our results show that BRCA1 deficiency induces a ferroptosis vulnerability to PARP and GPX4 co-inhibition and inform a therapeutic strategy for overcoming PARPi resistance in BRCA1-deficient cancers.
Keywords: BRCA1, ferroptosis, GPX4, VDAC3, PARP inhibitor, cancer therapy
INTRODUCTION
Hereditary mutations in the tumor suppressor breast cancer susceptibility gene 1 (BRCA1) predispose to pancreatic, prostate, breast, and ovarian cancers (1,2). BRCA1 is a multifunctional protein that plays an integral role in governing genome integrity, as well as regulating other cellular processes such as gene transcription (1,3,4). BRCA1-deficient cancer cells exhibit DNA repair defects and are exquisitely sensitive to poly (ADP-ribose) polymerase inhibitors (PARPi) (5,6). PARPi, such as olaparib and niraparib, have been used clinically to treat BRCA1-deficient cancers, and are now Food and Drug Administration (FDA) approved for treating multiple cancer types (7–9). However, 40%-60% of cancer patients with BRCA1 deficiency do not respond to PARPi or almost inevitably develop resistance to PARPi even if they do respond initially (10–13). Current studies have identified diverse PARPi resistance mechanisms in BRCA1-deficient cancers, such as the restoration of homologous recombination (HR) repair (e.g., p53-binding protein 1 (53BP1) deficiency) (9,14,15). While investigating these resistance mechanisms will undoubtedly yield critical insights into overcoming PARPi resistance in BRCA1-deficient cancer, there remains a pressing need to identify additional targetable vulnerabilities in BRCA1-deficient cancers and to develop more effective combination therapeutic strategies to treat these challenging cancers.
Ferroptosis is an iron-dependent form of regulated cell death that is induced by overwhelming lipid peroxidation (16–18). The major cellular defense mechanism against ferroptosis involves the cystine-glutathione-glutathione peroxidase 4 (GPX4) signaling axis, wherein GPX4 utilizes glutathione to detoxify lipid peroxides and suppress ferroptosis (19,20), while solute carrier family 7 member 11 (SLC7A11) imports cystine for glutathione biosynthesis (21). Inactivation of SLC7A11 by class I ferroptosis inducers (FINs) or GPX4 by class II FINs disables ferroptosis defense and unleashes potent ferroptosis in many cancer cells (16,19,20) (Supplementary Fig. S1A). FINs hold great therapeutic potential in cancers that are vulnerable to ferroptosis, especially when combined with other therapies (22).
Loss of specific tumor suppressors, such as those involved in the Hippo pathway, can reveal ferroptosis vulnerabilities with potential therapeutic implications (22,23). Nevertheless, the underlying mechanisms governing ferroptosis vulnerabilities in specific cancer types or genetic contexts remain largely unexplored, impeding our ability to effectively target these vulnerabilities for therapeutic purposes. In light of this challenge, we have been motivated to investigate the potential role of other tumor suppressors in the regulation of ferroptosis and to identify unique ferroptosis vulnerabilities in cancer cells with the loss of these tumor suppressors. In this study, we present a noteworthy vulnerability in BRCA1-mutant cancers, providing a rationale for evaluating the combination of PARPi and GPX4 inhibitors (GPX4i) as a potential treatment approach for patients with BRCA1-mutant tumors.
RESULTS
BRCA1 deficiency promotes GPX4i-induced ferroptosis
Tumor suppressor loss in cancer cells can expose ferroptosis vulnerabilities for potential therapeutic targeting (22). During our analyses of the role of common tumor suppressors in regulating ferroptosis, we found that decreasing BRCA1 expression in diverse cancer cell lines using the CRISPR/Cas9 approach significantly promoted lipid peroxidation and ferroptosis induced by the GPX4i (class II FIN) RSL3 (Fig. 1A–1D; Supplementary Fig. S1B and S1C; Supplementary Table S1). Conversely, BRCA1 restoration in BRCA1-mutant UWB1.289 cells promoted resistance to RSL3-induced ferroptosis (Fig. 1E; Supplementary Fig. S1C; Supplementary Table S1). In both HT1080 and SKOV3 cells, BRCA1 deficiency–induced GPX4i sensitization was comparable to PARPi sensitization induced by BRCA1 deficiency (Fig. 1C; Supplementary Fig. S1D). The increased cell death in BRCA1-deficient cancer cells was abolished by the ferroptosis inhibitor ferrostatin-1 or the iron chelator desferoxamine (DFO), but not by the apoptosis inhibitor Z-VAD, confirming that BRCA1 deficiency promotes GPX4i-induced ferroptosis (Fig. 1F; Supplementary Fig. S1E). We made similar observations using other GPX4i, including ML210, JKE-1674, and ML162 (Fig. 1G–1L; Supplementary Table S1). In these analyses, we generated pooled cells infected with BRCA1 single-guide RNAs (sgRNAs), which exhibited residual BRCA1 expression (Supplementary Fig. S1B) and unaltered cell proliferation rates (Supplementary Fig. S1F–S1K). Likewise, BRCA1 restoration in BRCA1-mutant UWB1.289 cells did not apparently affect cell proliferation (Supplementary Fig. S1L). We also generated clonal BRCA1-deficient SKOV3 cells and confirmed that BRCA1-deficient clones also exhibited the increased sensitivity to RSL3-induced ferroptosis (Supplementary Fig. S1M and S1N).
Figure 1. BRCA1 deficiency promotes GPX4i-induced ferroptosis.
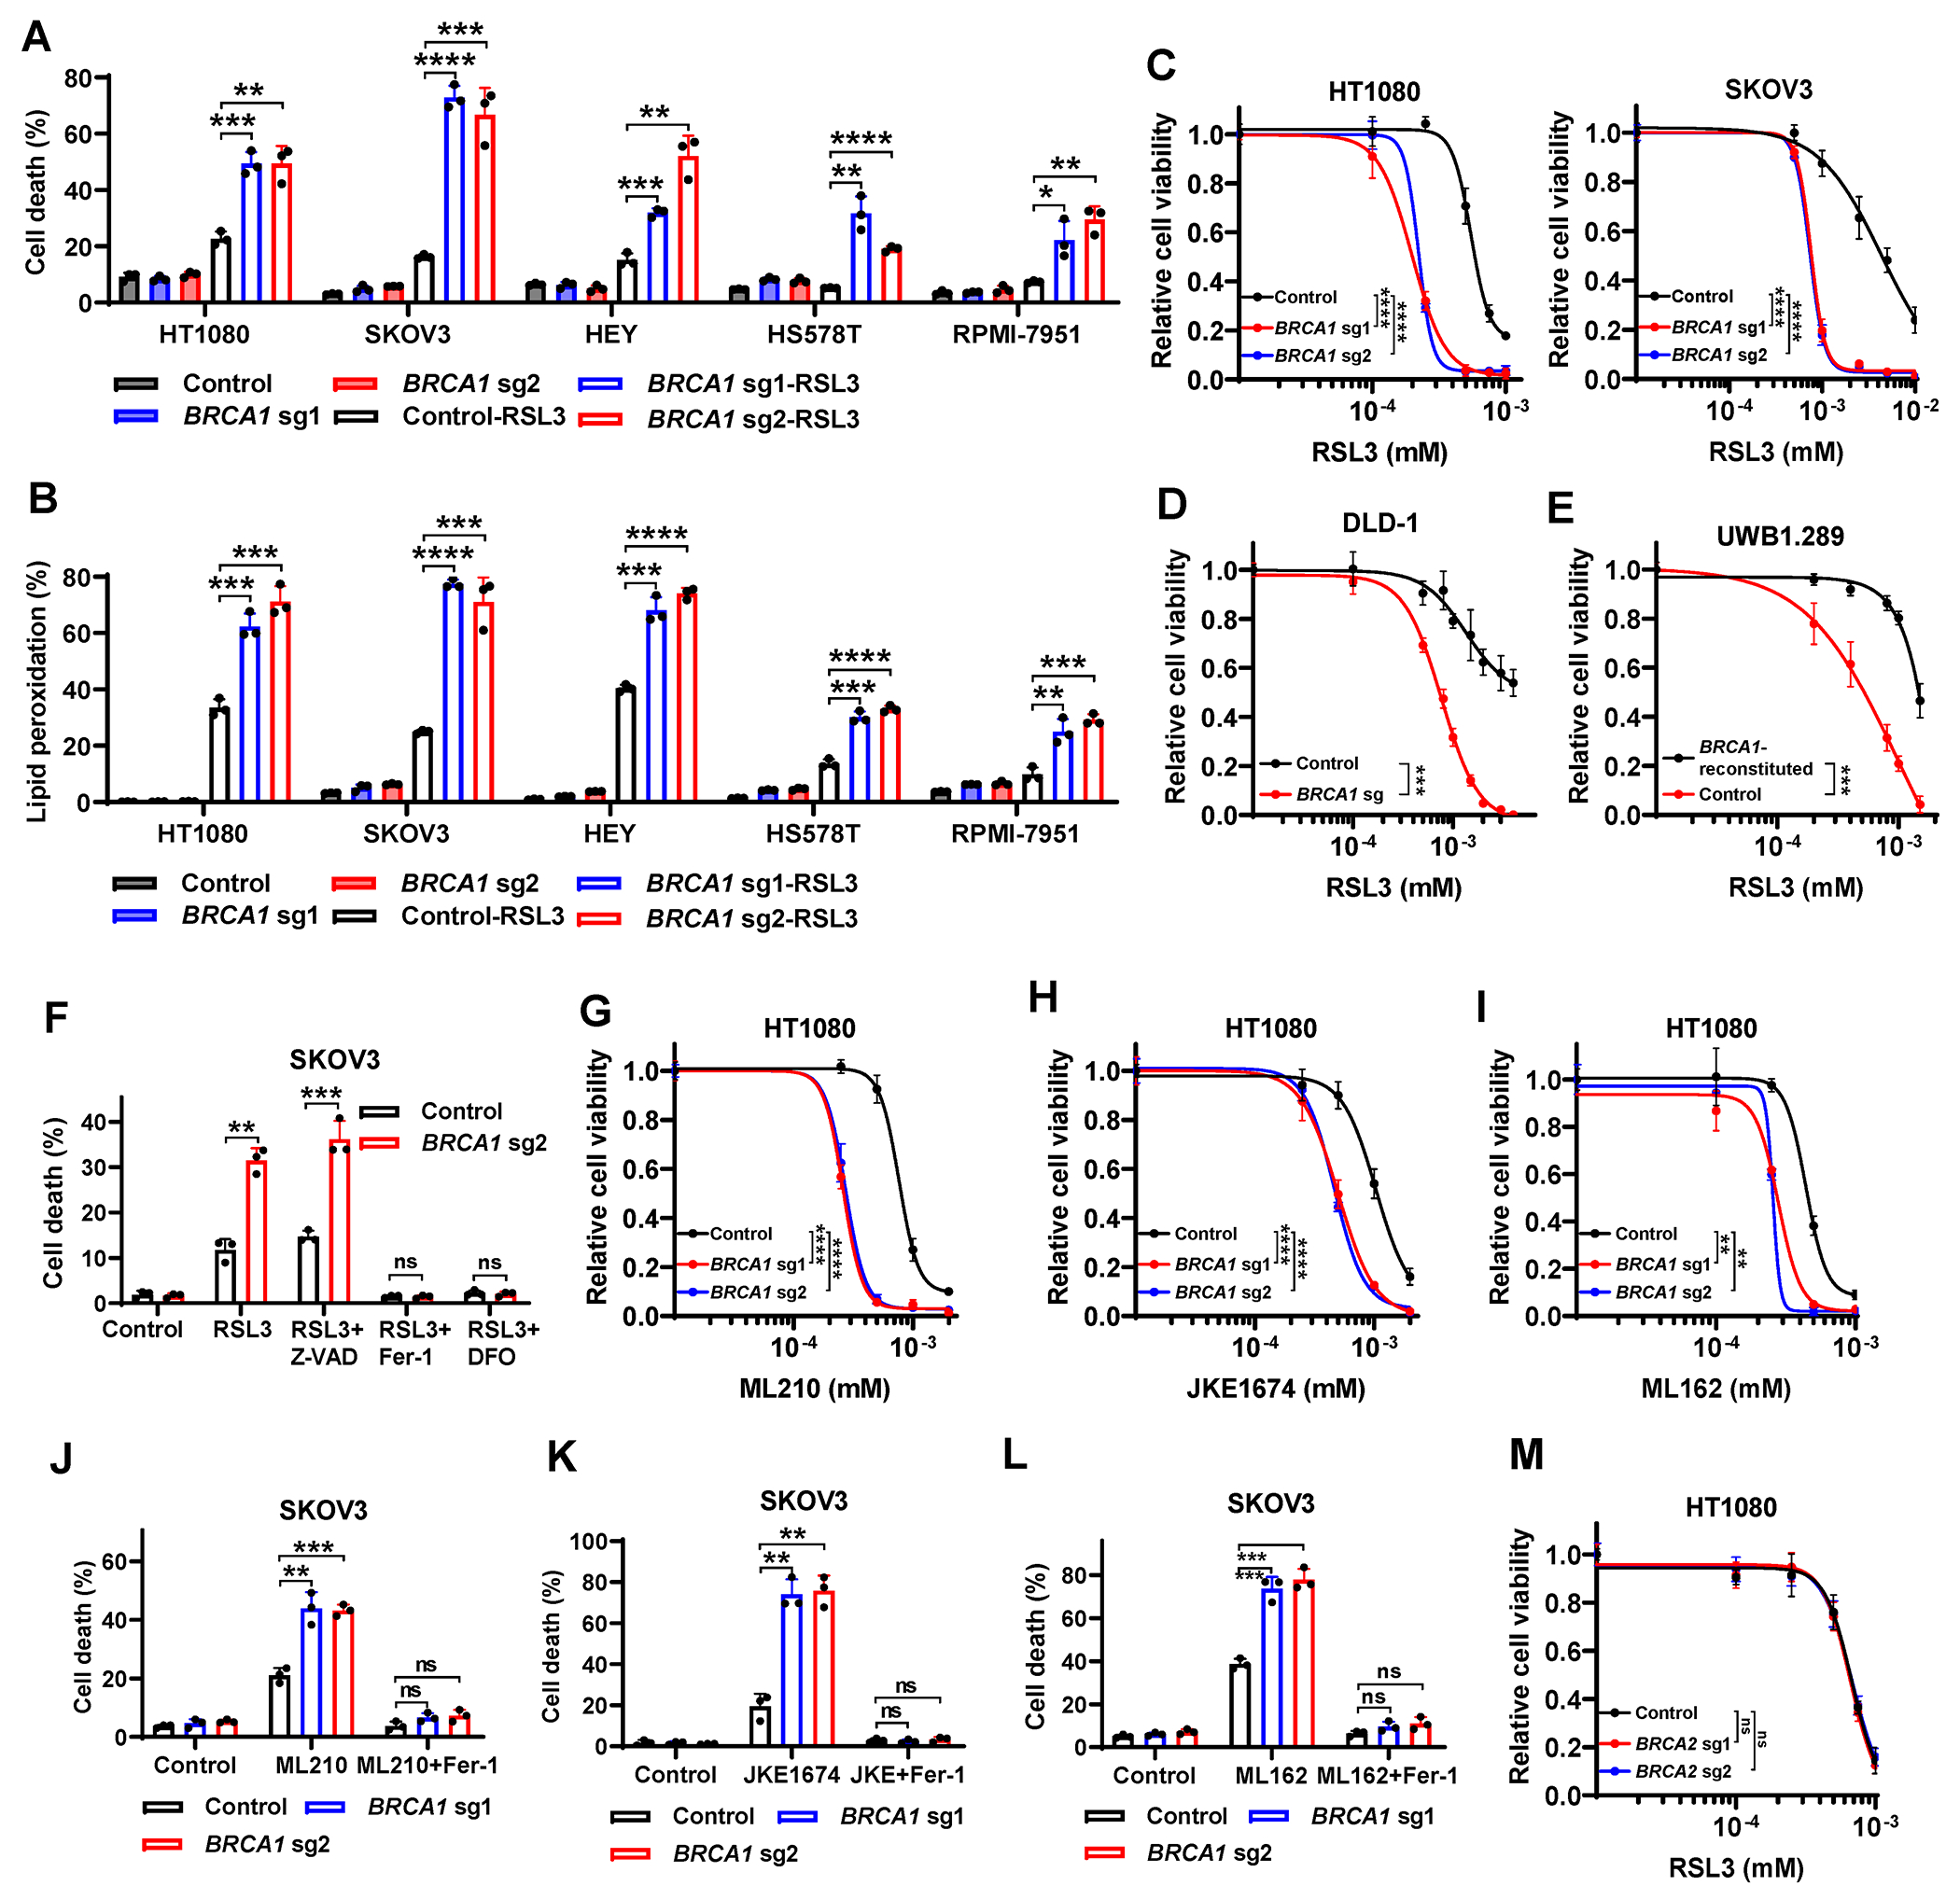
(A, B) Cell death (A) or lipid peroxidation (B) in Cas9 control or BRCA1-sgRNA–infected HT1080, SKOV3, HEY, HS578T, or RPMI-7951 cells treated with or without RSL3. (C, D) Cell viability in Cas9 control or BRCA1-sgRNA–infected HT1080 (C), SKOV3 (C), or DLD-1 (D) cells treated with RSL3 for 24 or 8 hours. (E) Cell viability in control or BRCA1-reconstituted UWB1.289 cells treated with RSL3 for 24 hours. (F) Cell death in Cas9 control or BRCA1-sgRNA–infected SKOV3 cells treated with 2.5μM RSL3 for 24 hours, following pretreatment with 10μM Z-VAD-FMK, 5μM ferrostatin-1, or 100μM DFO. (G-I) Cell viability in Cas9 control or BRCA1-sgRNA–infected HT1080 cells treated with ML210 (G), JKE-1674 (H), and ML162 (I) for 24 hours. (J-L) Cell death in Cas9 control or BRCA1-sgRNA–infected SKOV3 cells treated with 5μM ML210 (J), 10μM JKE-1674 (K), or 2μM ML162 (L) for 24 hours, following pretreatment with 5μM ferrostatin-1. (M) Cell viability in Cas9 control or BRCA2-sgRNA–infected HT1080 cells treated with RSL3 for 24 hours. Data are presented as mean ± standard deviation, n = 3 independent repeats. Unpaired two-tailed t-test or two-way ANOVA analysis; *P < 0.05, **P < 0.01, ***P < 0.001, ****P < 0.0001, ns, not significant.
BRCA2 is another breast and ovarian cancer susceptibility gene (1). BRCA1 and BRCA2 form a complex to regulate DNA repair (1), and deficiency in either BRCA1 or BRCA2 renders cancer cells hypersensitive to PARPi (5,6). We found that, in contrast to BRCA1 deficiency, BRCA2 depletion did not affect cellular sensitivity to different GPX4i used above (Fig. 1M; Supplementary Fig. S1O–1R). In line with our data with BRCA1 or BRCA2 depletion, analyses of data from the Cancer Therapeutics Response Portal database (24) revealed that BRCA1 expression, but not BRCA2 expression, correlated with cellular resistance to GPX4i (Supplementary Fig. S1S and S1T). Together, these data show that BRCA1-deficient (but not BRCA2-deficient) cancer cells are sensitive to GPX4i-induced ferroptosis.
BRCA1 deficiency interferes with GPX4 transcription
To study how BRCA1 regulates GPX4i-induced ferroptosis, we examined whether BRCA1 deficiency affects GPX4 levels or activity, and we found that BRCA1 deficiency decreased GPX4 levels (Fig. 2A,) but did not affect the levels of other known ferroptosis regulators, such as acyl-CoA synthetase long chain family member 3 (ACSL3), ACSL4, ferroptosis suppressor protein 1 (FSP1), dihydroorotate dehydrogenase (DHODH), and GTP cyclohydrolase 1 (GCH1) (Supplementary Fig. S2A). Conversely, BRCA1 restoration in BRCA1-mutant UWB1.289 cells increased GPX4 levels (Fig. 2B). (BRCA1 blots in these cell lines are shown in Supplementary Fig. S1B and S1C.) GPX4 restoration in BRCA1-deficient cells suppressed RSL3-induced ferroptosis (Fig. 2C and 2D). As a comparison, BRCA2 deficiency did not affect expression levels of GPX4 (Supplementary Fig. S2B). Further analyses revealed that BRCA1 sg cells exhibited decreases in GPX4 mRNA levels (Fig. 2E) and GPX4 promoter luciferase activity (Fig. 2F). Re-expression of BRCA1–wild-type (WT) or BRCA1-C61G mutant (a patient-derived mutant that disrupts its RING domain function), but not BRCA1-M1775R (a patient-derived mutants in the BRCT domain), in BRCA1 sg cells restored GPX4 expression levels (Fig. 2G and 2H; Supplementary Fig. S2C and S2D) and GPX4 promoter activity (Fig. 2I), and attenuated RSL3-induced ferroptosis (Fig. 2J). These data suggest that BRCA1 regulates GPX4 transcription through its BRCT domain.
Figure 2. BRCA1 deficiency promotes GPX4i-induced ferroptosis via interference with GPX4 transcription.
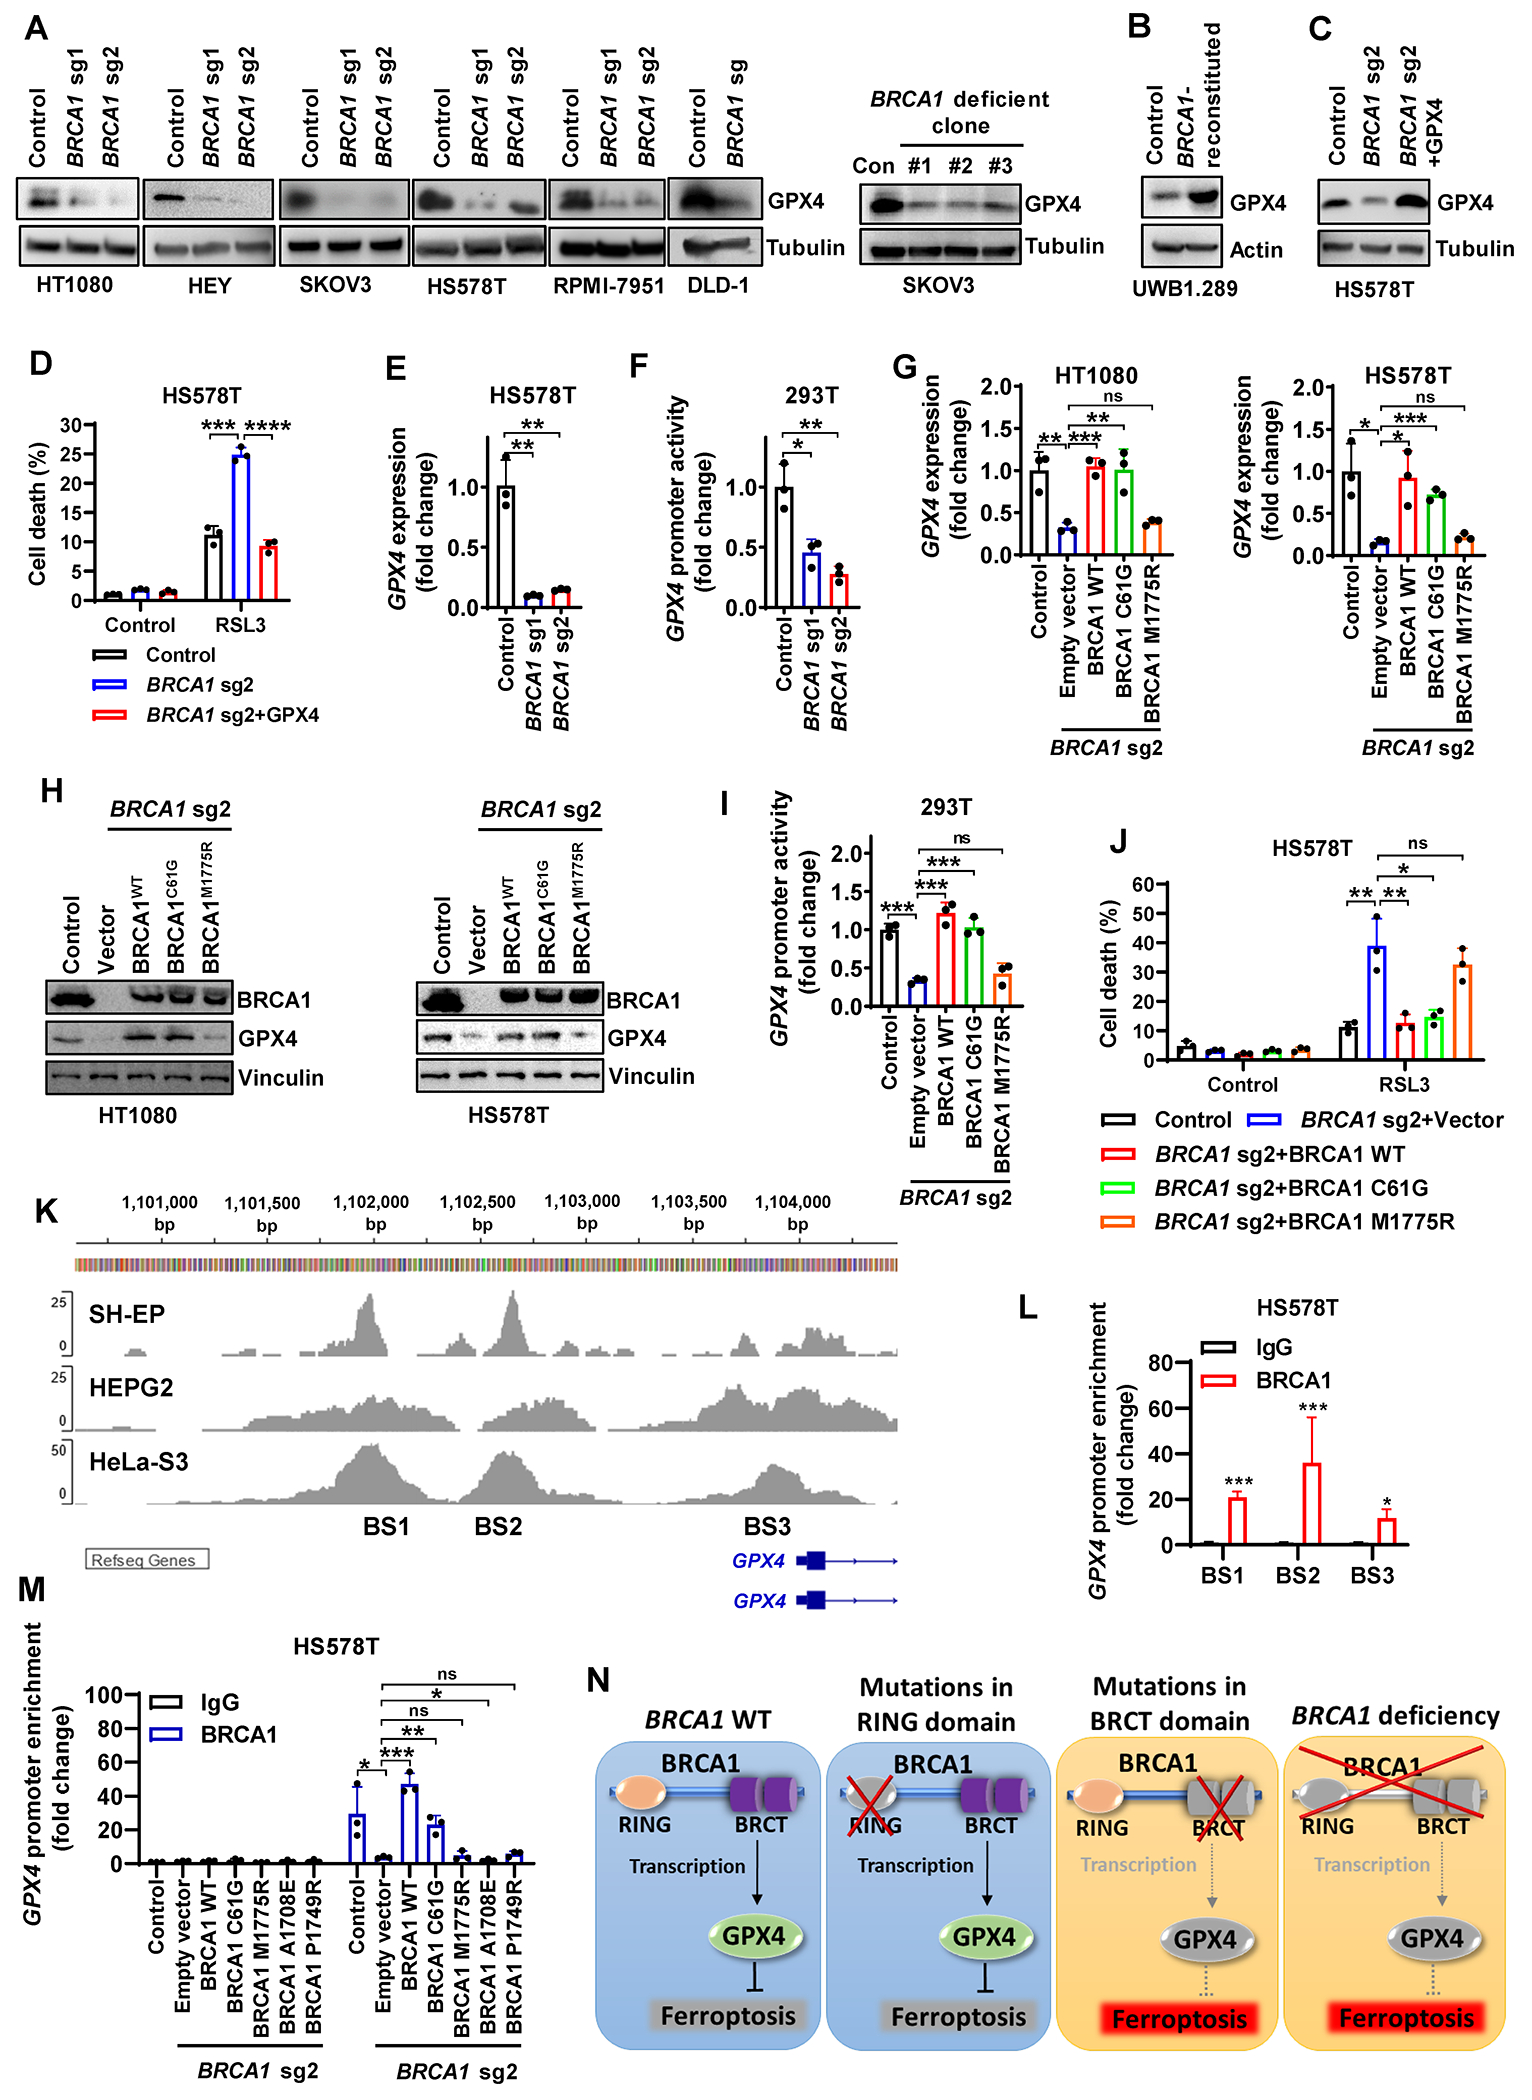
(A, B) GPX4 protein levels in control, BRCA1-sgRNA–infected cells, BRCA1-deficient clones, or BRCA1-reconstituted cells. (C) GPX4 protein levels in HS578T cells with Cas9 control, BRCA1-sgRNA infection, or BRCA1-sgRNA infection supplemented with GPX4. (D) Cell death in HS578T cells with Cas9 control, BRCA1-sgRNA infection, or BRCA1-sgRNA infection supplemented with GPX4 after treatment with 5μM RSL3 for 24 hours. (E, F) GPX4 mRNA levels (E) and GPX4 promoter-luciferase activity (F) in Cas9 control or BRCA1-sgRNA–infected HS578T or 293T cells. (G-I) GPX4 mRNA levels (G), BRCA1 and GPX4 protein levels (H), and GPX4 promoter-luciferase activity (I) in Cas9 control or BRCA1-sgRNA–infected HT1080, HS578T (G, H) or 293T (I) cells expressing empty vector, WT BRCA1 construct, or mutant BRCA1 construct (C61G or M1775R). (J) Cell death in Cas9 control or BRCA1-sgRNA–infected HS578T cells expressing empty vector, WT BRCA1 construct, or mutant BRCA1 construct (C61G or M1775R) after treatment with 5μM RSL3 for 24 hours. (K) BRCA1 ChIP-seq profiles from GEO datasets (GSE31477 and GSE111905) showing the BRCA1 binding sites (BS) at the GPX4 promoter region. (L) ChIP analyses confirming the binding sites (BS) of BRCA1 at GPX4 promoter region in HS578T cells. (M) ChIP analyses showing GPX4 promoter enrichment in Cas9 control or BRCA1-sgRNA–infected HS578T cells expressing empty vector, WT BRCA1 construct, or mutant BRCA1 construct (C61G, M1775R, A1708E, or P1749R). (N) Schematic depicting how BRCA1 regulates GPX4 transcription and GPX4i–induced ferroptosis. See main text for a detailed description. Data are presented as mean ± standard deviation, n = 3 independent repeats. Unpaired two-tailed t-test; *P < 0.05, **P < 0.01, ***P < 0.001, ****P < 0.0001, ns, not significant.
These data prompted further mechanistic studies of how BRCA1 regulates GPX4 transcription. Consistent with BRCA1’s role in promoter binding and transcriptional regulation (25), analyses of BRCA1 chromatin immunoprecipitation coupled with high-throughput sequencing (ChIP-seq) datasets from Gene Expression Omnibus (GEO) revealed several BRCA1 binding sites (BS1-3) on the GPX4 promoter within 3kb upstream of GPX4 transcription start site in diverse cancer cell lines (Fig. 2K). BRCA1 binding on these sites was further confirmed by ChIP assay in HS578T cells (Fig. 2L); importantly, the M1775R mutation in the BRCT domain (but not the C61G mutation in the RING domain) disrupted BRCA1 binding on the GPX4 promoter (Fig. 2M). Finally, we validated the loss-of-function impact in two additional patient-derived BRCA1 mutants within the BRCT domain (A1708E and P1749R), in terms of their regulatory influence on GPX4 expression and their binding on the GPX4 promoter (Fig. 2M; Supplementary Fig. S2E and S2F). Collectively, our data suggest that BRCA1 deficiency impairs GPX4 transcription and BRCA1’s BRCT domain is critical for this regulation, leading to reduced GPX4 expression and increased sensitivity to GPX4i-induced ferroptosis in BRCA1-deficient cells or BRCA1-M1775R mutant–expressing cells (Fig. 2N).
BRCA1 deficiency suppresses erastin-induced ferroptosis via interference with VDAC3 transcription and mitochondrial lipid peroxidation
We also examined ferroptosis phenotypes induced by class I FINs (SLC7A11 inhibitors) in BRCA1-deficient cells. Surprisingly, BRCA1 deficiency dramatically attenuated erastin-induced lipid peroxidation and ferroptosis (Fig. 3A–3D). Re-expression of WT BRCA1 in BRCA1 sg cells restored erastin-induced ferroptosis (Fig. 3E). Similarly, BRCA1 deficiency remarkably repressed ferroptosis induced by imidazole ketone erastin (IKE, an erastin analogue; Fig. 3F). Besides erastin and IKE, sulfasalazine and cystine starvation are additional class I FINs that induce ferroptosis by inhibiting SLC7A11-mediated cystine uptake or limiting extracellular cystine availability (Supplementary Fig. S1A). Unexpectedly, BRCA1 deficiency didn’t render cells resistant to sulfasalazine or cystine starvation (Fig. 3G and 3H). Furthermore, BRCA2 deficiency did not affect ferroptosis induced by these class I FINs (Fig. 3I–3L). Therefore, these data raise an interesting question regarding how BRCA1 deficiency has a differential effect on ferroptosis induced by erastin/IKE and other class I FINs.
Figure 3. BRCA1 deficiency suppresses erastin-induced ferroptosis without blocking sulfasalazine or cystine starvation.
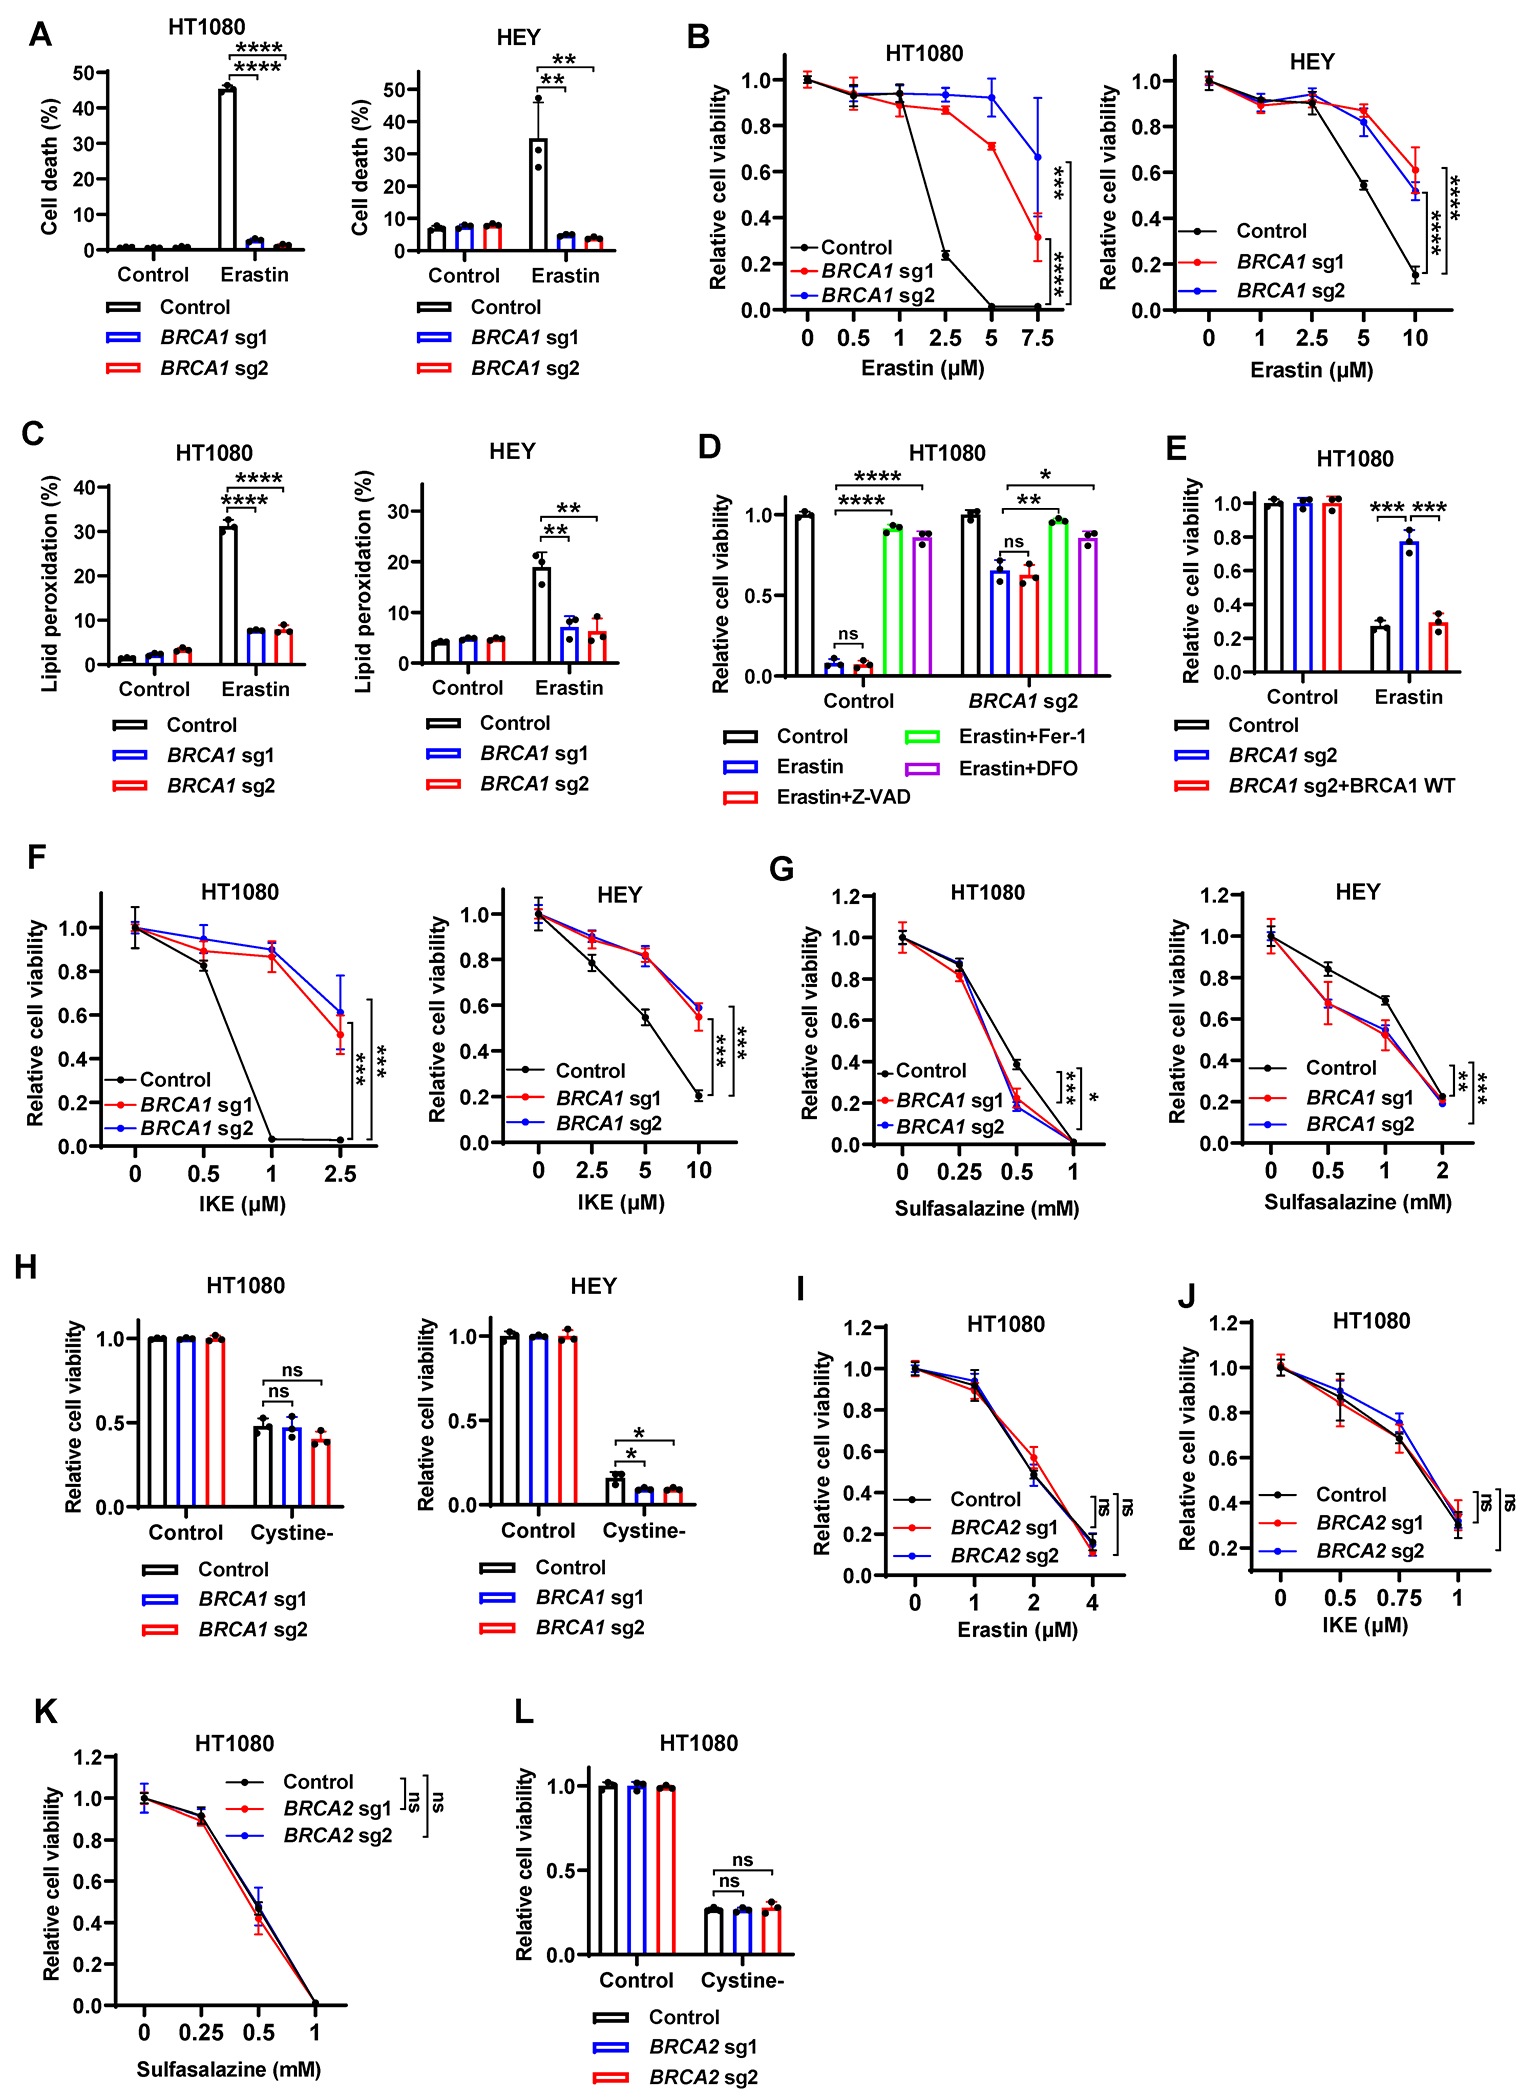
(A) Cell death in Cas9 control or BRCA1-sgRNA–infected HT1080 or HEY cells treated with 2.5μM or 5μM erastin for 24 hours. (B) Cell viability in Cas9 control or BRCA1-sgRNA–infected HT1080 or HEY cells treated with indicated concentrations of erastin for 24 hours. (C) Lipid peroxidation in Cas9 control or BRCA1-sgRNA–infected HT1080 or HEY cells treated with erastin. (D) Cell viability in Cas9 control or BRCA1-sgRNA–infected HT1080 cells treated with 7.5μM erastin for 24 hours, following pretreatment with 10μM Z-VAD-FMK, 5μM ferrostatin-1, or 100μM DFO. (E) Cell viability in Cas9 control cells, BRCA1-sgRNA–infected cells, or BRCA1-sgRNA–infected cells with WT BRCA1 re-expression after treatment with 2.5μM erastin for 24 hours. (F-H) Cell viability in Cas9 control or BRCA1-sgRNA–infected HT1080 or HEY cells treated with indicated concentrations of IKE (F), sulfasalazine (G), or cystine-free medium (H) for 24 hours. (I-L) Cell viability in Cas9 control or BRCA2-sgRNA–infected HT1080 cells treated with indicated concentrations of erastin (I), IKE (J), sulfasalazine (K), or cystine-free medium (L) for 24 hours. Data are presented as mean ± standard deviation, n = 3 independent repeats. Unpaired two-tailed t-test or two-way ANOVA analysis; *P < 0.05, **P < 0.01, ***P < 0.001, ****P < 0.0001, ns, not significant.
Erastin has a dual effect on ferroptosis: it not only blocks SLC7A11-mediated cystine import and depletes intracellular glutathione pools but also has a gain-of-function effect on mitochondrial voltage-dependent anion channel 2 and 3 (VDAC2 and VDAC3) (Supplementary Fig. S1A); consequently, SLC7A11 knockdown promotes whereas VDAC2/3 deficiency blocks erastin-induced ferroptosis (16,26). We found that BRCA1-deficient cells exhibited moderately decreased levels of SLC7A11 and intracellular glutathione (Supplementary Fig. S3A and S3B), which apparently cannot explain erastin resistance phenotypes observed in these cells. On the other hand, BRCA1 deficiency decreased the levels of VDAC3, but not VDAC1 or 2 (Fig. 4A and 4B; Supplementary Fig. S3C). As a comparison, BRCA2 deficiency did not affect expression levels of different VDAC members (Supplementary Fig. S3D), consistent with our observations that BRCA2 deletion did not affect cellular sensitivity to erastin or IKE (Fig. 3I and 3J). VDAC3 deletion largely abolished erastin- or IKE-induced lipid peroxidation and ferroptosis (Fig. 4C–4F; Supplementary Fig. S3E and S3F) but did not affect cellular sensitivity to cystine starvation or sulfasalazine (Fig. 4G and 4H; Supplementary Fig. S3G and S3H). Overexpression of VDAC2 had a marginal effect on erastin-induced ferroptosis in VDAC3-KO cells; as a control, VDAC3 restoration re-sensitized VDAC3-KO cells to erastin-induced ferroptosis to the level similar to that in WT (control) cells (Supplementary Fig. S3I and S3J). These results are consistent with a previous publication, which showed that VDAC2 knockdown resulted in much greater resistance to erastin compared to VDAC3 knockdown (26). Furthermore, BRCA1 and VDAC3 double deficiency did not further enhance erastin resistance compared with deficiency of either single gene (Fig. 4I and 4J), suggesting that BRCA1 and VDAC3 operate in the same signaling axis to regulate erastin-induced ferroptosis.
Figure 4. BRCA1 deficiency suppresses erastin-induced ferroptosis via interference with VDAC3 transcription and mitochondrial lipid peroxidation.
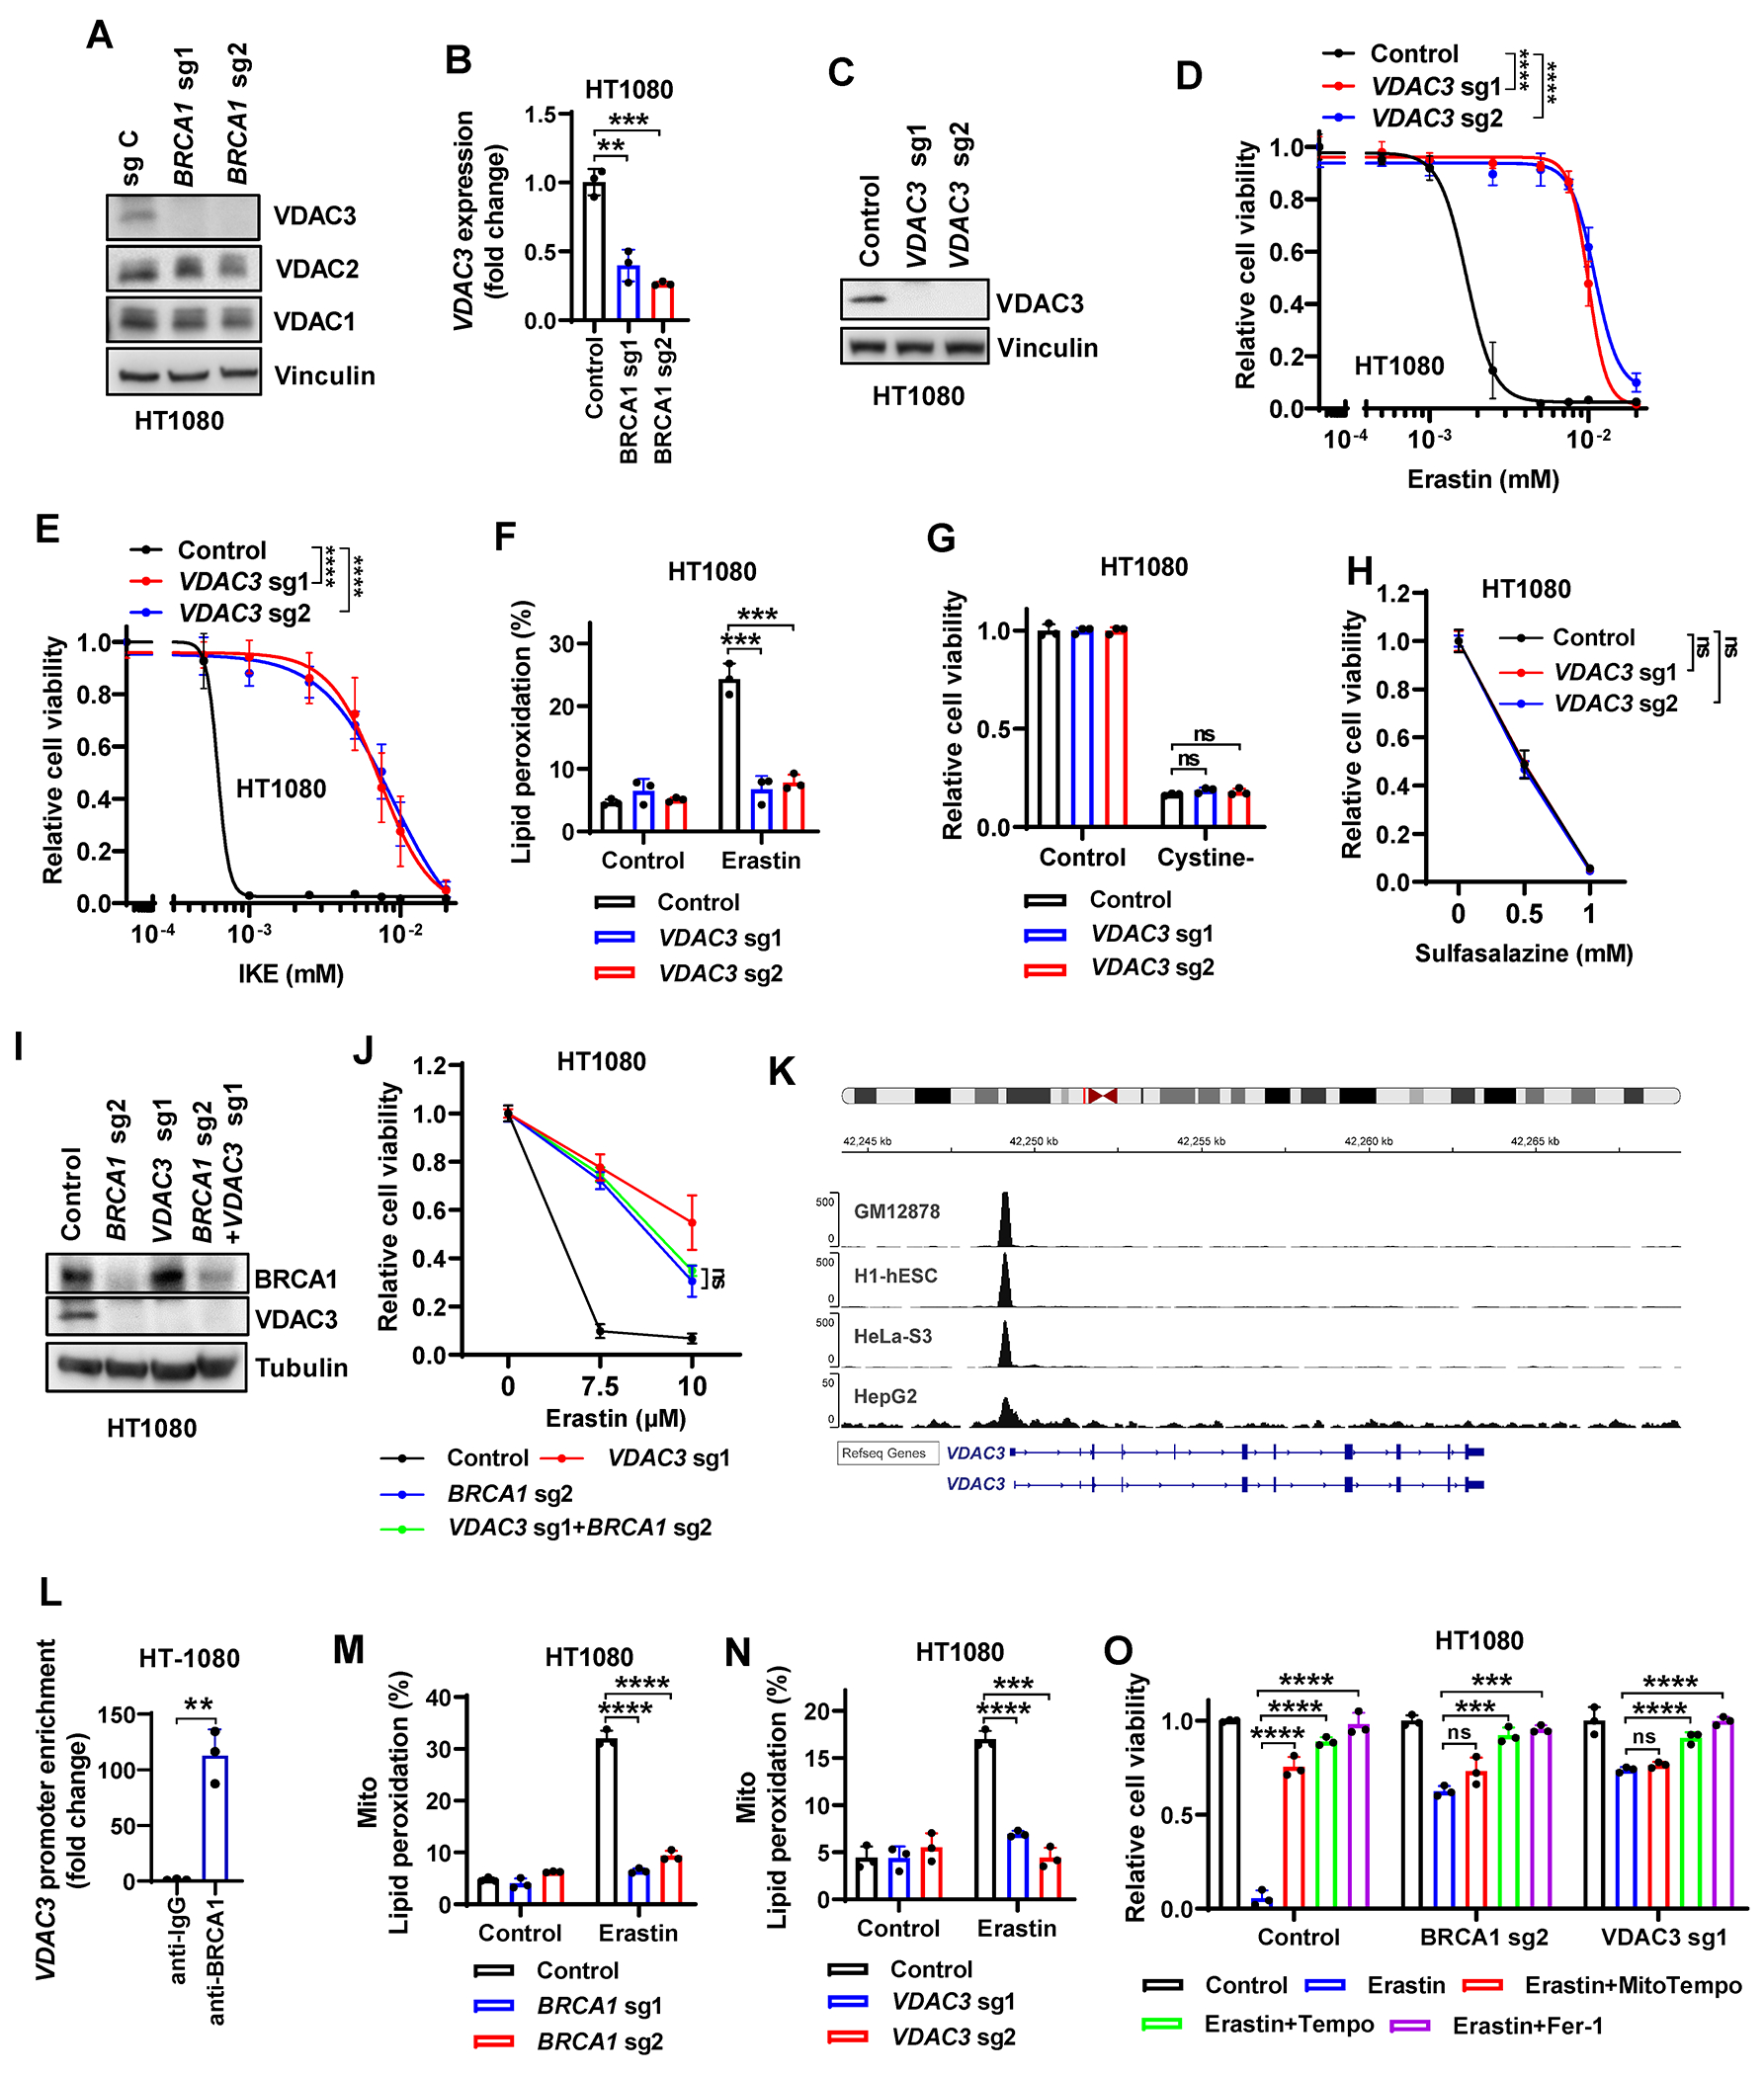
(A) VDAC3, VDAC2, and VDAC1 protein levels in Cas9 control or BRCA1-sgRNA–infected HT1080 cells. (B) VDAC3 mRNA levels in Cas9 control or BRCA1-sgRNA–infected HT1080 cells. (C) VDAC3 protein levels in Cas9 control or VDAC3-sgRNA–infected HT1080 cells. (D) Cell viability in Cas9 control or VDAC3-sgRNA–infected HT1080 cells treated with indicated concentrations of erastin for 24 hours. (E) Cell viability in Cas9 control or VDAC3-sgRNA–infected HT1080 cells treated with indicated concentrations of IKE for 24 hours. (F) Lipid peroxidation in Cas9 control or VDAC3-sgRNA–infected HT1080 cells treated with erastin. (G, H) Cell viability in Cas9 control or VDAC3-sgRNA–infected HT1080 cultured in cystine-free medium (G) or treated with indicated concentrations of sulfasalazine for 24 hours (H). (I) BRCA1 and VDAC3 protein levels in Cas9 control, BRCA1-sgRNA–, VDAC3-sgRNA–, or BRCA1-sgRNA+VDAC3-sgRNA–infected HT1080 cells. (J) Cell viability in Cas9 control, VDAC3-sgRNA–infected, BRCA1-sgRNA–infected, or BRCA1-sgRNA+VDAC3-sgRNA–infected HT1080 cells treated with indicated concentrations of erastin for 24 hours. (K) BRCA1 ChIP-seq profiles from GEO datasets (GSE31477) showing a sharp peak of BRCA1 binding at the site of the VDAC3 gene promoter. (L) ChIP analyses confirming the BRCA1 binding on VDAC3 promoter in HT1080 cells. (M, N) Mitochondrial lipid peroxidation in Cas9 control, BRCA1-sgRNA–infected (M), or VDAC3-sgRNA–infected (N) HT1080 cells treated with erastin. (O) Cell viability in Cas9 control, VDAC3-sgRNA–infected, or BRCA1-sgRNA–infected HT1080 cells with indicated treatment for 24 hours. Data are presented as mean ± standard deviation, n = 3 independent repeats. Unpaired two-tailed t-test or two-way ANOVA analysis; **P < 0.01, ***P < 0.001, ****P < 0.0001, ns, not significant.
These data prompted further mechanistic studies of how BRCA1 regulates VDAC3 expression. Analyses of BRCA1 ChIP-seq datasets from GEO revealed a strong binding of BRCA1 on the VDAC3 promoter in diverse cancer cell lines (Fig. 4K). ChIP analyses confirmed these findings (Fig. 4L), suggesting that VDAC3 is a transcriptional target of BRCA1. Re-expression of BRCA1 mutants in the BRCT or RING domain, similar to BRCA1-WT re-expression, restored VDAC3 expression (Supplementary Fig. S3K and S3L) and erastin-induced ferroptosis in BRCA1-deficient cells (Supplementary Fig. S3M). These data together suggest that BRCA1 regulates GPX4 or VDAC3 expression and RSL3- or erastin-induced ferroptosis through different mechanisms.
How VDAC3 contributes to erastin-induced ferroptosis remains unclear but might relate to its function to transport metabolites and ions across the mitochondrial membrane to support mitochondrial metabolism (27). In line with this, mitochondrial metabolism has been shown to drive erastin-induced ferroptosis (28,29). We found that BRCA1 or VDAC3 deficiency largely abolished mitochondrial lipid peroxidation induced by erastin (Fig. 4M and 4N; Supplementary Fig. S3N and S3O). In addition, whereas treatment with the radical-trapping antioxidant TEMPO or ferrostatin-1 completely suppressed erastin-induced ferroptosis in WT, BRCA1-deficient, or VDAC3-deficient cells, treatment with MitoTEMPO largely restored cell viability in erastin-treated WT cells but did not provide a protective effect in erastin-treated BRCA1- or VDAC3-deficient counterparts (Fig. 4O).
Finally, we examined GPX4i-induced mitochondrial lipid peroxidation in the context of BRCA1 or VDAC3 deficiency. We showed that RSL3 induced weak mitochondrial lipid peroxidation (Supplementary Fig. S3P), consistent with our recent report (30); however, BRCA1 or VDAC3 deficiency did not affect mitochondrial lipid peroxidation under RSL3 treatment (Supplementary Fig. S3P), and VDAC3 deletion did not affect RSL3-induced ferroptosis (Supplementary Fig. S3Q and S3R). This reinforces our model in which BRCA1 regulates GPX4i-induced ferroptosis through mechanisms independent of VDAC3 and mitochondrial lipid peroxidation. Together, these data suggest that BRCA1 controls VDAC3 transcription and that the BRCA1-VDAC3 axis promotes erastin-induced ferroptosis mainly by inducing mitochondrial lipid peroxidation.
PARPi synergize with GPX4i to induce ferroptosis in BRCA1-deficient cancer cells and tumors
Because BRCA1 deficiency does not result in a vulnerability to ferroptosis induced by class I FINs but sensitizes cancer cells to both PARPi and GPX4i, we next focused on GPX4i and studied the combinatorial effects of PARPi and GPX4i in BRCA1-WT and -deficient cancer cells. We showed that PARPi (niraparib or olaparib) in combination with GPX4i (RSL3) demonstrated higher synergism in BRCA1-mutant UWB1.289 cells (or BRCA1-WT HS578 cells infected with BRCA1 sgRNAs) than in their BRCA1-reconsituted counterparts (or their WT counterparts) (Fig. 5A–E; Supplementary Table S1). Similarly, PARPi significantly sensitized BRCA1-deficient SKOV3 clones (but not BRCA1-WT counterparts) to GPX4i (Supplementary Fig. S4A). In a collection of triple negative breast cancer cell lines, we found that BRCA1-mutant cancer cells (SUM149, HCC1937, HCC1395, SUM1315) exhibited lower GPX4 expression and more synergism to the combination therapy than did BRCA1-WT cancer cells (HS578T, MDA-MB-468, HCC1806, MDA-MB-453) or MCF10A cells (an immortalized mammary epithelial cell line) (Fig. 5D and 5F–5H; Supplementary Fig. S4B; Supplementary Table S1).
Figure 5. PARPi synergize with GPX4i in BRCA1-deficient cancers via ferroptosis.
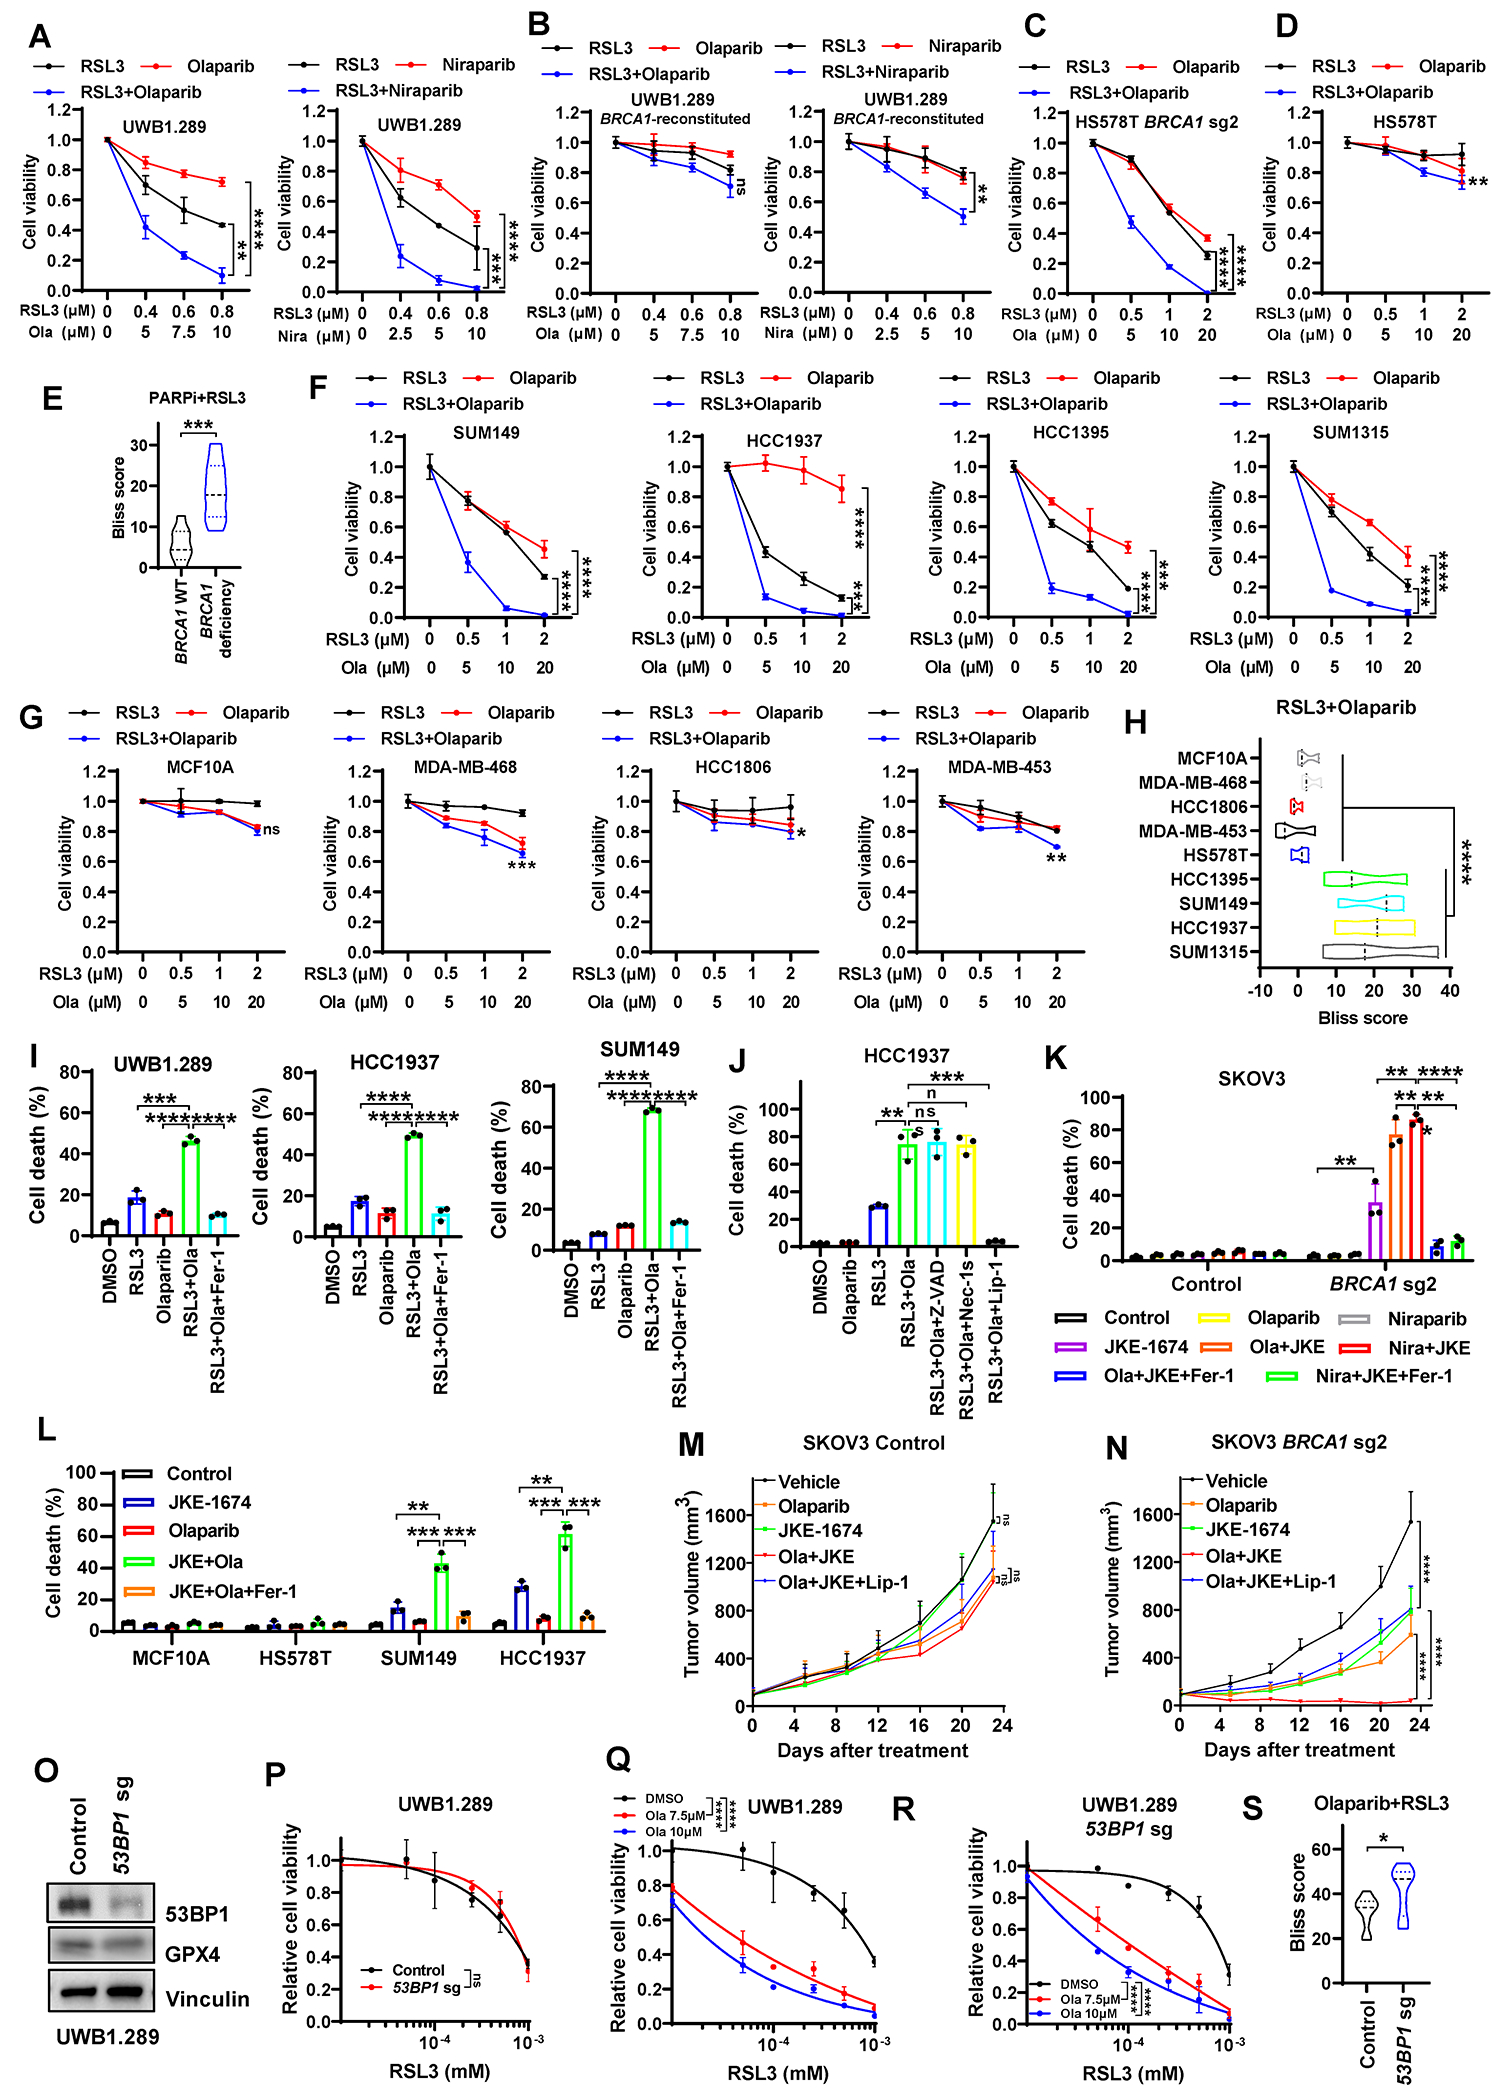
(A, B) Cell viability in control or BRCA1-reconstituted UWB1.289 cells treated with PARPi (olaparib or niraparib, 42 hours) and/or RSL3 (18 hours). (C, D) Cell viability in BRCA1-sgRNA–infected or control HS578T cells treated with olaparib (42 hours) and/or RSL3 (18 hours). (E) Synergy scores from the Bliss independence model indicating the combination effects of PARPi and RSL3 in cells featured in panels A-D. (F, G) Cell viability in indicated BRCA1-mutant cancer cells (F), BRCA1–WT breast epithelial cells (G), or BRCA1–WT cancer cells (G) treated with olaparib (42 hours) and/or RSL3 (18 hours). (H) Synergy scores from the Bliss independence model indicating the combination effects of olaparib and RSL3 in cells featured in panel F and G. (I) Cell death in UWB1.289, HCC1937, or SUM149 cells treated with 10μM olaparib (36 hours) and/or 1μM RSL3 (12 hours) in the absence or presence of 5μM ferrostatin-1. (J) Cell death in HCC1937 cells treated with 10μM olaparib (36 hours) and/or 1μM RSL3 (12 hours) in the absence or presence of 5μM Z-VAD, 2μM Nec-1s, or 2μM liproxstatin-1. (K) Cell death in Cas9 control or BRCA1–sgRNA-infected SKOV3 cells treated with 10μM olaparib (48 hours), 5μM niraparib (48 hours), and/or 5μM JKE-1674 (24 hours) in the absence or presence of 5μM ferrostatin-1. (L) Cell death in indicated cells treated with 10μM olaparib (48 hours) and/or JKE-1674 (5μM for SUM149, MCF10A, HS578T and 3μM for HCC1937; 24 hours) in the absence or presence of 5μM ferrostatin-1. (M, N) Tumor volumes of Cas9 control (M) or BRCA1-sgRNA–infected (N) SKOV3 xenografts with indicated treatments over time. (O) 53BP1 and GPX4 protein levels in Cas9 control or 53BP1-sgRNA–infected UWB1.289 cells. (P-R) Cell viability in Cas9 control or 53BP1-sgRNA–infected UWB1.289 cells treated with RSL3 (18 hours) and/or olaparib (42 hours). (S) Synergy scores from the Bliss independence model indicating the combination effects of PARPi and RSL3 in Cas9 control or 53BP1-sgRNA–infected UWB1.289 cells featured in panel Q and R. Data are presented as mean ± standard deviation, n = 3 independent repeats (n = 7-8 independent tumors for panel M or N). Data in panel E, H or S are presented as violin plots with median and interquartile range, n = 3 or 10 dose combinations per cell line. Unpaired two-tailed t-test or two-way ANOVA analysis; *P < 0.05, **P < 0.01, ***P < 0.001, ****P < 0.0001, ns, not significant.
PARPi in combination with RSL3 induced potent lipid peroxidation or cell death in BRCA1-mutant cells; notably, cell death induced by the PARPi + RSL3 combination could be largely abolished by the ferroptosis inhibitor ferrostatin-1 or liproxstatin-1, but not by the apoptosis inhibitor Z-VAD or the necroptosis inhibitor Nec-1s (Fig. 5I and 5J; Supplementary Fig. S4C and S4D). Consistently, the combination treatment induced much more potent lipid peroxidation or ferroptosis in BRCA1-deficient cells than in control (BRCA1-WT) cells (Supplementary Fig. S4E and S4F). We further confirmed these observations using another GPX4i JKE-1674 (Fig. 5K and 5L).
Next, we examined the efficacy of PARPi (olaparib) + GPX4i combination therapy in treating BRCA1-WT or -deficient SKOV3 xenograft model. Because most commonly used GPX4i, such as RSL3, are not suitable for in vivo treatment owing to their poor pharmacokinetics, in our preclinical studies, we used JKE-1674, a recently developed potent GPX4i with significantly improved pharmacokinetics and no apparent toxicity in vivo (31,32). Our data showed that, while olaparib and JKE-1674 single or combination treatment did not affect or only moderately suppressed BRCA1-WT xenograft tumor growth, olaparib or JKE-1674 single treatment had more dramatic tumor suppressive effect on BRCA1-deficient tumors than on BRCA1-WT counterparts, and the combination treatment blunted the growth of BRCA1-deficient tumors (Fig. 5M and 5N). In addition, the ferroptosis inhibitor liproxstatin-1 significantly restored BRCA1-deficient xenograft tumor growth in the olaparib + JKE-1674 treatment group (Fig. 5M and 5N), indicating that the combination therapy suppresses BRCA1-deficient tumor growth at least partly by inducing ferroptosis in tumors. These treatments did not decrease the animals’ weight (Supplementary Fig. S5A).
As expected, olaparib treatment resulted in increased staining of phospho-Histone H2A.X (p-H2AX), indicative of elevated DNA damage in olaparib-treated tumors; moreover, BRCA1 deficiency further augmented p-H2AX staining under Olaparib treatment (Supplementary Fig. S5B and S5C). Importantly, JKE-1674 or liproxstatin-1 treatment did not impact p-H2AX staining under vehicle or PARPi treatment conditions in either BRCA1-WT or -deficient tumors (Supplementary Fig. S5B and S5C), suggesting that the anti-tumor effect of GPX4i is not related to its potential impact on DNA damage. We further showed that, under the single or combination treatment, BRCA1-deficient tumors exhibited increased staining for 4-hydroxynonenal (4-HNE, a lipid peroxidation biomarker) compared to BRCA1-WT tumors, and liproxstatin-1 treatment suppressed 4-HNE staining (Supplementary Fig. S5D and S5E). In contrast, JKE-1674 did not increase the staining of cleaved caspase-3 in either BRCA1-WT or -deficient tumors, with or without Olaparib co-treatment (Supplementary Fig. S5F and S5G). Additionally, olaparib increased GPX4 staining levels in BRCA1-WT tumors but not in BRCA1-deficient counterparts (Supplementary Fig. S5H and S5I).
Finally, it is well known that 53BP1 deficiency restores HR defect and therefore promotes PARPi resistance in BRCA1-deficient cells (14,15). We therefore tested GPX4i, either as a single treatment or in combination with PARPi, in the PARPi-resistant BRCA1-mutant cancer cells caused by 53BP1 deficiency. We found that 53BP1 deletion in BRCA1-mutant UWB1.289 cells did not affect GPX4 levels or RSL3-induced ferroptosis (Fig. 5O and 5P); importantly, although 53BP1 deletion conferred resistance to PARPi, PARPi continued to potentiate GPX4i-induced cell death in these cells, resulting in similar or even higher synergism scores in 53BP1-KO cells than in 53BP1-WT counterparts (Fig. 5Q–5S; Supplementary Table S1). These results underscore the potential of the combination of PARPi and GPX4i as an effective therapeutic strategy to mitigate PARPi resistance engendered by HR restoration.
Together, our data suggest that PARPi synergize with GPX4i to induce ferroptosis in BRCA1-mutant/-deficient cancer cells and tumors.
NCOA4-mediated ferritinophagy coupled with defective GPX4 induction drives the synergy between PARPi and GPX4i in BRCA1-deficient cancer cells
The above observations prompted us to further understand mechanistically how PARPi synergize with GPX4i to induce ferroptosis in BRCA1-deficient cancer cells. We first examined whether treatment with PARPi affected the expression levels of known ferroptosis regulators, and we found that treatment with olaparib or niraparib induced nuclear receptor coactivator 4 (NCOA4) expression (Fig. 6A–6F) but not that of other ferroptosis regulators in BRCA1-deficient cancer cells (Supplementary Fig. S6A). NCOA4-mediated ferritinophagy (the autophagic degradation of the intracellular iron storage protein ferritin) increases intracellular labile iron levels; consequently, NCOA4 deletion suppresses ferroptosis by limiting the labile iron pool (33,34). Correspondingly, we found that treatment with PARPi increased labile iron levels in BRCA1-deficient cancer cells (Fig. 6G and 6H), and this effect was attenuated by decreasing NCOA4 expression (Fig. 6I and 6J); of note, we decreased NCOA4 expression under PARPi treatment to the level similar to that in control cells under basal conditions (but not completely abrogated NCOA4 expression; Fig. 6I), which allowed a better investigation of whether PARPi-induced NCOA4 expression (rather than basal NCOA4 expression) plays a role in ferroptosis induced by PARPi + GPX4i combination. Consistently, NCOA4 down-regulation or treatment with the iron chelator deferoxamine (DFO) largely abolished PARPi-induced lipid peroxidation or PARPi + GPX4i combination–induced ferroptosis (Fig. 6K–6N; Supplementary Fig. S6B–S6E), suggesting that PARPi promote lipid peroxidation and that PARPi in combination with GPX4i trigger ferroptosis in BRCA1-deficient cancer cells mainly by inducing NCOA4 expression and enhancing intracellular labile iron levels. Notably, the increases of NCOA4 expression were not observed in BRCA1-WT HS578T or HCC1806, or BRCA2-mutant BT474 cells, while BRCA1 deletion in HS578T cells restored PARPi-induced NCOA4 expression (Supplementary Fig. S6F). These data reveal a regulation of NCOA4 expression by BRCA1 (but not BRCA2) under PARPi treatment conditions, and partly explain why PARPi and GPX4i combination induces more potent ferroptosis in BRCA1-deficient cancer cells than in BRCA1-WT counterparts (see below)
Figure 6. NCOA4-mediated ferritinophagy coupled with defective GPX4 induction contributes to the synergy of PARPi and GPX4i in BRCA1-deficient cancer cells.
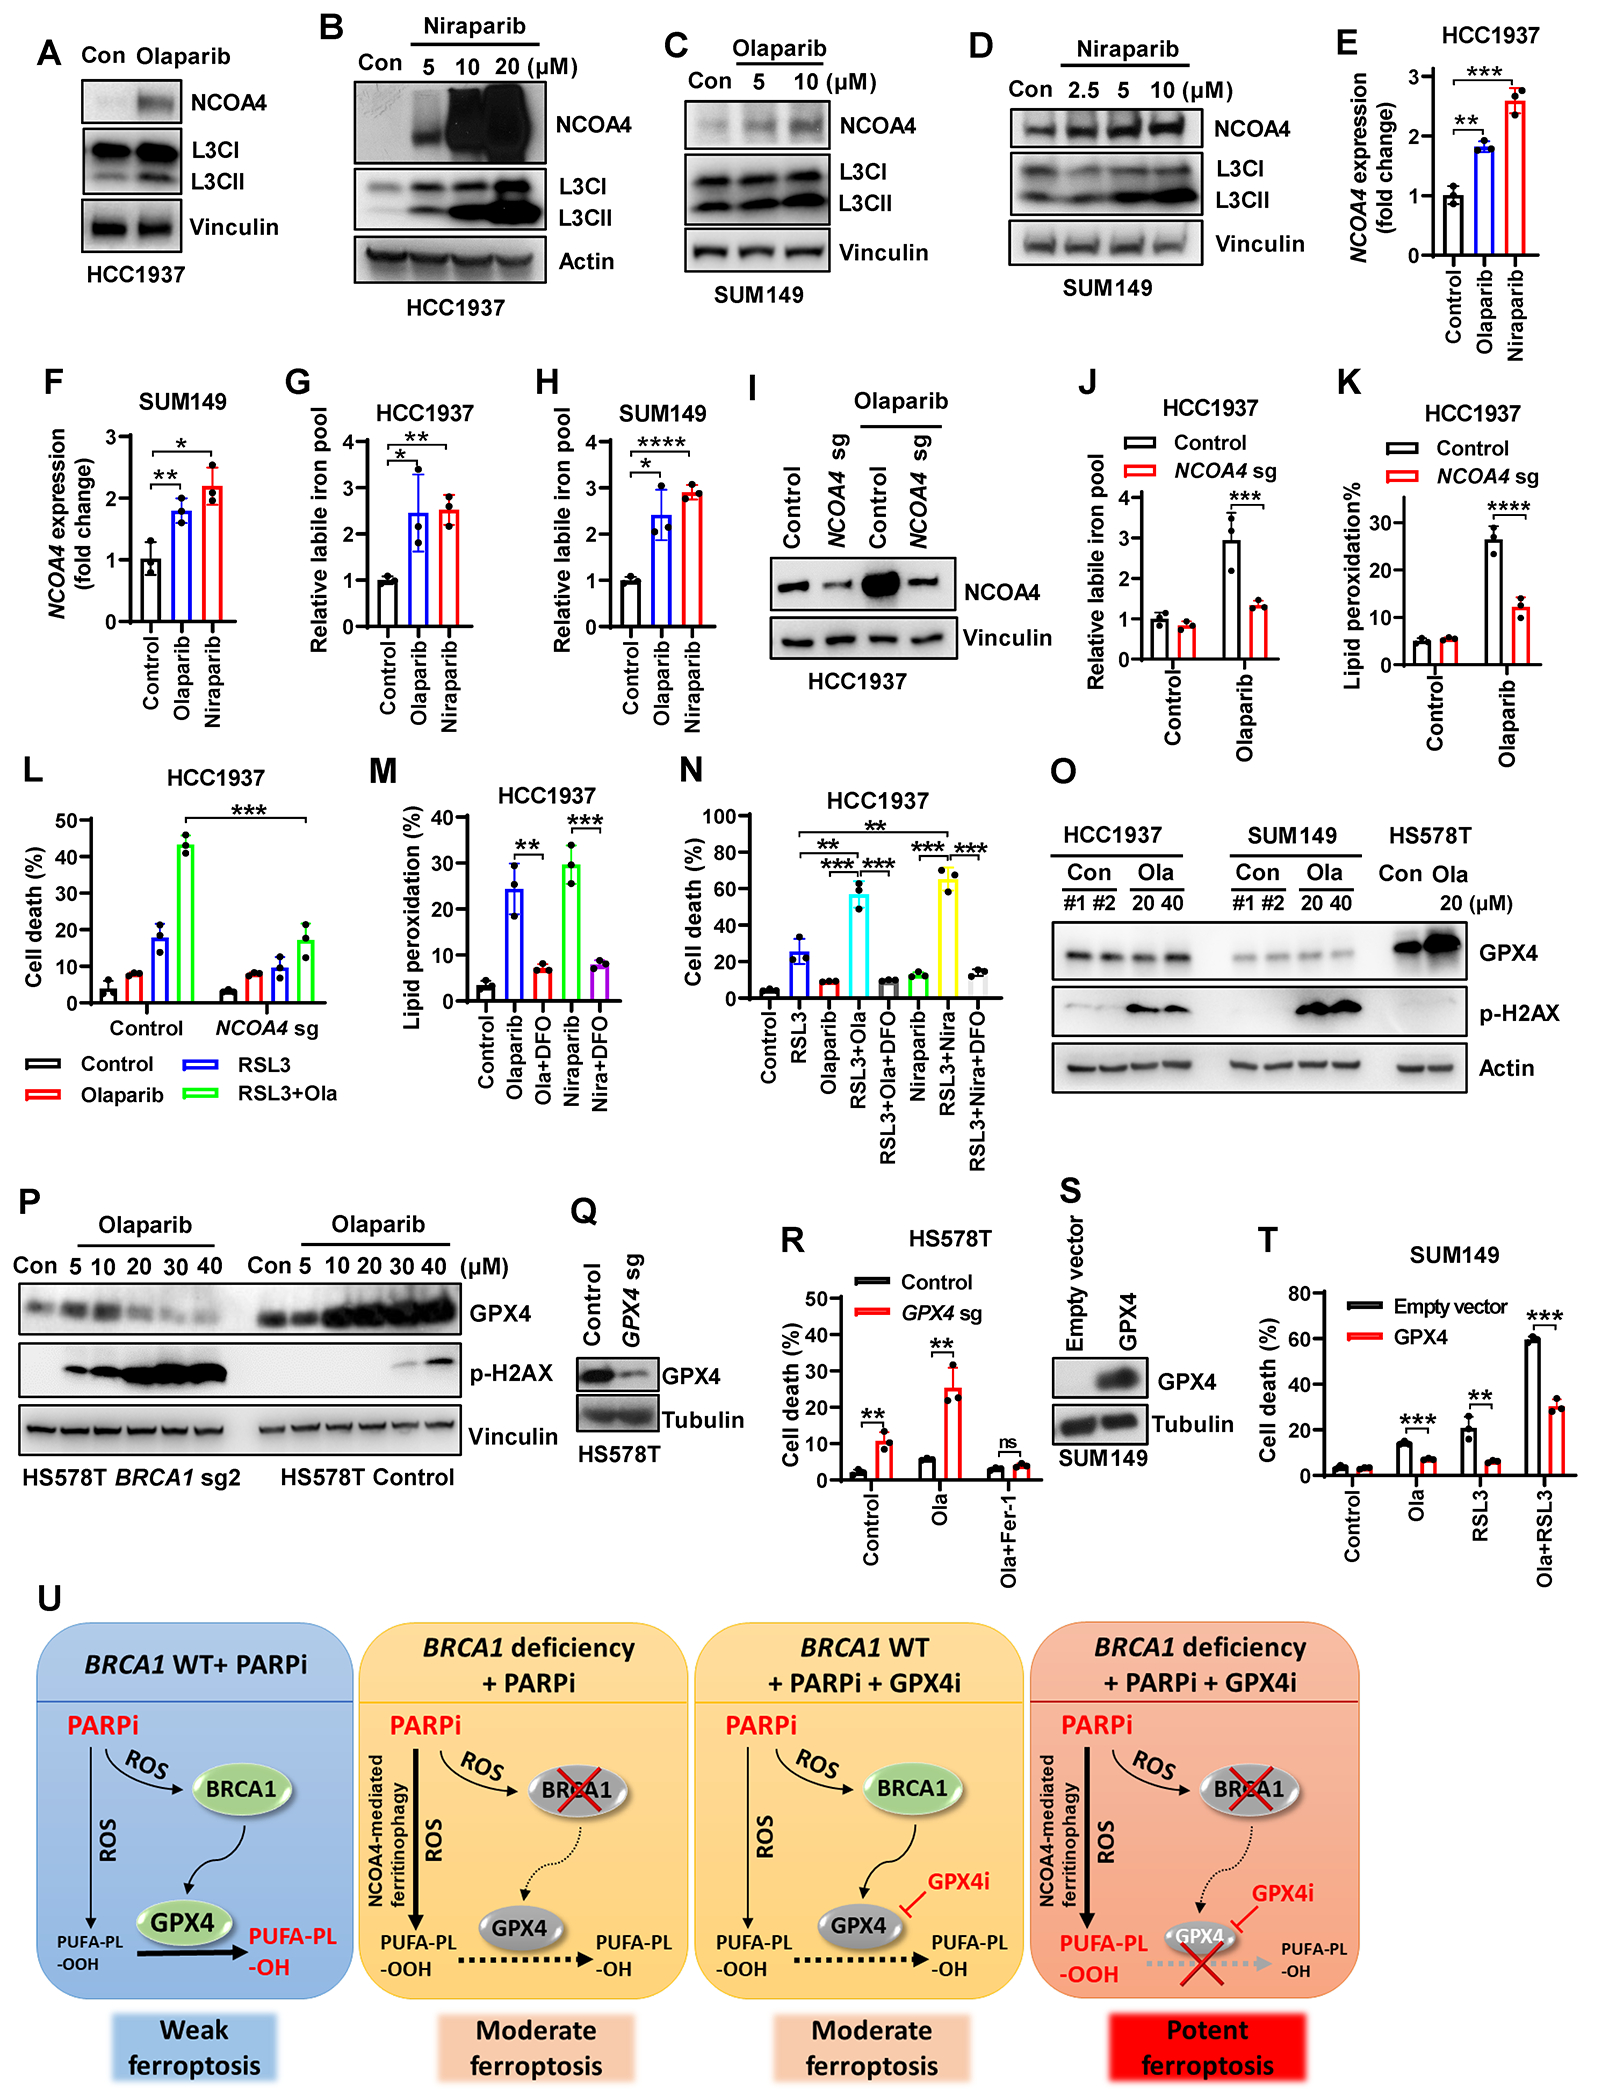
(A-D) NCOA4 and LC3II protein levels in HCC1937 (A, B) or SUM149 (C, D) cells treated with olaparib or niraparib. (E, F) NCOA4 mRNA levels in HCC1937 (E) or SUM149 (F) cells treated with niraparib or olaparib. (G, H) Labile iron pool in HCC1937 (G) or SUM149 (H) cells treated with 10μM olaparib or 5μM niraparib. (I) NCOA4 protein levels in Cas9 control or NCOA4- sgRNA–infected HCC1937 cells treated with 10μM olaparib. (J, K) Labile iron pool (J) or lipid peroxidation (K) in Cas9 control or NCOA4-sgRNA–infected HCC1937 cells treated with 10μM olaparib. (L) Cell death in Cas9 control or NCOA4-sgRNA–infected HCC1937 cells treated with 10μM olaparib (36 hours) and/or 1μM RSL3 (12 hours). (M) Lipid peroxidation in HCC1937 cells treated with 10μM olaparib or 5μM niraparib in the absence or presence of 100μM DFO. (N) Cell death in HCC1937 cells treated with 10μM olaparib (36 hours), 5μM niraparib (36 hours), and/or 1μM RSL3 (12 hours) in the absence or presence of 100μM DFO. (O-P) GPX4 or p-H2AX protein levels in HCC1937 cells (O), SUM149 cells (O), or BRCA1-sgRNA–infected or Cas9 control HS578T cells (P) treated with olaparib. (Q) GPX4 protein levels in Cas9 control or GPX4–sgRNA-infected HS578T cells. (R) Cell death in Cas9 control or GPX4-sgRNA–infected HS578T cells treated with 10μM olaparib for 48 hours in the absence or presence of 5μM ferrostatin-1. (S) GPX4 protein levels in empty vector- or GPX4-expressing SUM149 cells. (T) Cell death in empty vector- or GPX4-expressing SUM149 cells treated with 10μM olaparib (42 hours) and/or 2.5μM RSL3 (18 hours). (U) Schematic depicting mechanisms underlying the synergy between PARPi and GPX4i in BRCA1-deficent cells. See main text for a detailed description. Data are presented as mean ± standard deviation, n = 3 independent repeats. Unpaired two-tailed t-test; **P < 0.01, ***P < 0.001, ****P < 0.0001, ns, not significant.
In addition, we found that PARPi potently raised GPX4 levels in BRCA1-WT HS578T cells, but not in BRCA1-deficient counterparts or BRCA1-mutant HCC1937 or SUM149 cells (Fig. 6O and 6P). Consistently, PARPi moderately induced ferroptosis in BRCA1-mutant or -deficient cells, but not in BRCA1-WT cells (Supplementary Fig. S6G–S6H); likewise, PARPi mildly induced lipid peroxidation in BRCA1-WT cells, but induced lipid peroxidation more dramatically in BRCA1-mutant or -deficient cells (Supplementary Fig. S4D and S4E). Importantly, blocking such PARPi-induced adaptive response by reducing GPX4 expression in HS578T cells (which exhibited robust GPX4 induction under PARPi treatment; see Fig. 6O) dramatically increased PARPi-induced ferroptosis (Fig. 6Q and 6R), whereas GPX4 overexpression in BRCA1-mutant SUM149 cells (which exhibited defective GPX4 induction after treatment with PARPi; see Fig. 6P) suppressed ferroptosis induced by PARPi or PARPi + GPX4i combination (Fig. 6S and 6T).
Considering that proteins involved in anti-oxidant defense can often be induced by oxidative stress (35) and that PARPi trigger reactive oxygen species (ROS) (36), we reason that PARPi-induced GPX4 expression most likely reflects an adaptive response to PARPi-mediated ROS stress. In support of this, we confirmed PARPi-induced ROS in BRCA1-WT HS578T cells (Supplementary Fig. S6I) and showed that treatment with the ROS scavenger N-acetyl-l-cysteine (NAC) abolished PARPi-induced GPX4 induction in HS578T cells (Supplementary Fig. S6J). Consistent with lipid peroxidation induction (Supplementary Fig. S4D and S4E), PARPi induced even higher levels of ROS in BRCA1-depleted/-mutant cells than in BRCA1-WT cells (Supplementary Fig. S6I). We further showed that PARPi-induced cell death in BRCA1-deficient SUM149 cells could be partially suppressed by NAC (Supplementary Fig. S6K), suggesting that ROS contribute to PARPi-induced cell death in BRCA1-deficient cells.
Together, our data suggest a model in which BRCA1 deficiency elicits at least two cellular effects in response to PARPi treatment: (1) in WT cells, PARPi induces GPX4 expression in a ROS-BRCA1–dependent manner, likely as an adaptive response to antagonize PARPi-induced lipid peroxidation and ferroptosis. Consequently, BRCA1 deficiency disrupts this induction of GPX4 expression (Fig. 6U); (2) Additionally, BRCA1 deficiency upregulates NCOA4 levels and NCOA4-mediated ferritinophagy in response to PARPi treatment (Fig. 6U). These effects collectively render PARPi-treated BRCA1-deficient cells highly susceptible to GPX4i-induced ferroptosis (Fig. 6U).
Leveraging GPX4i vulnerability to bolster PARPi efficacy in PARPi-resistant BRCA1-mutant tumors
Since 40%-60% of cancers in patients with BRCA1 deficiency do not respond to PARPi (10–13), we next performed mammary fat pad orthotopic injection (Fig. 7A) and examined whether exploiting the vulnerability of BRCA1-mutant tumors to GPX4i could augment PARPi efficacy in PARPi-resistant BRCA1-mutant breast cancer xenograft models. To this end, we tested the PARPi + GPX4i combination therapy in two BRCA1-mutant patient-derived xenograft (PDX) models using two different treatment strategies. These BRCA1-mutant PDX models (PDX18_S and PDX27_S) were established from post PARPi-treated tumors from breast cancer patients with germline BRCA1 truncating mutations (c.5177_5180delGAAA for PDX18_S and c.2359 dup.G for PDX27_S) who exhibited PARPi resistance (37) (see methods for detailed description).
Figure 7. GPX4i overcome resistance to PARPi in BRCA1-mutant tumors.
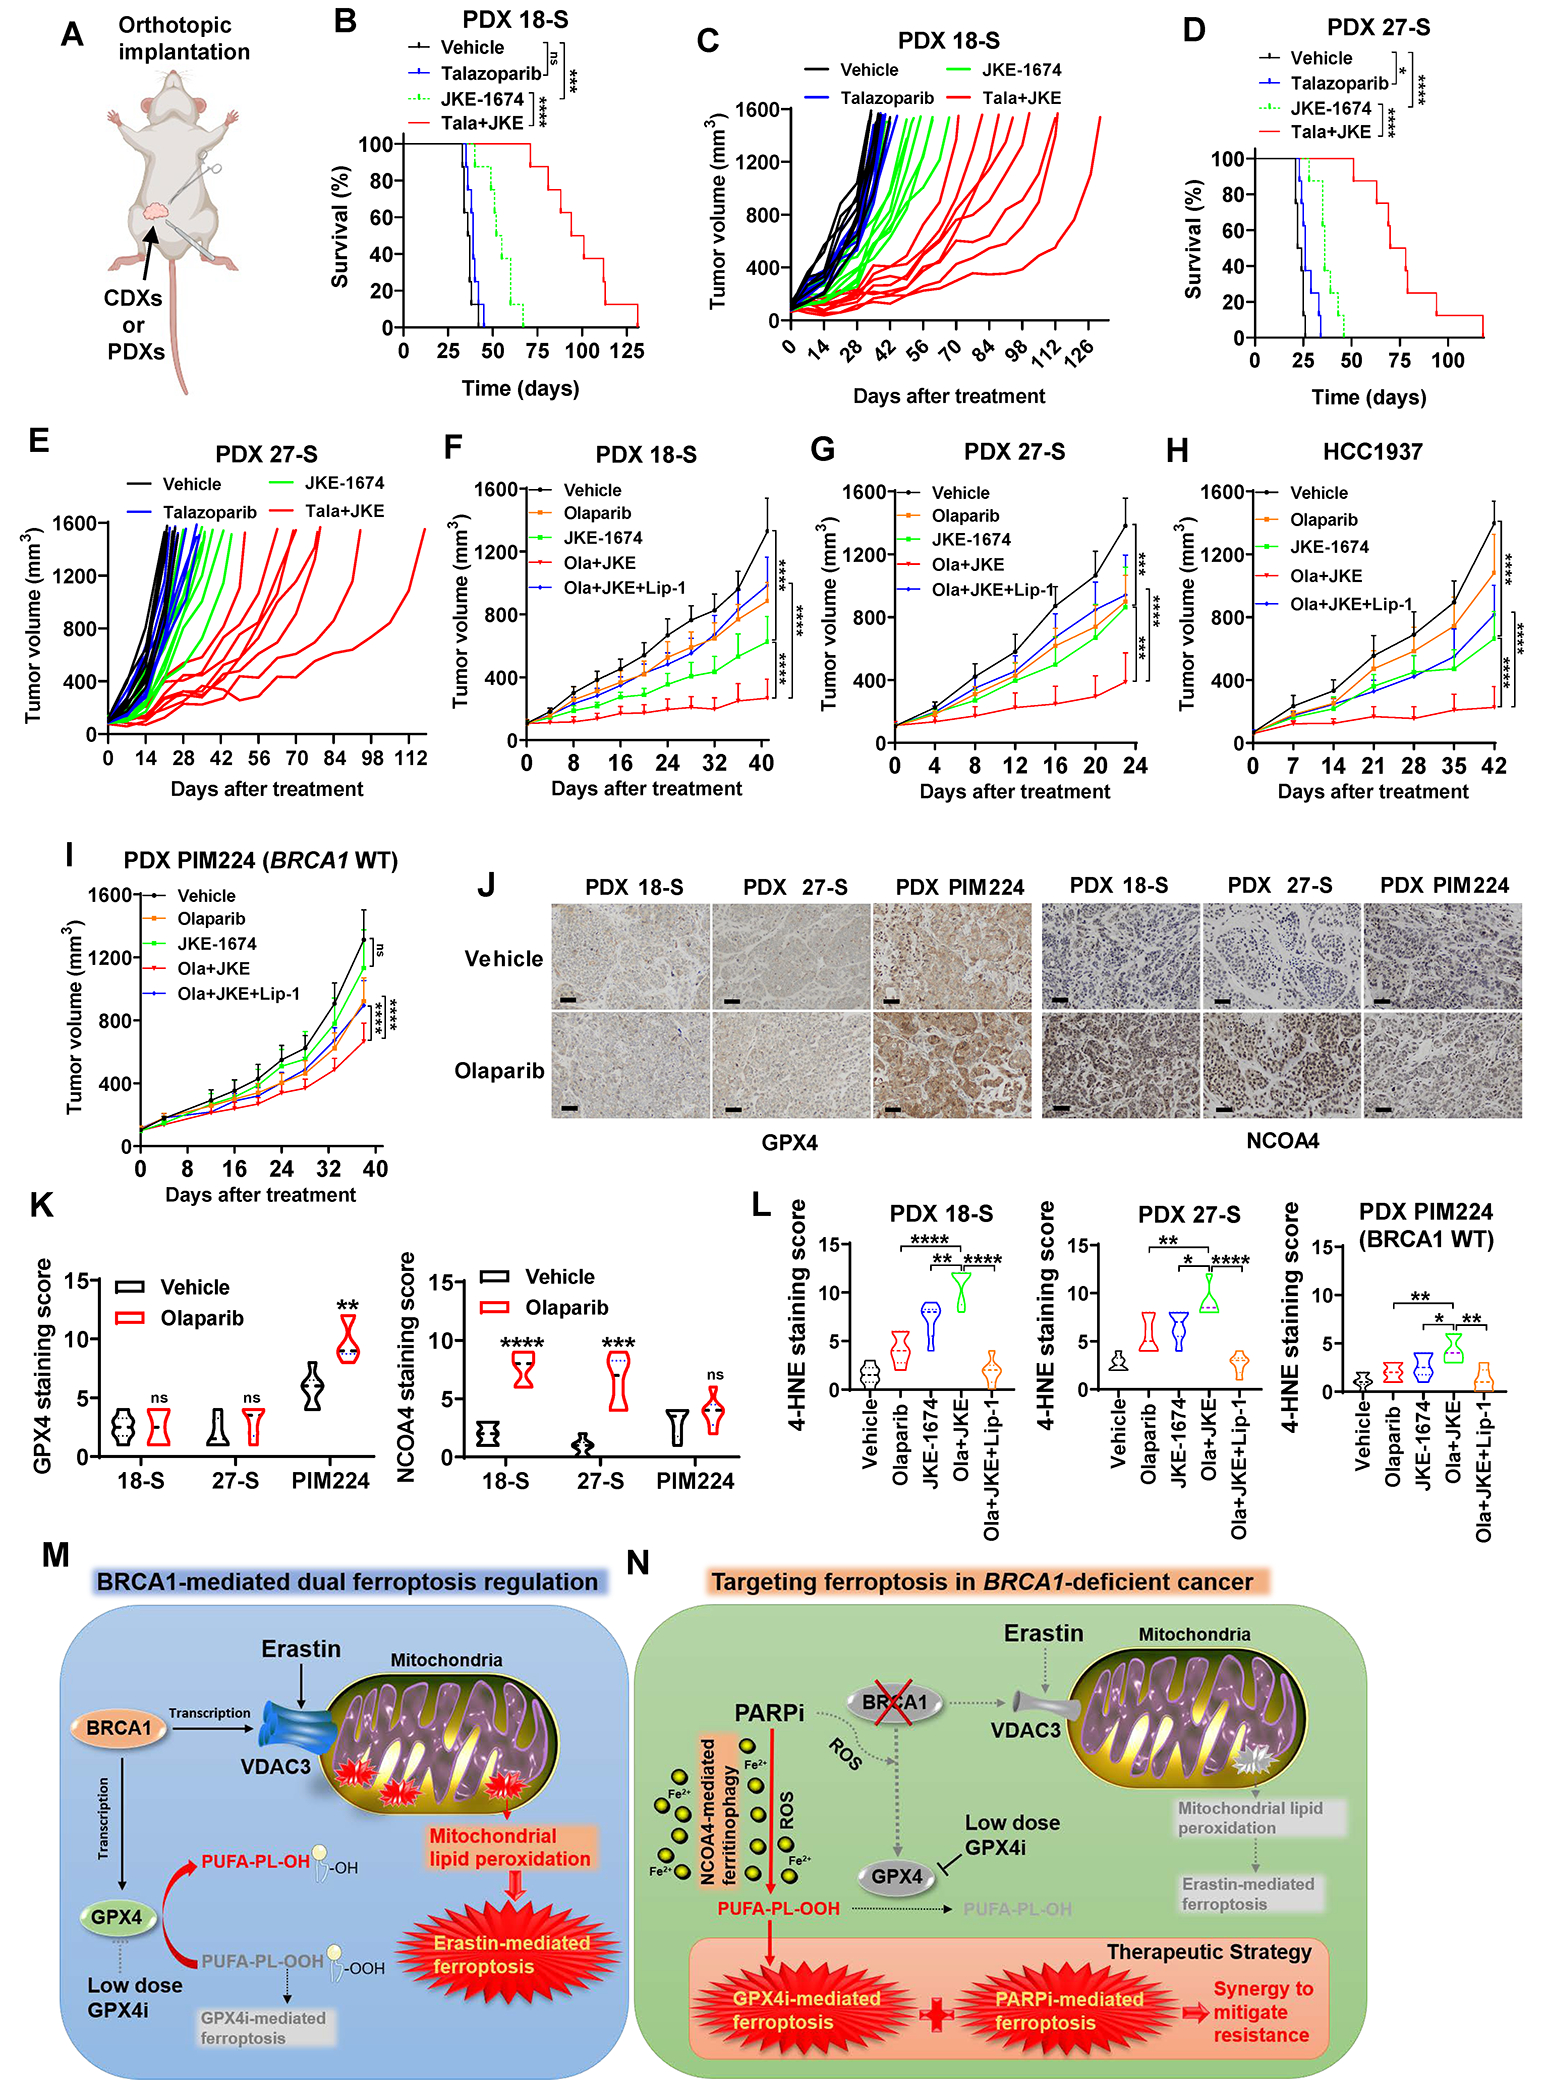
(A) Schematic of the orthotopic implantation model for cell line–derived xenografts (CDXs) and PDXs. (B-E) Kaplan-Meier survival plots or individual tumor volume plots for mice with 18-S PDXs (B, C; n=8) or 17-S PDXs (D, E; n=8) in the indicated treatment groups. (F-H) Tumor volumes of BRCA1-mutant 18-S PDXs (F; n=6-7), 27-S PDXs (G; n=8-10), or HCC1937 xenografts (H; n=10) with indicated treatments over time. Data are presented as mean ± standard deviation. (I) Tumor volumes of BRCA1-WT PIM224 PDXs with indicated treatments over time. Data are presented as mean ± standard deviation, n=7-8. (J) Representative GPX4 or NCOA4 immunochemistry staining images from 18-S PDXs, 27-S PDXs, or PIM224 PDXs treated with or without olaparib. Scale bars, 50 μm. (K) Immunochemistry scoring of GPX4 or NCOA4 staining in 18-S PDXs, 27-S PDXs, or PIM224 PDXs treated with or without olaparib, n=6 randomly selected magnification fields. (L) Immunochemistry scoring of 4-HNE staining in 18-S PDXs, 27-S PDXs, or PIM224 PDXs with indicated treatments, n=6 randomly selected magnification fields. (M) Schematic depicting the dual role of BRCA1 in ferroptosis regulation by governing GPX4 or VDAC3 transcription. (N) Schematic depicting the vulnerability of BRCA1-deficient cancer to PARP and GPX4 co-inhibition and its underlying mechanisms. Data in panel K or L are presented as violin plots with median and interquartile range. Unpaired two-tailed t-test, two-way ANOVA analysis, or log-rank test; *P < 0.05, **P < 0.01, ***P < 0.001, ****P < 0.0001, ns, not significant.
Our results revealed that the application of talazoparib (an FDA-approved PARPi for advanced breast cancers with germline BRCA1 mutations) as a standalone treatment failed to induce a reduction in tumor growth or an extension in animal survival, confirming the PARPi resistance in these PDX models; the treatment with JKE-1674, and more strikingly, the combined administration of JKE-1674 and talazoparib, yielded substantial extensions in animal survival (Fig. 7B–7E). Importantly, the extension of mean animal survival periods in the combination treatment group far surpassed the expectations of a mere additive outcome, underscoring the potency of its synergistic effect (vehicle, talazoparib, JKE-1674, and JKE-1674 + talazoparib combination groups exhibited mean animal survival durations of 36.5, 39, 53.5, and 97.5 days in PDX 18-S, and 23, 26, 36, and 74 days in PDX 27-S, respectively).
To expand the applicability of our preclinical investigations, we further tested the combination of JKE-1674 and olaparib (another FDA-approved PARPi) in these PDX models (as well as in a BRCA1-mutant HCC1937 xenograft model, which exhibited resistance to PARPi (38)). In these models, treatment with JKE-1674 alone significantly reduced tumor growth, and the combination treatment suppressed the tumor growth even more potently; in addition, the ferroptosis inhibitor liproxstatin-1 partially restored tumor growth in the olaparib + JKE-1674 treatment group (Fig. 7F–7H; Supplementary Fig. S7A–S7C), indicating that the combination therapy suppresses tumor growth at least partly by inducing ferroptosis in tumors.
We studied two additional PDX models to further bolster our conclusions. Firstly, to provide a comparison between PARPi-sensitive and PARPi-resistant models, we included a PARPi-sensitive PDX line (PDX16, which was established from a patient with BRCA1 mutation (c.5324T>G) who was responsive to PARPi treatment; see methods for detailed description). Our results showed that PARPi (olaparib or talazoparib) almost completely suppressed tumor growth in PDX16 (Supplementary Fig. S7D), thereby confirming the PARPi resistance in PDX18_S and PDX27_S models. In addition, we showed that treatment with JKE-1674 alone or the combination treatment exhibited minimal or moderate therapeutic effects in BRCA1-WT PIM224 PDXs (39) (Fig. 7I; Supplementary Fig. S7E). This control was used to demonstrate that the combination therapy does not universally work in all cancer contexts, thereby reinforcing our main point of using this combination specifically in BRCA1-mutant cancers.
IHC analyses revealed that GPX4 levels in the BRCA1-WT PIM224 tumor samples were higher than those in BRCA1-mutant PDX18-S and PDX27-S samples (Fig. 7J and 7K); mirroring our in vitro observations (Fig. 6Q and 6R), treatment with olaparib induced GPX4 levels in BRCA1-WT PDX tumors but not in BRCA1-mutant tumors (Fig. 7J and 7K). In addition, consistent with our in vitro results (Fig. 6A–6D; Supplementary Fig. S6F), PARPi treatment increased NCOA4 levels in BRCA1-mutant but not in BRCA1-WT PDX tumors (Fig. 7J and 7K). The decreased GPX4 levels and increased NCOA4 levels, particularly under PARPi treatment, in PARPi-resistant BRCA1-mutant tumors might explain why these tumors were sensitive to GPX4i + PARPi combination therapy. In these PDX studies, staining for 4-HNE (Fig. 7L; Supplementary Fig. S7F), but not for either phospho-H2AX or cleaved caspase-3 (Supplementary Fig. S7G–S7J), correlated with tumor growth change in different treatment groups (i.e., olaparib + JKE-1674 combination therapy increased whereas liproxstatin-1 therapy suppressed 4-HNE staining), indicating that ferroptosis induction (but not apoptosis induction or DNA damage response) underlies the therapeutic efficacy of the combination of GPX4i + PARPi in these preclinical models. Finally, these treatments did not elicit obvious signs of toxicity, as evidenced by the absence of kidney damage (Supplementary Fig. S7K) and no reduction in the animals’ weight (Supplementary Fig. S7L), suggesting that the treatment was well tolerated in vivo.
Together, our results suggest that GPX4i have the potential as a treatment to potentiate PARPi efficacy in BRCA1-mutant tumors with PARPi resistance.
DISCUSSION
Our study reveals that BRCA1 has a unique dual role in regulating ferroptosis by controlling the transcription of VDAC3 and GPX4 (Fig. 7M), and that BRCA1 deficiency promotes resistance to erastin-induced ferroptosis yet renders cancer cells specifically susceptible to GPX4i-induced ferroptosis (Fig. 7N). Our data also show that GPX4i + PARPi combination therapy induced potent ferroptosis in BRCA1-deficient/-mutant cancer cells and xenograft tumors, and GPX4i significantly augemented PARPi efficacy in BRCA1-mutant tumors with PARPi resistance. We propose the following mechanisms to explain these observations (Fig. 7N): (1) PARPi induce lipid peroxidation by promoting NCOA4-mediated ferritinophagy in BRCA1-deficient cancer cells; (2) BRCA1 deficiency in combination with GPX4i abrogates an adaptive response to PARPi therapy to boost GPX4 expression; and (3) compared to BRCA1-WT tumors, BRCA1-mutant tumors appear to exhibit decreased GPX4 expression and increased NCOA4 expression under PARPi treatment, rendering such tumors particularly sensitive to GPX4 inhibition.
BRCA1’s role in ferroptosis regulation appears to be independent of its canonical function in DNA damage response and repair, but is mainly mediated by its non-canonical function in regulating gene transcription. Importantly, our data showed that BRCA2 deficiency does not affect ferroptosis sensitivity or GPX4 (or VDAC3) expression levels. We further showed that BRCA1 regulates GPX4 transcription through its BRCT domain. It is worth noting that the interaction between BRCA1 and BRCA2 is not mediated by BRCA1’s BRCT domain but instead involves the coiled-coil domain within BRCA1 (3); therefore, BRCA2 deficiency does not affect the ability of BRCA1 to regulate GPX4 expression through its BRCT domain, explaining why the effects on GPX4 expression and ferroptosis sensitivity were not observed in the context of BRCA2 deficiency. While PARPi is used to treat patients with either BRCA1 or BRCA2 deficiency, our data suggest that the PARPi + GPX4i combination therapy likely only benefits cancer patients with BRCA1 deficiency, but not those with BRCA2 deficiency. This information will be important for patient selection in future clinical studies with the PARPi + GPX4i combination therapy.
How BRCA1 regulates GPX4 transcription has not been completely elucidated. Our study identified BRCA1-M1775R mutant (but not BRCA1-C61G mutant) as a loss-of-function mutant in regulating GPX4 expression and GPX4i-induced ferroptosis. The C-terminal BRCT domain of BRCA1 is a phosphoprotein binding domain, and M1775R mutation is known to abolish BRCA1 interaction with other phosphoproteins (3,40,41). Furthermore, the phosphorylation events in these phosphoproteins and the interaction between BRCA1’s BRCT domain and phosphoproteins are often regulated by upstream stimuli (such as DNA damage and oxidative stress). Therefore, it is possible that BRCA1 interacts with a phosphorylated transcription factor through its BRCT domain to promote GPX4 transcription, and this interaction is further regulated by PARPi-induced oxidative stress. In addition, the underlying mechanisms by which PARPi modulates GPX4 or NCOA4 expression in a BRCA1-dependent manner remain to be studied. It is noteworthy that, besides their established role in DNA repair, PARPs possess the capacity to modify histones and remodel chromatin architecture, consequently controlling gene expression (42). The interplay between PARPs and gene transcription provides a plausible avenue through which the expression of genes such as GPX4 and NCOA4 could be influenced in response to PARPi treatment. Further studies are required to testing these hypotheses.
Our data that VDAC3-KO cells exhibited remarkable resistance to ferroptosis induced by erastin at low doses but did not affect cystine starvation-induced ferroptosis suggest that erastin treatment at low doses (such as 2.5 μM) is not equivalent to cystine starvation, likely because low-dose erastin treatment can only partially block SLC7A11-mediated cystine uptake. We propose that erastin-induced ferroptosis reflects a combinatorial effect of both weakening ferroptosis defense (through partially blocking SLC7A11-mediated cystine uptake) and further boosting mitochondrial activities to drive ferroptosis (via a gain-of-function effect on VDACs, as proposed by Stockwell and colleagues (26)). Disabling this latter effect, as occurred in VDAC3-KO cells, dramatically weakens ferroptosis-inducing activity of erastin, explaining the remarkable resistance phenotypes in VDAC3-KO cells treated with 2.5 μM erastin (see Fig. 4D). It should be noted that erastin at very high doses (such as 10 μM; see Fig. 4D) can still induce obvious cell death in VDAC3-KO cells, likely because of more complete blockade of SLC7A11-mediated cystine uptake at this high concentration. Furthermore, the lack of phenotypes in VDAC3-KO cells to cystine starvation–induced ferroptosis suggests that basal activity of VDAC3 is not important for this type of ferroptosis (in contrast, VDAC3 is critical for erastin-induced ferroptosis because of erastin’s gain-of-function effect to promote VDAC function). Our data suggest that erastin-like FINs (such as IKE) would work better in ferroptosis-inducing therapy for cancer treatment than more specific SLC7A11 inhibitors (although our current study does not support their use for treating BRCA1-mutant cancers).
Because GPX4 is an essential gene (43), whether GPX4 inhibition would cause intolerable toxicities in patients remains a concern. However, because BRCA1-deficient cells are much more vulnerable to ferroptosis induced by GPX4i (or by the GPX4i + PARPi combination) than are BRCA1-proficient cells, there might exist an appropriate therapeutic window allowing low-dose GPX4i to selectively kill BRCA1-deficient tumors while sparing normal tissues. Indeed, GPX4i therapy, at least at the chosen dose of JKE-1674, did not show obvious toxicities in our animal studies yet reduced the growth of BRCA1-deficient tumors. Our study provides the rationale for clinical studies to further test PARPi + GPX4i combination therapy in patients with BRCA1-mutant tumors and PARPi resistance. The envisioned scope for the combined treatment of PARPi and GPX4i would include tumors harboring BRCA1 nonsense or frameshift mutations, which lead to the loss of BRCA1 expression, as well as those with BRCT domain mutations, resulting in the expression of BRCA1 protein with mutations in the BRCT domain. Since BRCA1 mutations observed in patients predominantly involve frameshift or nonsense mutations (44), our study suggests that the majority of individuals with BRCA1 mutations could potentially benefit from this combination treatment. Further translating these findings into meaningful therapeutic interventions for cancer patients will require additional research with a multifaceted approach, including not only the continued refinement of GPX4i but also careful dosing assessments in future preclinical and clinical studies.
METHODS
Cell culture studies
DLD-1 and UWB1.289 cell lines were provided by Dr. Junjie Chen at MDACC. HEY and SKOV3 cell lines were provided by Dr. Jinsong Liu at MDACC. SUM149 cells were provided by Dr. Mien-Chie Hung at MD Anderson Cancer Center (MDACC). MDA-MB-453 cells were obtained from the Cytogenetics and Cell Authentication Core at MDACC. SUM1315 cells were obtained from the BioIVT, and all other cancer cell lines were obtained from the American Type Culture Collection (ATCC). All cell lines were free of mycoplasma contamination (tested by the vendor). No cell line used in the current study has been found in the International Cell Line Authentication Committee database of commonly misidentified cell lines, based on short tandem repeat profiling performed by the vendor. Cell lines were banked in multiple aliquots on receipt to reduce the risk of phenotypic drift, and all cell lines were cultured for less than 1-month post-thaw. UWB1.289, MCF10A, SUM149, and SUM1315 cells were cultured in medium based on the instruction of ATCC or BioIVT. All other cell lines were cultured in RPMI-1640 or Dulbecco’s modified Eagle medium (DMEM) with 10% (volume/volume; v/v) fetal bovine serum and 1% (v/v) penicillin/streptomycin at 37 °C with a humidified atmosphere of 20% O2 and 5% CO2. For cystine-starvation experiments, cells were cultured in cystine-free media + 10% (v/v) dialyzed fetal bovine serum as previously described (45). Mutation information for the cell lines is listed in Supplementary Table S2.
Constructs and reagents
GPX4 expression plasmids were described in our previous publication (30). BRCA1-WT, BRCA1-C61G mutant, and BRCA1-M1775R mutant expression plasmids were obtained from Dr. Junjie Chen at MDACC (46). The sequences of primers used in generating BRCA1-A1708E and -P1749R mutant expression plasmids are listed in Supplementary Table S3. VDAC2 and VDAC3 cDNAs were obtained from the Functional Genomics Core Facility at MDACC and subsequently cloned into the lentivirus vector pLV-EF1a-IRES-Blast.
FINs included RSL3 (Selleckchem), ML210 (Selleckchem), ML162 (Cayman Chemical), JKE-1674 (MedChemExpress), erastin (Selleckchem), imidazole ketone erastin (Selleckchem), and sulfasalazine (Sigma-Aldrich); PARPi included olaparib (Selleckchem) and niraparib (Selleckchem); cell death inhibitors included ferrostatin-1 (Selleckchem), liproxstatin-1 (Cayman Chemical), and Z-VAD-FMK (Selleckchem); iron chelator and antioxidants included DFO (Selleckchem), TEMPO (Sigma-Aldrich), and MitoTEMPO (Sigma-Aldrich).
CRISPR-Cas9–mediated gene knockout and overexpression cell line generation
Knockout of BRCA1, BRCA2, VDAC3, GPX4, 53BP1, and NCOA4 in human cell lines was performed using single guide RNAs (sgRNAs) and the CRISPR-Cas9 expression system as previously described (47,48). Briefly, sgRNAs were cloned into the lentiviral LentiGuide vector. The sequences of sgRNAs used in the current study are listed in Supplementary Table S3. LentiGuide clones were transfected into HEK293T cells with a psPAX2 packaging plasmid and pMD2.G-expressing plasmid. Cells were infected with lentivirus with 0.8 μg/mL polybrene and selected with puromycin (1 μg/mL, InvivoGen) or blasticidin (2 μg/mL, InvivoGen), followed by Western blot analysis to confirm target gene deletion. To maintain GPX4 knockout cells, we added 1μM ferrostatin-1 into the media.
Stable cell lines overexpressing target gene constructs were generated as described previously (49,50). Briefly, HEK293T cells were transfected with either empty vector or target gene constructs, together with the psPAX.2 and pMD2.G third-generation lentiviral packaging system using 0.8 μg/mL polybrene. After 48 hours, lentivirus particles in the medium were collected and filtered, and then the target cell lines were infected, followed by puromycin selection to obtain stable cell lines with successful transduction.
Cell viability and cell death assay
Viable cells were measured using Cell Counting Kit-8 (CCK-8, Dojindo) as previously described (51,52). Briefly, cells were seeded onto 96-well plates and subsequently treated with indicated agents. Next, cells were exposed to 10 μL of CCK-8 reagent (100 μL of medium per well) for 1 hour at 37 °C with 5% CO2 in an incubator. The absorbance at a wavelength of 450 nm was determined using a FLUOstar Omega microplate reader (BMG Labtech). The combination effects were assessed with Bliss independence model and the score is defined as “observed combination effect” minus “expected additive effect”. The synergy indicates that the “observed combination effect” exceeds the “expected additive effect”.
Cell death was measured by propidium iodide (Roche) staining using a flow cytometer, as previously described (53–55). Briefly, cells were seeded onto 6- or 12-well plates and subsequently treated with indicated agents. For GPX4 knockout cells, ferrostatin-1 was removed from the culture media. Next, cells were collected (including floating dead cells) and stained with 5 μg/mL propidium iodide. The percentage of the propidium iodide–positive dead cells was determined using the flow cytometer BD Accuri C6 (BD Biosciences) or Attune NxT Flow Cytometer (ThermoFisher) with an FL2 detector. A minimum of 5,000 single cells were analyzed per well.
Lipid peroxidation and ROS measurement
As previously described (30,54,56,57), C11-BODIPY 581/591 (Invitrogen) was used for lipid peroxidation, MitoPerOx (Abcam) for mitochondrial lipid peroxidation, and CM-H2DCFDA (ThermoFisher) for ROS measurements. Briefly, cells were seeded on 6- or 12-well plates and subsequently treated with indicated agents. After staining with 2.5μM C11-BODIPY 581/591, 2.5μM MitoPerOx, or 4μM CM-H2DCFDA for 20 minutes, cells were analyzed using the flow cytometer BD Accuri C6 (BD Biosciences) or Attune NxT Flow Cytometer (ThermoFisher) with a 488-nm laser on an FL1 detector. A minimum of 5,000 single cells were analyzed per well.
Labile iron pool measurement
Labile iron pool was measured according to methods described previously (33,58). Briefly, the treated cells were incubated with 0.05μM calcein-AM (C3099, Invitrogen) for 15 minutes at 37 °C. Subsequently, cells were washed twice with phosphate-buffered saline (PBS) and then left untreated or incubated with DFO for 1 hour at 37 °C. After being washed with PBS, cells were analyzed using Attune NxT Flow Cytometer (ThermoFisher) with a 488-nm laser on an FL1 detector. The difference in the cellular mean fluorescence with and without DFO incubation reflects the amount of labile iron pool.
Glutathione measurement
Glutathione level measurements were performed as previously described (49,59). Briefly, cells were seeded onto 96-well plates and subsequently treated with erastin. Next, the media containing erastin was replaced with 100 μL of prepared 1× GSH-Glo Reagent and incubated for 30 minutes. Then, 100 μL of reconstituted Luciferin Detection Reagent was added, gently mixed on a plate shaker, and incubated for 20 minutes. Relative glutathione levels were assessed by luminescent signals using a Gen5 Microplate reader (BIOTEK). Results were normalized to cell viability.
Quantitative PCR with reverse transcription
Quantitative reverse transcription PCR was performed as previously described (60,61). Briefly, total RNA was extracted using TRIzol reagent (Invitrogen), and reverse transcription was performed using iScript Reverse Transcription Supermix (Biorad). SYBR GreenER qPCR SuperMix Universal (Invitrogen) was used for quantitative PCR in triplicate, with samples run on a Stratagene MX3000P qPCR system. The threshold cycle (Ct) values for each gene were normalized to those of β-actin, and the 2−ΔΔCt method was used for quantitative analysis. The primer sequences are listed in Supplementary Table S3.
Immunoprecipitation and Western blot analysis
Cell pellets were lysed using immunoprecipitation lysis buffer (Fisher Scientific) or NP-40 buffer containing complete mini protease inhibitors (Roche) (62). Protein concentrations were detected by a Bicinchoninic Acid Protein Assay (Thermo Scientific) using a FLUOstar Omega microplate reader (BMG Labtech). Immunoprecipitation and Western blot analysis were conducted as previously described (63,64). The primary antibodies and concentrations used in the current study included the followed: GPX4 (1:1,000, MAB5457, R&D systems), BRCA1 (1:1,000, 14823, Cell Signaling), BRCA2 (1:1,000, MAB2476-SP, R&D Systems), DHODH (1:1,000, 14877-1-AP, Proteintech), ACSL4 (1:1,000, sc-271800, Santa Cruz), FSP1 (1:1,000, 20886-1-AP, Proteintech), VDAC1 (1:1,000, 66345-1-Ig, Proteintech), VDAC2 (1:1,000, 66388-1-Ig, Proteintech), VDAC3 (1:1,000, 55260-1-AP, Proteintech), SLC7A11 (1:1,000, 12691-, Cell Signaling), NCOA4 (1:1,000, 66849, Cell Signaling), vinculin (1:10000; V4505, Sigma), β-actin (1:1,000, 3700, Cell Signaling), LC3B (1:5000, 3868, Cell Signaling), 53BP1 (1:5000, NB100-304, Novus Biologicals), GCH1 (1:1000, MA5-27277, Invitrogen), ACSL3 (1:1000, H00002181-B01P, Novus Biologicals), and tubulin (1:5000, 2144, Cell Signaling).
Luciferase reporter assay
Luciferase reporter assays were performed as previously described (49). The GPX4 promoter was amplified using genomic DNA extracted from 293T cells and cloned into pGL3 luciferase reporter vectors. The luciferase reporter assay was conducted using the Dual-Luciferase Reporter Assay System (Promega, E1910 and E1960) according to the manufacturer’s instructions. Briefly, 293T cells were transfected with each plasmid for 48 hours, washed with PBS, and lysed for 15 minutes at room temperature. Cell lysates were transferred to a 96-well plate for subsequent luciferase activity measurement. The sample was then placed in the luminometer and read.
ChIP assays
ChIP assays were essentially performed using the SimpleChIP Enzymatic Chromatin IP Kit (Cell Signaling, #9003) as previously described (65,66). Cells were fixed with formaldehyde (1% final volume concentration) for 10 minutes at room temperature. Fixation was stopped by adding glycine and incubating for 5 minutes at room temperature. Chromatin (10 μg) was incubated overnight with 10 μg of BRCA1 (1:1,000, 22362-1-AP, Proteintech) after digestion. Antibody-protein complex was captured with ChIP-Grade Protein G Magnetic Beads (Cell Signaling, 9006). ChIP DNA was analyzed by quantitative PCR with SYBR GreenER qPCR SuperMix Universal (Invitrogen) in a Stratagene MX3000P qPCR system using the primers.
Orthotopic and subcutaneous xenograft model
The xenograft experiments were performed in accordance with a protocol approved by the Institutional Animal Care and Use Committee and Institutional Review Board at The University of Texas MD Anderson Cancer Center. Female 4- to 6-week-old athymic nude mice (Foxn1nu/Foxn1nu) and NOD scid gamma (NSG) mice were obtained from the Experimental Radiation Oncology Breeding Core Facility at MD Anderson. All mice were maintained under specific pathogen-free housing in the Animal Care Facility in the Department of Veterinary Medicine and Surgery at MD Anderson. Rodent housing conditions used in the current study were as follows: temperature set point 72 °F, high limit 74 °F, low limit 70 °F; humidity set point 45%, high limit 55%, low limit 40%; light cycle 12 hours light–dark. The study is compliant with all relevant ethical regulations regarding animal research.
PDX lines (including BRCA1-WT line PIM224, and BRCA1-mutant lines 16, 18-S, and 27-S) were obtained from Dr. Helen Piwnica-Worms at MDACC and maintained/expanded on NSG mice as previously described (67). The BRCA1-mutant tumors used to create the PDX models were obtained in alignment with a phase II neoadjuvant clinical trial (NCT03499353) conducted at MDACC (37). The objective of the trial was to evaluate the pathologic response and toxicity to single-agent talazoparib for 6 months in 20 patients with stage I to III breast cancer and who were gBRCA1/2-positive before definitive surgery. Upon enrollment, patients were biopsied to provide tumor material for implantation into mice for PDX establishment. Patients were then administered a single oral dose of talazoparib once per day for 6 cycles (each cycle was 28 days), followed by an additional biopsy for PDX establishment and surgery where residual cancer burden (RCB) (68) was determined. Patients with either pathological complete response (pCR) or RCB-I were considered sensitive, while patients with RCB-II or RCB-III were considered resistant to talazoparib. RCB index was classified as: RCB-I (minimal burden), RCB-II (moderate burden) or RCB-III (extensive burden). PDX-16, PDX18-S, and PDX27-S were from patients with RCB-I, RCB-III, RCB-II, respectively.
Orthotopic implantation was conducted as previously described(67). For cell line–derived orthotopic xenograft models, 5 × 10⁶ HCC1937 cells were resuspended in 50% volume Matrigel (Invitrogen) + 50% volume medium and implanted into the fourth inguinal mammary fat pad of nude mice. For orthotopic PDX models, PDX tumors were harvested and dissociated into single cells by mechanical mincing and digestion (67); 1 × 10⁶ digested PDX 16, 18-S, 27-S, or PIM224 tumor cells were resuspended in 50% volume Matrigel (Invitrogen) + 50% volume medium and implanted into the fourth inguinal mammary fat pad of NSG mice. For cell line–derived subcutaneous xenograft models, 6 × 10⁶ Cas9 control or BRCA1–single-guide RNA (sgRNA)-infected SKOV3 cells were resuspended in 50% volume Matrigel (Invitrogen) + 50% volume medium and injected into nude mice subcutaneously.
In all these animal studies, mice were randomized to different treatment groups when tumors reached 50-100 mm3. Olaparib (MedChemExpress) was dissolved in dimethyl sulfoxide and diluted in 30% volume PEG 300 + 70% volume PBS. JKE-1674 used in mouse administration was synthesized by Institute for Applied Cancer Science at MDACC. JKE-1674, talazoparib (Selleckchem), and liproxstatin-1 (Cayman Chemical) were dissolved in dimethyl sulfoxide and diluted in PBS. JKE-1674 (25 mg/kg), olaparib (40 mg/kg), and talazoparib (0.333 mg/kg) were administered to mice every 2 days. Liproxstatin-1 (10 mg/kg) was administered to mice every day. Treatment with olaparib, JKE-1674, talazoparib, or liproxstatin-1 was continued until the endpoint as indicated in the corresponding figures. The volume of tumors was measured with a caliper one to three times per week until the endpoint and calculated according to the following equation: volume = length × width2 × 1/2. Survival was assessed using the Kaplan-Meier survival curve and differences in survival were calculated by log-rank test. Relevant gene mutation information for the tumors used in the xenograft models is listed in Supplementary Table S2.
Histology and immunohistochemistry
Histologic analysis and immunohistochemistry staining were performed as previously described (69,70). Briefly, tumor tissues were collected, immediately fixed in 10% neutral-buffered formalin (ThermoFisher) overnight, and stored in 70% ethanol at 4 °C. The tissues were dehydrated and embedded in paraffin by the Research Histology Core Laboratory at MDACC according to standard protocols. Samples were sectioned at a thickness of 5 μm and subjected to hematoxylin and eosin or immunohistochemistry staining. The primary antibodies and concentrations used for immunohistochemistry included the following: anti-4-HNE (1:300, Abcam, ab46545), anti-phospho-H2AX (1:500, EMD Millipore, Cat#05-636), anti-GPX4 (1:150, Novus Biologicals, NBP2-54979), anti-NCOA4 (1:200, Abcam, ab111885), and anti-cleaved caspase-3 (1:500, Cell Signaling, 9661s). Staining was performed using the Vectastain elite ABC kit and DAB peroxidase substrate kit (Vector laboratories). Images were randomly acquired at 200× or 400× magnification using an Olympus BX43 microscope, and an immunoreactive score system was used to semiquantitatively assess the level of staining (71).
Statistics, reproducibility, and data availability
Statistical analyses were performed with GraphPad Prism 8 software using unpaired Student t tests, two-way ANOVA, or log-rank test. The results of cell-based experiments were collected from at least three independent replicates. The results of animal-based experiments were collected from at least six tumors in each group. Data are presented as means ± standard deviation. Statistical significance levels (P values) are indicated as follows: *P < 0.05; **P < 0.01; ***P < 0.001; ****P < 0.0001; NS, not significant. No statistical methods were used to predetermine sample size. Sample size was determined according to our experience as well as literature reporting in terms of the specific experiment. Data supporting the findings of this study are available upon reasonable request from the corresponding authors.
Supplementary Material
STATEMENT OF SIGNIFICANCE.
Lei et al. reveal that BRCA1 deficiency promotes resistance to erastin-induced ferroptosis via blocking VDAC3 yet renders cancer cells vulnerable to GPX4i-induced ferroptosis via inhibiting GPX4. NCOA4 induction and defective GPX4 further synergizes GPX4i with PARPi to induce ferroptosis in BRCA1-deficient cancers and targeting GPX4 mitigates PARPi-resistance in those cancers.
ACKNOWLEDGMENTS
This research was supported by the Institutional Research Fund and Bridge Fund from The University of Texas MD Anderson Cancer Center; Boot Walk Seed Award from Radiation Oncology Strategic Initiatives at The University of Texas MD Anderson Cancer Center; Cancer Prevention & Research Institute of Texas grants RP220258 and RP230072; and R01CA181196, R01CA244144, R01CA247992, R01CA269646, and U54 CA274220 from the National Institutes of Health; the N.G. and Helen T. Hawkins Distinguished Professorship for Cancer Research of MD Anderson Cancer Center (to B.G.), and the National Institutes of Health Cancer Center Support Grant P30CA016672 (to The University of Texas MD Anderson Cancer Center). M.-C.H. is supported by National Science and Technology Council Taiwan (NSTC112-2639-B-039-001-ASP), T-Star Center (NSTC 1132634-F-039-001), and Research Center Program from the Ministry of Education in Taiwan. T.A.Y. is supported by DOD grants W81XWH2210504_BC211174 and W81XWH-21-1-0282_OC200482, V Foundation Scholar grant VC2020-001, and NIH grant R01CA255074.
Conflict of Interest
B.G. and G.L. have filed a patent application relating to the use of GPX4 inhibitors in combination with PARP inhibitors for treating BRCA1-deficienct cancers. B.G. reports personal fees from Guidepoint Global, Cambridge Solutions, and NGM Bio. T.A.Y. received research support (to institution) from Acrivon, Artios, AstraZeneca, Bayer, Beigene, BioNTech, Blueprint, BMS, Boundless bio, Clovis, Constellation, Cyteir, Eli Lilly, EMD Serono, Forbius, F-Star, GlaxoSmithKline, Genentech, Haihe, Ideaya ImmuneSensor, Ionis, Ipsen, Jounce, Karyopharm, KSQ, Kyowa, Merck, Mirati, Novartis, Pfizer, Ribon Therapeutics, Regeneron, Repare, Rubius, Sanofi, Scholar Rock, Seattle Genetics, Tesaro, Vivace and Zenith. T.A.Y. has received fees for consulting from AbbVie, AstraZeneca, Acrivon, Adagene, Almac, Aduro, Amphista, Artios, Athena, Atrin, Avoro, Axiom, Baptist Health Systems, Bayer, Beigene, Blueprint Medicines, Boxer, Bristol Myers Squibb, C4 Therapeutics, Calithera, Cancer Research UK, Circle Pharma, Clovis, CUHK Committee, Cybrexa, Dark Blue Therapeutics, Diffusion, Ellipses.Life, EMD Serono, F-Star, Genentech, Genmab, Gerson and Lehrman Group, Glenmark, GLG, Globe Life Sciences, GSK, Guidepoint, Idience, Ignyta, I-Mab, ImmuneSensor, Institut Gustave Roussy, Intellisphere, Jansen, Kyn, LRG1, MEI pharma, Mereo, Merck, Natera, Nexys, Novocure, OHSU, OncoSec, Ono Pharma, Panangium, Pegascy, PER, Pfizer, Piper-Sandler, Pliant Therapeutics, Prolynx, Radiopharm Theranostics, Repare, resTORbio, Roche, Sanofi, Schrodinger, Seagen, Synthis Therapeutics, Terremoto Biosciences, Tessellate Bio, TD2 Theragnostics, Tome Biosciences, Varian, Versant, Vibliome, Xinthera, Zai Labs, Zentalis and ZielBio. T.A.Y. is the stockholder in Seagen. All other authors declare no competing financial interests.
REFERENCES
- 1.Roy R, Chun J, Powell SN. BRCA1 and BRCA2: different roles in a common pathway of genome protection. Nat Rev Cancer 2011;12(1):68–78 doi 10.1038/nrc3181. [DOI] [PMC free article] [PubMed] [Google Scholar]
- 2.Mersch J, Jackson MA, Park M, Nebgen D, Peterson SK, Singletary C, et al. Cancers associated with BRCA1 and BRCA2 mutations other than breast and ovarian. Cancer 2015;121(2):269–75 doi 10.1002/cncr.29041. [DOI] [PMC free article] [PubMed] [Google Scholar]
- 3.Huen MS, Sy SM, Chen J. BRCA1 and its toolbox for the maintenance of genome integrity. Nat Rev Mol Cell Biol 2010;11(2):138–48 doi 10.1038/nrm2831. [DOI] [PMC free article] [PubMed] [Google Scholar]
- 4.Savage KI, Harkin DP. BRCA1, a ‘complex’ protein involved in the maintenance of genomic stability. FEBS J 2015;282(4):630–46 doi 10.1111/febs.13150. [DOI] [PubMed] [Google Scholar]
- 5.Bryant HE, Schultz N, Thomas HD, Parker KM, Flower D, Lopez E, et al. Specific killing of BRCA2-deficient tumours with inhibitors of poly(ADP-ribose) polymerase. Nature 2005;434(7035):913–7 doi 10.1038/nature03443. [DOI] [PubMed] [Google Scholar]
- 6.Farmer H, McCabe N, Lord CJ, Tutt AN, Johnson DA, Richardson TB, et al. Targeting the DNA repair defect in BRCA mutant cells as a therapeutic strategy. Nature 2005;434(7035):917–21 doi 10.1038/nature03445. [DOI] [PubMed] [Google Scholar]
- 7.Konecny GE, Kristeleit RS. PARP inhibitors for BRCA1/2-mutated and sporadic ovarian cancer: current practice and future directions. Br J Cancer 2016;115(10):1157–73 doi 10.1038/bjc.2016.311. [DOI] [PMC free article] [PubMed] [Google Scholar]
- 8.Ison G, Howie LJ, Amiri-Kordestani L, Zhang L, Tang S, Sridhara R, et al. FDA Approval Summary: Niraparib for the Maintenance Treatment of Patients with Recurrent Ovarian Cancer in Response to Platinum-Based Chemotherapy. Clin Cancer Res 2018;24(17):4066–71 doi 10.1158/1078-0432.CCR-18-0042. [DOI] [PubMed] [Google Scholar]
- 9.Pilie PG, Tang C, Mills GB, Yap TA. State-of-the-art strategies for targeting the DNA damage response in cancer. Nat Rev Clin Oncol 2019;16(2):81–104 doi 10.1038/s41571-018-0114-z. [DOI] [PMC free article] [PubMed] [Google Scholar]
- 10.Audeh MW, Carmichael J, Penson RT, Friedlander M, Powell B, Bell-McGuinn KM, et al. Oral poly(ADP-ribose) polymerase inhibitor olaparib in patients with BRCA1 or BRCA2 mutations and recurrent ovarian cancer: a proof-of-concept trial. Lancet 2010;376(9737):245–51 doi 10.1016/S0140-6736(10)60893-8. [DOI] [PubMed] [Google Scholar]
- 11.Tutt A, Robson M, Garber JE, Domchek SM, Audeh MW, Weitzel JN, et al. Oral poly(ADP-ribose) polymerase inhibitor olaparib in patients with BRCA1 or BRCA2 mutations and advanced breast cancer: a proof-of-concept trial. Lancet 2010;376(9737):235–44 doi 10.1016/S0140-6736(10)60892-6. [DOI] [PubMed] [Google Scholar]
- 12.Fong PC, Boss DS, Yap TA, Tutt A, Wu P, Mergui-Roelvink M, et al. Inhibition of poly(ADP-ribose) polymerase in tumors from BRCA mutation carriers. N Engl J Med 2009;361(2):123–34 doi 10.1056/NEJMoa0900212. [DOI] [PubMed] [Google Scholar]
- 13.Li H, Liu ZY, Wu N, Chen YC, Cheng Q, Wang J. PARP inhibitor resistance: the underlying mechanisms and clinical implications. Mol Cancer 2020;19(1):107 doi 10.1186/s12943-020-01227-0. [DOI] [PMC free article] [PubMed] [Google Scholar]
- 14.Dias MP, Moser SC, Ganesan S, Jonkers J. Understanding and overcoming resistance to PARP inhibitors in cancer therapy. Nat Rev Clin Oncol 2021;18(12):773–91 doi 10.1038/s41571-021-00532-x. [DOI] [PubMed] [Google Scholar]
- 15.Noordermeer SM, van Attikum H. PARP Inhibitor Resistance: A Tug-of-War in BRCA-Mutated Cells. Trends in cell biology 2019;29(10):820–34 doi 10.1016/j.tcb.2019.07.008. [DOI] [PubMed] [Google Scholar]
- 16.Dixon SJ, Lemberg KM, Lamprecht MR, Skouta R, Zaitsev EM, Gleason CE, et al. Ferroptosis: an iron-dependent form of nonapoptotic cell death. Cell 2012;149(5):1060–72 doi 10.1016/j.cell.2012.03.042. [DOI] [PMC free article] [PubMed] [Google Scholar]
- 17.Jiang X, Stockwell BR, Conrad M. Ferroptosis: mechanisms, biology and role in disease. Nat Rev Mol Cell Biol 2021;22(4):266–82 doi 10.1038/s41580-020-00324-8. [DOI] [PMC free article] [PubMed] [Google Scholar]
- 18.Stockwell BR. Ferroptosis turns 10: Emerging mechanisms, physiological functions, and therapeutic applications. Cell 2022;185(14):2401–21 doi 10.1016/j.cell.2022.06.003. [DOI] [PMC free article] [PubMed] [Google Scholar]
- 19.Friedmann Angeli JP, Schneider M, Proneth B, Tyurina YY, Tyurin VA, Hammond VJ, et al. Inactivation of the ferroptosis regulator Gpx4 triggers acute renal failure in mice. Nat Cell Biol 2014;16(12):1180–91 doi 10.1038/ncb3064. [DOI] [PMC free article] [PubMed] [Google Scholar]
- 20.Yang WS, SriRamaratnam R, Welsch ME, Shimada K, Skouta R, Viswanathan VS, et al. Regulation of ferroptotic cancer cell death by GPX4. Cell 2014;156(1-2):317–31 doi 10.1016/j.cell.2013.12.010. [DOI] [PMC free article] [PubMed] [Google Scholar]
- 21.Koppula P, Zhang Y, Zhuang L, Gan B. Amino acid transporter SLC7A11/xCT at the crossroads of regulating redox homeostasis and nutrient dependency of cancer. Cancer Commun (Lond) 2018;38(1):12 doi 10.1186/s40880-018-0288-x. [DOI] [PMC free article] [PubMed] [Google Scholar]
- 22.Lei G, Zhuang L, Gan B. Targeting ferroptosis as a vulnerability in cancer. Nat Rev Cancer 2022;22(7):381–96 doi 10.1038/s41568-022-00459-0. [DOI] [PMC free article] [PubMed] [Google Scholar]
- 23.Wu J, Minikes AM, Gao M, Bian H, Li Y, Stockwell BR, et al. Intercellular interaction dictates cancer cell ferroptosis via NF2-YAP signalling. Nature 2019;572(7769):402–6 doi 10.1038/s41586-019-1426-6. [DOI] [PMC free article] [PubMed] [Google Scholar]
- 24.Basu A, Bodycombe NE, Cheah JH, Price EV, Liu K, Schaefer GI, et al. An interactive resource to identify cancer genetic and lineage dependencies targeted by small molecules. Cell 2013;154(5):1151–61 doi 10.1016/j.cell.2013.08.003. [DOI] [PMC free article] [PubMed] [Google Scholar]
- 25.Lamber EP, Horwitz AA, Parvin JD. BRCA1 represses amphiregulin gene expression. Cancer Res 2010;70(3):996–1005 doi 10.1158/0008-5472.CAN-09-2842. [DOI] [PMC free article] [PubMed] [Google Scholar]
- 26.Yagoda N, von Rechenberg M, Zaganjor E, Bauer AJ, Yang WS, Fridman DJ, et al. RAS-RAF-MEK-dependent oxidative cell death involving voltage-dependent anion channels. Nature 2007;447(7146):864–8 doi 10.1038/nature05859. [DOI] [PMC free article] [PubMed] [Google Scholar]
- 27.Burrows AE, Smogorzewska A, Elledge SJ. Polybromo-associated BRG1-associated factor components BRD7 and BAF180 are critical regulators of p53 required for induction of replicative senescence. Proc Natl Acad Sci U S A 2010;107(32):14280–5 doi: 10.1073/pnas.1009559107. [DOI] [PMC free article] [PubMed] [Google Scholar]
- 28.Gao M, Yi J, Zhu J, Minikes AM, Monian P, Thompson CB, et al. Role of Mitochondria in Ferroptosis. Mol Cell 2019;73(2):354–63 e3 doi 10.1016/j.molcel.2018.10.042. [DOI] [PMC free article] [PubMed] [Google Scholar]
- 29.Gan B. Mitochondrial regulation of ferroptosis. J Cell Biol 2021;220(9) doi 10.1083/jcb.202105043. [DOI] [PMC free article] [PubMed] [Google Scholar]
- 30.Mao C, Liu X, Zhang Y, Lei G, Yan Y, Lee H, et al. DHODH-mediated ferroptosis defence is a targetable vulnerability in cancer. Nature 2021;593(7860):586–90 doi 10.1038/s41586-021-03539-7. [DOI] [PMC free article] [PubMed] [Google Scholar]
- 31.Eaton JK, Furst L, Ruberto RA, Moosmayer D, Hilpmann A, Ryan MJ, et al. Selective covalent targeting of GPX4 using masked nitrile-oxide electrophiles. Nature chemical biology 2020;16(5):497–506 doi 10.1038/s41589-020-0501-5. [DOI] [PMC free article] [PubMed] [Google Scholar]
- 32.Wang ME, Chen J, Lu Y, Bawcom AR, Wu J, Ou J, et al. RB1-deficient prostate tumor growth and metastasis are vulnerable to ferroptosis induction via the E2F/ACSL4 axis. J Clin Invest 2023;133(10) doi 10.1172/JCI166647. [DOI] [PMC free article] [PubMed] [Google Scholar]
- 33.Gao M, Monian P, Pan Q, Zhang W, Xiang J, Jiang X. Ferroptosis is an autophagic cell death process. Cell research 2016;26(9):1021–32 doi 10.1038/cr.2016.95. [DOI] [PMC free article] [PubMed] [Google Scholar]
- 34.Hou W, Xie Y, Song X, Sun X, Lotze MT, Zeh HJ 3rd, et al. Autophagy promotes ferroptosis by degradation of ferritin. Autophagy 2016;12(8):1425–8 doi 10.1080/15548627.2016.1187366. [DOI] [PMC free article] [PubMed] [Google Scholar]
- 35.Hayes JD, Dinkova-Kostova AT, Tew KD. Oxidative Stress in Cancer. Cancer Cell 2020;38(2):167–97 doi 10.1016/j.ccell.2020.06.001. [DOI] [PMC free article] [PubMed] [Google Scholar]
- 36.Marcar L, Bardhan K, Gheorghiu L, Dinkelborg P, Pfaffle H, Liu Q, et al. Acquired Resistance of EGFR-Mutated Lung Cancer to Tyrosine Kinase Inhibitor Treatment Promotes PARP Inhibitor Sensitivity. Cell Rep 2019;27(12):3422–32 e4 doi 10.1016/j.celrep.2019.05.058. [DOI] [PMC free article] [PubMed] [Google Scholar]
- 37.Litton JK, Scoggins ME, Hess KR, Adrada BE, Murthy RK, Damodaran S, et al. Neoadjuvant Talazoparib for Patients With Operable Breast Cancer With a Germline BRCA Pathogenic Variant. J Clin Oncol 2020;38(5):388–94 doi 10.1200/JCO.19.01304. [DOI] [PMC free article] [PubMed] [Google Scholar]
- 38.Tomida J, Takata KI, Bhetawal S, Person MD, Chao HP, Tang DG, et al. FAM35A associates with REV7 and modulates DNA damage responses of normal and BRCA1-defective cells. EMBO J 2018;37(12) doi 10.15252/embj.201899543. [DOI] [PMC free article] [PubMed] [Google Scholar]
- 39.Powell RT, Redwood A, Liu X, Guo L, Cai S, Zhou X, et al. Pharmacologic profiling of patient-derived xenograft models of primary treatment-naive triple-negative breast cancer. Sci Rep 2020;10(1):17899 doi 10.1038/s41598-020-74882-4. [DOI] [PMC free article] [PubMed] [Google Scholar]
- 40.Manke IA, Lowery DM, Nguyen A, Yaffe MB. BRCT repeats as phosphopeptide-binding modules involved in protein targeting. Science 2003;302(5645):636–9 doi 10.1126/science.1088877. [DOI] [PubMed] [Google Scholar]
- 41.Yu X, Chini CC, He M, Mer G, Chen J. The BRCT domain is a phospho-protein binding domain. Science 2003;302(5645):639–42 doi 10.1126/science.1088753. [DOI] [PubMed] [Google Scholar]
- 42.Gupte R, Liu Z, Kraus WL. PARPs and ADP-ribosylation: recent advances linking molecular functions to biological outcomes. Genes Dev 2017;31(2):101–26 doi 10.1101/gad.291518.116. [DOI] [PMC free article] [PubMed] [Google Scholar]
- 43.Seibt TM, Proneth B, Conrad M. Role of GPX4 in ferroptosis and its pharmacological implication. Free Radic Biol Med 2019;133:144–52 doi 10.1016/j.freeradbiomed.2018.09.014. [DOI] [PubMed] [Google Scholar]
- 44.Linger RJ, Kruk PA. BRCA1 16 years later: risk-associated BRCA1 mutations and their functional implications. FEBS J 2010;277(15):3086–96 doi 10.1111/j.1742-4658.2010.07735.x. [DOI] [PubMed] [Google Scholar]
- 45.Liu X, Nie L, Zhang Y, Yan Y, Wang C, Colic M, et al. Actin cytoskeleton vulnerability to disulfide stress mediates disulfidptosis. Nat Cell Biol 2023;25(3):404–14 doi 10.1038/s41556-023-01091-2. [DOI] [PMC free article] [PubMed] [Google Scholar]
- 46.Feng L, Li N, Li Y, Wang J, Gao M, Wang W, et al. Cell cycle-dependent inhibition of 53BP1 signaling by BRCA1. Cell Discov 2015;1:15019 doi 10.1038/celldisc.2015.19. [DOI] [PMC free article] [PubMed] [Google Scholar]
- 47.Lee H, Zandkarimi F, Zhang Y, Meena JK, Kim J, Zhuang L, et al. Energy-stress-mediated AMPK activation inhibits ferroptosis. Nat Cell Biol 2020;22(2):225–34 doi 10.1038/s41556-020-0461-8. [DOI] [PMC free article] [PubMed] [Google Scholar]
- 48.Wu S, Mao C, Kondiparthi L, Poyurovsky MV, Olszewski K, Gan B. A ferroptosis defense mechanism mediated by glycerol-3-phosphate dehydrogenase 2 in mitochondria. Proc Natl Acad Sci U S A 2022;119(26):e2121987119 doi 10.1073/pnas.2121987119. [DOI] [PMC free article] [PubMed] [Google Scholar]
- 49.Zhang Y, Shi J, Liu X, Feng L, Gong Z, Koppula P, et al. BAP1 links metabolic regulation of ferroptosis to tumour suppression. Nat Cell Biol 2018;20(10):1181–92 doi 10.1038/s41556-018-0178-0. [DOI] [PMC free article] [PubMed] [Google Scholar]
- 50.Koppula P, Lei G, Zhang Y, Yan Y, Mao C, Kondiparthi L, et al. A targetable CoQ-FSP1 axis drives ferroptosis- and radiation-resistance in KEAP1 inactive lung cancers. Nature communications 2022;13(1):2206 doi 10.1038/s41467-022-29905-1. [DOI] [PMC free article] [PubMed] [Google Scholar]
- 51.Zhang Y, Swanda RV, Nie L, Liu X, Wang C, Lee H, et al. mTORC1 couples cyst(e)ine availability with GPX4 protein synthesis and ferroptosis regulation. Nat Commun 2021;12(1):1589 doi 10.1038/s41467-021-21841-w. [DOI] [PMC free article] [PubMed] [Google Scholar]
- 52.Koppula P, Olszewski K, Zhang Y, Kondiparthi L, Liu X, Lei G, et al. KEAP1 deficiency drives glucose dependency and sensitizes lung cancer cells and tumors to GLUT inhibition. iScience 2021;24(6):102649 doi 10.1016/j.isci.2021.102649. [DOI] [PMC free article] [PubMed] [Google Scholar]
- 53.Liu X, Gan B. lncRNA NBR2 modulates cancer cell sensitivity to phenformin through GLUT1. Cell Cycle 2016;15(24):3471–81 doi 10.1080/15384101.2016.1249545. [DOI] [PMC free article] [PubMed] [Google Scholar]
- 54.Koppula P, Zhang Y, Shi J, Li W, Gan B. The glutamate/cystine antiporter SLC7A11/xCT enhances cancer cell dependency on glucose by exporting glutamate. J Biol Chem 2017;292(34):14240–9 doi 10.1074/jbc.M117.798405. [DOI] [PMC free article] [PubMed] [Google Scholar]
- 55.Xiao ZD, Han L, Lee H, Zhuang L, Zhang Y, Baddour J, et al. Energy stress-induced lncRNA FILNC1 represses c-Myc-mediated energy metabolism and inhibits renal tumor development. Nat Commun 2017;8(1):783 doi 10.1038/s41467-017-00902-z. [DOI] [PMC free article] [PubMed] [Google Scholar]
- 56.Lei G, Zhang Y, Koppula P, Liu X, Zhang J, Lin SH, et al. The role of ferroptosis in ionizing radiation-induced cell death and tumor suppression. Cell Res 2020;30(2):146–62 doi 10.1038/s41422-019-0263-3. [DOI] [PMC free article] [PubMed] [Google Scholar]
- 57.Lei G, Zhang Y, Hong T, Zhang X, Liu X, Mao C, et al. Ferroptosis as a mechanism to mediate p53 function in tumor radiosensitivity. Oncogene 2021;40(20):3533–47 doi 10.1038/s41388-021-01790-w. [DOI] [PMC free article] [PubMed] [Google Scholar]
- 58.Prus E, Fibach E. Flow cytometry measurement of the labile iron pool in human hematopoietic cells. Cytometry A 2008;73(1):22–7 doi 10.1002/cyto.a.20491. [DOI] [PubMed] [Google Scholar]
- 59.Yan Y, Teng H, Hang Q, Kondiparthi L, Lei G, Horbath A, et al. SLC7A11 expression level dictates differential responses to oxidative stress in cancer cells. Nature communications 2023;14(1):3673 doi 10.1038/s41467-023-39401-9. [DOI] [PMC free article] [PubMed] [Google Scholar]
- 60.Lee H, Dai F, Zhuang L, Xiao ZD, Kim J, Zhang Y, et al. BAF180 regulates cellular senescence and hematopoietic stem cell homeostasis through p21. Oncotarget 2016;7(15):19134–46 doi 10.18632/oncotarget.8102. [DOI] [PMC free article] [PubMed] [Google Scholar]
- 61.Zhang Y, Shi J, Liu X, Xiao Z, Lei G, Lee H, et al. H2A Monoubiquitination Links Glucose Availability to Epigenetic Regulation of the Endoplasmic Reticulum Stress Response and Cancer Cell Death. Cancer Res 2020;80(11):2243–56 doi 10.1158/0008-5472.CAN-19-3580. [DOI] [PMC free article] [PubMed] [Google Scholar]
- 62.Lin A, Yao J, Zhuang L, Wang D, Han J, Lam EW, et al. The FoxO-BNIP3 axis exerts a unique regulation of mTORC1 and cell survival under energy stress. Oncogene 2014;33(24):3183–94 doi 10.1038/onc.2013.273. [DOI] [PMC free article] [PubMed] [Google Scholar]
- 63.Gan B, Melkoumian ZK, Wu X, Guan KL, Guan JL. Identification of FIP200 interaction with the TSC1-TSC2 complex and its role in regulation of cell size control. J Cell Biol 2005;170(3):379–89. [DOI] [PMC free article] [PubMed] [Google Scholar]
- 64.Gan B, Yoo Y, Guan JL. Association of focal adhesion kinase with tuberous sclerosis complex 2 in the regulation of s6 kinase activation and cell growth. J Biol Chem 2006;281(49):37321–9. [DOI] [PubMed] [Google Scholar]
- 65.Gan B, Lim C, Chu G, Hua S, Ding Z, Collins M, et al. FoxOs enforce a progression checkpoint to constrain mTORC1-activated renal tumorigenesis. Cancer Cell 2010;18(5):472–84 doi S1535-6108(10)00421-6 [pii] 10.1016/j.ccr.2010.10.019. [DOI] [PMC free article] [PubMed] [Google Scholar]
- 66.Lin A, Piao HL, Zhuang L, Sarbassov dos D, Ma L, Gan B. FoxO transcription factors promote AKT Ser473 phosphorylation and renal tumor growth in response to pharmacologic inhibition of the PI3K-AKT pathway. Cancer Res 2014;74(6):1682–93 doi 10.1158/0008-5472.CAN-13-1729. [DOI] [PMC free article] [PubMed] [Google Scholar]
- 67.Echeverria GV, Ge Z, Seth S, Zhang X, Jeter-Jones S, Zhou X, et al. Resistance to neoadjuvant chemotherapy in triple-negative breast cancer mediated by a reversible drug-tolerant state. Sci Transl Med 2019;11(488) doi 10.1126/scitranslmed.aav0936. [DOI] [PMC free article] [PubMed] [Google Scholar]
- 68.Liedtke C, Mazouni C, Hess KR, Andre F, Tordai A, Mejia JA, et al. Response to neoadjuvant therapy and long-term survival in patients with triple-negative breast cancer. J Clin Oncol 2008;26(8):1275–81 doi 10.1200/JCO.2007.14.4147. [DOI] [PubMed] [Google Scholar]
- 69.Gan B, Peng X, Nagy T, Alcaraz A, Gu H, Guan JL. Role of FIP200 in cardiac and liver development and its regulation of TNFalpha and TSC-mTOR signaling pathways. J Cell Biol 2006;175(1):121–33 doi jcb.200604129 [pii] 10.1083/jcb.200604129. [DOI] [PMC free article] [PubMed] [Google Scholar]
- 70.Liu X, Olszewski K, Zhang Y, Lim EW, Shi J, Zhang X, et al. Cystine transporter regulation of pentose phosphate pathway dependency and disulfide stress exposes a targetable metabolic vulnerability in cancer. Nat Cell Biol 2020;22(4):476–86 doi 10.1038/s41556-020-0496-x. [DOI] [PMC free article] [PubMed] [Google Scholar]
- 71.Fedchenko N, Reifenrath J. Different approaches for interpretation and reporting of immunohistochemistry analysis results in the bone tissue - a review. Diagn Pathol 2014;9:221 doi 10.1186/s13000-014-0221-9. [DOI] [PMC free article] [PubMed] [Google Scholar]
Associated Data
This section collects any data citations, data availability statements, or supplementary materials included in this article.