

Abstract
This paper examines the existence of spectral resonance in the Fitzhugh–Nagumo (FHN) system driven by periodical signal and unbounded noise having Gaussian distribution. It is newly revealed that if the inter-spike-interval (ISI) distribution is accumulated on a single cluster, there exists a dual relationship between stochastic resonance and spectral resonance determined by commonly used metric normalized standard deviation of ISI. Furthermore, the ISI distribution is also concentrated on more than one cluster depending on different driving signal frequency. Consequently, the apparent regular spiking behavior is observed to occur at specified driving signal frequencies which result in a local minimum in entropy function indicating spectral resonance. Therefore it is proposed that occurrence of spectral resonance strongly depends on the shape of ISI distribution tuned by the stochastic and deterministic driving signal parameters and conventional metrics may not indicate entire resonance behavior. Correspondingly, the entropy function is utilized in this paper as an alternative metric to enable the detection of the spectral resonance occurrence. The ISI distribution obtained from the FHN system is investigated to relate the real electromyography (EMG) measurements under different conditions such as myokymia and neuromyotonia. It is seen that ISI distribution observed from myokymic EMG exhibits notably close behavior as in the case of spectral resonance generated by FHN whereas a wider distribution is monitored in the case of neuromyotonia. It is contributed that the modeling and parameterization based on ISI distribution can be potentially used to identify different neural activities.
Keywords: Fitzhugh–Nagumo neuron system, Spectral resonance, Stochastic resonance, Myokymia
Introduction
Stochastic resonance can be explained as the physical phenomenon where the output of a nonlinear dynamical system driven by noise and periodic signal begins to exhibit regular behavior within a finite interval of noise intensity. Once the occurrence of stochastic resonance is introduced by (Benzi et al. 1982), there have been various studies analyzing the existence of stochastic resonance in different physical or biological systems. In computational neuroscience, the neural activity characterized by the membrane potential is analytically expressed by neuron models such as Hodgkin–Huxley, Fitzhugh–Nagumo, Morris Lecar and Hindmarsh-Rose (Palmeri et al. 2017). Although Hodgkin–Huxley neuron model has been popular in the literature for describing the propagation of neural pulses, the Fitzhugh–Nagumo neuron model emerges as the simplified and reduced form of the Hodgkin–Huxley and is given as a proper neuron model (Phillipson and Schuster 2005). The analytical relation and correspondence between these two neuron models is discussed by (Postnikov and Titkova 2016). Consequently, the Fitzhugh–Nagumo system is accepted as one of the excitable systems characterized by deterministic and stochastic perturbation parameters. In (Kai-Leung et al. 2010; Yao and Ma 2018; Yao et al. 2018) the occurrence of stochastic resonance in the Fitzhugh Nagumo system is analyzed under bounded noise generated by the Wiener process. The analysis of resonance occurrence in coupled FHN model is reported to be observed by (Li et al. 2018) at more than one noise level which is described as stochastic multi-resonance. Rather than analyzing single neuron behavior, coupling between coupled neurons in the FHN system is investigated by (Masoliver and Masoller 2018). Alternatively, the effect of inducing non-Gaussian noise on spike regularity is discussed by (Wang et al. 2019) in the analysis of coupled FHN model driven by noise having stable distribution. The individual effect of such a non-Gaussian noise model is also observed to yield resonance behavior known as coherence resonance (Wang et al. 2021) and characterized by inter-spike interval distribution obtained from neural electrical activity. The role of the periodic force in FHN system is discussed by (Yao and Ma 2022). In another recent study by (Yu et al. 2022) the FHN is driven by chaotic signal rather than periodic forcing and noise, and the term chaotic resonance is introduced in the subthreshold signal transmission problem. Recently, stochastic resonance based weak signal detection is discussed including interactions between the neuron and the astrocyte (Palabas et al. 2023). Moreover, influence of higher-order interactions on neuronal synchronization is studied by indicating its role in the emergence of synchronization in complex networks (Parastesh et al. 2022). In a more general perspective, dynamical behavior of higher order networks is studied by (Majhi et al. 2022).
Although remarkable studies exist to point out the stochastic resonance behavior concerning noise induction, the dependence on the period of the sinusoidal excitation has been poorly investigated. Within this context, the relation between entropy and input signal frequency at a certain noise level is discussed (Reinoso et al. 2016). The term spectral resonance is described and investigated in a bistable system to increase the weak signal detection performance (Lin et al. 2019).
It should be noted that resonance behavior is mainly characterized by the distribution of the inter-spike interval (ISI). The ISI information is composed of intervals between adjacent peak points of spikes. The precise detection of the spikes and their peak points makes it crucial for accurately identifying the distribution of ISI. For this purpose, wavelet-based methods are suggested for spike detection in neural activity (Brychta et al. 2007) (Wiltschko et al. 2008), the Teager–Kaiser energy operator is currently used for determining the peak point of a particular spike and takes place in EMG signal analysis (Solnik et al. 2010; Kaur et al. 2018; Selvan et al. 2018; Tigrini et al. 2020).
The spiking behavior of EMG signals can manifest various characteristics under different conditions (Daube and Rubin 2009). EMG signals recorded during neurological conditions like myokymic discharges (Whaley and Rubin 2010) and complex repetitive discharges (Posa et al. 2020) display regular spike patterns. Therefore, they are amenable to further analysis to investigate the possibility of achieving resonance behaviour from the ISI distribution.
Differing from the previous studies, two contributions exist in this paper. Firstly, the existence of spectral resonance is quantified by variation of entropy rather than normalized standard deviation, and consequently, the apparent local minimums in entropy function observed at various input frequencies indicates spectral multi-resonance. As the second contribution, the dual relationship between stochastic resonance and spectral resonance is identified in terms of normalized standard deviation used as a common metric characterizing stochastic resonance. This is achieved by tuning sinusoidal input frequency and noise intensity as the deterministic and stochastic driving parameters, respectively. The ISI distribution taken from analytical model corresponding to spectral resonance is linked with ISI distribution taken from EMG signal containing myokymic discharges while broader and nearly uniform distribution is observed within the specified range in the case of neuromyotonia. Hence, lower entropy value is attained in case myokymia compared with that of neuromyotonia. The sharp difference between distributions of ISI data related to different neurological conditions gives evidence for the clinical benefit of this modelling in neurological disorders.
Method
Neuron model
The Fitzhugh–Nagumo neuron model under periodic and stochastic excitation is analytically described in (1) (Kai et al. 2010)
| 1 |
where corresponds to the membrane voltage and the driving sinusoidal signal has amplitude and frequency Unbounded noise stimulating the neuron system is modeled by standard Gaussian distribution having zero mean and unit variance. The intensity of the noise is tuned by standard deviation parameter . The FHN system is numerically simulated by fourth order Runge–Kutta method having random initial values taken from Gaussian distribution zero-mean and having standard deviation . The sampling frequency and simulated signal length are given as and samples, respectively. The neuron model parameters are adjusted as . Noting that the main objective is to investigate the possible existence of spectral resonance in terms , the parameters and need to be assigned from subthreshold region, i.e., no spiking neuron behavior is observed in absence of noise excitation. The range of these parameters to keep the neuronal electrical activity in the subthreshold region is shown in Fig. 1 over a wideband spectrum. By stimulating the neuron system with a sinusoidal signal of varying frequency and a noise signal of fixed intensity, the inter-spike interval information is obtained as a function of . It is significant to adjust relatively near to the boundary region so that even small noise intensity becomes sufficient to provide spiking behavior and the effect of input frequency on the resonance behavior can be observed more apparently. Holding the parameter pair consistent within the specified range as shown in Fig. 1, the amplitude of the external sinusoidal stimulus is assigned to be and the frequency lies between in this study.
Fig. 1.
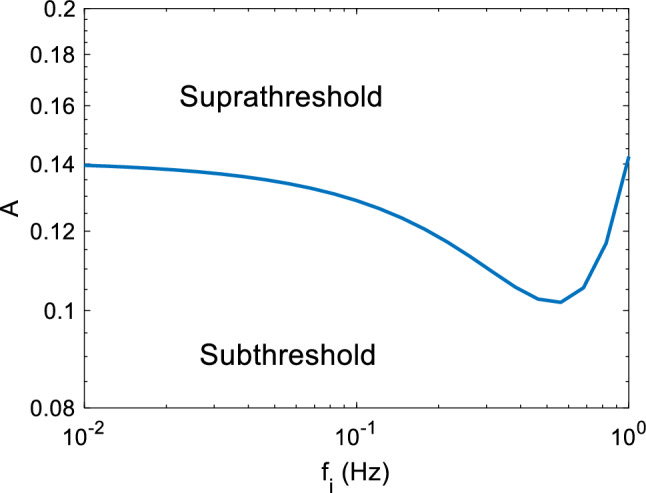
Determined subthreshold and suprathreshold region in FHN model with respect to and pairs. The parameters can be chosen in subthreshold region according to the determined boundary region in order to achieve spectral resonance apparently in presence of noise injection with minimum but sufficient intensity
Spike detection
In spike detection problem, the main concern is to detect the actual peak point of a particular spike which can be executed by indicating instantaneous energy correctly. The Teager–Kaiser Energy operator (TKEO) emerges as a proper nonlinear signal processing tool to identify the peak points within an observed signal, without requiring any prior information. In discrete time, the extended TKEO using the observed signal samples is analytically defined as (Kaur et al. 2018)
| 2 |
where the delay parameter tunes the temporal resolution of the energy operator. The function gives the evolution of instantaneous energy as a function of time in accordance to the reference points located at samples before and after. Although it is generally taken as in samples in the literature, the determination of optimal delay value is still one of the open problems and needs to be solved. The selection of delay parameter and threshold is discussed by (Boudraa and Salzenstein 2018) in detail. The divergence from a point as a function of can be expressed by the sum and and it displays the sensitivity of the magnitude variation with respect to positive and negative time delay as characterized in (3),
| 3 |
Note that rather than evaluating the slope which is dramatically affected by small ripples, the function directly reflects the vertical distance between the data points apart from samples. The variation of as a function of is shown in Fig. 2. According to the illustration, the argument corresponding to the first local maximum of potentially arises due to existence of spike and can be chosen as a proper value to describe the approximate spike width.
Fig. 2.

Determination of optimal time delay from for TKEO based spike detection. The time delay corresponding first local maximum yields an information about optimum value to determine TKEO result more accurately
Once the optimal delay is found, the TKEO can be evaluated as in (4)
| 4 |
The locations of the spikes are determined by assessment of the points above the threshold as given in (5)
| 5 |
where the parameters and denote the mean and the standard deviation of , respectively. The constant integer can be taken as (Solnik et al. 2010) and may be sufficient to detect the peak point in Fitzhugh–Nagumo neuron system, it is taken as (Tigrini et al. 2020) in the analysis of real EMG signals since they contain higher fluctuation to be ignored in spike determination. A sample portion of the signal taken from the FHN model and TKEO result are shown in Fig. 3 below.
Fig. 3.
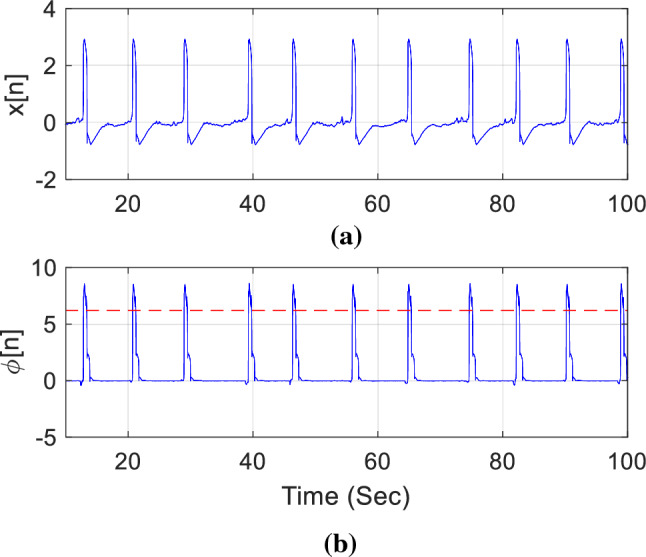
a Membrane potential from the FHN system, b TKEO function together with threshold (dashed red line). (Color figure online)
Considering the sampling duration , the exact time instant of the spike within the region lying above the threshold can be determined analytically in (6) by finding the local maximum within the sliding window having length points
| 6 |
where is the two-state Heaviside step function. The overall observation time interval lies between . A reasonable choice for the window length is taken in this study as since it roughly corresponds to an average duration of a spike width. The peak point of a particular spike determined by TKEO and the corresponding optimal delay values is illustrated in Fig. 4.
Fig. 4.

The peak point determined by TKEO process after determining optimum time delay
The next step after finding the collection of peak points is the generation inter-spike interval described as the interval between adjacent peaks of spikes and analytically expressed in (6)
| 7 |
where is the location of the spike.
Resonance analysis
Resonance behavior is generally characterized by periodically occurring spikes. The utilizable metrics acting as parameters to measure the periodicity is recently explained by (Pisarchik and Hramov 2023) comprehensively. Although an exact periodic behavior may not be achieved in the presence of random disturbance in practice, when the spike train becomes nearly periodic, the deviation of the interval between consequent spikes decreases and the notable decrease in the ISI fluctuation reflects the existence of resonance. The variation of this fluctuation is conventionally formulated by the normalized standard deviation of ISI given in (8) (Masoliver and Masoller 2018; Bogatenko and Semenov 2018; Wang et al. 2021)
| 8 |
where is the ISI data given in (7), the term denotes averaging and stands for evaluating standard deviation. Condensation of the ISI distribution corresponds to increased regular behavior around the center of the distribution. When the distribution is concentrated on a narrower region, the fluctuation around the center of cluster decreases and correspondingly the standard deviation also decreases. However, this approach is valid only when the ISI distribution is composed by a single cluster and this requirement cannot be guaranteed under various deterministic and random stimulations. Therefore, the entropy function where denotes the probability obtained from ISI distribution, can be considered as a proper metric to quantify the existence of resonance behavior especially when the distribution has multiple clusters rather than a single piece. The variation of entropy function and normalized standard deviation as a function of input frequency are respectively shown in Fig. 5a and b for noise intensities as a result of ensemble averaging of realizations. The bin width in histogram of ISI is taken as sec and the maximum value of histogram interval is specified as 80 s. When the noise intensity increases, the local minimum points in entropy variation are slightly sensitive to disappear. Since the resonance behavior depending on is apparently reflected by minimum noise induction, the critical frequency points giving local minimum in entropy curve labeled by , and is determined for the selection of . Similarly, the variation of normalized deviation is investigated under the same frequency interval and the lowest value is observed at a frequency .
Fig. 5.

a Variation of entropy in terms of ; the local minimums are located at and b Variation of normalized deviation in terms of ,
Behavior of the neuron system corresponding to these specified frequencies is illustrated by plotting within a definite time interval and corresponding ISI distribution in Fig. 6. It is seen that when the input frequency yielding spectral resonance in terms of entropy function increases, the ISI distribution is composed by increased number of clusters as shown in Fig. 6b, d and f, respectively. Since the normalized standard deviation evaluates a single resultant standard deviation from the distribution having multiple clusters, one cannot observe a local minimum whereas entropy decreases when the distributions are collected within a smaller interval. One can conclude that, entropy measure has a potential to give information about spectral resonance frequencies more accurately when the ISI distribution is concentrated on more than one frequency.
Fig. 6.

The membrane potential and the corresponding ISI distribution with respect to different input frequencies; a and b for c and d for e and f for, . As the frequency of periodic exciting signal increases, ISI distribution becomes to widen and include multi-clustered structure
The membrane potential and the ISI distribution, corresponding to the minimum of are shown in Fig. 7a and b, respectively. It is seen that when the ISI distribution is concentrated on a single cluster concerning input frequency, the overall width of the distribution can achieve its minimum value whereas the local minimums of the entropy curve occur when the distribution is condensed within a narrower region rather than a single cluster. Therefore it may be concluded that normalized standard deviation can be considered a proper resonance metric if the resonance behavior is investigated as long as the ISI distributions have a single cluster.
Fig. 7.

a The membrane potential (, ), b ISI distribution concentrated on single cluster
Dual relation between stochastic and spectral resonance
In this section, the relation between spectral and stochastic resonance is characterized by the normalized deviation where the resonance behavior can be observed when the ISI distribution is collected around a single cluster. The neuron system is respectively driven by the frequencies , and corresponding to the minimum values of shown in Fig. 5b. In order to investigate the stochastic resonance, the input frequency is kept constant and the neuron system is driven by noise under various noise intensities. It is seen in Fig. 8 that the noise intensities yielding stochastic resonance are the equivalent values in characterization of spectral resonance when the noise intensities are fixed as shown in Fig. 5b. This result consistently indicates the existence of dual relation between spectral and stochastic resonance.
Fig. 8.

Illustration of stochastic resonance behavior in terms of as a function of noise intensity . When the resonance location is investigated, it is seen to be one-to-one correspondence between noise intensities and specified frequencies shown in Fig. 5b
Analysis of ISI in real EMG
The myokymic discharge is a distinct electrophysiological activity characterized by the repetitive spiking behavior in a short time interval followed by a longer period of silence state continuing almost periodically while the spiking behaviour in case of neuromyotonia is observed in a random manner and there is no definite regular behavior. The raw EMG signals in presence of myokymia and neuromyotonia sampled at a rate of and having artifact free duration seconds and seconds are analyzed to extract the intrinsic information in terms of ISI pattern where the electrical activities of these myokymic and neuromyotonic EMG signals in time domain are shown in Fig. 9a and c together with determined peak points, respectively. The corresponding ISI distributions are illustrated in Fig. 9b and d.
Fig. 9.

a The EMG signal in case of myokymia, b ISI distribution in myokymic EMG c the EMG signal in case of neuromyotonia d ISI distribution in neuromyotonic EMG
Since the parameters such as bin widths while generating the histograms of EMG signals, sampling frequency, and equivalently the maximum value of the histogram ranges are not identical compared with the analytical model, evaluating actual entropy values for real signals may be misleading. Instead, the potential correspondence and similarity are illustrated in terms of ISI distributions. Although it may be speculative to match directly the distributions, one can interpret as there is a remarkable similarity between the ISI distributions of myokymic EMG and the analytical model exposed in case spectral resonance shown in Fig. 6b. The clustered ISI structure located on two separate centers is apparent in myokymic EMG signal due to the existence of regular and repetitive behavior whereas the ISI distribution is relatively non-informative for neuromyotonic EMG. Correspondingly, the entropy value obtained from the ISI distribution of myokymic data becomes lower than that of neuromyotonia. The variation of the entropy is considered to carry a stronger potential in order to bring an analytical approximation to different neurological conditions and needs further analysis.
Conclusion
This paper addresses the existence of spectral resonance in the Fitzhugh–Nagumo neuron system characterized by the distribution of ISI. The variation of the measures given as entropy function obtained from ISI distribution and the conventional normalized standard deviation are utilized to illustrate the resonance phenomenon as a function of driving sinusoidal signal frequency. It is observed that when ISI distribution is concentrated on a single cluster at a certain excitation frequency and noise intensity, the normalized standard deviation metric reaches its minimum as a function of frequency indicating the spectral resonance. Interestingly, the equivalent behavior is observed as a function of driving noise intensity when the periodic signal frequency is chosen at the value yielding spectral resonance. It gives evidence that there exists a dual relationship between stochastic and spectral resonance if the ISI distribution is centralized on a single cluster. This finding constitutes the first contribution of this study.
Moreover, when the driving signal frequency increases, the ISI distribution tends to be clustered at more than one center. The regular spiking behavior observed in different driving signal frequencies is considered as the reason for this clustering and correspondingly the local minimum values in the entropy function depending on the distribution of ISI indicate the existence of the multi-spectral resonance, as the second contribution in this paper. However, it should be noted that an increment on the driving noise intensity slightly weakens the impact of the frequency of the periodic forcing signal. Therefore, in order the entropy based spectral resonance behaviour distribution to be apparent, the driving noise intensity of the subthreshold neuron system should be selected as possible as low but sufficient to enable the spike generation.
At the last part, the interplay between ISI distributions obtained from a Fitzhugh–Nagumo system excited by periodic signals of various frequencies and the real EMG signals taken in case neuromyotonia and myokymic discharges are investigated with the aim of identifying possible correlations. It is observed that while ISI distribution in the case of neuromyotonia is nearly uniform and does not extract an information, the ISI distribution pattern of myokymic discharge exhibit relatively close behavior in case of spectral resonance characterized by entropy function. As the third and last contribution, it is noted that the deterministic and stochastic driving parameters of the numerical model and subsequently its ISI distribution can be tuned and potentially used to characterize the real EMG data under different neurological conditions. Specifying the accurate metric and developing a mechanism for properly tuning the periodic and stochastic excitation parameters to detect the exact correspondence to ISI obtained from real EMG constitutes the subject of the further studies.
Data availability
The sample data are available upon request.
Code availability
Computer source codes are available upon request.
Declarations
Conflict of interest
The authors declare that they have no conflict of interest.
Footnotes
Publisher's Note
Springer Nature remains neutral with regard to jurisdictional claims in published maps and institutional affiliations.
References
- Benzi R, Parisi G, Sutera A, Vulpiani A (1982) Stochastic resonance in climatic change. Tellus 34(1):10–16. 10.3402/tellusa.v34i1.10782 10.3402/tellusa.v34i1.10782 [DOI] [Google Scholar]
- Bogatenko TR, Semenov VV (2018) Coherence resonance in an excitable potential well. Phys Lett A 382(37):2645–2649. 10.1016/j.physleta.2018.07.023 10.1016/j.physleta.2018.07.023 [DOI] [Google Scholar]
- Boudraa AO, Salzenstein F (2018) Teager–Kaiser energy methods for signal and image analysis: a review. Digit Signal Process 78:338–375. 10.1016/j.dsp.2018.03.010 10.1016/j.dsp.2018.03.010 [DOI] [Google Scholar]
- Brychta RJ, Tuntrakool S, Appalsamy M, Keller NR, Robertson D, Shiavi RG, Diedrich A (2007) Wavelet methods for spike detection in mouse renal sympathetic nerve activity. IEEE Trans Biomed Eng 54(1):82–93. 10.1109/TBME.2006.883830 10.1109/TBME.2006.883830 [DOI] [PMC free article] [PubMed] [Google Scholar]
- Daube JR, Rubin DI (2009) Needle electromyography. Muscle Nerve 39(2):244–270. 10.1002/mus.21180 10.1002/mus.21180 [DOI] [PubMed] [Google Scholar]
- Kai-Leung Y, You-Ming L, Yan X (2010) Stochastic resonance in the FitzHugh–Nagumo system driven by bounded noise. Chin Phys B 19(1):010503. 10.1088/1674-1056/19/1/010503 10.1088/1674-1056/19/1/010503 [DOI] [Google Scholar]
- Kaur A, Agarwal R, Kumar A (2018) Adaptive threshold method for peak detection of surface electromyography signal from around shoulder muscles. J Appl Stat 45(4):714–726. 10.1080/02664763.2017.1293624 10.1080/02664763.2017.1293624 [DOI] [Google Scholar]
- Li H, Sun X, Xiao J (2018) Stochastic multiresonance in coupled excitable FHN neurons. Chaos 28(4):043113. 10.1063/1.4997679 10.1063/1.4997679 [DOI] [PubMed] [Google Scholar]
- Lin R, Ng TY, Fan Z (2019) New type of spectral nonlinear resonance enhances identification of weak signals. Sci Rep 9:14125. 10.1038/s41598-019-50767-z 10.1038/s41598-019-50767-z [DOI] [PMC free article] [PubMed] [Google Scholar]
- Majhi S, Perc M, Ghosh D (2022) Dynamics on higher-order networks: a review. J R Soc Interface 19:20220043. 10.1098/rsif.2022.0043 10.1098/rsif.2022.0043 [DOI] [PMC free article] [PubMed] [Google Scholar]
- Masoliver M, Masoller C (2018) Sub-threshold signal encoding in coupled FitzHugh–Nagumo neurons. Sci Rep 8:8276. 10.1038/s41598-018-26618-8 10.1038/s41598-018-26618-8 [DOI] [PMC free article] [PubMed] [Google Scholar]
- Palabas T, Torres JJ, Perc M, Uzuntarla M (2023) Double stochastic resonance in neuronal dynamics due to astrocytes. Chaos Soliton Fract 168:113140. 10.1016/j.chaos.2023.113140 10.1016/j.chaos.2023.113140 [DOI] [Google Scholar]
- Palmeri I, Monteiro LHA, Miranda MD (2017) The Neuronal signal and its models. In: Moustafa AA (ed) Computational models of brain and behavior, 1st edn. John Wiley & Sons, pp 519–530 [Google Scholar]
- Parastesh F, Mehrabbeik M, Rajagopal K, Jafari S, Perc M (2022) Synchronization in Hindmarsh-Rose neurons subject to higher-order interactions. Chaos 32:013125. 10.1063/5.0079834 10.1063/5.0079834 [DOI] [PubMed] [Google Scholar]
- Phillipson PE, Schuster P (2005) A comparative study of the Hodgkin–Huxley and FitzHugh–Nagumo models of neuron pulse propagation. Int J Bifurcat Chaos 15(12):3851–3866. 10.1142/S0218127405014349 10.1142/S0218127405014349 [DOI] [Google Scholar]
- Pisarchik AN, Hramov AE (2023) Coherence resonance in neural networks: theory and experiments. Phys Rep 1000:1–57. 10.1016/j.physrep.2022.11.004 10.1016/j.physrep.2022.11.004 [DOI] [Google Scholar]
- Posa A, Niśkiewicz I, Emmer A, Hanisch F, Kornhuber ME (2020) Complex repetitive discharges: a sign of motor axonal reinnervation? Brain Sci 10(6):349. 10.3390/brainsci10060349 10.3390/brainsci10060349 [DOI] [PMC free article] [PubMed] [Google Scholar]
- Postnikov EB, Titkova OV (2016) A correspondence between the models of Hodgkin–Huxley and FitzHugh–Nagumo revisited. Eur Phys J plus 131:411. 10.1140/epjp/i2016-16411-1 10.1140/epjp/i2016-16411-1 [DOI] [Google Scholar]
- Reinoso JA, Torrent MC, Masoller C (2016) Emergence of spike correlations in periodically forced excitable systems. Phys Rev E 94(3):032218. 10.1103/PhysRevE.94.032218 10.1103/PhysRevE.94.032218 [DOI] [PubMed] [Google Scholar]
- Selvan SE, Allexandre D, Amato U, Yue GH (2018) Unsupervised stochastic strategies for robust detection of muscle activation onsets in surface electromyogram. IEEE Trans Neural Syst Rehabil Eng 26(6):1279–1291. 10.1109/TNSRE.2018.2833742 10.1109/TNSRE.2018.2833742 [DOI] [PMC free article] [PubMed] [Google Scholar]
- Solnik S, Rider P, Steinweg K, DeVita P, Hortobágyi T (2010) Teager–Kaiser energy operator signal conditioning improves EMG onset detection. Eur J Appl Physiol 110:489–498. 10.1007/s00421-010-1521-8 10.1007/s00421-010-1521-8 [DOI] [PMC free article] [PubMed] [Google Scholar]
- Tigrini A, Mengarelli A, Cardarelli S, Fioretti S, Verdini F (2020) Improving EMG signal change point detection for low SNR by using extended Teager–Kaiser energy operator. IEEE Trans Med Robot Bionics 2(4):661–669. 10.1109/TMRB.2020.3014517 10.1109/TMRB.2020.3014517 [DOI] [Google Scholar]
- Wang Z, Xu Y, Li Y, Kurths J (2019) α-stable noise-induced coherence on a spatially extended Fitzhugh–Nagumo system. J Stat Mech 2019(10):103501. 10.1088/1742-5468/ab363d 10.1088/1742-5468/ab363d [DOI] [Google Scholar]
- Wang Z, Xu Y, Li Y, Kurths J (2021) The probability density function of interspike intervals in an FHN model with α-stable noise. Eur Phys J plus 136:299. 10.1140/epjp/s13360-021-01245-x 10.1140/epjp/s13360-021-01245-x [DOI] [Google Scholar]
- Whaley NR, Rubin DI (2010) Myokymic discharges in amyotrophic lateral sclerosis (ALS): a rare electrophysiologic finding? Muscle Nerve 41(1):107–109. 10.1002/mus.21540 10.1002/mus.21540 [DOI] [PubMed] [Google Scholar]
- Wiltschko AB, Gage GJ, Berke JD (2008) Wavelet filtering before spike detection preserves waveform shape and enhances single-unit discrimination. J Neurosci Methods 173(1):34–40. 10.1016/j.jneumeth.2008.05.016 10.1016/j.jneumeth.2008.05.016 [DOI] [PMC free article] [PubMed] [Google Scholar]
- Yao Y, Ma J (2018) Weak periodic signal detection by sine-Wiener-noise-induced resonance in the FitzHugh–Nagumo neuron. Cogn Neurodyn 12:343–349. 10.1007/s11571-018-9475-3 10.1007/s11571-018-9475-3 [DOI] [PMC free article] [PubMed] [Google Scholar]
- Yao Y, Ma J (2022) Logical stochastic and vibrational resonances induced by periodic force in the FitzHugh–Nagumo neuron. Eur Phys J plus 137:1214. 10.1140/epjp/s13360-022-03423-x 10.1140/epjp/s13360-022-03423-x [DOI] [Google Scholar]
- Yao Y, Yang L, Wang C, Liu Q, Gui R, Xiong J, Yi M (2018) Subthreshold periodic signal detection by bounded noise-induced resonance in the FitzHugh–Nagumo neuron. J Complex 2018:5632650. 10.1155/2018/5632650 10.1155/2018/5632650 [DOI] [Google Scholar]
- Yu D, Zhou X, Wang G, Ding Q, Li T, Jia Y (2022) Effects of chaotic activity and time delay on signal transmission in FitzHugh–Nagumo neuronal system. Cogn Neurodyn 16:887–897. 10.1007/s11571-021-09743-5 10.1007/s11571-021-09743-5 [DOI] [PMC free article] [PubMed] [Google Scholar]
Associated Data
This section collects any data citations, data availability statements, or supplementary materials included in this article.
Data Availability Statement
The sample data are available upon request.
Computer source codes are available upon request.