Abstract
Clinical results with photovoltaic subretinal prosthesis (PRIMA) demonstrated restoration of sight via electrical stimulation of the interneurons in degenerated retina, with resolution matching the 100 μm pixel size. Since scaling the pixels below 75 μm in the current bipolar planar geometry will significantly limit the penetration depth of the electric field and increase stimulation threshold, we explore the possibility of using smaller pixels based on a novel 3-dimensional honeycomb-shaped design. We assessed the long-term biocompatibility and stability of these arrays in rats by investigating the anatomical integration of the retina with flat and 3D implants and response to electrical stimulation over lifetime – up to 32–36 weeks post-implantation in aged rats. With both flat and 3D implants, signals elicited in the visual cortex decreased after the day of implantation by more than 3-fold, and gradually recovered over the next 12–16 weeks. With 25 μm high honeycomb walls, the majority of bipolar cells migrate into the wells, while amacrine and ganglion cells remain above the cavities, which is essential for selective network-mediated stimulation of the retina. Retinal thickness and full-field stimulation threshold with 40 μm-wide honeycomb pixels were comparable to those with planar devices – 0.05 mW/mm2 with 10 ms pulses. However, fewer cells from the inner nuclear layer migrated into the 20 μm-wide wells, and stimulation threshold increased over 12–16 weeks, before stabilizing at about 0.08 mW/mm2. Such threshold is still significantly lower than 1.8 mW/mm2 with a previous design of flat bipolar pixels, confirming the promise of the 3D honeycomb-based approach to high resolution subretinal prosthesis.
Keywords: Photovoltaic retinal prosthesis, Photoreceptor degeneration, Vision restoration, Subretinal surgery
1. Introduction
Retinal degenerative diseases, such as age-related macular degeneration (AMD) and retinitis pigmentosa (RP), are among the primary causes of untreatable visual impairment. Patients with atrophic AMD lose central high-acuity vision due to the gradual demise of photoreceptors in the macula. This advanced form of AMD, called geographic atrophy, affects millions of patients: approximately 3 % of the population over the age of 75, and 25 % over the age of 90 [1,2]. As life expectancy extends, the number of patients that will suffer from severe vision loss is expected to increase. Hereditary RP typically leads to irreversible loss of photoreceptors much earlier in life, resulting in profound blindness at young adulthood [3]. Normally, signals from photoreceptors propagate to the second-order retinal neurons (bipolar and horizontal cells), and then to the third order neurons (amacrine and ganglion cells), which convert them into spiking patterns propagating via optic nerve to the brain. Since in both forms of retinal degeneration, the inner retinal neurons are preserved to a large extent, albeit with some rewiring [4,5], information can be reintroduced into the visual system by electrical stimulation of either of these downstream neurons, which opens the door to restoration of sight. Selective electrical stimulation of the bipolar cells (also called network-mediated retinal stimulation) maintained many features of natural retinal signal processing [6, 7].
Several designs of retinal prosthetics have been tested in RP patients. The Argus II epiretinal prosthesis (Second Sight Medical Products, Inc, Sylmar, CA, USA) has been implanted in more than 200 RP patients for 1–3 years, and the subjects performed better in functional visual tests with the system ON than OFF, although a third of the subjects experienced serious adverse events (SAEs) [8]. The Argus II system is intended to be used in conjunction with the assisted mobility devices, such as long cane or guide dog [9], and RP patients implanted with the system achieved mean visual acuity of 20/6324 and the best acuity of 20/1262 [8]. In clinical trials of the Alpha IMS/AMS subretinal prostheses (Retina Implant AG, Reutlingen, Germany), out of 44 RP patients in total, nearly all reported implant-mediated light perception, but only 6 demonstrated letter acuity, ranging from 20/2000 to 20/550 (2 patients) [10]. Further improvement in prosthetic vision is required to provide substantial benefits to patients blinded by retinal degeneration.
For atrophic AMD, the subretinal photovoltaic arrays PRIMA (Pixium Vision, Paris, France) have demonstrated both safety and efficacy in the initial feasibility trial, achieving a prosthetic letter acuity in the range of 20/438 – 20/550 (4 patients), closely matching the sampling limit with 100 μm pixels: 1.17 ± 0.13 pixels [11,12]. Moreover, patients reported simultaneous perception of the central prosthetic vision and remaining natural peripheral vision [12]. This encouraging result paves the way for developing devices with higher resolution. For a wider adoption of this technology clinically, prosthetic visual acuity should significantly exceed the remaining eccentric vision, typically no worse than 20/400 in AMD patients.
Improvement in prosthetic resolution requires efficient stimulation of retinal neurons by smaller pixels. Scaling down the bipolar pixels in subretinal planar implants like PRIMA is fundamentally limited by the electric field penetration depth, which scales with the pixel width due to the local circumferential return electrode in each pixel [13,14]. Consequently, if continuing to use this design, pixels smaller than 75 μm in human retina will require NIR light intensity exceeding the safety limit of 8 mW/mm2 [14].
One promising approach to overcome such limitation is to create 3-dimensional (3D) honeycomb-like interface [13,15] by elevating the return electrodes and allowing the bipolar cells to migrate into these cavities. Vertically aligned electric field polarizes the bipolar cells more efficiently due to the vertical orientation of their axons in the retina. To preserve the network-mediated encoding of the retinal signals, it is essential to preferentially stimulate the second-order neurons (bipolar and horizontal cells), while avoiding direct stimulation of the output (third order) retinal neurons - ganglion cells. Vertical confinement of electric field above the bipolar cells is important for this selective network-mediated retinal activation. Preliminary results have shown that retinal second-order neurons, located in the inner nuclear layer (INL), migrate into the voids in 3D subretinal implant within a couple of weeks post implantation [13,15,16]. However, given the chronic nature of retinal implants, further studies are needed to investigate the long-term safety and stability of such devices in the subretinal space. These studies could also provide valuable insights to other designs of 3D retinal prostheses [17–21], and potentially other neural interfaces.
Here, we present a comprehensive longitudinal study of the 3D honeycomb-shaped implants in the subretinal space in rats. We printed 25 μm high and 2 μm wide polymer honeycomb walls on top of planar monopolar photovoltaic arrays. Since full-field illumination of 1 mm wide monopolar arrays provides nearly vertical field within the retinal thickness, addition of thin polymer walls of 25 μm in height between the pixels does not affect it. Therefore, comparison of the stimulation thresholds with and without such honeycombs on monopolar arrays assesses the effect of retinal migration into the wells on neuronal excitability. We also examined their structural integration by studying retinal anatomy over the lifetime of the animals - 32 weeks post implantation. We compare the retinal thickness, cellular migration, as well as electrical excitability across three categories of implants: honeycombs on 40 μm pixels, honeycombs on 20 μm pixels, and planar devices, illustrated in Fig. 1.
Fig. 1.
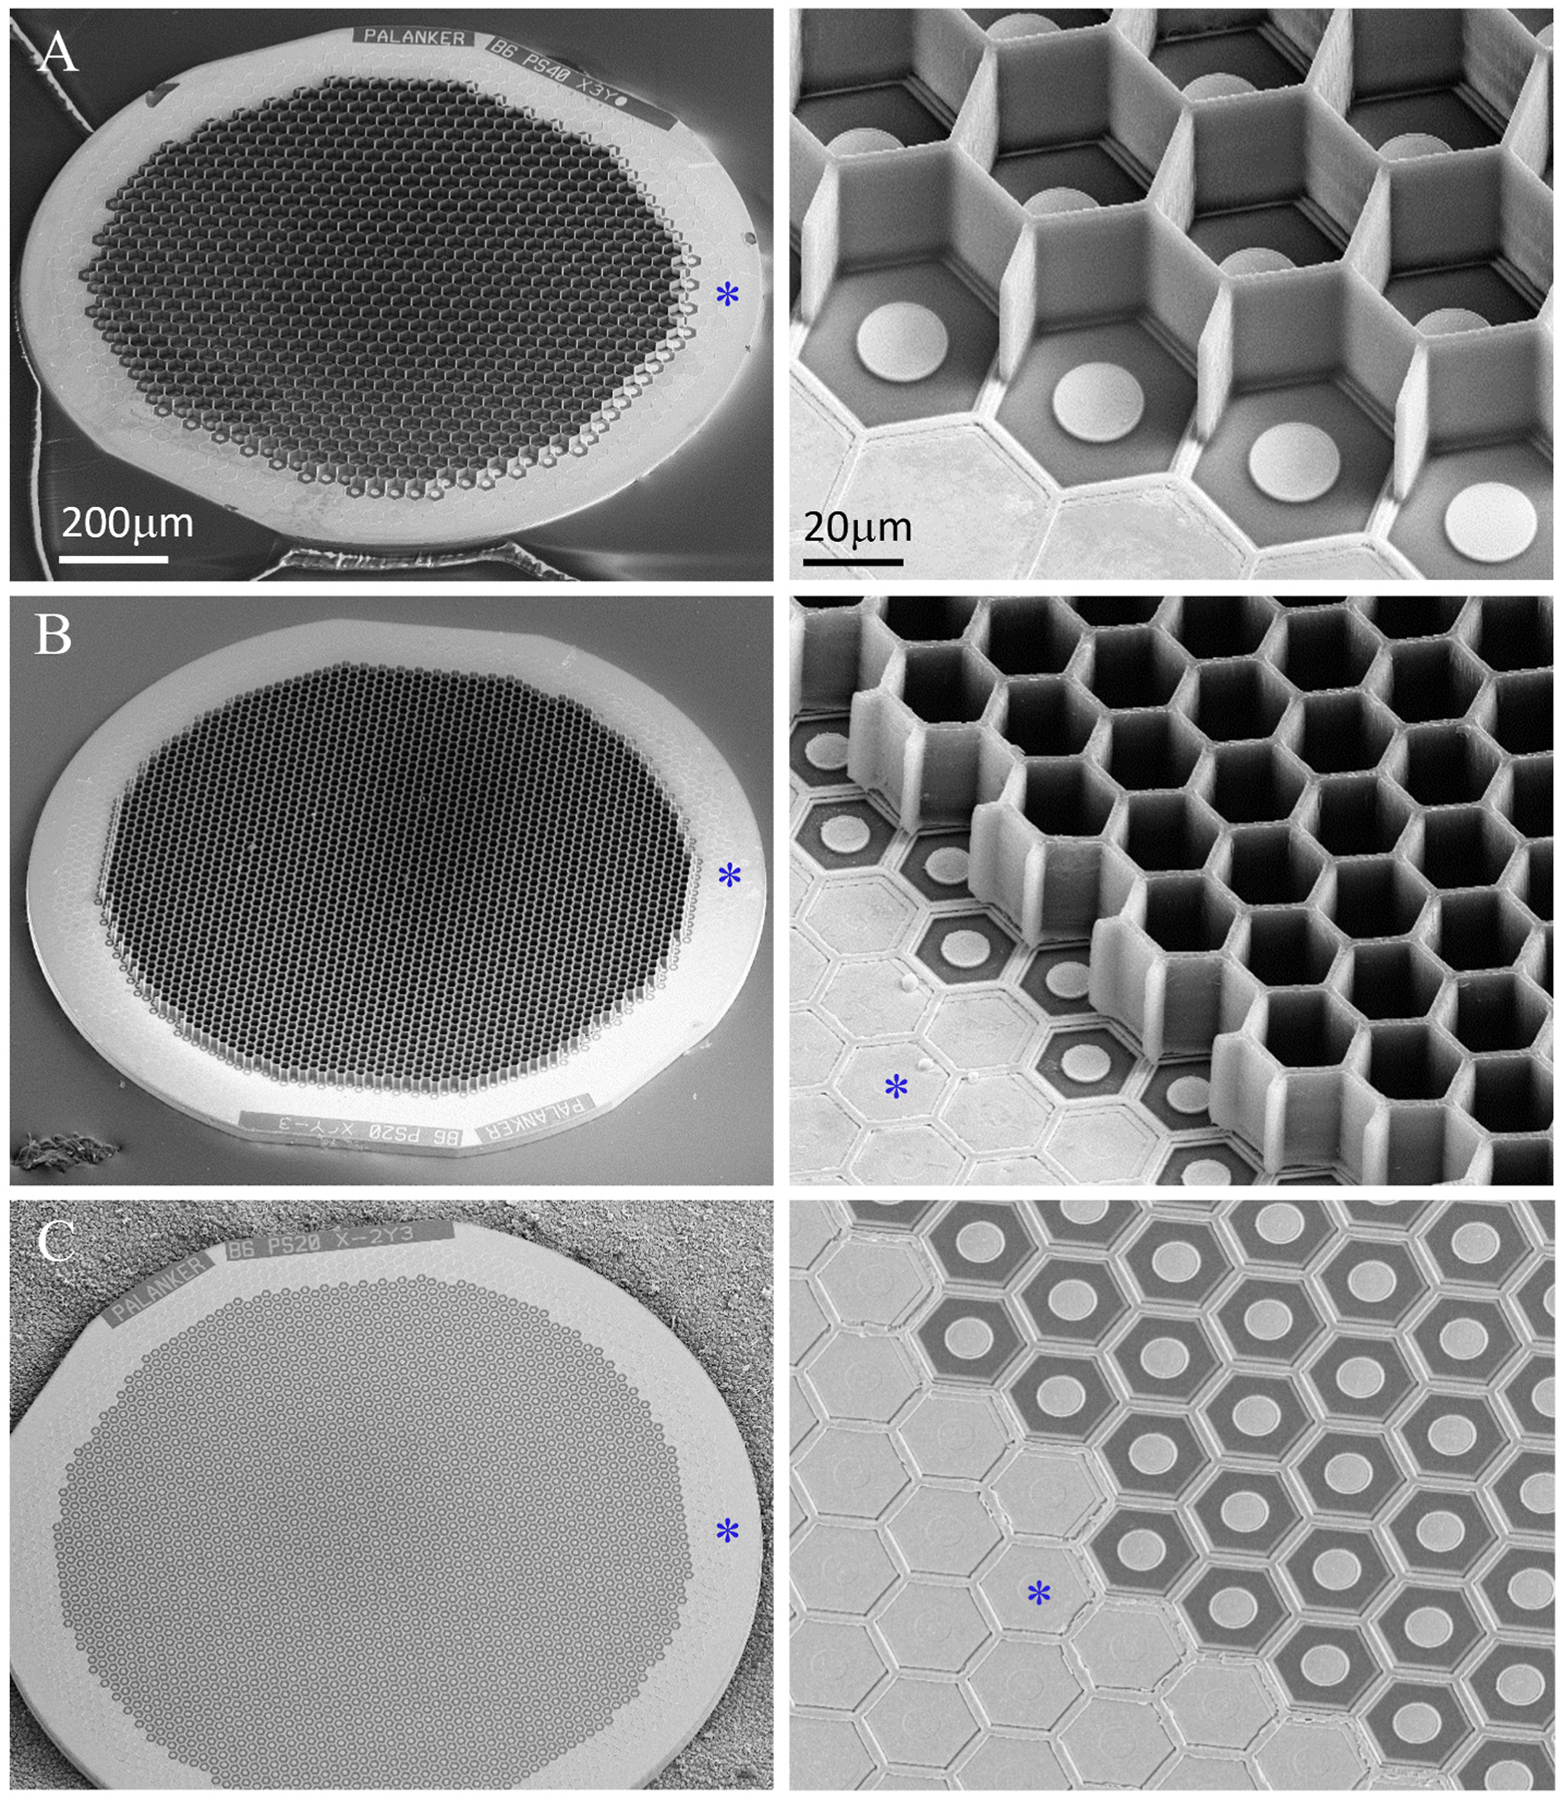
Scanning electron microscopy (SEM) of the implants. Honeycomb-shaped walls of 25 μm in height were polymerized onto planar monopolar photovoltaic arrays; (A) 40 μm pixels, (B) 20 μm pixels, (C) planar monopolar implant with 20 μm pixels. Common return electrode is indicated by asterisk.
2. Results
2.1. Retinal thickness
To assess the long-term effect of our subretinal implants (planar and 3-D) on retinal thickness, 1.5 mm devices (Fig. 1A–C) were implanted in 6–9 months old Royal College of Surgeon (RCS) rats - a model of photoreceptor degeneration [22]. The retina and implant were monitored in vivo for over 32 weeks using optical coherence tomography (OCT) imaging. A hyperreflective layer, not present in the non-implanted control (Fig. 2A), becomes visible above the planar and honeycomb implants on the day of implantation (Fig. 2E–I). This debris layer may represent the remnants of the outer plexiform layer (OPL), which becomes visible after retinal detachment and almost completely disappears after 1 week (Fig. 2F). At that time, the top of the honeycomb walls becomes visible in OCT (yellow arrow in Fig. 2J, K, L), allowing monitoring the migration of the inner nuclear layer (INL, where nuclei of bipolar, horizontal, Müller and amacrine cells reside) into the wells over time.
Fig. 2.
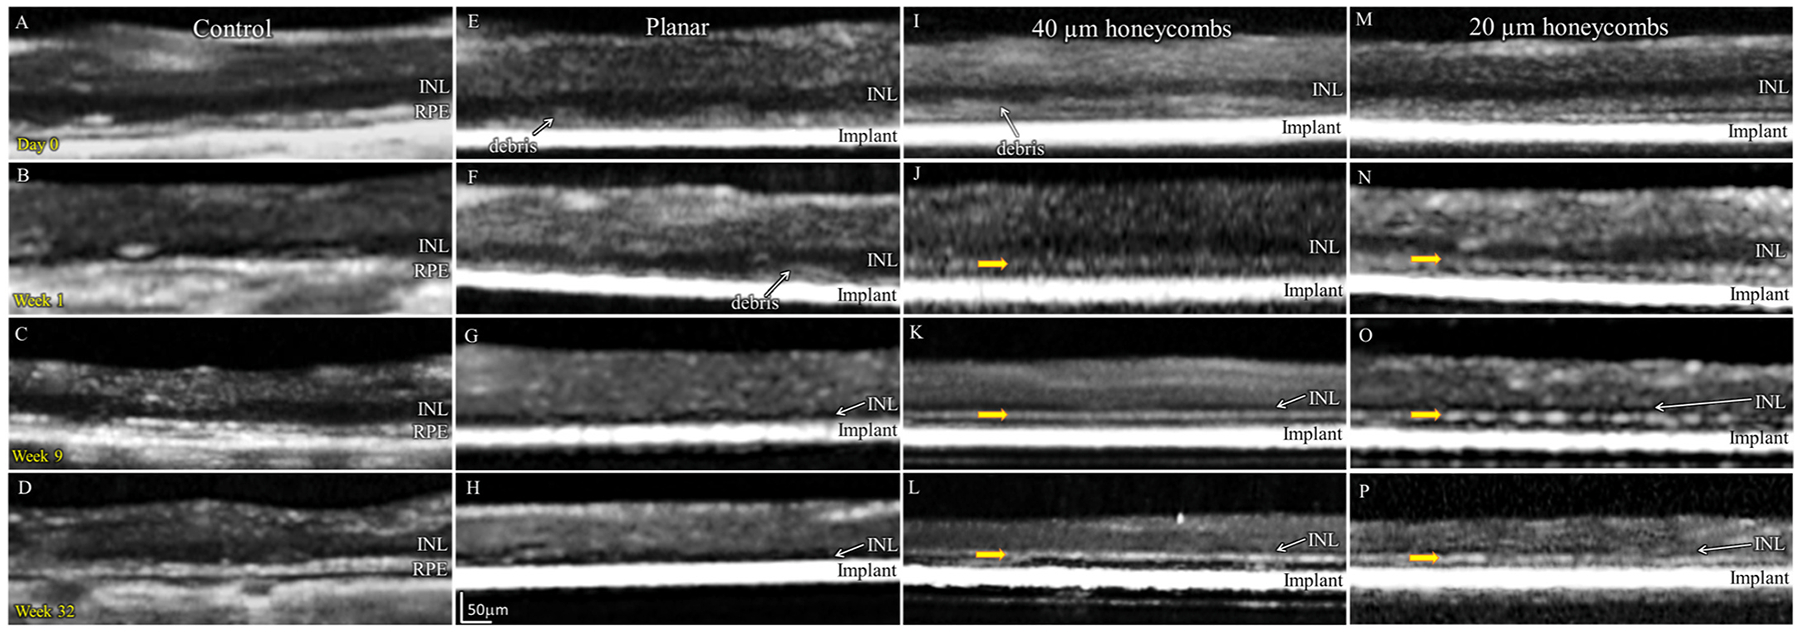
Optical coherence tomography (OCT) of the RCS rat retina at various time points: Day 0, weeks 1, 9 and 32. (A–D) Non-implanted control eyes. (E–H) Planar implants. (I–L) 3D honeycomb implants. Yellow arrows indicate the top of the honeycomb walls visible on OCT.
Retinal morphology above all implants remained comparable to their age-matched un-implanted control. Retinal thickness (Fig. 3A) quantified using the Heidelberg Eye Explorer software (see Methods; Surgical procedure, and animal handling and in vivo imaging), decreased at similar rate with all implants and in the non-implanted controls (n = 3–6, two-sample t-tests, p = 00.25). No statistical difference between the different groups was observed, which suggests an age-related mechanism of thinning in this animal model.
Fig. 3.
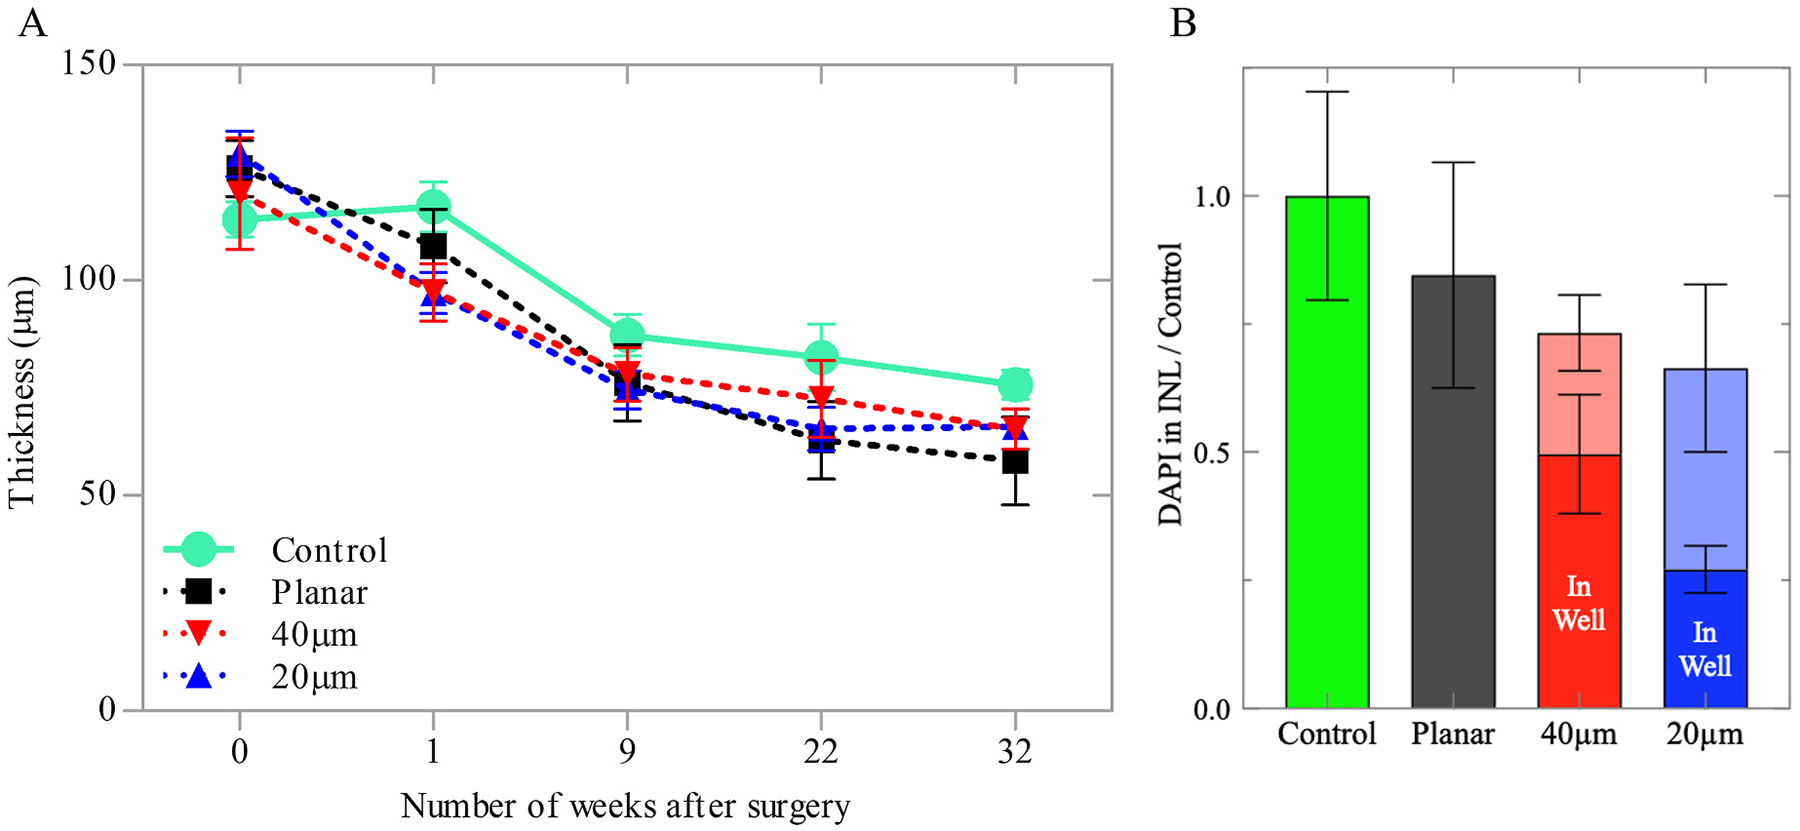
Quantification of the retinal anatomy. (A) Retinal thickness above the planar and 3D implants for up to 32 weeks post-op, compared to the age-matched non-implanted controls, measured with OCT. (B) Quantification of the cellular migration into the wells, relative to the INL in non-implanted controls, assessed with DAPI staining.
For immunohistochemical imaging, retinas from the implanted rats and their age-matched controls were collected 32–36 weeks post-implantation. The samples were labelled with 4’, 6-Diamidin-2-phenylindol (DAPI) and nuclei above each implant were quantified relative to the INL of non-implanted controls (Fig. 3B). Above the implants, the INL contained fewer nuclei: 0.85 ± 0.22 for planar, 0.73 ± 0.17 for 40 μm honeycomb and 0.66 ± 0.15 (two-sample t-tests, p = 00.037) for 20 μm honeycomb, relative to the age-matched control. However, the differences between the planar and 3-D implants were not significant, suggesting comparable long-term compatibility of such structures in the subretinal space. Furthermore, the quantification of INL cells inside the wells and outside the wells provides a measure of both migration and total INL (inside + outside wells), allowing for the distinction between migration and retinal thinning.
2.2. Retinal structure
Functional success of the honeycomb implants depends on migration and long-term stability of the bipolar cells inside the wells. Morphology and location of cells was assessed by confocal imaging of the whole-mount RCS retina (re-sliced and projected into a side-view; see methods section: whole-mount retinal immunohistochemistry, imaging and image processing) immuno-labelled with PKCα (rod bipolar cells), secretagogin (cone bipolar cells) and DAPI (nuclei) after 32–36 weeks of implantation. DAPI staining was used as a reliable visualization and quantification of the INL cells migration throughout all immunostaining, while PKCα, secretagogin, anti-choline acetyltransferase (CHAT) and glial fibrillary acidic protein (GFAP) provided a useful visualization of the approximate location and population of the rod bipolar, cone bipolar, amacrine and Müller cells. PKCα labelled the cell membrane of rod bipolar cells and secretagogin labelled the cytoplasm of cone bipolars; highlighting the cell somas in the INL, the extending axons through the inner plexiform layer (IPL) and the axonal terminals that connect to amacrine and ganglion cells in the IPL and at the ganglion cell layer (GCL). A few displaced bipolar and amacrine cells were also observed in the GCL in degenerate retinas. The retinal structure with planar implant (Fig. 4B) was comparable to that of the non-implanted control (Fig. 4A). There were 50 % more INL cells inside 40 μm wells than in 20 μm wells (p = 0.01), as quantified in Fig. 3B. Comparable total number of the INL cells (DAPI staining; Fig. 3B) in these two groups indicates that the difference in population of cells inside the wells is due to cell migration rather than cell death.
Fig. 4.
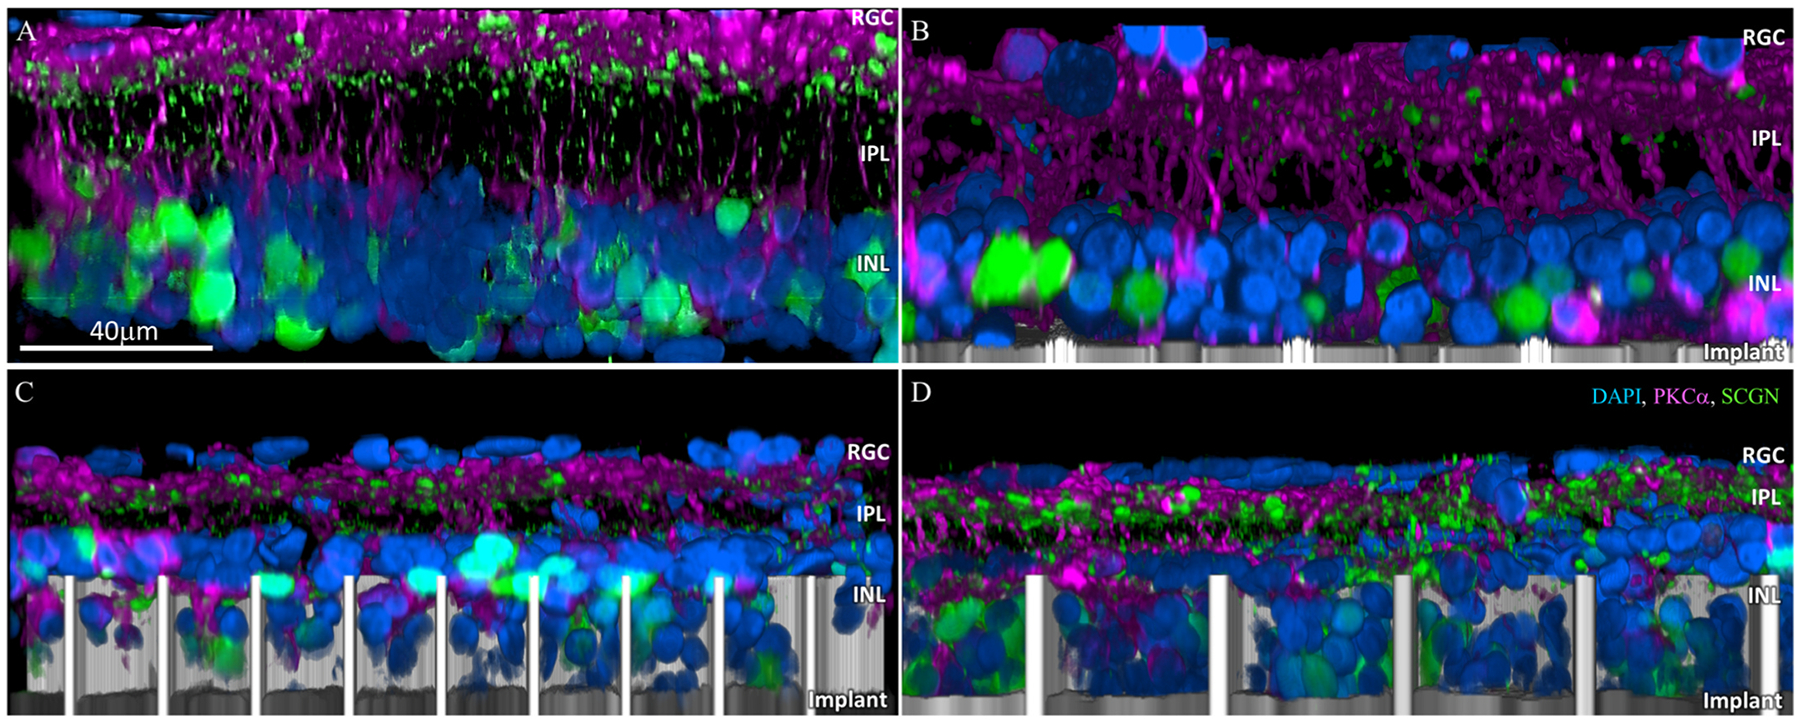
Confocal images of immuno-labelled rod bipolar (PKCα: magenta) and cone bipolar (secretagogin; green) cells. (A) Age-matched non-implanted RCS retina; (B) retina with planar implant; (C) retina above and inside the honeycomb wells of 20 μm and (D) 40 μm pixels after 32 weeks in-vivo. DAPI labelled nuclei are blue and the implant is grey. Scale bar = 40 μm.
Another important functional requirement for the honeycomb design is discrimination between second-order (bipolar and horizontal cells in the INL) and third-order neurons (amacrine cells in the INL and ganglion cells in the GCL): bipolar cells should reside inside the wells to be efficiently stimulated, while the amacrine cells should remain above the return electrode on top of the walls, not be exposed to strong electric field. Amacrine cell location was assessed using CHAT antibody, which cleanly labels a small sub-population of amacrine cells that have choline acetyltransferase. As can be seen in Fig. 5C and D, amacrine cells (white asterisk) remain above the honeycomb wells despite the retinal thinning during the 24–36 weeks post-op.
Fig. 5.
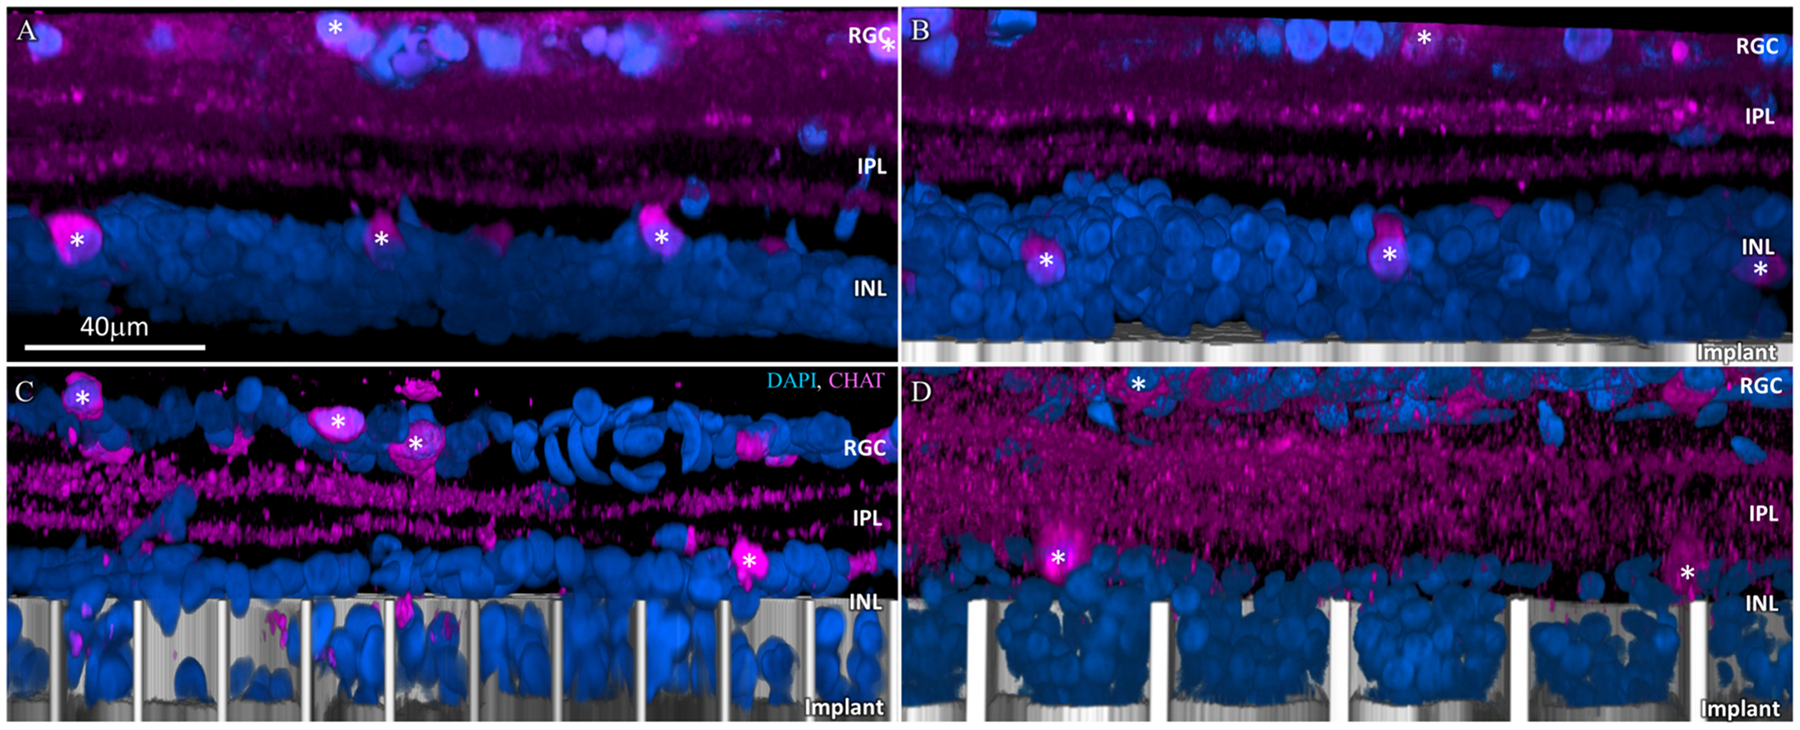
Amacrine cells immuno-labelled with choline acetyltransferase (CHAT: magenta). (A) Age-matched non-implanted RCS retina; (B) retina with planar implant; (C) retina above and inside the honeycomb wells of 20 μm and (D) 40 μm pixels after 32 weeks in-vivo. Amacrine cells remain above the walls for both honeycomb sizes, they retain their IPL stratification and cell body position in the INL, similar to those in the control. DAPI labelled nuclei are blue and the implant is grey. White asterisks mark the visible amacrine cell somas. Scale bar = 40 μm.
Long-term Müller glial activation due to subretinal implants was assessed by GFAP staining, to visualize the activation levels relative to control and assess the presence of a glial seal, which could impede the migration of the INL cells into the wells and subsequently affect the stimulation thresholds. Comparable GFAP levels were observed between the planar, 20 and 40 μm honeycomb implants (Fig. 6 B, C, D), but all of them higher than the non-implanted control (Fig. 6A). Furthermore, a GFAP positive layer can be seen above the wells of both 20 and 40 μm pixels (Fig. 6C, D). The presence of a horizontal magenta stained layer between the DAPI-stained cells, indicated by yellow arrows, suggests that a glial seal forms in the space left by the INL cells which migrated into the wells. This seal might be the reason why amacrine cells do not migrate into the wells (Fig. 6C, D) even after the retina became thinner.
Fig. 6.
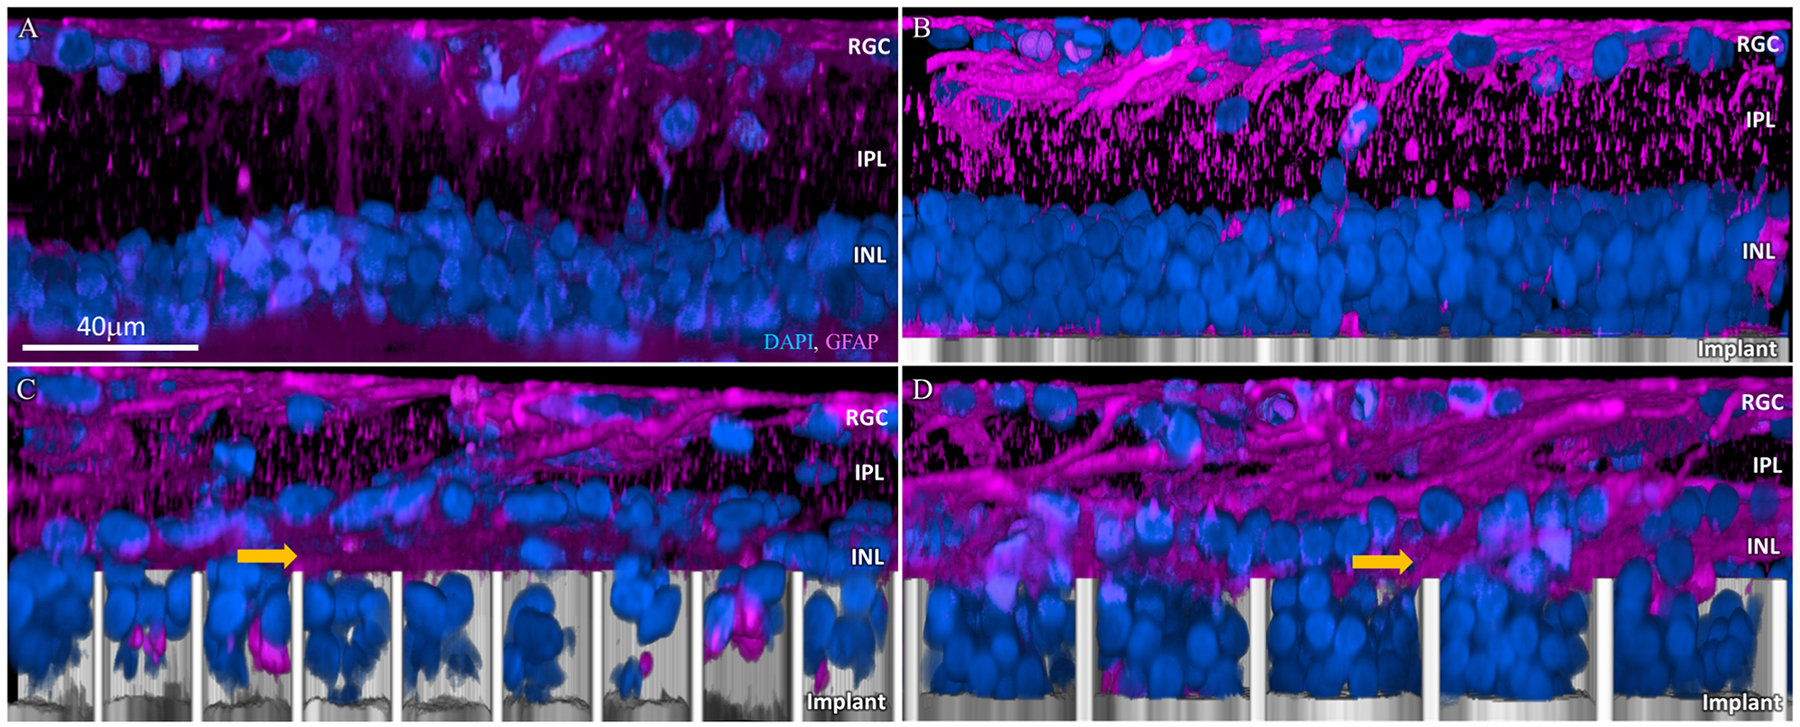
Muller cell activation marker GFAP (magenta). (A) Age-matched non-implanted RCS retina; (B) retina with planar implant; (C) retina above and inside the honeycomb wells of 20 μm and (D) 40 μm pixels after 32 weeks in-vivo. GFAP clusters (yellow arrow) between the cells migrated into the honeycombs and the rest of the INL in both 20 and 40 μm. DAPI labelled nuclei are blue and the implant is grey. Scale bar = 40 μm.
2.3. Stimulation thresholds
To assess potential changes in retinal excitability over time, we measured the visually evoked potential (VEP) in response to full-field stimulation projected through the entirety of the pupil, recorded at a sampling rate of 2 kHz and averaged over 250 trials (Fig. 7). Noise level was assessed also from 250 trials, based on VEP peak-to-peak amplitude in the same time window, but without NIR illumination. To better visualize the effect of the implants rather than the animal-to-animal variability, the results were normalized in each animal to its amplitude at the last measurement - week 32 (Fig. 8). Absolute values of the VEP amplitude prior to normalization are shown in Supplemental Fig. 1. Statistical tests (two-sample t-tests) among the implant groups revealed no significant difference (Fig. 8A; p > 0.05 at all the time points) between the stimulation thresholds with planar implants and 40 μm honeycombs, indicating that retinal integration with these honeycomb structures did not affect its neuronal excitability. However, unlike the other two groups, with 20 μm honeycomb pixels (Fig. 8B), stimulation thresholds were significantly higher after 18th week (asterisk, 0.01 < p < 0.05). As shown in Figs. 7B and 8, VEP amplitude decreased right after the implantation and gradually recovered over 12–16 weeks post-op. After about 20 weeks, the VEP amplitude (shown in Fig. 8 at 2.4 mW/mm2 irradiance) largely stabilized, and it exceeded the value measured on the day of implantation.
Fig. 7.
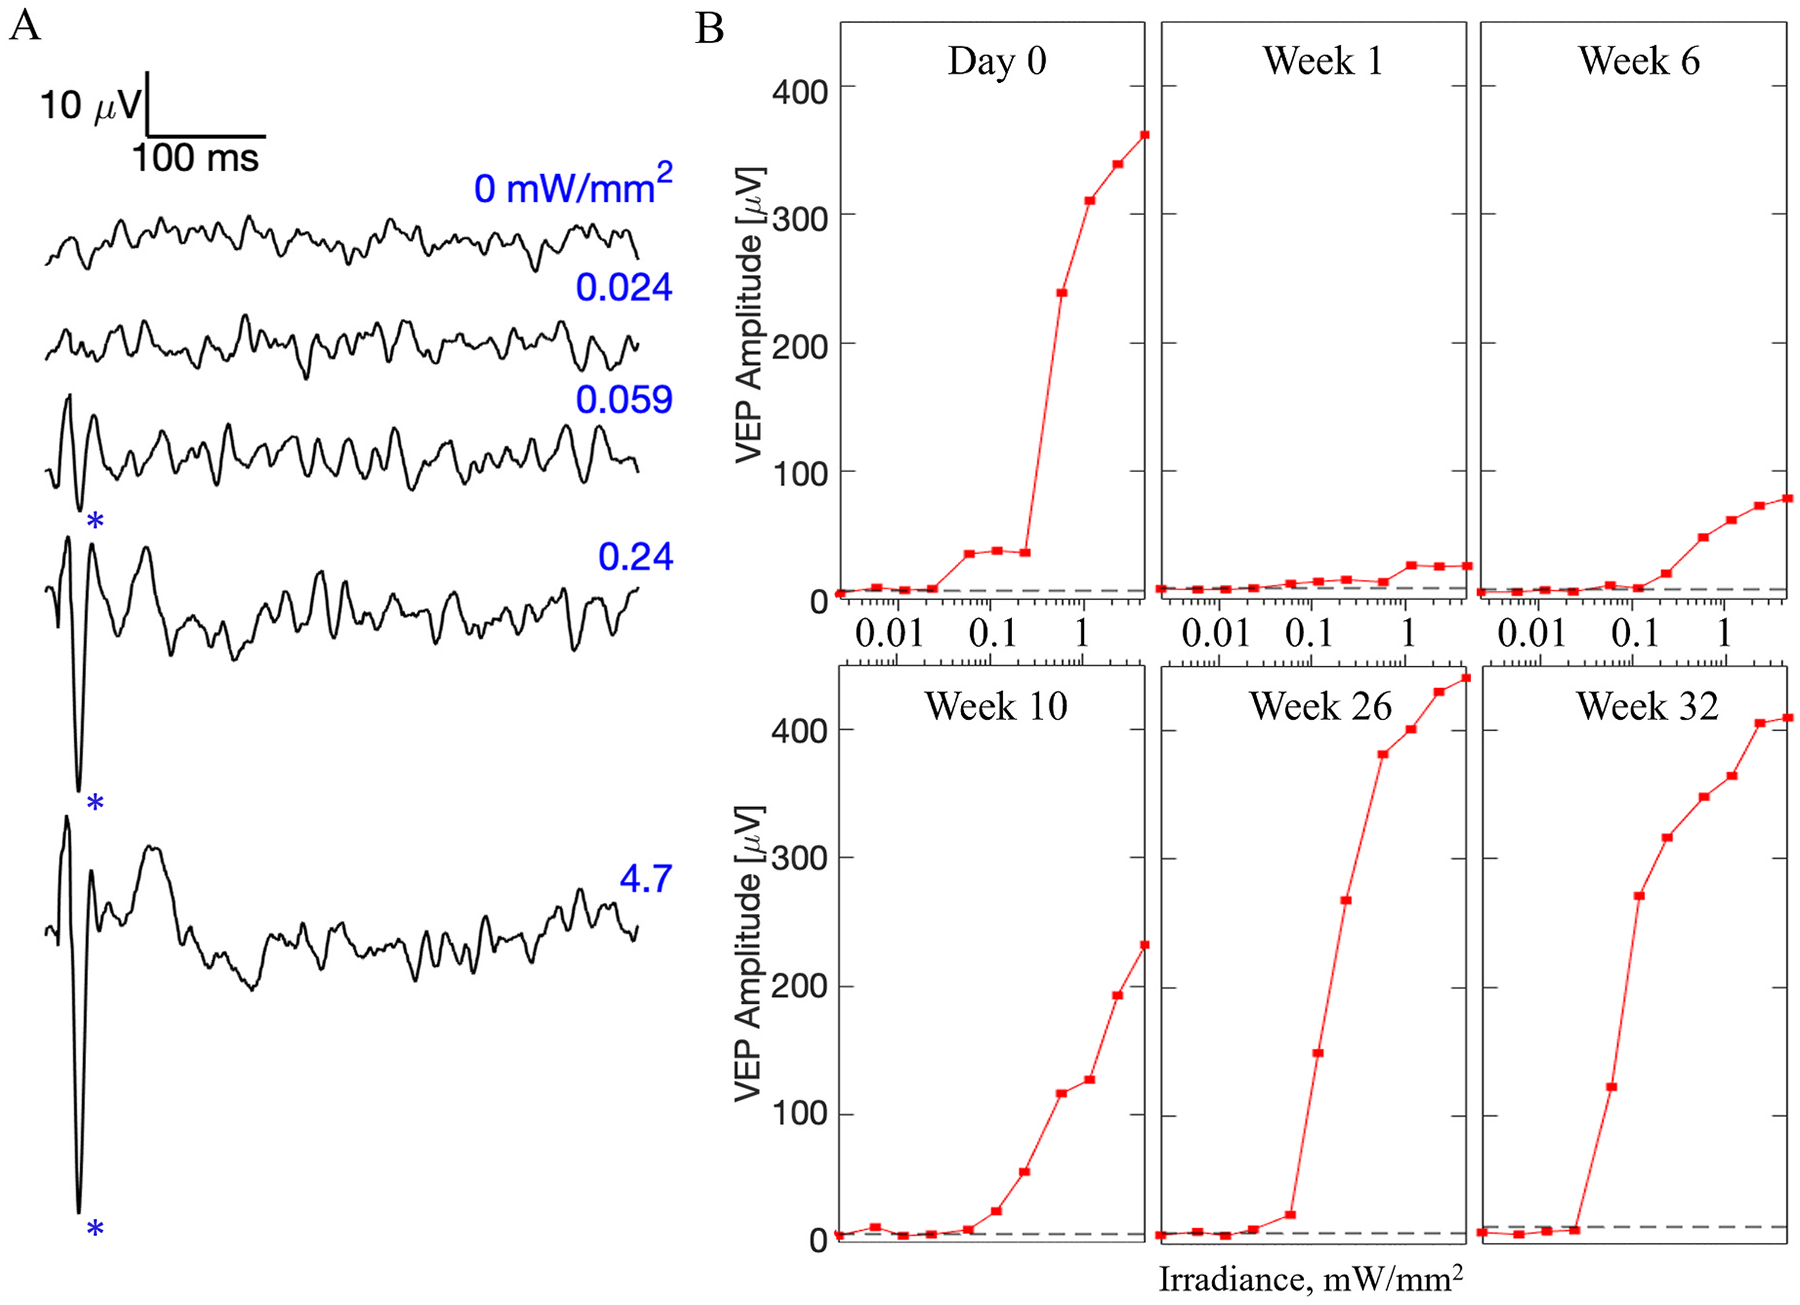
Cortical responses to subretinal stimulation over time. A) Example visually evoked potential (VEP) waveforms on the day of implantation (week 0) with a planar device in response to 10 ms pulses at various irradiances, recorded at a sampling rate of 2 kHz and averaged over 250 trials. Above the stimulation threshold, the characteristic N1 peak (marked by asterisks) appears in the waveform. B) VEP amplitudes with a planar implant as a function of irradiance, at selected time points. Noise level is shown by a dash line.
Fig. 8.
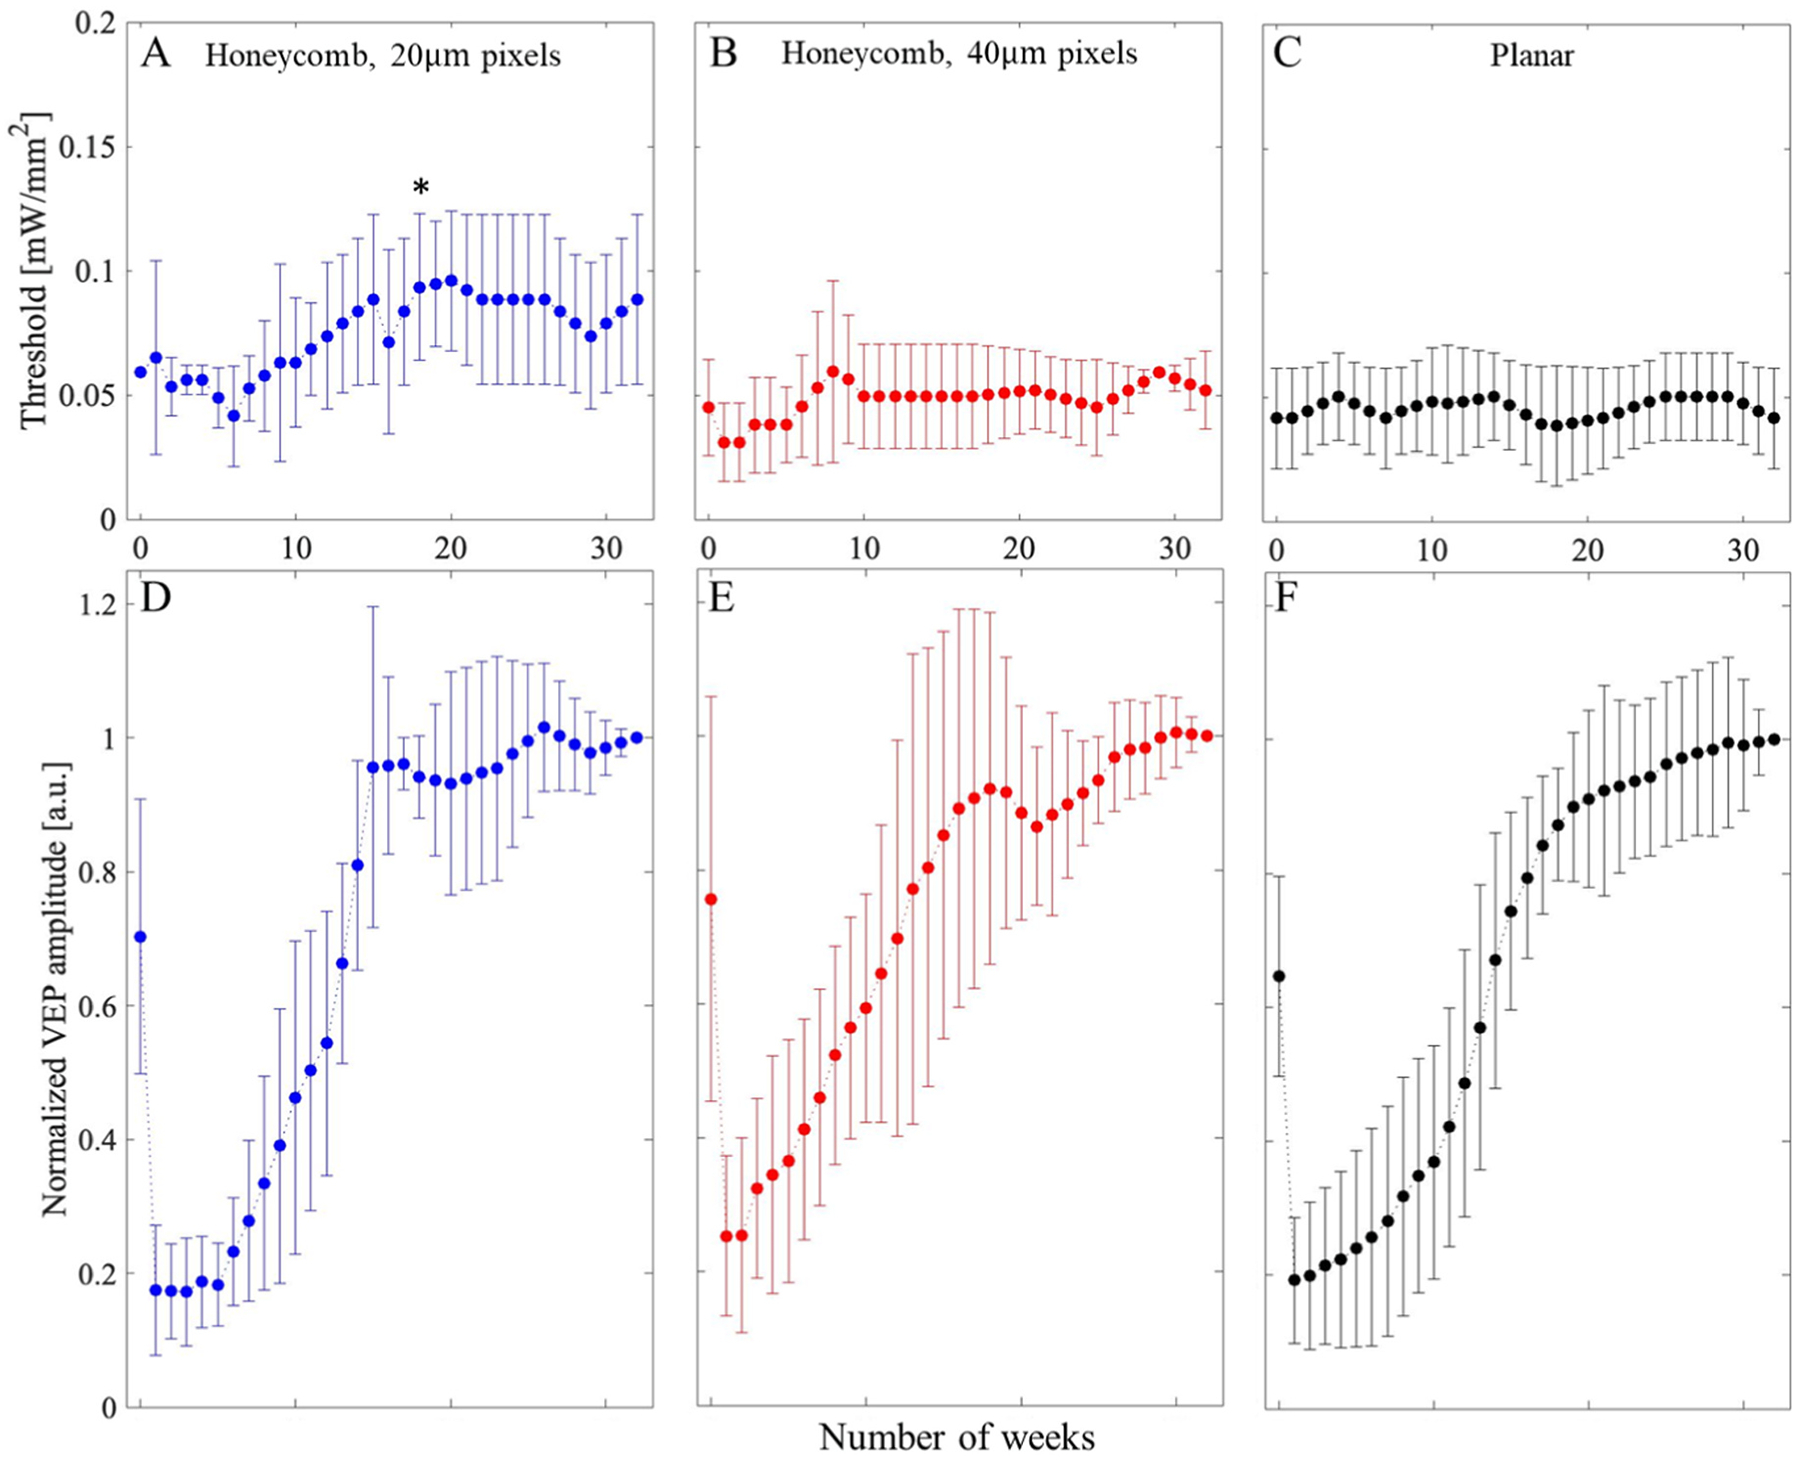
The stimulation thresholds over time - number of weeks post implantation for A) honeycomb devices with 20 μm pixels, B) 3D honeycomb devices with 40 μm pixels, and C) planar devices as a control. (D–F) VEP amplitudes at 2.4 mW/mm2 irradiance measured from the day of implantation for up to 32 weeks for 20-, 40-μm honeycomb and planar devices, respectively. Due to variability between animals, values are normalized by the last measurement prior to averaging. Asterisk marks the timepoint at which threshold with 20 μm pixel honeycomb becomes statistically different from the starting day (p = 0.05).
3. Discussion
Clinical trials with our planar bipolar pixels (PRIMA, Pixium Vision) have demonstrated the potential of photovoltaic subretinal prothesis to provide central vision in AMD patients with acuity closely matching the 100 μm pixels size [11,12]. These implants exhibited good durability in the subretinal space, stability of the retina above the implant and sustained visual acuity for over 4 years. To reduce the pixel size and thus enable higher visual acuity, we have proposed the use of 3-D honeycombs with elevated return electrodes, where penetration depth of electric field is defined by the wall height rather than pixel width [13]. Our earlier studies demonstrated migration of the inner retinal neurons into the honeycomb wells, their survival up to 6 weeks post implantation and grating acuity reaching 28 μm - the natural limit of visual resolution in rats [15]. However, it is important to characterize the long-term structural and functional effects of such 3-D implants on the retina before translating this technology into clinical testing.
RCS rats used in this study constitute a good model for studying retinal structure and response to electrical stimulation after photoreceptor degeneration. The age-related retinal thinning described in this study is also common to normally-sighted rats (decrease at the end of life by up to 29 %) [23,24] and humans (by up to 39 %) [25–27]. Data with AMD patients suggest that after initial thinning during the first 3 months post-op, retinal thickness changed very little during the 4 years follow-up [28]. More significant thinning in RCS rats could be due to the different form of retinal degeneration, modeling RP rather than AMD. Importantly, there was no significant change in the retinal thickness between the clinically tested planar configuration and the proposed 3-D honeycomb implants.
Interestingly, the VEP peak amplitude recorded on the day of implantation drops, on average, nearly 3-fold within a week, and then gradually recovers and eventually exceeds the day 0 measurements. Since proximity of the retina to the implant only improves with time, the signal decline during the first week and its gradual recovery cannot be explained by the improving proximity to the implant over time, especially since electric field generated by monopolar implants with full-field illumination penetrates deep into the retina, hence negating the distance issues. We hypothesize that the drop in VEP could be related to acute glial reactivity. The surgical insult, involving a scleral, choroidal and retinal incisions and the introduction of a foreign object in the subretinal space, results in microglia and systemic immune cell infiltration, migration and accumulation [13]. Müller glia becomes reactive, increasing the GFAP expression, cellular swelling, migration of nuclei and potentially forming a glial seal [15]. The acute glial response sets in within hours, reaching its peak within the first week. As the acute reactivity slowly subsides and the retina integrates with the implant, the VEP signal starts to recover. However, this drop is unlikely to affect patients since they start visual rehabilitation and training after about 3 months post-op.
Stimulation threshold was not affected by 40 μm honeycombs, compared to planar implants, but with 20 μm honeycomb pixels, it significantly increased after 18 weeks post-op. Since the number of cells in the INL with 20 μm pixels did not differ much from that with 40 μm pixels, the difference may be related to cellular excitability. It is possible that diffusion of oxygen and nutrients within tighter wells is more restricted, resulting in a decrease of the bipolar cell function. Another plausible explanation could be related to reduced penetration of Müller cells into 20 μm compared to 40 μm wells, visualized by their SOX9 positive nuclei, glutamine synthetase (GS) and GFAP staining [15]. Bipolar cells rely more heavily on Müller cells for their homeostatic and metabolic support than other retinal neurons [29], and hence decreased interaction between bipolar and Müller cells inside tighter wells may result in their decreased excitability.
One way to improve the oxygenation and allow better Müller cell migration into the wells is to decrease the wall height from 25 μm to about 15 μm. However, lower walls would decrease the electric field penetration into the retina. The 15 μm deep wells should still accommodate two layers of bipolar cell nuclei, representing about half of the INL thickness, which is sufficient for eliciting retinal response [13], but the percepts might not be as bright as with the full-depth stimulation.
Computational modeling of honeycomb configuration shows that it should significantly improve the retinal stimulation at smaller pixels [13]. This study explored the long-term sustainability of having 3-D honeycomb structures in the subretinal space, and how the migration of retinal cells affects retinal excitability by fabricating polymer-based honeycomb structures on top of active planar devices to assess the excitability of the retina. Comparable VEP signal to that of planar devices without walls implies that honeycomb structures can successfully be implanted for long-term and maintain retinal excitability. This feasibility study opens the possibility of using honeycomb structures as a viable approach. Stimulation thresholds of 0.05 mW/mm2 with 40 μm and 0.08 mW/mm2 with 20 μm honeycomb monopolar pixels are significantly lower than 1.8 mW/mm2 with 40 μm flat bipolar pixels [30] (previous pixel design with active electrodes having return electrodes surrounding each pixel compared to the monopolar flat configuration in Fig. 1C where all the return electrodes are groped at the edge of the implant), confirming the promise of the honeycomb-based approach to high resolution subretinal prosthesis. Further studies will be needed to confirm the results with functional honeycomb devices. The 40 μm pixels could theoretically provide visual acuity of 20/160, which exceeds the US legal blindness limit of 20/200 [31], and with 20 μm pixels it may exceed 20/100. However, since AMD patients have a thicker ‘debris’ layer between the INL and the implant than in RCS rats (previously referred to as distance between implant and INL) [11,28], further optimization will be required before clinical tests of this technology. Developing an animal model of AMD, which includes this debris layer, will be essential for assessment of migration of bipolar cells into the wells.
4. Methods
4.1. Fabrication of 3-dimensional implants
To fabricate the 3D honeycombs on flat arrays of photodiodes, 4 μm wide and 25 μm tall walls on the circumference of each pixel were built by two-photon polymerization using Nanoscribe Photonics GT (Nanoscribe GmbH & Co., Eggenstein, Germany). The dip-in laser lithography was performed using a 25× objective (NA = 1.4) in IP-S photoresist. The layouts of the flat monopolar implants with 40 μm and 20 μm pixels [32] were constructed in SolidWorks (Dassualt Systems, France) and a hexagonal mesh of non-conductive polymer walls was extruded from the metal traces between the pixels, corresponding to the location of return electrodes, using the STL protocol (Fig. 1). To avoid overheating and improve adherence to the metal traces, laser power was set to 30 % and a Galvo scanning rate to 5 mm/s for the first 5 μm height of the polymer walls, whereas the rest was polymerized at 40 % power and 16 mm/s scanning rate.
4.2. Surgical procedures, animal handling and in vivo imaging
All experimental procedures described in this work were conducted in accordance with the Statement for the Use of Animals in Ophthalmic and Vision research of the Association for Research in Vision and Ophthalmology (ARVO), ARRIVE guidelines, U.K. Animals (Scientific Procedures) Act, 1986 and associated guidelines, EU Directive 2010/63/EU for animal experiments and approved by the Stanford Administrative Panel on Laboratory Animal Care (APLAC protocol 13765 and 33394). Royal College of Surgeons (RCS) rats (similar number of males vs females per group) were used as an animal model of inherited retinal degeneration. Animals were maintained at the Stanford Animal Facility under 12 h light/12 h dark cycles with food and water ad libitum. The animals were aged 6–9 months before the implantation to ensure complete degeneration of the photoreceptors.
Animals were anesthetized with a mixture of ketamine (75 mg/kg) and xylazine (5 mg/kg) injected intraperitoneally. The photovoltaic devices were implanted in the subretinal space typically at 6 months of age, after a complete loss of the outer nuclear layer, as evidenced by optical coherence tomography (OCT; HRA2-Spectralis; Heidelberg Engineering, Heidelberg, Germany). Further surgical details are described in our previous work [33]. The implants were placed in the temporal-dorsal region, approximately 1 mm away from the optic nerve. A total of 17 animals were implanted with 1.5 mm diameter arrays: 3D implants with pixel sizes of 40 μm (n = 6) and 20 μm (n = 5), as well as flat implants of the same pixel sizes (n = 6), as illustrated in Fig. 1. Since there are almost no structural differences and no stimulation threshold difference between flat monopolar implants with 20 and 40 μm pixel sizes [32], flat arrays with both pixel sizes are grouped together as a single control group.
To visualize the retina and the implant, animals were monitored over time via OCT. Thickness of the retina above the wells was measured using the OCT’s thickness analysis of b-scans its acquisition software, Heidelberg Eye Explorer (Heidelberg Engineering, Heidelberg, Germany). To avoid mislabeling and automatic identification of the implant as a layer of the retina, layers in each b-scan were manually defined.
For electrophysiological measurements of the visually evoked potentials (VEPs), each animal was implanted with three transcranial screw electrodes (stainless steel; 1.2 mm wide, 6.3 mm in length; cat no. F00CE250 #303SS; J.I. Morris; Oxford, Massachusetts):one electrode over each hemisphere of the visual cortex (4 mm lateral from midline, 6 mm caudal to bregma), and a reference electrode (2 mm right of midline and 2 mm anterior to bregma).
4.3. Electrophysiological measurements
For each electrophysiological measurement session, the rat was anesthetized, pupil of the implanted eye was dilated with Phenylephrine HCl Ophthalmic Solution 2.5 % and Tropicamide Ophthalmic Solution 1 % (NDIC: 17478-201-15 and NDIC: 17478-102-12, respectively; Akron, Inc.; Lake Forest, IL), and its cornea was covered with a viscoelastic gel (4 % Sodium Condroitin Sulfate and 3 % Sodium Hyaluronate for extra and intraocular use: cat no. 00380651831506; Alcon, USA) and a cover slip, to cancel its optical power and ensure good retinal visibility. Subretinal implant was illuminated with a customized projection system, consisting of an 880 nm laser (MF-880nm-400 μm, DILAS, Tucson, AZ), customized optics, and a digital micromirror display (DMD; DLP Light Commander; LOGIC PD, Carlsbad, CA). The entire optical system was integrated with a slit lamp (Zeiss SL-120; Carl Zeiss, Thornwood, NY) for real-time observation of the illuminated retina via a NIR-sensitive CCD camera (acA1300–60gmNIR; Basler, Ahrensburg, Germany). Light intensity at the cornea was calibrated during each session, and then scaled to the retinal plane by the ratio of a projected square on the retina and in air, to derive the NIR irradiance on the implant.
VEPs were recorded across the ipsilateral and contralateral visual cortices via the Espion E3 system (Diagnosys LLC, Lowell, MA) at a sampling rate of 2 kHz, and averaged over 250 trials. Corneal signal was simultaneously measured using ERG electrodes on the cornea and a reference electrode in the nose, while the ground electrode was placed in the rat’s tail (all electrodes were stainless steel, 12 × 0.40 mm, 27 gauge in size and width; cat no. 019–475800; Natus Neurology, WI, USA). Corneal signal also served as a template for a stimulus artifact removal in the VEP waveforms. We applied the same stimulation protocols to all 3 groups of implants: 3D devices with 40 μm and 20 μm pixels, as well as flat devices.
Full-field illumination was projected at 2 Hz with 10 ms pulses, at varying irradiance levels, ranging from 0.002 to 4.7 mW/mm2 on the implants. VEP amplitude was determined by measuring peak-to-peak signal in the 100 ms time window after the stimulus. The noise floor was also determined by measuring peak-to-peak amplitude, but without NIR illumination, and noise RMS was calculated from the entirety of the same waveforms. Typically, noise RMS in these measurements is about 6 times lower than the maximum peak-to-peak values of the noise measured without a stimulus [15]. Threshold was defined as the first sampling point where the peak-to-peak VEP amplitude rises above the noise floor without any interpolation, as described previously [14,15].
4.4. Whole-mount retinal immunohistochemistry, imaging, and image processing
For the retinal imaging and analysis, animals were euthanized 9–12 months post implantation using an intracardiac injection of Phenytoin/pentobarbital (Euthanasia Solution; VetOne, Boise, ID, USA). The eyes were enucleated and rinsed in phosphate buffered saline (PBS), anterior segment and lens were removed, the eye cup was cut to a 3 × 3 mm square centered around the implant, and fixed in 4 % paraformaldehyde (PFA; EMS, PA, USA) for 12 h at 4 °C. Samples were permeabilized with 1 % Triton X-100 (Sigma-Aldrich, CA, USA) in PBS for 3 h at room temperature, followed by a blocking step in 10 % bovine serum albumin (BSA) for 1 h at room temperature, and a 48-h incubation at room temperature with primary antibodies (Supplementary Table 1) in 0.5 % Triton X-100, 5 % BSA in PBS. Samples were washed for 6 h at room temperature in 0.1 % Tween-20 in PBS (PBS-T), incubated for 48 h at room temperature with secondary antibodies (Supplementary Table 1) and counterstained with DAPI in PBS. After 6 h of washing in PBS-T, the samples were mounted with Vectashield medium (H-1000; Vector Laboratories, Burlingame, CA, USA).
3-D imaging of the retinal whole mounts was performed using a Zeiss LSM 880 Confocal Inverted Microscope with Zeiss ZEN Black software. The implant surfaces were identified by reflection of a 514 nm laser with a neutral-density beam splitter allowing 80 % transmission and 20 % reflection. The images were acquired through the total thickness of the retina using a Z-stack, with the upper and lower bounds defined at the inner limiting membrane (ILM) and 10 μm below the base of the honeycomb wells, respectively. Stacks were acquired in the center of each honeycomb quadrant using a 40× oil-immersion objective with acquisition area >225 × 225 μm and 380–470 nm z-steps. The Zeiss z-stack correction module was used to account for dimmer light within the wells of the implants.
Confocal fluorescence datasets were processed using the Fiji distribution of ImageJ [34]. To correct for brightness variations at different Z positions in the stack within the wells and above the implant, we first maximized the contrast in the individual XY planes to ensure 0.3 % channel saturation. The XY planes were de-speckled with the median filter and the background was suppressed using the rolling-ball algorithm [35]. The images then underwent cascades of gamma adjustments and min-max corrections to further suppress the background, depending on the noise level. Gaussian blurring was applied for nucleus staining channels to smoothen the brightness variations within individual cells. The implants were reconstructed by extruding the implant reflection toward the bottom (extraocular side) of the image stack. The z-stack is resliced in imageJ, rescaled by dividing pixel width by voxel depth to get the rescale factor and use the 3-D projection function to obtain a side-view image to visualize the retinal integration with the implant.
To quantify the number of cells in the wells, the total DAPI and the DAPI within the wells were segmented into voxels based on the reflection channel using the Moore-Neighbor tracing algorithm implemented by the “bwboundaries” function in MATLAB 2021b (Mathworks, Inc., Natick, MA), while a control image stack (without an implant) was treated as one segment. Voxels brighter than 15 % of the maximum intensity were considered positive, and in each segment, we defined the filling percentage as a fraction of positive voxels.
Supplementary Material
Acknowledgements
We would like to thank Dr. Tiffany Huang for her contribution to implant fabrication. MB performed surgeries, in-vivo imaging, immunohistochemistry and confocal imaging; BW, MB conducted the electrophysiological measurements; MB, DPH, SS conducted image processing and image quantification; AS, LG and CZC fabricated subretinal implants under the guidance of KM and TK; DP guided the research and data analysis; all authors participated in writing and/or reviewing the manuscript. Studies were supported by the National Institutes of Health (Grants R01-EY-027786, R01-EY-035227, and P30-EY-026877), the Department of Defense (Grant W81XWH-19-1-0738), AFOSR (Grant FA9550-19-1-0402), International Retinal Research Foundation, Wu Tsai Institute of Neurosciences at Stanford, and unrestricted grant from the Research to Prevent Blindness. Photovoltaic arrays were fabricated at the Stanford Nano Shared Facilities (SNSF) and Stanford Nanofabrication Facility (SNF), which are supported by the National Science Foundation award ECCS1542152. K.M. was supported by a Royal Academy of Engineering Chair in Emerging Technology, UK.
Declaration of competing interest
The authors declare the following financial interests/personal relationships which may be considered as potential competing interests: Daniel Palanker reports financial support was provided by National Institutes of Health. Daniel Palanker reports financial support was provided by U.S. Department of Defense. Daniel Palanker reports financial support was provided by Air Force Office of Scientific Research. Daniel Palanker reports a relationship with Pixium Vision that includes: consulting or advisory. Ted Kamins reports a relationship with Pixium Vision that includes: consulting or advisory. Daniel Palanker has patent licensed to Pixium Vision. If there are other authors, they declare that they have no known competing financial interests or personal relationships that could have appeared to influence the work reported in this paper.
Footnotes
CRediT authorship contribution statement
Mohajeet B. Bhuckory: Writing – review & editing, Writing – original draft, Visualization, Validation, Supervision, Project administration, Methodology, Investigation, Funding acquisition, Formal analysis, Data curation, Conceptualization. Bing-Yi Wang: Writing – original draft, Methodology, Investigation, Formal analysis, Data curation. Zhijie C. Chen: Writing – review & editing, Writing – original draft, Validation, Methodology, Investigation, Formal analysis, Data curation. Andrew Shin: Writing – original draft, Methodology, Data curation. Davis Pham-Howard: Data curation. Sarthak Shah: Data curation. Nicharee Monkongpitukkul: Data curation. Ludwig Galambos: Data curation. Theodore Kamins: Writing – review & editing, Supervision, Conceptualization. Keith Mathieson: Writing – review & editing, Supervision. Daniel Palanker: Writing – review & editing, Writing – original draft, Validation, Supervision, Resources, Project administration, Methodology, Investigation, Funding acquisition, Formal analysis, Conceptualization.
Appendix A. Supplementary data
Supplementary data to this article can be found online at https://doi.org/10.1016/j.biomaterials.2024.122674.
Data availability
Data will be made available on request.
References
- [1].Friedman DS, O’Colmain BJ, Muñoz B, Tomany SC, McCarty C, de Jong PTVM, Nemesure B, Mitchell P, Kempen J, Eye diseases prevalence research group, prevalence of age-related macular degeneration in the United States, Arch. Ophthalmol. Chic. Ill 122 (2004) 564–572, 10.1001/archopht.122.4.564, 1960. [DOI] [PubMed] [Google Scholar]
- [2].Wong WL, Su X, Li X, Cheung CMG, Klein R, Cheng C-Y, Wong TY, Global prevalence of age-related macular degeneration and disease burden projection for 2020 and 2040: a systematic review and meta-analysis, Lancet Global Health 2 (2014) e106–e116, 10.1016/S2214-109X(13)70145-1. [DOI] [PubMed] [Google Scholar]
- [3].Haim M, Epidemiology of retinitis pigmentosa in Denmark, Acta Ophthalmol. Scand (2002) 1–34. Suppl. [DOI] [PubMed] [Google Scholar]
- [4].Santos A, Humayun MS, de Juan E Jr., Greenburg RJ, Marsh MJ, Klock IB, Milam AH, Preservation of the inner retina in retinitis pigmentosa: a morphometric analysis, Arch. Ophthalmol 115 (1997) 511–515, 10.1001/archopht.1997.01100150513011. [DOI] [PubMed] [Google Scholar]
- [5].Kim SY, Sadda S, Humayun MS, de Juan E, Melia BM, Green WR, Morphometric analysis of the macula in eyes with geographic atrophy due to age-related macular degeneration, Retina Phila. Pa 22 (2002) 464–470, 10.1097/00006982-200208000-00011. [DOI] [PubMed] [Google Scholar]
- [6].Lorach H, Goetz G, Smith R, Lei X, Mandel Y, Kamins T, Mathieson K, Huie P, Harris J, Sher A, Palanker D, Photovoltaic restoration of sight with high visual acuity, Nat. Med 21 (2015) 476–482, 10.1038/nm.3851. [DOI] [PMC free article] [PubMed] [Google Scholar]
- [7].Ho E, Smith R, Goetz G, Lei X, Galambos L, Kamins TI, Harris J, Mathieson K, Palanker D, Sher A, Spatiotemporal characteristics of retinal response to network-mediated photovoltaic stimulation, J. Neurophysiol 119 (2018) 389–400, 10.1152/jn.00872.2016. [DOI] [PMC free article] [PubMed] [Google Scholar]
- [8].Ho AC, Humayun MS, Dorn JD, da Cruz L, Dagnelie G, Handa J, Barale P-O, Sahel J-A, Stanga PE, Hafezi F, Safran AB, Salzmann J, Santos A, Birch D, Spencer R, Cideciyan AV, de Juan E, Duncan JL, Eliott D, Fawzi A, Olmos de Koo LC, Brown GC, Haller JA, Regillo CD, Del Priore LV, Arditi A, Geruschat DR, Greenberg RJ, Argus II study group, long-term results from an epiretinal prosthesis to restore sight to the blind, Ophthalmology 122 (2015) 1547–1554, 10.1016/j.ophtha.2015.04.032. [DOI] [PMC free article] [PubMed] [Google Scholar]
- [9].Flourence M, Merlini F, Leffel A, Fossati M, Meddouri S, Carbone V, Benninghofen M, Studer F, Dollfus H, Gaucher D, Kirchhof B, Mura M, Fisher A, The use of dog guides for orientation and mobility by individuals with the argus II retinal prosthesis: a case series, J. Vis. Impair. Blind. (JVIB) 117 (2023) 375–379, 10.1177/0145482X231205581. [DOI] [Google Scholar]
- [10].Daschner R, Rothermel A, Rudorf R, Rudorf S, Stett A, Functionality and performance of the subretinal implant chip Alpha AMS, Sensor. Mater (2018) 179, 10.18494/SAM.2018.1726. [DOI] [Google Scholar]
- [11].Palanker D, Le Mer Y, Mohand-Said S, Muqit M, Sahel JA, Photovoltaic restoration of central vision in atrophic age-related macular degeneration, Ophthalmology 127 (2020) 1097–1104, 10.1016/j.ophtha.2020.02.024. [DOI] [PMC free article] [PubMed] [Google Scholar]
- [12].Palanker D, Le Mer Y, Mohand-Said S, Sahel JA, Simultaneous perception of prosthetic and natural vision in AMD patients, Nat. Commun 13 (2022), 10.1038/s41467-022-28125-x. [DOI] [PMC free article] [PubMed] [Google Scholar]
- [13].Flores T, Huang T, Bhuckory M, Ho E, Chen Z, Dalal R, Galambos L, Kamins T, Mathieson K, Palanker D, Honeycomb-shaped electro-neural interface enables cellular-scale pixels in subretinal prosthesis, Sci. Rep 9 (2019) 10657, 10.1038/s41598-019-47082-y. [DOI] [PMC free article] [PubMed] [Google Scholar]
- [14].Wang B-Y, Chen ZC, Bhuckory M, Goldstein AK, Palanker D, Pixel size limit of the PRIMA implants: from humans to rodents and back, J. Neural. Eng 19 (2022) 055003, 10.1088/1741-2552/ac8e31. [DOI] [PMC free article] [PubMed] [Google Scholar]
- [15].Bhuckory MB, Wang B-Y, Chen ZC, Shin A, Huang T, Galambos L, Vounotrypidis E, Mathieson K, Kamins T, Palanker D, Cellular migration into a subretinal honeycomb-shaped prosthesis for high-resolution prosthetic vision, Proc. Natl. Acad. Sci. USA 120 (2023) e2307380120, 10.1073/pnas.2307380120. [DOI] [PMC free article] [PubMed] [Google Scholar]
- [16].Palanker D, Huie P, Vankov A, Aramant R, Seiler M, Fishman H, Marmor M, Blumenkranz M, Migration of retinal cells through a perforated membrane: implications for a high-resolution prosthesis, Invest. Ophthalmol. Vis. Sci 45 (2004) 3266–3270, 10.1167/iovs.03-1327. [DOI] [PubMed] [Google Scholar]
- [17].Stamp MEM, Tong W, Ganesan K, Prawer S, Ibbotson MR, Garrett DJ, 3D diamond electrode array for high-acuity stimulation in neural tissue, ACS Appl. Bio Mater 3 (2020) 1544–1552, 10.1021/acsabm.9b01165. [DOI] [PubMed] [Google Scholar]
- [18].Seo HW, Kim N, Kim S, Fabrication of subretinal 3D microelectrodes with hexagonal arrangement, Micromachines 11 (2020) 467, 10.3390/mi11050467. [DOI] [PMC free article] [PubMed] [Google Scholar]
- [19].Djilas M, Olès C, Lorach H, Bendali A, Dégardin J, Dubus E, Lissorgues-Bazin G, Rousseau L, Benosman R, Ieng S-H, Joucla S, Yvert B, Bergonzo P, Sahel J, Picaud S, Three-dimensional electrode arrays for retinal prostheses: modeling, geometry optimization and experimental validation, J. Neural. Eng 8 (2011) 046020, 10.1088/1741-2560/8/4/046020. [DOI] [PubMed] [Google Scholar]
- [20].Bendali A, Rousseau L, Lissorgues G, Scorsone E, Djilas M, Dégardin J, Dubus E, Fouquet S, Benosman R, Bergonzo P, Sahel J-A, Picaud S, Synthetic 3D diamond-based electrodes for flexible retinal neuroprostheses: model, production and in vivo biocompatibility, Biomaterials 67 (2015) 73–83, 10.1016/j.biomaterials.2015.07.018. [DOI] [PubMed] [Google Scholar]
- [21].Yanovitch L, Raz-Prag D, Hanein Y, A new high-resolution three-dimensional retinal implant: System design and preliminary human results (2022), 10.1101/2022.09.14.507901, 2022.09.14.507901. [DOI]
- [22].Ryals RC, Andrews MD, Datta S, Coyner AS, Fischer CM, Wen Y, Pennesi ME, McGill TJ, Long-term characterization of retinal degeneration in royal College of Surgeons rats using spectral-domain optical coherence tomography, Invest. Ophthalmol. Vis. Sci 58 (2017) 1378–1386, 10.1167/iovs.16-20363. [DOI] [PMC free article] [PubMed] [Google Scholar]
- [23].Cavallotti C, Artico M, Pescosolido N, Feher J, Age-related changes in rat retina, Jpn. J. Ophthalmol 45 (2001) 68–75, 10.1016/s0021-5155(00)00294-x. [DOI] [PubMed] [Google Scholar]
- [24].Tan B, Barathi VA, Lin E, Ho C, Gan A, Yao X, Chan A, Wong DWK, Chua J, Tan GS, Schmetterer L, Longitudinal structural and microvascular observation in RCS rat eyes using optical coherence tomography angiography, Invest. Ophthalmol. Vis. Sci 61 (2020) 54, 10.1167/iovs.61.6.54. [DOI] [PMC free article] [PubMed] [Google Scholar]
- [25].Cavallotti C, Artico M, Pescosolido N, Leali FMT, Feher J, Age-related changes in the human retina, Can. J. Ophthalmol 39 (2004) 61–68, 10.1016/S0008-4182(04)80054-1. [DOI] [PubMed] [Google Scholar]
- [26].Eriksson U, Alm A, Macular thickness decreases with age in normal eyes: a study on the macular thickness map protocol in the Stratus OCT, Br. J. Ophthalmol 93 (2009) 1448–1452, 10.1136/bjo.2007.131094. [DOI] [PubMed] [Google Scholar]
- [27].Alamouti B, Funk J, Retinal thickness decreases with age: an OCT study, Br. J. Ophthalmol 87 (2003) 899–901. [DOI] [PMC free article] [PubMed] [Google Scholar]
- [28].Muqit MMK, Mer YL, Holz FG, Sahel JA, Long-term observations of macular thickness after subretinal implantation of a photovoltaic prosthesis in patients with atrophic age-related macular degeneration, J. Neural. Eng 19 (2022) 055011, 10.1088/1741-2552/ac9645. [DOI] [PMC free article] [PubMed] [Google Scholar]
- [29].Reichenbach A, Stolzenburg J-U, Eberhardt W, Chao TI, Dettmer D, Hertz L, What do retinal Müller (glial) cells do for their neuronal ‘small siblings’? J. Chem. Neuroanat 6 (1993) 201–213, 10.1016/0891-0618(93)90042-3. [DOI] [PubMed] [Google Scholar]
- [30].Ho E, Lei X, Flores T, Lorach H, Huang T, Galambos L, Kamins T, Harris J, Mathieson K, Palanker D, Characteristics of prosthetic vision in rats with subretinal flat and pillar electrode arrays, J. Neural. Eng 16 (2019) 066027, 10.1088/1741-2552/ab34b3. [DOI] [PMC free article] [PubMed] [Google Scholar]
- [31].Eye Disease Statistics, Am. Acad. Ophthalmol https://www.aao.org/education/clinical-statement/eye-disease-statistics-2, 2014. (Accessed 1 May 2024). [Google Scholar]
- [32].Huang TW, Kamins TI, Chen ZC, Wang B-Y, Bhuckory M, Galambos L, Ho E, Ling T, Afshar S, Shin A, Zuckerman V, Harris JS, Mathieson K, Palanker D, Vertical-junction photodiodes for smaller pixels in retinal prostheses, J. Neural. Eng 17 (2021). [DOI] [PMC free article] [PubMed] [Google Scholar]
- [33].Lorach H, Goetz G, Mandel Y, Lei X, Galambos L, Kamins TI, Mathieson K, Huie P, Dalal R, Harris JS, Palanker D, Performance of photovoltaic arrays in-vivo and characteristics of prosthetic vision in animals with retinal degeneration, Vision Res 111 (2015) 142–148, 10.1016/j.visres.2014.09.007. [DOI] [PMC free article] [PubMed] [Google Scholar]
- [34].Schindelin J, Arganda-Carreras I, Frise E, Kaynig V, Longair M, Pietzsch T, Preibisch S, Rueden C, Saalfeld S, Schmid B, Tinevez J-Y, White DJ, Hartenstein V, Eliceiri K, Tomancak P, Cardona A, Fiji: an open-source platform for biological-image analysis, Nat. Methods 9 (2012) 676–682, 10.1038/nmeth.2019. [DOI] [PMC free article] [PubMed] [Google Scholar]
- [35].Hanson AJ, The rolling ball, in: Graph. Gems III, Academic Press Professional, Inc., USA, 1992, pp. 51–60. [Google Scholar]
Associated Data
This section collects any data citations, data availability statements, or supplementary materials included in this article.
Supplementary Materials
Data Availability Statement
Data will be made available on request.


