

Abstract
Using lattice models we explore the factors that determine the tendencies of polypeptide chains to aggregate by exhaustively sampling the sequence and conformational space. The morphologies of the fibril-like structures and the time scales for their formation depend on a balance between hydrophobic and Coulomb interactions. The extent of population of an ensemble of structures, which are fibril-prone structures in the spectrum of conformations of an isolated protein, is the major determinant of . This observation is used to determine the aggregating sequences by exhaustively exploring the sequence space, thus providing a basis for genome wide search of fragments that are aggregation prone.
Proteins that are unrelated by sequence or structure aggregate to form amyloidlike fibrils with a characteristic cross structures [1(a)]. The observation that almost any protein could form fibrils seemed to imply that fibril rates can be predicted solely based on sequence composition and the propensity to adopt global secondary structure. Such a conclusion has limited validity because it does not account for fluctuations that populate aggregation-prone structures. Despite the common structural characteristics of amyloid fibrils [1] the factors that determine the fibril formation tendencies are not understood.
Experiments on fibril formation times have been rationalized using global factors such as the hydrophobicity of side chains [2(a)], net charge [2(b),2(c)], patterns of polar and nonpolar residues [2(d)], frustration in secondary structure elements [2(e),2(f)], and aromatic interactions [2(g)]. However, the inability to sample the sequences and conformational spaces exhaustively [3] has prevented deciphering plausible general principles that govern protein aggregation. Here, we obtain a quantitative correlation between intrinsic properties of polypeptide sequences and their fibril growth rates using lattice models, which have given remarkable insights into the general principles of protein folding and aggregation [4]. Using a modification of the model in [5] we explore the sequencedependent variations of on the nature of conformations explored by the monomer. We highlight the role of aggregation-prone ensemble of structures [6] in the folding landscape of the monomer in determining and the propensity of sequences to form fibrils
Lattice model.—
We use a lattice model [5] in which each chain consists of connected beads that are confined to the vertices of a cube. The simulations are done using identical chains with . The peptide sequence which is used to illustrate the roles of electrostatic and hydrophobic interaction is (Fig. 1), where , , + and − are hydrophobic, polar, positively charged and negatively charged beads, respectively, [5].
FIG. 1.
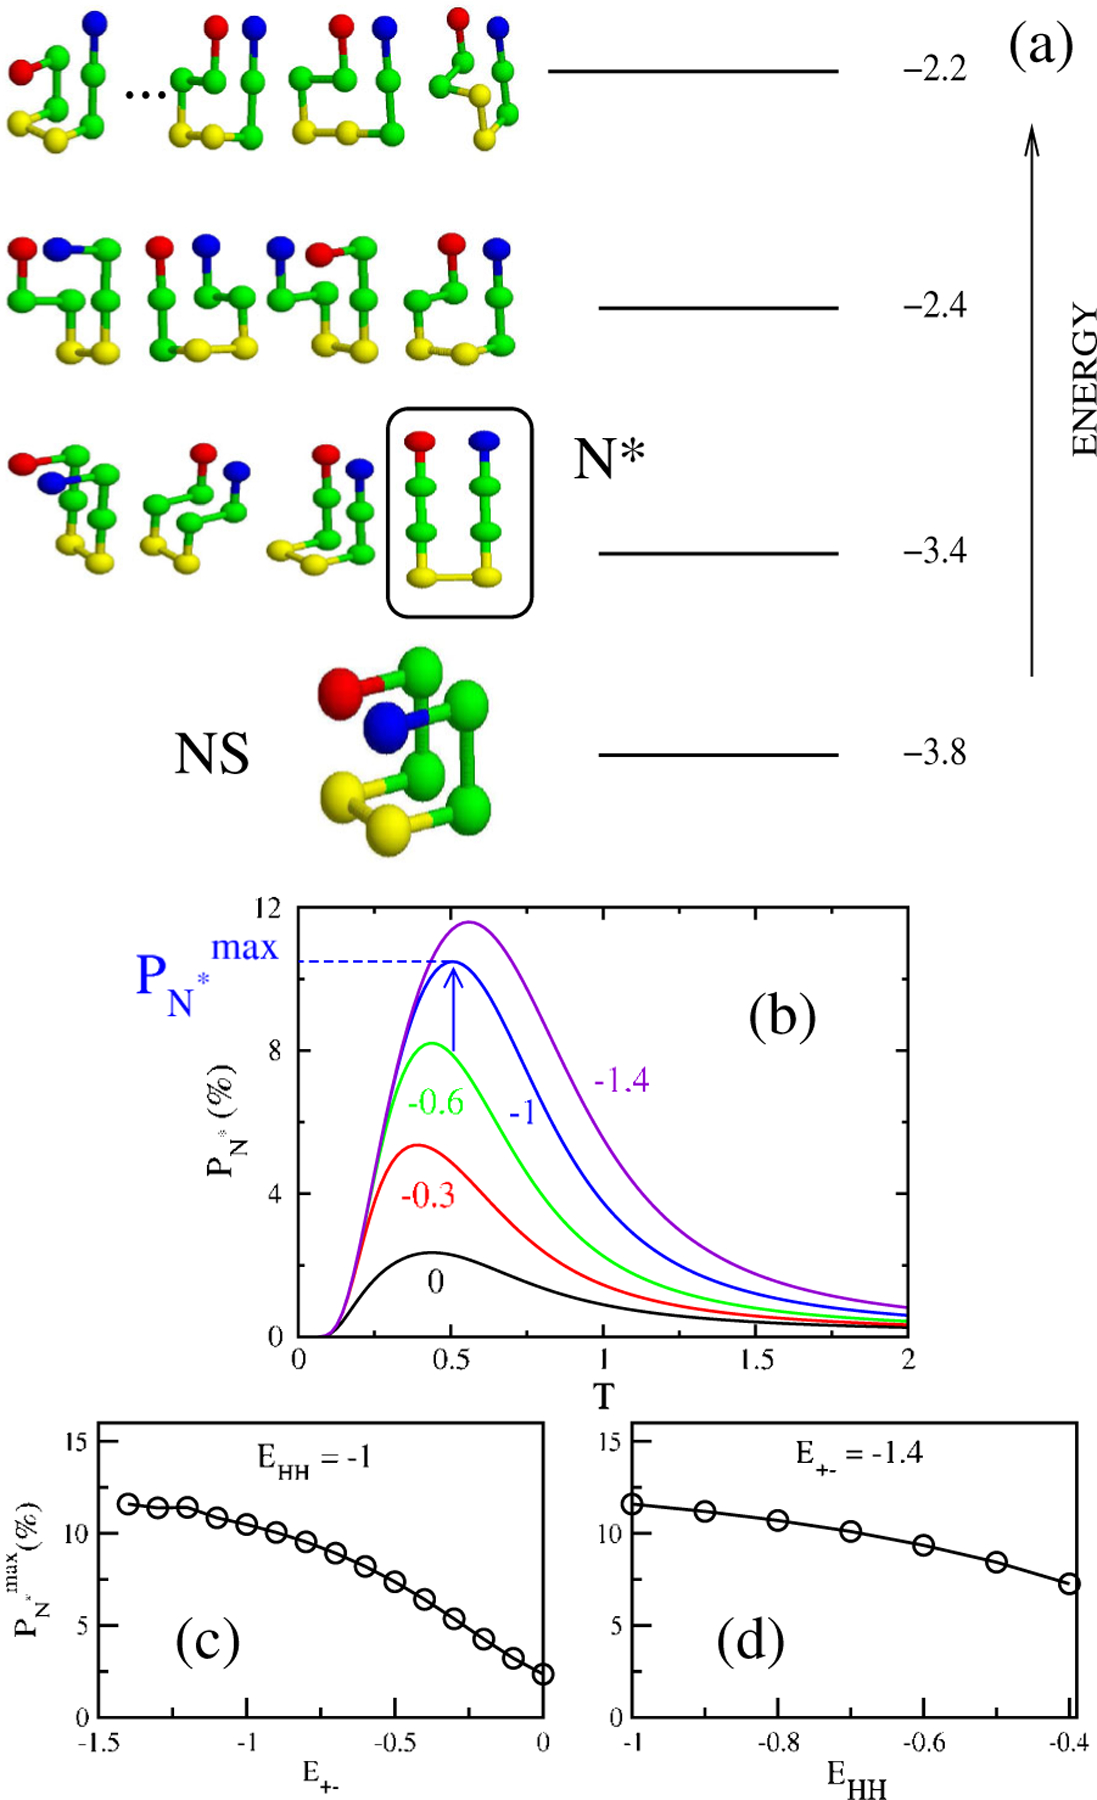
(a) Spectrum of energies and low energy structures of the monomer sequence , , , + and − are in green, yellow, blue, and red, respectively. We set and . There are 1831 possible conformations that are spread among 17 possible energy values. The conformations in the first excited state represent the ensemble of structures and the conformation that coincides with the peptide state in the fibril [see Fig. 2(a)] is enclosed in a box. (b) The probability of populating the structure in the box in (a) as a function of for and −1.4 keeping . The arrow indicates , where . Dependence of on for (c), and on for (d).
The energy of chains is [5] , where is the distance between residues and , is a lattice spacing, indicates the type of residue from th peptide, and and zero, otherwise. The first and second terms represent intrapeptide and interpeptide interactions, respectively.
The propensity of polar and charged residues to be “solvated” is mimicked using (in the units of hydrogen bond energy ), where , or −. To assess the importance of electrostatic and hydrophobic interactions, we vary either in the interval or between −1 and 0. If is varied, we set , while if is varied, then . We used and all other contact interactions have .
Monomer spectra depends on and .—
The spectrum of energy states of the monomer for a given sequence is determined by exact enumeration of all possible conformations (Fig. 1). For all sets of contact energies the native state (NS) of the monomer is compact [lowest-energy conformation in Fig. 1(a)]. For , the ensemble of structures are the first excited state [Fig. 1(a)]. However, if , the ensemble of structures are part of the 19 -fold degenerate states in the second excited state [see supplementary information (SI) [7], Fig. 1].
The population of the putative fibril-prone conformation in the monomeric state is , where , the partition function is obtained by exact enumeration. Figure 1(b), shows the temperature dependence of for various values of interaction, with and other contact energies constant. Depending on , the maximum value of varies from [Fig. 1(c)]. decreases to a lesser extent as the hydrophobic interaction grows [Fig. 1(d)]. Here we consider only because the fibril-like structure is not the lowest-energy when .
Morphology of lowest-energy structures of multichain systems depends on sequences.—
When multiple chains are present in the unit cell, aggregation is readily observed, and in due course they lead to ordered structures. We used the Monte Carlo (MC) [5] annealing protocol, which allows for an exhaustive conformational search, to find the lowest-energy conformation. For nonzero values of the chains adopt an antiparallel arrangement in the ordered protofilament, which ensures that the number of salt-bridge and hydrophobic contacts are maximized [Fig. 2(a)]. If then the lowest-energy fibril structure has a vastly different architecture even though they are assembled from [Fig. 2(b)]. The structure in Fig. 2(b), in which a pair of conformations are stacked by flipping one with respect to the other is rendered stable by maximizing the number of and contacts. We now set and vary . For , the fibril conformation adopts the same shape as that shown in Fig. 2(a), but for the energetically more favorable double-layer structure emerges [Fig. 2(c)]. If , then the lowest-energy conformation ceases to have the fibril-like shape [Fig. 2(d)]. The close packed heterogenous structure is stitched together by a mixture of the NS conformation and one of the second excited conformations. Even for this simple model a variety of lowest-energy structures of oligomers and protofilaments with different morphologies emerge, depending on a subtle balance between electrostatic and hydrophobic interactions.
FIG. 2.
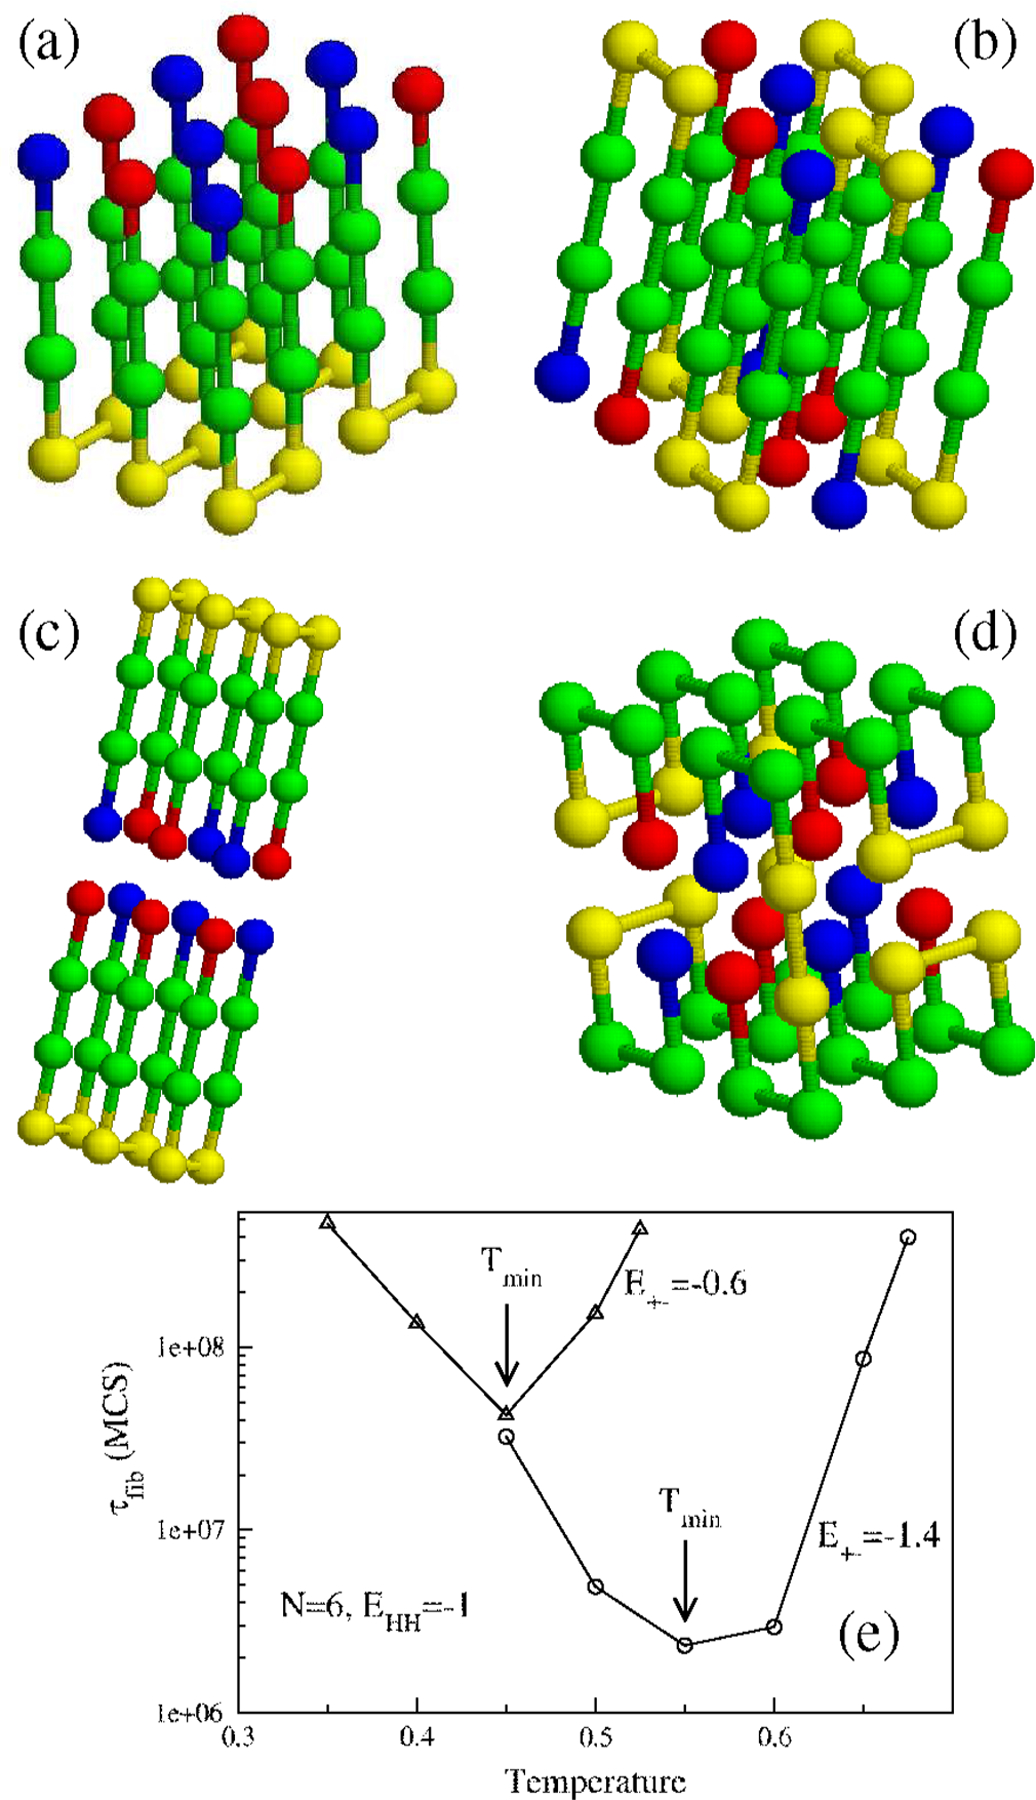
(a) The lowest-energy fibril structure for and . (b) Same as in (a) but with . (c) Double-layer structure for but with . (d) For and the fibril structure is entirely altered. (e) Temperature dependence of for (circles) and (triangles). and . Arrows show the temperatures at which the fibril formation is fastest.
Dependence of on and .—
Simulations were performed by enclosing chains in a box with periodic boundary conditions and move sets described in Ref. [5]. The effect of finite size is discussed in the SI, Fig. 2. The fibril formation time is defined as an average of first passage times needed to reach the fibril state with the lowest energy starting from initial random conformations. For a given value of , we generated 50–100 MC trajectories to compute . We measure time in units of a Monte Carlo step (MCS), which is a combination of local and global moves.
We performed an exhaustive study of the dependence of on the number of chains in the simulation box, (SI, Fig. 2). For highly favorable interaction between the terminal charged residues, , scales linearly with the size of the system [SI, Fig. 2(a)], while for less favorable interactions, and −0.8, scales linearly with the size of the system (SI, Fig. 2(b)]. The temperature dependence of displays a shape [Fig. 2(e)] and the fastest assembly occurs at , which roughly coincides with the temperature, , where reaches maximum [Fig. 1(b)]. To probe the correlation between and and we performed simulations at . The dependence of on can be fit using where and the constant and 9.23 for and 10 , respectively, [Fig. 3(a)]. Thus, variation of drastically changes not only the morphology of the ordered protofilament (Fig. 2), but also . As the strength of the charge interaction between the terminal beads increases, the faster is the fibril formation process. Interestingly, the fibril formation rate at is about 4 orders of magnitude slower than that at . The propensity to fibril assembly strongly depends on the charge states of the polypeptide sequences [1(b)].
FIG. 3.
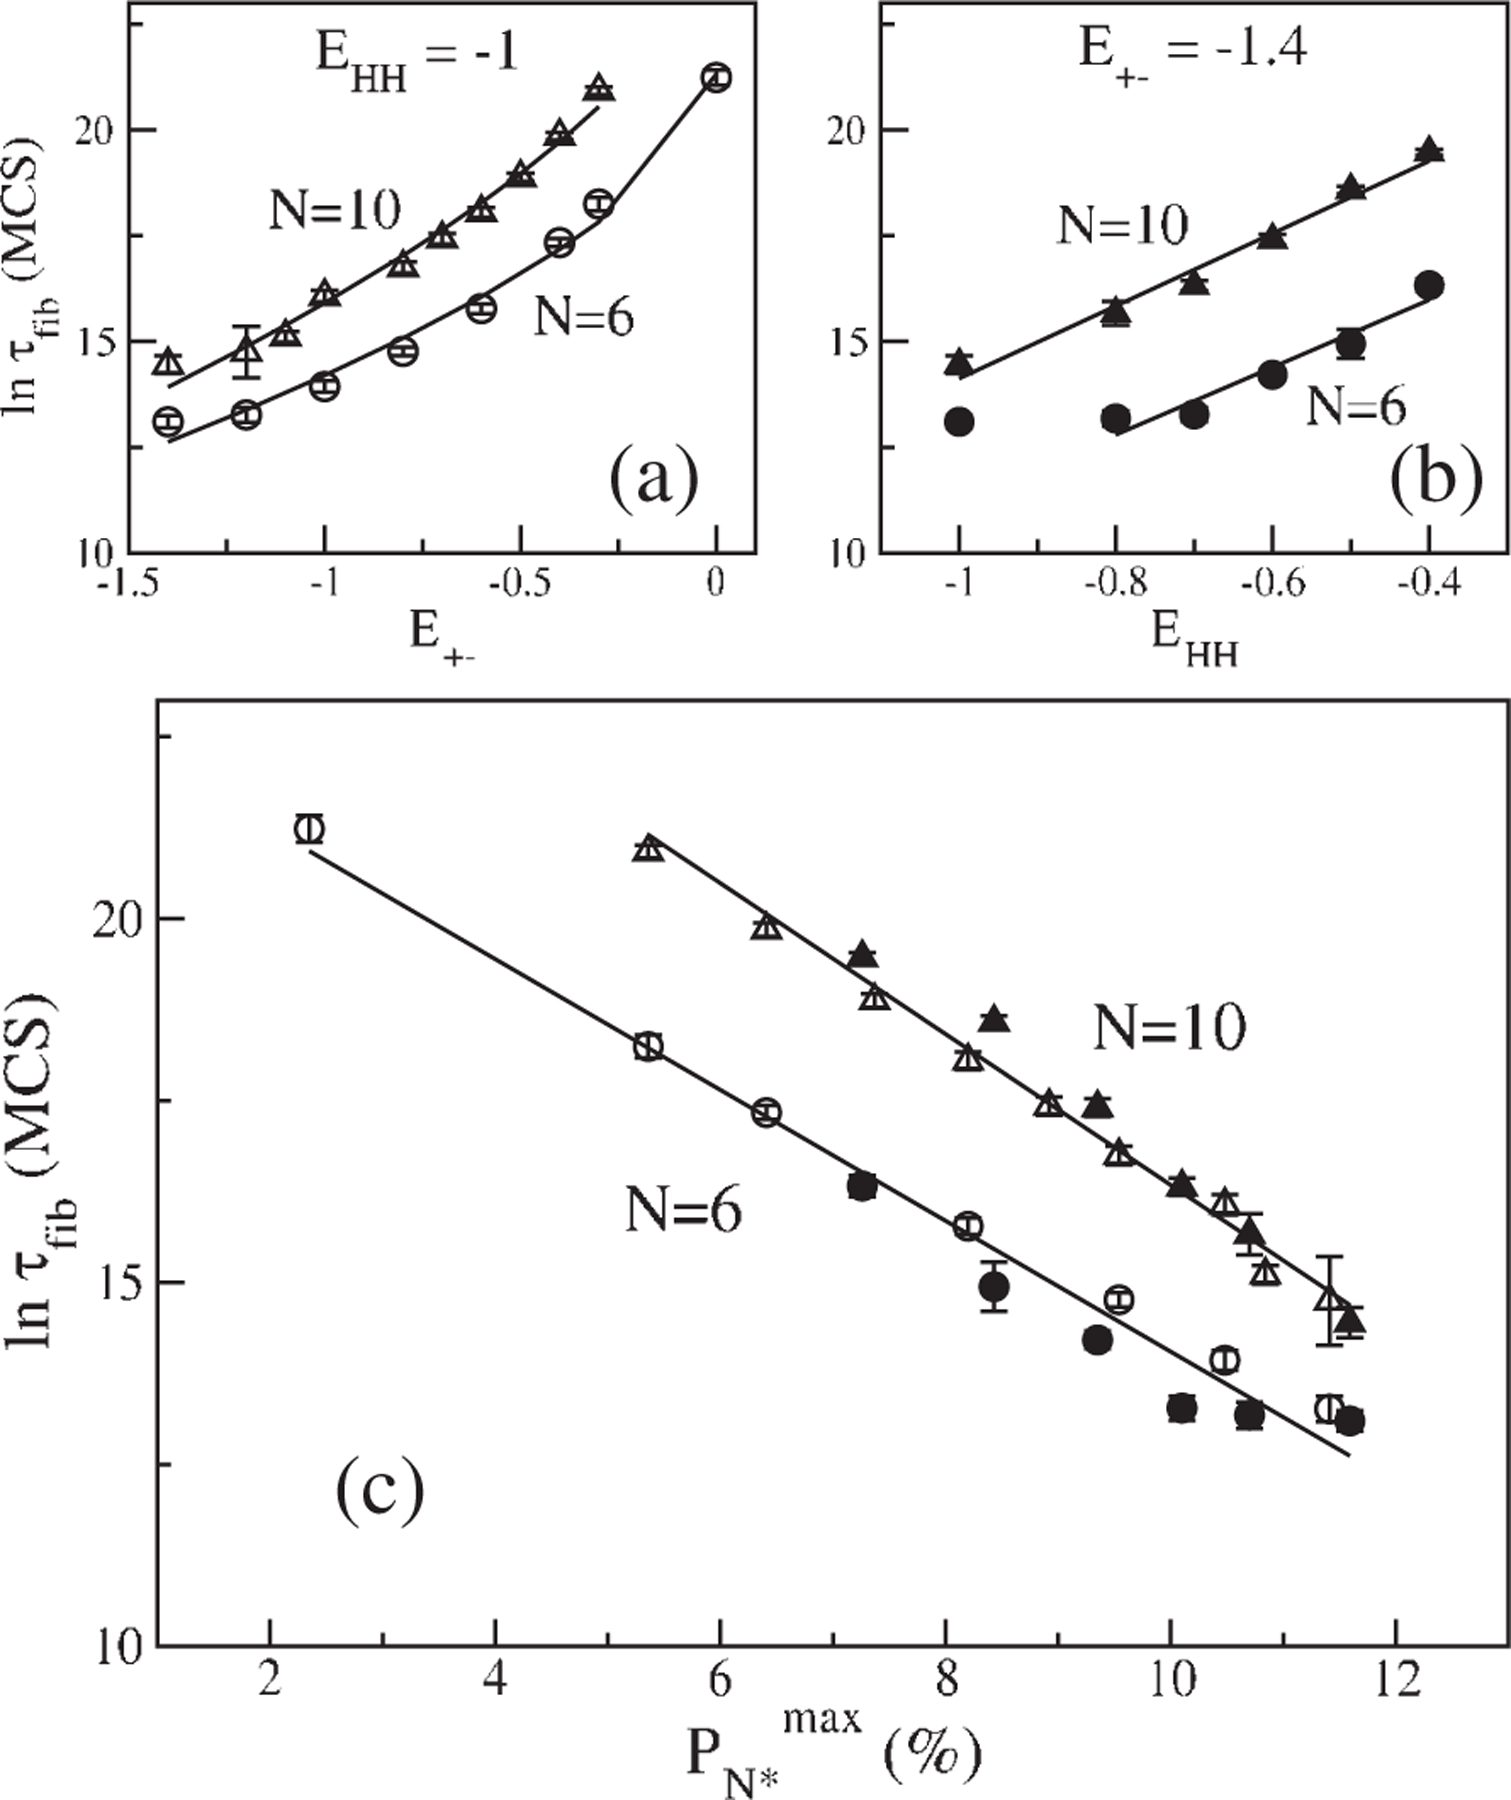
(a) Dependence of on for (circles) and (triangles) with . The solid curves are fits to , where . and and and for and 10 , respectively. (b) Dependence of on with hold constant for (solid circle) and (solid triangles). Lines are fits and for and 10 , respectively. For the first point is excluded from fitting. (c) Dependence of on for and 10 . Symbols are the same as in (a) and (b) is measured in MCS and in percent. The correlation coefficient for all fits .
By fixing we calculated the dependence of on the hydrophobic interaction [Fig. 3(b)], which may be approximated using . Here constant and 8.56 for and 10 , respectively. For , a change in hydrophobicity of , leads to self-assembly rates that are more than 2 orders of magnitude. Thus, enhancement of hydrophobic interactions speeds up fibril formation rates [1,8].
Fibril formation rates depend on .—
A plot of the data in Figs. 3(a) and 3(b) as a function of [Fig. 3(c)] yields the surprising relation
| (1) |
where the prefactor MCS and MCS, and and 1.0 , for and 10, respectively. Equation (1) is also valid for three other degenarate conformations in the ensemble, which are structurally similar to the one enclosed in the box in Fig. 1(a). There are a few implications of the central result given in Eq. (1). (i) The sequence-dependent spectrum of the monomer is a harbinger of fibril formation. In proteins there are multiple conformations corresponding to distinct free energy basins of attraction [6(b)]. Aggregation from each of the structures in the various basins of attraction could lead to fibrils with different morphologies (polymorphism) that cannot be captured using lattice models. (ii) Enhancement of either by mutation or chemical cross linking should increase fibril formation rates. Indeed, a recent experiment [9] showed that the aggregation rate of , in which the residues and are chemically constrained by a lactam bridge, is nearly a 1000 times greater than in the wild-type. Since the salt-bridge constraint increases the population of the conformation in the monomeric state [10], it follows from Eq. (1), should decrease. (iii) Since depends on the spectrum of the precise sequence for a given set of external conditions, it follows that the entire free energy landscape of the monomer [6(b)] and not merely the sequence composition as ascertained else where [1(b)], should be considered in the predictions of the amyloidogenic tendencies. (iv) Eq. (1) is suggestive of a fluctuation-driven nucleation mechanism with a complicated temperature dependence. (v) Finally, as a negative control, plots of as a function of , where represents a conformation from the second or the third excited state (SI, Fig. 3) show that Eq. (1) does not hold for these structures.
Sequence space scanning.—
We use Eq. (1) to determine the amylome [11], the universe of sequences in the lattice model, that can form fibrils. We posit that aggregation-prone sequences are those with a unique native state with a maximum in in the interval . If , which is physically reasonable, if . Thus, for values of would be far too high to be physically relevant. Our conclusions will not change by increasing or alternatively by choosing a reasonable threshold value for . Out of the 65536 sequences only 217 satisfy these criteria (see supplementary information for details [7] ). The sequence space exploration shows that there is a high degree of correlation between the positions of charged and hydrophobic residues leading to a limited number of aggregation-prone sequences with being an example. In addition, there are substantial variations in for sequences with identical sequence composition, which reinforces the recent finding [11] that context in which charged and hydrophobic residues are found is important in the tendency to form amyloidlike fibrils. Our study also provides a basis for genome wide search for consensus sequences with propensity to aggregate.
Supplementary Material
Acknowledgments
The work was supported by the Ministry of Science and Informatics in Poland (grant No 202-204-234), grants NSC 96-2911-M 001-003-MY3 & AS-95-TP-A07, National Center for Theoretical Sciences in Taiwan, NIH Grant R01GM076688-05, and Department of Science and Technology of Ho Chi Minh City, Vietnam.
References
- [1].(a) Chiti F and Dobson CM, Annu. Rev. Biochem 75, 333 (2006); [DOI] [PubMed] [Google Scholar]; (b) Chiti F, Stefani M, Taddei N, Ramponi G, and Dobson CM, Nature (London) 424, 805 (2003). [DOI] [PubMed] [Google Scholar]
- [2].(a) Otzen DE, Kristensen O, and Oliveberg M, Proc. Natl. Acad. Sci. U.S.A. 97, 9907 (2000); [DOI] [PMC free article] [PubMed] [Google Scholar]; (b) Massi F, Klimov D, Thirumalai D, and Straub JE, Prot. Sci. 11, 1639 (2002); [DOI] [PMC free article] [PubMed] [Google Scholar]; (c) Chiti F, Calamai M, Taddei N, Stefani M, Ramponi G, and Dobson CM, Proc. Natl. Acad. Sci. U.S.A. 99, 16419 (2002); [DOI] [PMC free article] [PubMed] [Google Scholar]; (d) West MW, Wang WX, Patterson J, Mancias JD, Beasley JR, and Hecht MH, Proc. Natl. Acad. Sci. U.S.A. 96, 11211 (1999); [DOI] [PMC free article] [PubMed] [Google Scholar]; (e) Kallberg Y, Gustafsson M, Persson B, Thyberg J, and Johansson J, J. Biol. Chem. 276, 12945 (2001); [DOI] [PubMed] [Google Scholar]; (f) Dima RI and Thirumalai D, Biophys. J. 83, 1268 (2002); [DOI] [PMC free article] [PubMed] [Google Scholar]; (g) Gazit E, FASEB monographs 16, 77 (2002). [DOI] [PubMed] [Google Scholar]
- [3].(a) Klimov DK and Thirumalai D, Structure 11, 295 (2003); [DOI] [PubMed] [Google Scholar]; (b) Bellesia G and Shea JE, Biophys. J. 96, 875 (2009); [DOI] [PMC free article] [PubMed] [Google Scholar]; (c) de la Paz ML, de Mori GMS, Serrano L, and Colombo G, J. Mol. Biol 349, 583 (2005); [DOI] [PubMed] [Google Scholar]; (d) Li DW, Mohanty S, Irback A, and Huo SH, PLoS Comput. Biol 4, e1000238 (2008). [DOI] [PMC free article] [PubMed] [Google Scholar]
- [4].(a) Klimov DK and Thirumalai D, J. Chem. Phys. 109, 4119 (1998); [Google Scholar]; (b) Shakhnovich E, Chem. Rev 106, 1559 (2006); [DOI] [PMC free article] [PubMed] [Google Scholar]; (c) Gupta P, Hall CK, and Voegler AC, Protein Sci 7, 2642 (1998); [DOI] [PMC free article] [PubMed] [Google Scholar]; (d) Dima RI and Thirumalai D, Protein Sci 11, 1036 (2002); [DOI] [PMC free article] [PubMed] [Google Scholar]; (e) Maiti M, Rao M, and Sastry S, Eur. Phys. J. E 32, 217 (2010); [DOI] [PubMed] [Google Scholar]; Cieplak M, Hoang TX, and Li MS, Phys. Rev. Lett 83, 1684 (1999); [Google Scholar]; Li MS, Klimov DK, and Thirumalai D, Phys. Rev. Lett 93, 268107 (2004); [DOI] [PubMed] [Google Scholar]; Li MS and Cieplak M, Phys. Rev. E 59, 970 (1999); [Google Scholar]; Kouza M, Li MS, O’Brien EP, Hu C-K, and Thirumalai D, J. Phys. Chem. A 110, 671 (2006). [DOI] [PubMed] [Google Scholar]
- [5].Li MS, Klimov DK, Straub JE, and Thirumalai D, J. Chem. Phys 129, 175101 (2008). [DOI] [PMC free article] [PubMed] [Google Scholar]
- [6].(a) Thirumalai D, Dima RI, and Klimov DK, Curr. Opin. Struct. Biol 13, 146 (2003); [DOI] [PubMed] [Google Scholar]; (b) Tarus B, Straub JE, and Thirumalai D, J. Am. Chem. Soc 128, 16159 (2006). [DOI] [PubMed] [Google Scholar]
- [7].See supplementary material at http://link.aps.org/supplemental/10.1103/PhysRevLett.105.218101. [Google Scholar]
- [8].Bowerman CJ, Ryan DM, Nissan DA, and Nilsson BL, Mol. Biosyst. 5, 1058 (2009). [DOI] [PubMed] [Google Scholar]
- [9].Sciarretta K, Gordon D, Petkova A, Tycko A, and Meredith S, Biochemistry 44, 6003 (2005). [DOI] [PubMed] [Google Scholar]
- [10].Reddy G, Straub JE, and Thirumalai D, J. Phys. Chem. B 113, 1162 (2009). [DOI] [PMC free article] [PubMed] [Google Scholar]
- [11].Goldschmidt L, Teng PK, Riek R, and Eisenberg D, Proc. Natl. Acad. Sci. U.S.A. 107, 3487 (2010). [DOI] [PMC free article] [PubMed] [Google Scholar]
Associated Data
This section collects any data citations, data availability statements, or supplementary materials included in this article.