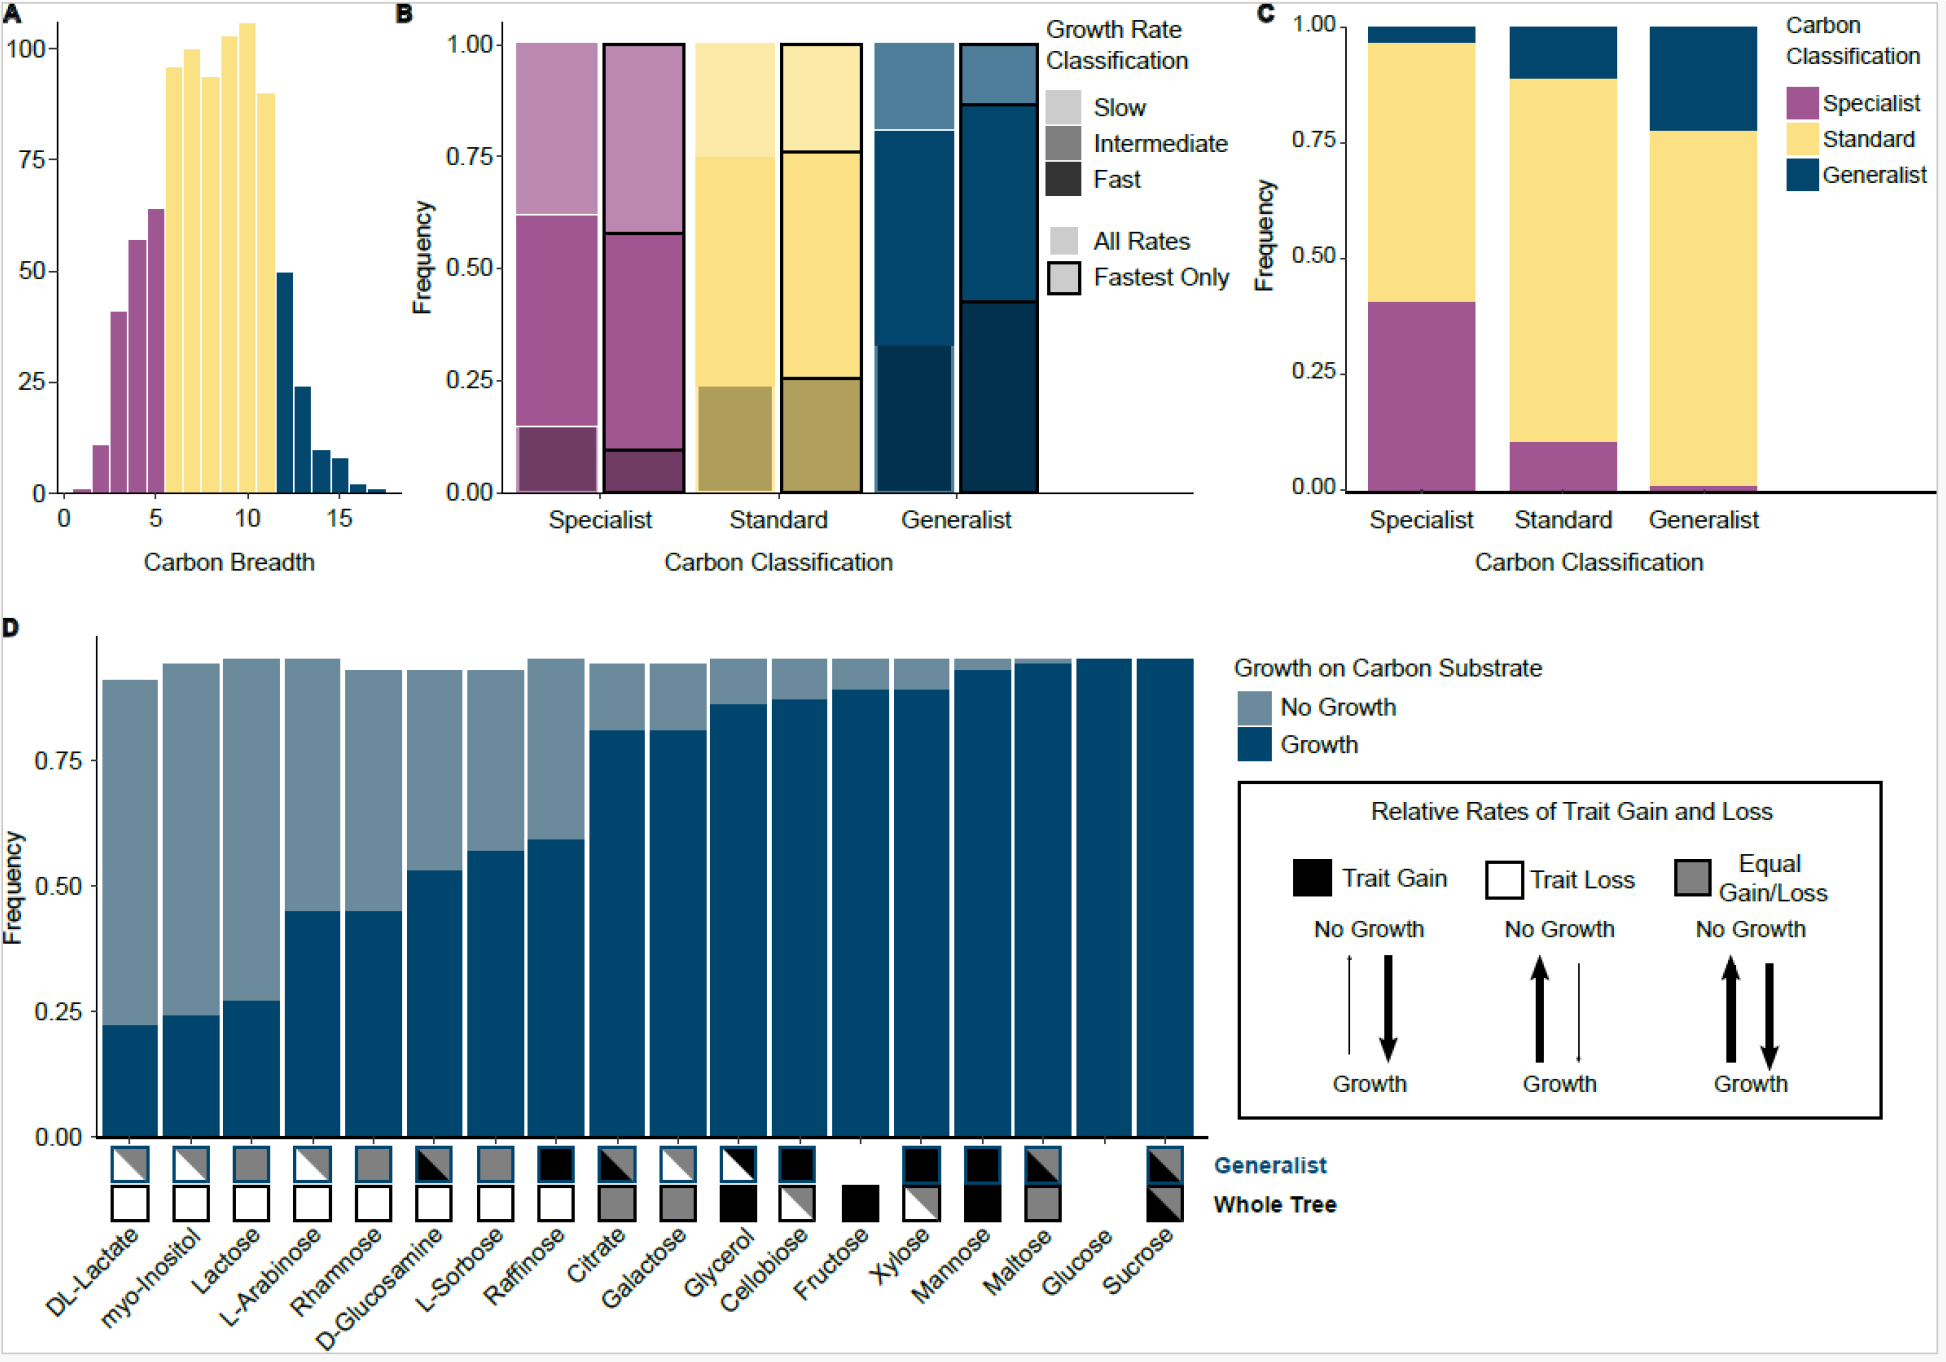
Figure 3: Carbon specialists and generalists differ in nitrogen breadth, growth rate, and evolutionary history.

A. Histogram of carbon niche breadth across yeasts (n = 853). The colors of the bars represent the ranges for the different carbon classifications. Metabolic classifications were determined by permuting the binary carbon growth matrix (n = 1000 permutations). To determine the metabolic strategy of a yeast, we calculated the observed and expected (permuted) breadth for each yeast and calculated the binomial confidence intervals to determine significant differences in breadth. Generalists had a significantly larger carbon niche breadth than expected by chance, and specialists had a significantly smaller carbon niche breadth. If a yeast was not classified as either a generalist or a specialist, it was classified as standard.
B. The growth rates for each yeast on each of the 18 carbon sources were categorized as slow (bottom 25%), intermediate (median 50%), or fast (top 25%) using either all the rates per yeast (white outline) or only the highest rate per yeast (black outline). Carbon generalists had the highest proportion of fast growth rates (33% all rates, 43% fastest rates), while specialists had the smallest proportion (15% all rates, 9% fastest rates) The inverse was also true, with carbon generalists having the smallest proportion of slow growth rates (19% all rates, 14% fastest rates) and carbon specialists having the highest proportion of slow growth rates (38% all rates, 42% fastest rates).
C. Stacked bar graph of carbon metabolic strategies within each nitrogen metabolic strategy.
D. Carbon generalists shared many of the same growth traits: 10 out of 18 growth traits were found in more than 75% of generalists. Many of the carbon sources had different evolutionary trends in a generalist background as compared to across the whole tree. Three different evolutionary models are shown: trait gain (black), trait loss (white), and equal rates of trait gain and loss (gray). No box indicates that the trait was not co-evolving with background or across the tree. More than one evolutionary model is shown in cases where the reverse jump model spent 75% or less of the time on a single model. For example, the model testing correlated evolution between growth on D-glucosamine and generalist carbon classification reported a model string with a greater rate of gain in 55% of the run and a model string with equal rates of gain and loss in 29% of the run; therefore, we reported both the trait gain and equal gain/loss model in the generalist analysis.
