

Abstract
Various erythropoietic abnormalities are highly prevalent among patients with pulmonary arterial hypertension (PAH) and associated with worse disease severity. Given the poorly understood yet important roles of dysregulated erythropoiesis and iron metabolism in PAH, we sought to further characterize the hematologic and iron profiles in PAH and their relationship to PAH severity. We recruited 67 patients with PAH and 13 healthy controls. Hemodynamics attained within 1 year of blood sample collection were available for 36 patients. Multiple hematologic, iron, and inflammatory parameters were evaluated for their association with hemodynamics. The subset with hemodynamic data consisted of 29 females (81%). The most common etiologies were idiopathic PAH (47%) and connective tissue disease‐related PAH (33%). 19 (53%) had functional class 3 or 4 symptomatology, and 12 (33%) were on triple pulmonary vasodilator therapy. Immature reticulocyte fraction (IRF) had significant positive correlations with mean pulmonary artery (PA) pressure (mPAP) (0.59, p < 0.001), pulmonary vascular resistance (0.52, p = 0.001), and right atrial pressure (0.46, p = 0.005), and significant negative correlations with cardiac index (−0.43, p = 0.009), PA compliance (PAC) (−0.60, p < 0.001), stroke volume index (SVI) (−0.57, p < 0.001), and mixed venous oxygen saturation (−0.51, p = 0.003). IRF correlated with markers of iron deficiency (ID) and erythropoiesis. On multivariable linear regression, IRF was associated with elevated mPAP and reduced SVI and PAC independent of EPO levels, transferrin saturation, and soluble transferrin receptor levels. We identified IRF as a novel and potent biomarker of PAH hemodynamic severity, possibly related to its associations with erythropoiesis, ID, and tissue hypoxia.
Keywords: erythropoiesis, iron deficiency, pulmonary hypertension, red blood cell indices
INTRODUCTION
Pulmonary arterial hypertension (PAH) is characterized by progressive pulmonary vascular remodeling, with a natural course that leads to right ventricular failure and premature death. 1 , 2 Multiple hematologic abnormalities, 3 particularly iron deficiency (ID) and increased red blood cell distribution width (RDW), have been identified in patients with PAH and are associated with worse outcomes. Iron is an essential trace mineral that plays critical roles in systemic oxygen delivery and normal cellular function. 4 ID is highly prevalent among patients with PAH 5 , 6 , 7 , 8 , 9 , 10 and is associated with disease severity and increased mortality among patients with idiopathic PAH 5 , 6 , 7 , 9 and systemic sclerosis associated PAH, 10 regardless of the presence of anemia. Similar results have been demonstrated in patients with pulmonary hypertension (PH) secondary to chronic lung disease (Group 3 PH) 11 and in left ventricular failure (Group 2 PH). 12 , 13 Increased RDW has also been found to be associated with the development of PH in patients with high‐risk conditions, such as connective tissue disease (CTD) and chronic lung disease, and with worse outcomes among those who do develop PH. 3 , 14 , 15 , 16 , 17 , 18 , 19
Despite the significant associations between these hematologic parameters and PH severity, the pathophysiologic mechanisms linking iron metabolism and dysregulated erythropoiesis to PH pathogenesis remain poorly understood. While ID occurs as a consequence of PH due to inflammation, decreased gut iron absorption, and potentially altered Bone Morphogenetic Protein signaling, 20 ID itself has been shown to directly contribute to pulmonary vasculopathy. 21 , 22 In a transgenic mouse model characterized by polycythemia and associated increased iron utilization, the resulting ID leads to the development of PH through increased levels of hypoxia inducible factor (HIF)‐2α and endothelin‐1, 23 a potent vasoconstrictor. 24 A second murine study found that rats with ID spontaneously develop PH in association with increased HIF‐2α levels, 22 and iron supplementation is able to reverse these pathologic pulmonary vascular remodeling changes.
RDW, a measure of the variation of erythrocyte size and volume, has also been linked to adverse outcomes in PH and heart failure. 14 , 17 , 18 , 25 , 26 It is hypothesized that RDW serves as an integrative measure of multiple processes that could contribute to worse outcomes, including inflammation, nutritional deficiency, and dysfunctional erythropoiesis. 17 The existing literature shows mixed data about the correlation between PAH and RDW values. One study found a significant correlation between hemodynamic severity and elevated RDW in Group I PAH, 27 but other larger studies have failed to replicate these findings. 14 , 17 Outside of Group 1 patients, RDW has been linked to hemodynamic severity in a mixed cohort of PH patients, showing a stronger correlation of RDW with precapillary PH as compared to those with combined pre‐ and postcapillary PH or with purely postcapillary PH. 18 In Group 4 PH patients, i.e. those with chronic thromboembolic PH, RDW values were significantly higher than healthy controls (HCs) and correlated with pulmonary vascular resistance (PVR) and cardiac index (CI). 28
Given the significant relationship between PAH and ID, The European Society of Cardiology/European Respiratory Society (ESC/ERS) guidelines recommend regular monitoring of iron status in PAH patients and repletion in those with severe ID anemia. 29 While preliminary studies demonstrated an improvement in 6‐min walk distance 30 , 31 and markers of right ventricular function 31 with oral iron repletion, and in exercise endurance, diffusion capacity for carbon monoxide (DLCO), 32 and quality of life with intravenous iron repletion in ID PAH patients, 6 , 33 a recent randomized, double‐blind, placebo‐controlled trial failed to demonstrate clinical benefit. 34 The lack of a standardized diagnostic method for diagnosing ID in PAH 20 may contribute to these mixed outcomes after iron repletion in PH. An important distinction between absolute ID and functional ID is the presence of chronic inflammation, 20 which upregulates ferritin levels and leads to the retention of iron in the mononuclear phagocyte system, thereby limiting its availability for erythropoiesis despite increased storage levels. 9 In addition, transferrin is a reverse acute phase reactant, thus its decrease during chronic inflammation may contribute to a falsely elevated transferrin saturation (TSAT). 35 , 36 These limitations on the clinical use of traditional iron status parameters necessitate more specific biomarkers that reflect iron and erythropoietic dysregulation in PAH patients. We therefore sought to evaluate the relationship between different markers of ID and erythropoiesis, and PAH hemodynamic severity. In addition to the more commonly referenced hematologic parameters of RDW, erythropoietin (EPO), TSAT, and soluble transferrin receptor (sTfR), we examined the immature reticulocyte fraction (IRF) as a marker of accelerated erythropoiesis. In a cohort of Group 1 patients, our study has identified the IRF as a novel biomarker of hemodynamic severity in PAH.
METHODS
Patient selection
We recruited 67 patients with PAH and 13 HC for participation. Our HC population included participants without any known chronic pulmonary disease, cardiomyopathy, or renal dysfunction. Contemporaneous hemodynamic data was defined as hemodynamics attained within 1 year of blood sample collection. Patients were diagnosed with Group I PAH via right heart catheterization (RHC) according to published guidelines 29 , 37 using a pulmonary artery (PA) catheter. Hemodynamics, including right atrial pressure (RAP), PA pressure, and pulmonary arterial wedge pressure (PAWP) were recorded. Blood was drawn from the distal port of the PA catheter for measurement of mixed venous oxygen saturation (SvO2). At least three thermodilution measurements were performed with injection of 10 mL of saline into the proximal port, and values were averaged to determine cardiac output and CI. PA compliance (PAC) was calculated as stroke volume/(PA systolic pressure—PA diastolic pressure). Stroke volume index (SVI) was calculated as stroke volume/body surface area.
PAH was defined as a mean PA pressure (MPAP) > 20 mmHg, PAWP ≤ 15 mmHg, and PVR ≥ 2 Wood units (WU). 29 Demographics, baseline clinical characteristics, hemodynamics, and contemporaneous transthoracic echocardiogram and spirometry data were collected. Patients were stratified into ID and non‐ID groups. For PAH patients, we applied the 2022 ESC/ERS definition of ID for PH patients, 29 which is widely used for both PH and heart failure patients: Ferritin < 100 mcg/L OR <300 mcg/L and TSAT < 20%. 38 , 39 For our non‐PAH controls, we applied the WHO definition of ID (ferritin < 15 mcg/L for noninflamed individuals and ferritin < 70 mcg/L for inflamed individuals). 40 Anemia was defined by hemoglobin levels below 12 g/dL for women and below 13 g/dL for men. This study was approved by the UCLA Institutional Review Board (IRB# 12‐000738).
Patient samples
Blood samples were collected between 02/2020 and 07/2023 from peripheral vein draw or from the introducer sheath. After collection, samples were sent to the UCLA RRUMC clinical laboratory for the following laboratory indices: Complete Blood Count (CBC), RBC indices [including Mean Corpuscular Volume (MCV) (femtoliters), RDW‐coefficient of variation (RDW‐CV) (%)[calculated as standard deviation (SD) of MCV/MCV multiplied by 100], Mean Corpuscular Hemoglobin (picograms/cell), and Mean Corpuscular Hemoglobin Concentration (g/dL)], Reticulocyte Count (% Reticulocytes * [Hematocrit/45]), IRF (%), Ferritin (ng/mL), Iron (mcg/dL), Total Iron‐Binding Capacity (mcg/dL), sTfr (mg/L), EPO (mU/mL), C‐reactive protein (CRP) (mg/dL), and B‐Type Natriuretic Peptide (pg/mL). IRF was calculated using the Sysmex XN‐10™ Automated Hematology Analyzer (Sysmex Corporation). In brief, fluorescent probes against RNA are used to group reticulocytes into low, medium, or high‐fluorescence fractions. As less mature reticulocytes have higher quantities of RNA (and thus fluorescence) than mature reticulocytes, the medium and high‐fluorescence fractions are added together to calculate the IRF.
A separate set of blood samples were sent to the research laboratory for analysis. Blood samples for serum analysis were collected into plain tubes, centrifuged within 90 min of collection at 1500 g, aliquoted as 2 ×0.5 mL aliquots, and stored at −80°C. Serum hepcidin was measured using the Intrinsic Hepcidin IDx™ELISA kit as per manufacturer's instructions (Intrinsic LifeSciences).
Statistics
Descriptive statistics are reported as median (25%–75% interquartile range [IQR]) for non‐normally distributed data and mean ± SD for normally distributed data. Intergroup comparisons for continuous variables were performed using either a paired t‐test or Wilcoxon rank‐sum test when appropriate. Categorical data were compared with chi‐square or Fischer's exact test when appropriate. Correlation coefficients were calculated by the Spearman rank test. Multivariable linear regression was conducted to assess the relationships among various laboratory parameters and hemodynamics. Two‐sided p‐values < 0.05 were considered statistically significant. Statistical analysis was performed using R version 4.2.1 (The R Foundation for Statistical Computing).
RESULTS
Clinical characteristics and hematologic parameters in PAH versus HCs
Table 1 depicts the clinical characteristics of the total PAH cohort (N = 67) and HCs (N = 13). The PAH patients had primarily idiopathic (52%) and CTD‐related PAH (28%). The 54% had World Health Organization (WHO) functional class 3 or 4 symptomatology, with 40% on triple vasodilator therapy. The PAH cohort was significantly older (56 vs. 42 years, p = 0.008) and more likely to be female (85% vs. 54%, p = 0.02) than HCs. The PAH cohort had lower hemoglobin levels and was more likely to be anemic (58% vs. 8%, p = 0.001). Using the common definition of ID in heart failure (ferritin < 100 mcg/L or < 300 mcg/L and TSAT < 20%) 38 , 39 and the WHO definition of ID (ferritin < 15 mcg/L for non‐inflamed individuals and ferritin <70 mcg/L for inflamed individuals) 40 for the PAH and HC cohorts, respectively, the PAH cohort had markedly higher rates of ID (48% vs. 8%, p = 0.01). Accordingly, our PAH group had significantly lower serum iron and TSAT, and higher sTfR levels. Serum ferritin was not significantly different between PAH and HC subjects. Ferritin does not accurately reflect ID in the presence of inflammation, and consistent with previous PAH literature, 41 , 42 our PAH cohort had mildly increased inflammation as demonstrated by higher CRP levels than our HC cohort (0.4 vs. 0.3 mg/L, p = 0.005).
Table 1.
Clinical characteristics and hematologic parameters in the total PAH cohort and healthy controls.
| Clinical parameter |
PAH N = 67 |
Healthy controls N = 13 |
p‐Value |
|---|---|---|---|
| Age | 56 ± 16 | 42 ± 15 | 0.008 |
| Female (%) | 57 (85%) | 7 (54%) | 0.02 |
| Race | |||
| White (%) | 29 (43.3%) | ‐ | |
| Hispanic (%) | 21 (31.3%) | ‐ | |
| Black (%) | 10 (14.9%) | ‐ | |
| Asian (%) | 2 (3.0%) | ‐ | |
| Other (%) | 5 (7.5%) | ‐ | |
| Etiology | |||
| Idiopathic (%) | 35 (52.2%) | ‐ | |
| CTD (%) | 19 (28.4%) | ‐ | |
| Disease characteristics | |||
| WHO class 3/4 (%) | 36 (54%) | ‐ | |
| BNP | 66 (43–250) | ‐ | |
| Triple therapy (%) | 27 (40%) | ‐ | |
| ID and RBC parameters | |||
| Hemoglobin (g/dL) | 12.8 (11.4–13.9) | 14.2 (13.3–14.7) | 0.016 |
| Iron deficienta | 32 (48%) | 1 (8%) | 0.011 |
| Anemic | 39 (58%) | 1 (8%) | 0.001 |
| MCV (fL) | 89.9 ± 6.6 | 89.9 ± 4.0 | 0.957 |
| Ferritin (ng/mL) | 49 (24–116) | 76 (32–211) | 0.365 |
| Serum iron (mcg/dL) | 57 (44‐85) | 87 (71–107) | 0.01 |
| Transferrin saturation (%) | 20.0 (13.4‐25.8) | 25.8 (22.3–35.5) | 0.03 |
| Soluble transferrin receptor (mg/L) | 2.09 (1.88–2.57) | 1.82 (1.74–2.01) | 0.026 |
| Soluble transferrin receptor index | 1.23 (0.98–1.88) | 0.93 (0.74–1.25) | 0.07 |
| Reticulocyte index | 1.63 (1.38–2.16) | 1.41 (1.07–1.62) | 0.03 |
| Reticulocyte hemoglobin content (pg/cell) | 32.9 (30.1–35.0) | 35.7 (34.7–36.5) | 0.007 |
| Serum hepcidin (ng/mL) | 27.9 (13.5–46.0) | 66.6 (36.0–80.4) | 0.02 |
| Serum EPO (mU/mL) | 20.3 (12.6–26.3) | 8.7 (7.6–9.0) | <0.001 |
| Immature reticulocyte fraction (%) | 12.4 (9.8–17.7) | 6.1 (5.4–9.1) | <0.001 |
| RDW‐CV (%) | 13.8 (13.2–15.2) | 12.4 (12.3–13.3) | 0.0001 |
| C‐reactive protein (mg/L) | 0.4 (0.3–1.1) | 0.3 (0.3–0.4) | 0.005 |
Note: Data are presented as median (interquartile range). Bold values are statistically significant.
Abbreviations: BNP, brain natriuretic peptide; CTD, connective tissue disease; EPO, erythropoietin; MCV, mean corpuscular volume; PAH, pulmonary arterial hypertension; RDW‐CV, red cell distribution width coefficient of variation; WHO, World Health Organization.
The common definition of iron deficiency in heart failure patients (ferritin < 100 mcg/L or < 300 mcg/L and TSAT < 20%) 38 , 39 was applied to the PAH cohort, while the WHO definition of iron deficiency was applied to the healthy control cohort (ferritin < 15 mcg/L for noninflamed individuals and ferritin < 70 mcg/L for inflamed individuals). 40
Our PAH cohort also demonstrated enhanced erythropoietic drive with higher serum EPO (20.3 vs. 8.7 mU/mL, p < 0.001) and higher parameters of immature erythrocytes (reticulocyte index, IRF, and RDW‐CV). The iron‐regulatory hormone hepcidin, 43 whose production is suppressed by ID and erythropoietic activity, but increased by inflammation, was decreased in our PAH patients (27.9 vs. 66.6 ng/mL, p = 0.02), reflecting the dominant effect of ID and erythropoietic activity on hepcidin in these patients.
Clinical characteristics of PAH patients with contemporaneous hemodynamics
Table 2 depicts the clinical characteristics of the subset of PAH patients with contemporaneous hemodynamic data (N = 36), both the total cohort and separated by ID status. This subset consisted of 29 females (81%) diagnosed with PAH a median of 1107 days (502–2086 days) before study enrollment. The mean age was 56‐year‐old, and ID patients were significantly younger than non‐ID patients (52 vs. 67 years, p = 0.009). The most common etiologies were idiopathic PAH (47%) and CTD‐related PAH (33%). 19 (53%) had WHO functional class 3 or 4 symptomatology, and 12 (33%) were on triple PH therapy. Four patients were receiving oral iron supplementation at the time of sample collection. The median brain natriuretic peptide (BNP), hemodynamics, and 6‐min walk distance were not significantly different between ID and non‐ID cohorts. However, the echocardiographic parameter of tricuspid annular plane systolic excursion (TAPSE) was significantly decreased in ID versus non‐ID PAH patients (18.9 vs. 24.0 mm, p = 0.048).
Table 2.
Clinical characteristics of PAH patients with contemporaneous hemodynamics.
| Clinical characteristics |
Total cohort N = 36 |
Iron deficient N = 26 |
Non‐iron deficient N = 10 |
p‐Value |
|---|---|---|---|---|
| Age − mean ± SD | 56 ± 16 | 52 ± 16 | 67 ± 13 | 0.009 |
| Female (%) | 29 (81%) | 21 (81%) | 8 (80%) | 1.0 |
| Disease duration (days) | 1107 (502–2086) | 714 (499–2304) | 1287 (765–1884) | 0.62 |
| Race | ||||
| White (%) | 13 (36.1%) | 7 (27%) | 6 (60%) | 0.144 |
| Hispanic (%) | 15 (41.7%) | 13 (50%) | 2 (20%) | 0.209 |
| Black (%) | 6 (16.7%) | 6 (21.4%) | 0 | 0.157 |
| Asian (%) | 1 (2.8%) | 0 | 1 (10%) | 0.278 |
| Other (%) | 1 (2.8%) | 0 | 1 (10%) | 0.278 |
| Etiology | ||||
| Idiopathic (%) | 17 (47.2%) | 11 (42.3%) | 6 (60%) | 0.560 |
| CTD (%) | 12 (33.4%) | 8 (30.7%) | 4 (40%) | 0.888 |
| Oral iron supplementation | 4 (11.1%) | 3 (11.5%) | 1 (10%) | 1.0 |
| Disease characteristics | ||||
| WHO class 3/4 (%) | 19 (53%) | 13 (50%) | 6 (60%) | 0.863 |
| Triple therapy (%) | 12 (33%) | 10 (38%) | 2 (20%) | 0.512 |
| PDE5 inhibitor | 28 (78%) | 20 (77%) | 8 (80%) | 0.807 |
| ERA | 22 (61%) | 15 (58%) | 7 (70%) | 0.706 |
| Parenteral prostacyclin therapy | 10 (28%) | 6 (23%) | 4 (40%) | 0.413 |
| BNP (pg/mL) | 66 (43–276) | 54 (42–217) | 124 (52–581) | 0.326 |
| RAP (mmHg) | 8 (4–11) | 8 (4–12) | 7 (3–9) | 0.385 |
| mPAP (mmHg) − mean ± SD | 46 ± 15 | 44 ± 15 | 50 ± 17 | 0.362 |
| PAWP (mmHg) − mean ± SD | 10 ± 3 | 10 ± 4 | 9 ± 3 | 0.337 |
| PVR (Wood Units) | 7.9 (4.0–12.1) | 8.7 (3.9–11.6) | 7.0 (5.3–12.2) | 0.931 |
| Cardiac Index (L/min/m2) | 2.4 (1.8–3.0) | 2.3 (1.8–2.9) | 2.6 (2.0–3.3) | 0.323 |
| Pulmonary artery compliance (mL/mm Hg) | 1.51 (0.80–2.44) | 1.62 (0.87–2.68) | 1.33 (0.77–1.79) | 0.413 |
| Stroke volume index (mL/m2) | 30.9 (22.8–40.2) | 28.2 (21.8–40.6) | 35.9 (25.5–39.5) | 0.577 |
| TAPSE (mm) – mean ± SD | 20.3 ± 5.8 | 18.9 ± 5.3 | 24.0 ± 5.6 | 0.048 |
| DLCO (% predicted) – mean ± SD | 58.8 ± 24.8 | 62.8 ± 24.2 | 50.5 ± 25.1 | 0.215 |
| 6‐MWD (m) – mean ± SD | 359 ± 144 | 369 ± 139 | 332 ± 164 | 0.585 |
Note: Data are presented as median (interquartile range), unless otherwise stated. Bold values are statistically significant.
Abbreviations: 6‐MWD, 6‐min walk distance; BNP, brain natriuretic peptide; CTD, connective tissue disease; DLCO, diffusion capacity for carbon monoxide; ERA, endothelin receptor antagonist; mPAP, mean pulmonary artery pressure; PDE5, phosphodiesterase‐5, PAWP, pulmonary arterial wedge pressure; PVR, pulmonary vascular resistance; RAP, right atrial pressure; SD, standard deviation; TAPSE, tricuspid annular plane systolic excursion; WHO, World Health Organization.
IRF is a potent biomarker of hemodynamic status in PAH
IRF showed positive correlations with mPAP, PVR, and RAP, and inverse correlations with CI, PAC, and SVI (Figure 1a–f). Notably, IRF also had a significant negative correlation with SvO2, a marker of cardiac function as reflected by tissue hypoxia 44 (Figure 1g). As IRF levels correlate with ID, 45 , 46 , 47 we evaluated whether IRF maintained its correlations with hemodynamic variables when divided into ID and non‐ID cohorts. We found that the correlation between IRF and hemodynamics remained significant in the ID cohort for all variables (Supporting Information S5: Table S1) but only for PVR in the non‐ID cohort. This loss of significant correlation could be secondary to the small size of the non‐ID group (N = 10) as a result of the inclusive definition used for ID. However, using an alternative proposed definition of ID in PAH, namely, sTfR index >3.2 if CRP < 0.5 mg/dL or >2 if CRP > 0.5 mg/dL, 9 the correlations between IRF and mPAP, PVR, CI, PAC, SVI, and RAP remained significant in non‐ID patients (N = 28) (Figure S1 ). Furthermore, using another definition of non‐ID as TSAT > 20%, 48 , 49 we found the correlations between IRF and mPAP, PVR, CI, PAC, SVI, and RAP remained significant (Figure S2). Together, these data show that IRF is a potent biomarker of hemodynamic severity in PAH, and that its predictive value persists even in non‐ID patients.
Figure 1.
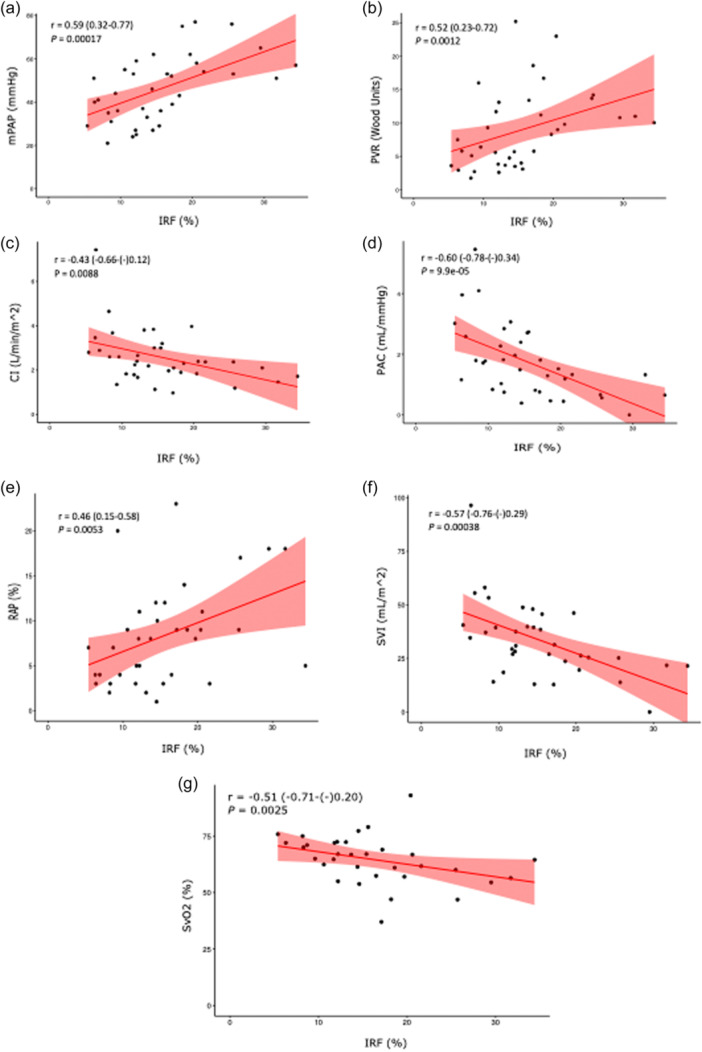
Correlation of immature reticulocyte fraction (IRF) with hemodynamic variables in pulmonary arterial hypertension (PAH): (a) mean pulmonary artery pressure (mPAP), (b) pulmonary vascular resistance (PVR), (c) cardiac index (CI), (d) pulmonary arterial compliance (PAC), (e) right atrial pressure (RAP), (f) stroke volume index (SVI), (g) mixed venous oxygen saturation (SvO2). Spearman correlation coefficients are depicted with 95% confidence intervals.
IRF outperforms other erythropoietic and ID biomarkers of hemodynamics status in PAH
Prior studies have established a relationship between PAH outcomes and EPO, 50 RDW, 14 , 15 , 16 , 17 , 18 , 19 and ID parameters (TSAT, sTfR). 5 , 6 , 7 We therefore compared the strength of the relationship between these parameters and PAH hemodynamics with that of IRF (Table 3). There was a significant correlation between serum EPO and all hemodynamic variables, while TSAT and sTfR were only significantly correlated with a subset of hemodynamic parameters. There was no significant correlation between RDW‐CV and any hemodynamic variable. In total, our PAH cohort with contemporaneous hemodynamic data showed stronger correlations with IRF for every hemodynamic parameter as compared to EPO, sTfR, TSAT, or RDW. As expected, we also observed significant correlations between BNP and hemodynamic variables. 29
Table 3.
Correlation of immature reticulocyte fraction, EPO, BNP, sTfR, and TSAT with hemodynamic parameters in PAH.
| Correlation coefficients (95% confidence interval) | ||||||
|---|---|---|---|---|---|---|
| Hemodynamic variables | IRF | EPO | BNP | sTfR | TSAT | RDW‐CV |
| mPAP | 0.59 (0.32–0.77) | 0.36 (0.03–0.62) | 0.39 (0.05–0.63) | 0.39 (0.07–0.64) | −0.35 (−0.61–(−)0.02) | 0.07 (−0.26–0.39)b |
| PVR | 0.52 (0.23–0.72) | 0.49 (0.20–0.71) | 0.60 (0.34–0.78) | 0.44 (0.13–0.67) | −0.38 (−0.63–(−)0.06) | 0.24 (−0.09–0.53)b |
| CI | −0.43 (−0.66–(−)0.12) | −0.33 (−0.59–0) | −0.50 (−0.71–(−)0.20) | −0.32 (−0.59–0)a | 0.25 (−0.09–0.53) | −0.26 (−0.54–0.08)b |
| PAC | −0.60 (−0.78−(−)0.34) | −0.43, (−0.66−(−)0.12) | −0.49 (−0.71−(−)0.19) | −0.39 (−0.64−(−)0.67) | 0.29 (−0.04‐0.57)a | −0.24 (−0.53–0.10)b |
| SVI | −0.57 (−0.76–(−)0.29) | −0.42, (−0.62–(−)0.11) | −0.43 (−0.66–(−)0.11) | −0.35 (−0.61–(−)0.02) | 0.3 (−0.04‐0.57)a | −0.25 (−0.54–0.10)b |
| RAP | 0.46 (0.15–0.68) | 0.44, (0.13–0.67) | 0.55 (0.27–0.74) | 0.31 (‐0.02–0.58)a | −0.17 (−0.47–0.17) | 0.26 (−0.08–0.54)b |
| SvO2 | −0.51 (−0.71–(−)0.20) | −0.35, (−0.62–(−)0.01) | −0.40 (−0.65–(−)0.06) | −0.48 (−0.71–(−)0.16) | 0.48 (0.16–0.71) | −0.26 (−0.55–0.09)b |
Note: Data are presented as Spearman correlation coefficients with 95% confidence intervals. Significant correlation coefficients are bolded. Abbreviations: BNP, brain natriuretic peptide; CI, cardiac index; EPO, erythropoietin; IRF, immature reticulocyte fraction; mPAP, mean pulmonary artery pressure; PAC, pulmonary arterial compliance; PVR, pulmonary vascular resistance; RAP, right atrial pressure; sTfR, soluble transferrin receptor; SVI, stroke volume index; SvO2, mixed venous oxygen saturation; TSAT, transferrin saturation.
Trend toward significance.
Nonsignificant.
We subsequently performed multivariable linear regression that included IRF, EPO, sTfR, TSAT, and BNP (Table 4). On multivariable analysis, the relationships between IRF and mPAP, SVI, and PAC remained significant. In contrast, the relationships between TSAT, sTfR, and EPO with hemodynamic severity failed to remain significant for any hemodynamic variable. These results indicate that IRF performed better as an independent marker of hemodynamic severity than TSAT, sTfR, or EPO. Furthermore, IRF appeared to add additional predictive value beyond that provided by BNP for certain hemodynamic variables, particularly for SVI (R 2 values shown in Supporting Information S5: Table S2).
Table 4.
Bivariate and multivariable linear regression of IRF, EPO, BNP, sTfR, and TSAT levels with hemodynamic parameters.
| Bivariate linear regression—standardized regression coefficient (95% confidence interval) | Multivariable linear regression—standardized regression coefficient (95% confidence interval) | |||||||||
|---|---|---|---|---|---|---|---|---|---|---|
| Hemodynamic variables | Log (IRF) | Log (Epo) | Log (BNP) | Log (sTfR) | Log (TSAT) | Log (IRF) | Log (Epo) | Log (BNP) | Log (sTfR) | Log (TSAT) |
| mPAP | 0.55 (0.26–0.84)* | 0.36 (0.03–0.68) | 0.42 (0.10–0.73) | NS | −0.36 (−0.69–(‐)0.04) | 0.58 (0.15–0.93)* | NS | 0.36 (0.04–0.67) | ‐ | NS |
| PVR | 0.43 (0.12–0.75)* | 0.40 (0.09–0.72) | 0.61 (0.34–0.89)* | NS | NS | NS** | NS | 0.56 (0.26–0.86)* | ‐ | ‐ |
| CI | −0.47 (−0.78–(‐)0.17)* | −0.43 (−0.75–(‐)0.12)* | −0.41 (−0.73–(‐)0.09) | NS | NS | NS*** | NS | NS | ‐ | ‐ |
| PAC | −0.60 (−0.88–(‐)0.32)* | −0.47 (−0.78–(‐)0.17)* | −0.45 (−0.76–(‐)0.14) | −0.36 (−0.68–(‐)0.03) | NS | −0.51 (−0.88–(‐)0.13)* | NS | −0.32 (−0.63–(‐)0.02) | NS | ‐ |
| SVI | −0.58 (−0.86–(‐)0.29)* | 0.44 (−0.75–(‐)0.12)* | −0.37 (−0.70–(‐)0.04) | NS | NS | − | NS | NS | ‐ | ‐ |
| RAP | 0.42 (0.10–0.74) | 0.49 (0.18–0.79)* | 0.51 (0.29–0.86)* | 0.34 (0.01–0.67) | NS | NS | NS | 0.44 (0.13–0.75)* | NS | ‐ |
| SvO2 | −0.42 (−0.77–(‐)0.06) | NS | NS | −0.41 (−0.73–(‐)0.08) | 0.39 (0.06–0.71) | NS | ‐ | ‐ | NS | NS |
Note: Data are presented as standardized regression coefficients with 95% confidence intervals.
Abbreviations: BNP, brain natriuretic peptide; CI, cardiac index; EPO, erythropoietin; IRF, immature reticulocyte fraction; log, log10; mPAP, mean pulmonary artery pressure; NS, nonsignificant; PAC, pulmonary arterial compliance; PVR, pulmonary vascular resistance; RAP, right atrial pressure; sTfR, soluble transferrin receptor; SVI, stroke volume index; SvO2, mixed venous oxygen saturation; TSAT, transferrin saturation.
p < 0.01.
Trend toward significance: −0.34 (−0.01−0.68), p = 0.058.
Trend toward significance: −0.36 (−0.75−0.04), p = 0.07.
IRF is a marker of erythropoietic drive, ID, and tissue hypoxia in PAH
To elucidate the pathophysiologic processes that lead to the predictive value of IRF in PAH hemodynamics, we examined the potential upstream contributors to higher IRF values. Because IRF 51 , 52 is increased in states of accelerated erythropoiesis, we evaluated its relationship with other parameters that reflect increased erythropoietic drive and activity during stress states. We found a robust correlation with serum EPO in the PAH cohort (0.68, p < 0.001), (Figure 2a) as well as a significant correlation with RDW‐CV (0.39, p = 0.001) (Figure 2b). As EPO production is primarily regulated by hypoxia and ID, 53 , 54 we then characterized the relationships between IRF and parameters of hypoxia and ID. SvO2, which is a measure of tissue hypoxia and oxygen uptake, showed a stronger correlation with IRF than with EPO (Table 3, Figure 1g). Figure 2c−e show the significant correlations between IRF and markers of ID, including TSAT (−0.40, p < 0.001), sTfR (0.38, p = 0.002), and serum iron levels (−0.33, p = 0.006).
Figure 2.
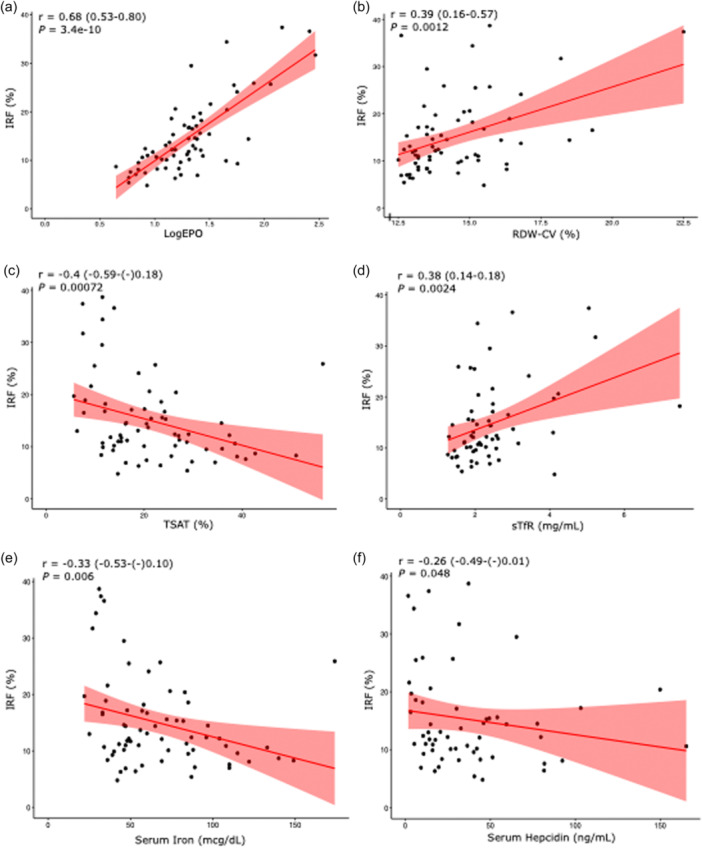
Correlation of Immature reticulocyte fraction (IRF) with markers of erythropoietic drive, iron deficiency, and inflammation in pulmonary arterial hypertension: (a) log erythropoietin (EPO), (b) red cell distribution width coefficient of variation (RDW‐CV), (c) transferrin saturation (TSAT), (d) soluble transferrin receptor (sTfR), (e) serum iron, (f) serum hepcidin. Spearman correlation coefficients are depicted with 95% confidence intervals.
As EPO activity in erythropoiesis occurs primarily in the bone marrow in early erythropoiesis, promoting proerythroid proliferation and lineage erythroid differentiation, 55 we hypothesized that our patients' increased IRF levels were a reflection of increased immature reticulocytes rather than of decreased mature reticulocytes. As expected, we found a significantly elevated absolute immature reticulocyte count (Figure S3A) in the PAH cohort compared to HC (9.9 vs. 4.9 cells/mL, p < 0.001), and no statistically significant difference in the absolute mature reticulocyte count between the two cohorts (73 vs. 66 cells/mL, p = 0.16), (Figure S3B ). These results demonstrate that there are increases in both IRF and absolute immature reticulocyte count in PAH compared to HC and that these changes are correlated with increased EPO levels as influenced by hypoxia and ID. However, in relatively iron replete PAH patients (TSAT > 20%), there was no significant relationship between IRF and SvO2, suggesting that the effects of tissue hypoxia on IRF are mediated by iron status and decreased oxygen‐carrying capacity (Figure S2G).
In our PAH cohort, hepcidin levels correlated negatively with IRF (−0.26, p = 0.048) (Figure 2f), likely reflecting the downregulation of hepcidin that occurs with ID, hypoxia, and erythropoiesis. Accordingly, we found significant correlations between hepcidin levels and TSAT (0.53, p < 0.001), ferritin (0.49, p < 0.001), and sTfR (−0.42, p < 0.001) (Figure S4A−C). As hepcidin is upregulated by IL‐6‐mediated inflammation, we also examined the potential correlations between CRP and IRF, and CRP and hepcidin (data not shown), and found no significant correlations. While these data may indicate a more significant contribution of ID than inflammation to hepcidin regulation in PAH, we are limited by the use of CRP, which is a surrogate and less sensitive marker of IL‐6 activity. In addition, these decreased hepcidin levels may actually be inappropriately elevated for the degree of ID. 56
DISCUSSION
In our retrospective single‐center study of a cohort of 36 Group I PAH patients, we found that IRF was consistently correlated with worse hemodynamics, including RAP, mPAP, PVR, CI, PAC, SVI, and SvO2, and that these correlations were more robust than those with other common erythropoietic or iron measurements. Of these hemodynamic parameters, RAP, CI, SVI, and SvO2 are the four parameters that the ESC/ERS guidelines recommend for risk stratifying patients with PAH, 29 and lower PAC has recently been demonstrated to be significantly associated with worse survival in PH. 57 Our multivariable analysis also showed that IRF was the only marker that significantly correlated with SVI, which was found in a large study of PAH patients to be independently associated with death or lung transplantation. 58
IRF is the ratio of immature reticulocytes to total reticulocytes in peripheral blood, and is measured by the use of flow cytometry to quantify RNA content in reticulocytes. 51 The clinical applications of this lab value have not been clearly established, but it can serve as an early and sensitive marker of erythropoiesis. 52 Both IRF and the absolute reticulocyte count are measures of erythropoiesis, but IRF likely represents an index of acceleration of erythropoiesis while the reticulocyte count is a quantitative measure of the resulting effective erythropoiesis. 52 The relationship between IRF and reticulocyte count can also be used to help distinguish between various types of anemias, 51 , 52 , 59 , 60 , 61 for example, elevated IRF with subnormal or normal reticulocyte index can be seen with ID anemia or myelodysplastic syndrome. 51 Elevated IRF has previously been identified in a non‐anemic cohort of patients with unspecified pulmonary and cardiac disease compared to healthy outpatients. 62 Additionally, in a population of males with obstructive sleep apnea, IRF was positively correlated with lowest nocturnal oxyhemoglobin saturation. 63 Thus, the associations of IRF with chronic pulmonary disease and hypoxia have been previously noted although not well characterized.
In our study, we found a notably robust correlation between IRF and serum EPO levels, which is not altogether surprising as EPO exerts its effect in the bone marrow by binding to erythroid progenitor cells, 53 , 64 leading to their proliferation and differentiation. EPO production, which occurs primarily in peritubular interstitial cells in the kidney, is tightly regulated by HIF2α transcription factor. The levels of HIF2α are regulated by oxygen and iron, both of which promote prolyl hydroxylase‐mediated hydroxylation of HIF2α and its degradation. 53 In response to cellular hypoxia and/or ID, which can result from decreased renal perfusion or overt hypoxemia, 20 , 65 the HIF complex is stabilized and binds to the hypoxia response element in the EPO promoter, potentiating EPO transcription. However, ID has complex effects on EPO production because cellular ID in the kidney can also downregulate the translation of HIF2α via IRP1 activity, consequently blunting EPO overproduction in the setting of ID. Nevertheless, ID is associated with increased EPO despite any potential minor blunting effects of ID on HIF2α production in the kidney. Furthermore, ID may affect PAH independently of its effect on EPO production, possibly by affecting the function of endothelial or smooth muscle cells. 21 , 22 One human study showed that intravenous iron resulted in a 40% reduction in acute hypoxic PH, and phlebotomy‐induced ID resulted in a 25% increase in PASP in chronic mountain sickness, demonstrating the interplay of hypoxia, ID, and PH. 66 Multiple studies have previously shown that PAH patients have elevated EPO levels, 5 , 50 but its role in PAH is not well understood. EPO is also active in the mobilization of endothelial progenitor cells from the bone marrow that may ameliorate pathologic pulmonary vascular remodeling 67 , 68 or contribute to disease pathogenesis. 69 , 70 , 71 Thus, EPO levels in PAH patients could be a marker of disease related to upstream or downstream effects, and/or could have a pathogenic role.
The correlations between IRF and EPO suggest that IRF is also a downstream marker of ID and/or hypoxia. Accordingly, our study showed significant correlations between IRF and established measures of ID (sTfR, serum iron, TSAT), which also confirmed the observations of other studies that showed increased IRF in ID. 45 , 46 , 47 sTfR, TSAT, and ferritin are widely accepted parameters of iron status during both homeostasis and disease, but IRF may more accurately reflect the complex interplay among inflammation, hypoxia, iron status, pulmonary vasoconstriction, and altered erythropoiesis that characterizes PAH. 20 Similarly, our study showed that SvO2, a measure of tissue hypoxia that has been shown to be correlated with PAH outcomes, 72 has a significant correlation with IRF in our cohort. Systemic and/or tissue hypoxia are well‐characterized features of PAH, which can be related to decreased cardiac function, high rates of nocturnal hypoxemia, 73 , 74 and/or ID. Importantly, we found that IRF had significantly stronger correlations with all hemodynamic parameters than did EPO, suggesting that IRF reflects physiologic processes in PAH beyond those that are directly related to EPO activity. For instance, other HIF‐inducible factors that affect bone marrow progenitor cells, such as hepatocyte growth factor and stem cell factor, have been shown to be elevated in PAH. 75
In summary, we have identified the IRF as a novel and robust biomarker of hemodynamic outcomes in PAH patients that outperforms the other established markers of hematologic, iron, and oxygen status. Our data suggest that IRF is an integrative and functional biomarker of erythropoietic drive as regulated by ID and hypoxia in PAH (Figure 3). Further prospective studies are necessary to determine the clinical utility of IRF in predicting the progression to severe disease in PAH, as well as its potential utility as a biomarker in other PH groups.
Figure 3.
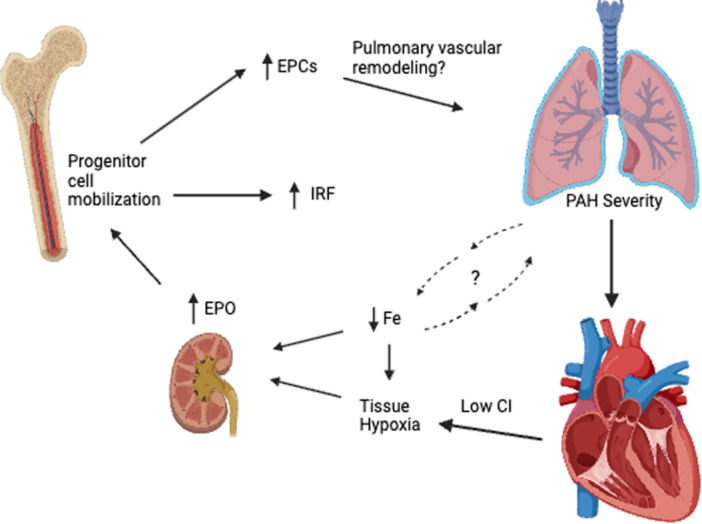
Proposed model of the role of IRF in the interplay among iron deficiency (ID), tissue hypoxia, erythropoietic drive, and pulmonary arterial hypertension (PAH) severity. Immature reticulocyte fraction (IRF) appears to be an integrative marker of erythropoietic drive and bone marrow progenitor cell mobilization in PAH. Worsening PAH severity likely leads to functional ID via decreased gut iron absorption and increased sequestration, compounded by poor nutritional status. Together with the tissue hypoxia that occurs downstream of poor cardiac function and potentially reflects the decreased oxygen‐carrying capacity in ID, these factors increase erythropoietin (EPO) production. The resulting progenitor cell mobilization leads to increased IRF levels and endothelial progenitor cells (EPCs), with unclear contributions to PAH pathogenesis.
AUTHOR CONTRIBUTIONS
Airie Kim, Adam J. Brownstein, and Jared D. Wilkinson contributed to conception and design of the work. Airie Kim, Adam J. Brownstein, Jared D. Wilkinson, and Lloyd L. Liang contributed to collection of the data. Adam J. Brownstein, Jared D. Wilkinson, and Airie Kim contributed to data analysis and interpretation. Adam J. Brownstein, Jared D. Wilkinson, and Airie Kim contributed to writing the manuscript. Adam J. Brownstein, Jared D. Wilkinson, Airie Kim, Rajan Saggar, and Richard N. Channick reviewed this work for critically important intellectual content. All authors approved of the final version of the manuscript and agree to be accountable for all aspects of the work.
CONFLICT OF INTEREST STATEMENT
Rajan Saggar receives consulting fees from United Therapeutics and Johnson & Johnson—Janssen Pharmaceuticals (Actelion Pharmaceuticals). Richard N. Channick receives consulting fees from United Therapeutics, Johnson & Johnson—Janssen Pharmaceuticals (Actelion Pharmaceuticals), Bayer HealthCare Pharmaceuticals Inc., Merck Sharp & Dohme Llc, and Penumbra, Inc. The remaining authors declare no conflicts of interest.
ETHICS STATEMENT
This study was approved by the University of California, Los Angeles Institutional Review Board (IRB# 12‐000738).
Supporting information
Supplementary Figure 1. Correlation of IRF with hemodynamic variables in non‐iron deficient PAH patients according to the soluble transferrin receptor index definition: (A) mean pulmonary artery pressure (mPAP), (B) pulmonary vascular resistance (PVR), (C) cardiac index (CI), (D) pulmonary arterial compliance (PAC), (E) right atrial pressure (RAP), (F) stroke volume index (SVI), (G) mixed venous oxygen saturation (SvO2). Spearman correlation coefficients are depicted with 95% confidence intervals.
Supplementary Figure 2. Correlation of IRF with hemodynamic variables in PAH patients with transferrin saturation > 20%: (A) mean pulmonary artery pressure (mPAP), (B) pulmonary vascular resistance (PVR), (C) cardiac index (CI), (D) pulmonary arterial compliance (PAC), (E) right atrial pressure (RAP), (F) stroke volume index (SVI), (G) mixed venous oxygen saturation (SvO2). Spearman correlation coefficients are depicted with 95% confidence intervals.
Supplementary Figure 3. Box plots of the immature (A) and mature (B) reticulocyte counts in the pulmonary arterial hypertension (PAH) cohort vs. healthy controls. There was a significantly elevated immature reticulocyte count in the PAH cohort compared to HC [9.9 (6.7‐14.6) vs. 4.9 cells /mL (3.1‐7.2), P<0.001], and no significant difference in the absolute mature reticulocyte count between the two cohorts [73 (54‐88) vs. 66 cells /mL (49‐73), P=0.16].
Supplementary Figure 4. Correlation of hepcidin with iron deficiency markers: (A) transferrin saturation (TSAT), (B) log ferritin, (C) soluble transferrin receptor (sTfR) in the PAH cohort. Spearman correlation coefficients are depicted with 95% confidence intervals.
Supporting Information.
ACKNOWLEDGMENTS
Adam J. Brownstein is supported by the National Center for Advancing Translational Science (NCATS) of the National Institutes of Health under the UCLA Clinical and Translational Science Institute grant number UL1TR001881. Airie Kim is supported by NHLBI grant R01HL159507.
Brownstein AJ, Wilkinson JD, Liang LL, Channick RN, Saggar R, Kim A. Immature reticulocyte fraction: a novel biomarker of hemodynamic severity in pulmonary arterial hypertension. Pulm Circ. 2024;14:e12421. 10.1002/pul2.12421
Adam J. Brownstein and Jared D. Wilkinson contributed equally to this study and share first authorship.
REFERENCES
- 1. Tuder RM, Archer SL, Dorfmüller P, Erzurum SC, Guignabert C, Michelakis E, Rabinovitch M, Schermuly R, Stenmark KR, Morrell NW. Relevant issues in the pathology and pathobiology of pulmonary hypertension. J Am Coll Cardiol. 2013. Dec 24;62(25 Suppl):D4–D12. [DOI] [PMC free article] [PubMed] [Google Scholar]
- 2. Hassoun PM. Pulmonary arterial hypertension. N Engl J Med. 2021. Dec 16;385(25):2361–2376. [DOI] [PubMed] [Google Scholar]
- 3. Smits AJ, Botros L, Mol MAE, Ziesemer KA, Wilkins MR, Vonk Noordegraaf A, Bogaard HJ, Aman J. A systematic review with meta‐analysis of biomarkers for detection of pulmonary arterial hypertension. ERJ Open Res. 2022. Apr;8(2):00009. [DOI] [PMC free article] [PubMed] [Google Scholar]
- 4. Zhang V, Nemeth E, Kim A. Iron in lung pathology. Pharmaceuticals. 2019. Feb 15;12(1):30. [DOI] [PMC free article] [PubMed] [Google Scholar]
- 5. Rhodes CJ, Howard LS, Busbridge M, Ashby D, Kondili E, Gibbs JSR, Wharton J, Wilkins MR. Iron deficiency and raised hepcidin in idiopathic pulmonary arterial hypertension. J Am Coll Cardiol. 2011. Jul 12;58(3):300–309. [DOI] [PubMed] [Google Scholar]
- 6. Ruiter G, Lankhorst S, Boonstra A, Postmus PE, Zweegman S, Westerhof N, van der Laarse WJ, Vonk‐Noordegraaf A. Iron deficiency is common in idiopathic pulmonary arterial hypertension. Eur Respir J. 2011. Jun;37(6):1386–1391. [DOI] [PubMed] [Google Scholar]
- 7. van Empel VPM, Lee J, Williams TJ, Kaye DM. Iron deficiency in patients with idiopathic pulmonary arterial hypertension. Heart, Lung Circ. 2014. Mar;23(3):287–292. [DOI] [PubMed] [Google Scholar]
- 8. Soon E, Treacy CM, Toshner MR, MacKenzie‐Ross R, Manglam V, Busbridge M, Sinclair‐McGarvie M, Arnold J, Sheares KK, Morrell NW, Pepke‐Zaba J. Unexplained iron deficiency in idiopathic and heritable pulmonary arterial hypertension. Thorax. 2011. Apr;66(4):326–332. [DOI] [PubMed] [Google Scholar]
- 9. Sonnweber T, Nairz M, Theurl I, Petzer V, Tymoszuk P, Haschka D, Rieger E, Kaessmann B, Deri M, Watzinger K, Steringer‐Mascherbauer R, Tancevski I, Weiss G, Löffler‐Ragg J. The crucial impact of iron deficiency definition for the course of precapillary pulmonary hypertension. PLoS One. 2018;13(8):e0203396. [DOI] [PMC free article] [PubMed] [Google Scholar]
- 10. Ruiter G, Lanser IJ, de Man FS, van der Laarse WJ, Wharton J, Wilkins MR, Howard LS, Vonk‐Noordegraaf A, Voskuyl AE. Iron deficiency in systemic sclerosis patients with and without pulmonary hypertension. Rheumatology. 2014. Feb;53(2):285–292. [DOI] [PubMed] [Google Scholar]
- 11. Tatah J, Keen JL, Prisco SZ, Pritzker M, Thenappan T, Prins KW. Iron deficiency is associated with more severe pulmonary vascular disease in pulmonary hypertension caused by chronic lung disease. Chest. 2022. Jan;161(1):232–236. [DOI] [PMC free article] [PubMed] [Google Scholar]
- 12. Anand IS, Gupta P. Anemia and iron deficiency in heart failure: current concepts and emerging therapies. Circulation. 2018. Jul 3;138(1):80–98. [DOI] [PubMed] [Google Scholar]
- 13. Jankowska EA, Rozentryt P, Witkowska A, Nowak J, Hartmann O, Ponikowska B, Borodulin‐Nadzieja L, Banasiak W, Polonski L, Filippatos G, McMurray JJV, Anker SD, Ponikowski P. Iron deficiency: an ominous sign in patients with systolic chronic heart failure. Eur Heart J. 2010. Aug;31(15):1872–1880. [DOI] [PubMed] [Google Scholar]
- 14. Hampole CV, Mehrotra AK, Thenappan T, Gomberg‐Maitland M, Shah SJ. Usefulness of red cell distribution width as a prognostic marker in pulmonary hypertension. Am J Cardiol. 2009. Sep 15;104(6):868–872. [DOI] [PubMed] [Google Scholar]
- 15. Nathan SD, Reffett T, Brown AW, Fischer CP, Shlobin OA, Ahmad S, Weir N, Sheridan MJ. The red cell distribution width as a prognostic indicator in idiopathic pulmonary fibrosis. Chest. 2013. Jun;143(6):1692–1698. [DOI] [PubMed] [Google Scholar]
- 16. Petrauskas LA, Saketkoo LA, Kazecki T, Saito S, Jaligam V, deBoisblanc BP, Lammi MR. Use of red cell distribution width in a population at high risk for pulmonary hypertension. Respir Med. 2019. Apr;150:131–135. [DOI] [PMC free article] [PubMed] [Google Scholar]
- 17. Rhodes CJ, Wharton J, Howard LS, Gibbs JSR, Wilkins MR. Red cell distribution width outperforms other potential circulating biomarkers in predicting survival in idiopathic pulmonary arterial hypertension. Heart. 2011. Jul;97(13):1054–1060. [DOI] [PubMed] [Google Scholar]
- 18. Thayer TE, Huang S, Levinson RT, Farber‐Eger E, Assad TR, Huston JH, Mosley JD, Wells QS, Brittain EL. Unbiased phenome‐wide association studies of red cell distribution width identifies key associations with pulmonary hypertension. Ann Am Thorac Soc. 2019. May;16(5):589–598. [DOI] [PMC free article] [PubMed] [Google Scholar]
- 19. Zhao J, Mo H, Guo X, Wang Q, Xu D, Hou Y, Tian Z, Liu Y, Wang H, Lai J, Li M, Zeng X. Red blood cell distribution width as a related factor of pulmonary arterial hypertension in patients with systemic sclerosis. Clin Rheumatol. 2018. Apr;37(4):979–985. [DOI] [PubMed] [Google Scholar]
- 20. Quatredeniers M, Mendes‐Ferreira P, Santos‐Ribeiro D, Nakhleh MK, Ghigna MR, Cohen‐Kaminsky S, Perros F. Iron deficiency in pulmonary arterial hypertension: a deep dive into the mechanisms. Cells. 2021. Feb 23;10(2):477. [DOI] [PMC free article] [PubMed] [Google Scholar]
- 21. Lakhal‐Littleton S, Crosby A, Frise MC, Mohammad G, Carr CA, Loick PAM, Robbins PA. Intracellular iron deficiency in pulmonary arterial smooth muscle cells induces pulmonary arterial hypertension in mice. Proc Natl Acad Sci. 2019. Jun 25;116(26):13122–13130. [DOI] [PMC free article] [PubMed] [Google Scholar]
- 22. Cotroneo E, Ashek A, Wang L, Wharton J, Dubois O, Bozorgi S, Busbridge M, Alavian KN, Wilkins MR, Zhao L. Iron homeostasis and pulmonary hypertension: iron deficiency leads to pulmonary vascular remodeling in the rat. Circ Res. 2015. May 8;116(10):1680–1690. [DOI] [PubMed] [Google Scholar]
- 23. Ghosh MC, Zhang DL, Jeong SY, Kovtunovych G, Ollivierre‐Wilson H, Noguchi A, Tu T, Senecal T, Robinson G, Crooks DR, Tong WH, Ramaswamy K, Singh A, Graham BB, Tuder RM, Yu ZX, Eckhaus M, Lee J, Springer DA, Rouault TA. Deletion of iron regulatory protein 1 causes polycythemia and pulmonary hypertension in mice through translational derepression of HIF2α. Cell Metab. 2013. Feb 5;17(2):271–281. [DOI] [PMC free article] [PubMed] [Google Scholar]
- 24. Shao D, Park JES, Wort SJ. The role of endothelin‐1 in the pathogenesis of pulmonary arterial hypertension. Pharmacol Res. 2011. Jun;63(6):504–511. [DOI] [PubMed] [Google Scholar]
- 25. Ulrich A, Wharton J, Thayer TE, Swietlik EM, Assad TR, Desai AA, Gräf S, Harbaum L, Humbert M, Morrell NW, Nichols WC, Soubrier F, Southgate L, Trégouët DA, Trembath RC, Brittain EL, Wilkins MR, Prokopenko I, Rhodes CJ. Mendelian randomisation analysis of red cell distribution width in pulmonary arterial hypertension. Eur Respir J. 2020. Feb;55(2):1901486. [DOI] [PMC free article] [PubMed] [Google Scholar]
- 26. Förhécz Z, Gombos T, Borgulya G, Pozsonyi Z, Prohászka Z, Jánoskuti L. Red cell distribution width in heart failure: prediction of clinical events and relationship with markers of ineffective erythropoiesis, inflammation, renal function, and nutritional state. Am Heart J. 2009. Oct;158(4):659–666. [DOI] [PubMed] [Google Scholar]
- 27. Decker I, Ghosh S, Comhair SA, Farha S, Wilson Tang WH, Park M, Wang S, Lichtin AE, Erzurum SC. High levels of zinc‐protoporphyrin identify iron metabolic abnormalities in pulmonary arterial hypertension. Clin Transl Sci. 2011. Aug;4(4):253–258. [DOI] [PMC free article] [PubMed] [Google Scholar]
- 28. Wang W, Liu J, Yang Y, Zhai Z, Wang C, Wang J. Red cell distribution width is increased in chronic thromboembolic pulmonary hypertension. Clin Respir J. 2016. Jan;10(1):54–60. [DOI] [PubMed] [Google Scholar]
- 29. Humbert M, Kovacs G, Hoeper MM, Badagliacca R, Berger RMF, Brida M, Carlsen J, Coats AJS, Escribano‐Subias P, Ferrari P, Ferreira DS, Ghofrani HA, Giannakoulas G, Kiely DG, Mayer E, Meszaros G, Nagavci B, Olsson KM, Pepke‐Zaba J, Quint JK, Rådegran G, Simonneau G, Sitbon O, Tonia T, Toshner M, Vachiery JL, Vonk Noordegraaf A, Delcroix M, Rosenkranz S. 2022 ESC/ERS guidelines for the diagnosis and treatment of pulmonary hypertension. Eur Respir J. 2023;Jan 61(1):2200879. [DOI] [PubMed] [Google Scholar]
- 30. Ghio S, Fortuni F, Capettini AC, Scelsi L, Greco A, Vullo E, Raineri C, Guida S, Turco A, Gargiulo C, Oltrona Visconti L. Iron deficiency in pulmonary arterial hypertension: prevalence and potential usefulness of oral supplementation. Acta Cardiol. 2021. Apr;76(2):162–167. [DOI] [PubMed] [Google Scholar]
- 31. Olsson KM, Fuge J, Brod T, Kamp JC, Schmitto J, Kempf T, Bauersachs J, Hoeper MM. Oral iron supplementation with ferric maltol in patients with pulmonary hypertension. Eur Respir J. 2020. Nov;56(5):2000616. [DOI] [PMC free article] [PubMed] [Google Scholar]
- 32. Dumitrescu D, Kramer T, Hagmanns H, Gerhardt F, Viethen T, Baldus S, Rosenkranz S. P1624Intravenous iron substitution improves pulmonary diffusion capacity in patients with iron deficiency and precapillary pulmonary hypertension. Eur Heart J. 2018. Aug 1;39(suppl_1):ehy565.P1624. [Google Scholar]
- 33. Ruiter G, Manders E, Happé CM, Schalij I, Groepenhoff H, Howard LS, Wilkins MR, Bogaard HJ, Westerhof N, van der Laarse WJ, de Man FS, Anton VN. Intravenous iron therapy in patients with idiopathic pulmonary arterial hypertension and iron deficiency. Pulm Circ. 2015. Sep;5(3):466–472. [DOI] [PMC free article] [PubMed] [Google Scholar]
- 34. HowardHe LSGE, He J, Watson GMJ, Huang L, Wharton J, Luo Q, Kiely DG, Condliffe R, Pepke‐Zaba J, Morrell NW, Sheares KK, Ulrich A, Quan R, Zhao Z, Jing X, An C, Liu Z, Xiong C, Robbins PA, Dawes T, de Marvao A, Rhodes CJ, Richter MJ, Gall H, Ghofrani HA, Zhao L, Huson L, Wilkins MR. Supplementation with iron in pulmonary arterial hypertension. two randomized crossover trials. Ann Am Thorac Soc. 2021. Jun;18(6):981–988. [DOI] [PMC free article] [PubMed] [Google Scholar]
- 35. Skikne BS, Punnonen K, Caldron PH, Bennett MT, Rehu M, Gasior GH, Chamberlin JS, Sullivan LA, Bray KR, Southwick PC. Improved differential diagnosis of anemia of chronic disease and iron deficiency anemia: a prospective multicenter evaluation of soluble transferrin receptor and the sTfR/log ferritin index. Am J Hematol. 2011. Nov;86(11):923–927. [DOI] [PubMed] [Google Scholar]
- 36. Punnonen K, Irjala K, Rajamäki A. Serum transferrin receptor and its ratio to serum ferritin in the diagnosis of iron deficiency. Blood. 1997. Feb 1;89(3):1052–1057. [PubMed] [Google Scholar]
- 37. Simonneau G, Montani D, Celermajer DS, Denton CP, Gatzoulis MA, Krowka M, Williams PG, Souza R. Haemodynamic definitions and updated clinical classification of pulmonary hypertension. Eur Respir J. 2019. Jan;53(1):1801913. [DOI] [PMC free article] [PubMed] [Google Scholar]
- 38. Anker SD, Comin Colet J, Filippatos G, Willenheimer R, Dickstein K, Drexler H, Lüscher TF, Bart B, Banasiak W, Niegowska J, Kirwan BA, Mori C, von Eisenhart Rothe B, Pocock SJ, Poole‐Wilson PA, Ponikowski P. Ferric carboxymaltose in patients with heart failure and iron deficiency. N Engl J Med. 2009. Dec 17;361(25):2436–2448. [DOI] [PubMed] [Google Scholar]
- 39. Filippatos G, Farmakis D, Colet JC, Dickstein K, Lüscher TF, Willenheimer R, Parissis J, Gaudesius G, Mori C, von Eisenhart Rothe B, Greenlaw N, Ford I, Ponikowski P, Anker SD. Intravenous ferric carboxymaltose in iron‐deficient chronic heart failure patients with and without anaemia: a subanalysis of the FAIR‐HF trial. Eur J Heart Fail. 2013. Nov;15(11):1267–1276. [DOI] [PMC free article] [PubMed] [Google Scholar]
- 40. WHO guideline on use of ferritin concentrations to assess iron status in individuals and populations [Internet]. Geneva: World Health Organization; 2020. (WHO Guidelines Approved by the Guidelines Review Committee). http://www.ncbi.nlm.nih.gov/books/NBK569880/ [PubMed] [Google Scholar]
- 41. Kariotis S, Jammeh E, Swietlik EM, Pickworth JA, Rhodes CJ, Otero P, Wharton J, Iremonger J, Dunning MJ, Pandya D, Mascarenhas TS, Errington N, Thompson AAR, Romanoski CE, Rischard F, Garcia JGN, Yuan JXJ, An THS, Desai AA, Coghlan G, Lordan J, Corris PA, Howard LS, Condliffe R, Kiely DG, Church C, Pepke‐Zaba J, Toshner M, Wort S, Gräf S, Morrell NW, Wilkins MR, Lawrie A, Wang D, Bleda M, Hadinnapola C, Haimel M, Auckland K, Tilly T, Martin JM, Yates K, Treacy CM, Day M, Greenhalgh A, Shipley D, Peacock AJ, Irvine V, Kennedy F, Moledina S, MacDonald L, Tamvaki E, Barnes A, Cookson V, Chentouf L, Ali S, Othman S, Ranganathan L, Gibbs JSR, DaCosta R, Pinguel J, Dormand N, Parker A, Stokes D, Ghedia D, Tan Y, Ngcozana T, Wanjiku I, Polwarth G, Mackenzie Ross RV, Suntharalingam J, Grover M, Kirby A, Grove A, White K, Seatter A, Creaser‐Myers A, Walker S, Roney S, Elliot CA, Charalampopoulos A, Sabroe I, Hameed A, Armstrong I, Hamilton N, Rothman AMK, Swift AJ, Wild JM, Soubrier F, Eyries M, Humbert M, Montani D, Girerd B, Scelsi L, Ghio S, Gall H, Ghofrani A, Bogaard HJ, Vonk Noordegraaf A, Houweling AC, Veld AH, Schotte G, Trembath RC. Biological heterogeneity in idiopathic pulmonary arterial hypertension identified through unsupervised transcriptomic profiling of whole blood. Nat Commun. 2021. Dec 7;12(1):7104. [DOI] [PMC free article] [PubMed] [Google Scholar]
- 42. Quarck R, Nawrot T, Meyns B, Delcroix M. C‐Reactive protein. J Am Coll Cardiol. 2009. Apr 7;53(14):1211–1218. [DOI] [PubMed] [Google Scholar]
- 43. Sangkhae V, Nemeth E. Regulation of the iron homeostatic hormone hepcidin. Adv Nutr. 2017. Jan;8(1):126–136. [DOI] [PMC free article] [PubMed] [Google Scholar]
- 44. van der Hoeven MAHBM, Maertzdorf WJ, Blanco CE. Relationship between mixed venous oxygen saturation and markers of tissue oxygenation in progressive hypoxic hypoxia and in isovolemic anemic hypoxia in 8‐ to 12‐day‐old piglets. Crit Care Med. 1999. Sep;27(9):1885–1892. [DOI] [PubMed] [Google Scholar]
- 45. Choi JW, Pai SH. Reticulocyte subpopulations and reticulocyte maturity index (RMI) rise as body iron status falls. Am J Hematol. 2001. Jun;67(2):130–135. [DOI] [PubMed] [Google Scholar]
- 46. Urrechaga E, Borque L, Escanero JF. Erythrocyte and reticulocyte parameters in iron deficiency and thalassemia. J Clin Lab Anal. 2011;25(3):223–228. [DOI] [PMC free article] [PubMed] [Google Scholar]
- 47. Velasco‐Rodríguez D, Alonso‐Domínguez JM, González‐Fernández FA, Villarrubia J, Sopeña M, Abalo L, Ropero P, Martínez‐Nieto J, de la Fuente Gonzalo F, Cava F. Reticulocyte parameters of delta beta thalassaemia trait, beta thalassaemia trait and iron deficiency anaemia. J Clin Pathol. 2016. Feb;69(2):149–154. [DOI] [PubMed] [Google Scholar]
- 48. Bermejo F, García‐López S. A guide to diagnosis of iron deficiency and iron deficiency anemia in digestive diseases. World J Gastroenterol. 2009. Oct 7;15(37):4638–4643. [DOI] [PMC free article] [PubMed] [Google Scholar]
- 49. Grote Beverborg N, Klip IjT, Meijers WC, Voors AA, Vegter EL, van der Wal HH, Swinkels DW, van Pelt J, Mulder AB, Bulstra SK, Vellenga E, Mariani MA, de Boer RA, van Veldhuisen DJ, van der Meer P. Definition of iron deficiency based on the gold standard of bone marrow iron staining in heart failure patients. Circ Heart Fail. 2018. Feb;11(2):e004519. [DOI] [PubMed] [Google Scholar]
- 50. Karamanian VA, Harhay M, Grant GR, Palevsky HI, Grizzle WE, Zamanian RT, Ihida‐Stansbury K, Taichman DB, Kawut SM, Jones PL. Erythropoietin upregulation in pulmonary arterial hypertension. Pulm Circ. 2014. Jun;4(2):269–279. [DOI] [PMC free article] [PubMed] [Google Scholar]
- 51. Chang CC, Kass L. Clinical significance of immature reticulocyte fraction determined by automated reticulocyte counting. Am J Clin Path. 1997. Jul;108(1):69–73. [PubMed] [Google Scholar]
- 52. Buttarello M. Laboratory diagnosis of anemia: are the old and new red cell parameters useful in classification and treatment, how? Int J Lab Hematol. 2016. May;38(Suppl 1):123–132. [DOI] [PubMed] [Google Scholar]
- 53. Bhoopalan SV, Huang LJ, Weiss MJ. Erythropoietin regulation of red blood cell production: from bench to bedside and back. F1000Research. 2020;9:1153. [DOI] [PMC free article] [PubMed] [Google Scholar]
- 54. Tkaczyszyn M, Comín‐Colet J, Voors AA, van Veldhuisen DJ, Enjuanes C, Moliner P, Drozd M, Sierpiński R, Rozentryt P, Nowak J, Suchocki T, Banasiak W, Ponikowski P, van der Meer P, Jankowska EA. Iron deficiency contributes to resistance to endogenous erythropoietin in anaemic heart failure patients. Eur J Heart Fail. 2021. Oct;23(10):1677–1686. [DOI] [PubMed] [Google Scholar]
- 55. Tsiftsoglou AS. Erythropoietin (EPO) as a key regulator of erythropoiesis, bone remodeling and endothelial transdifferentiation of multipotent mesenchymal stem cells (MSCs): implications in regenerative Medicine. Cells. 2021. Aug 20;10(8):2140. [DOI] [PMC free article] [PubMed] [Google Scholar]
- 56. van der Staaij H, Donker AE, Bakkeren DL, Salemans JMJI, Mignot‐Evers LAA, Bongers MY, Dieleman JP, Galesloot TE, Laarakkers CM, Klaver SM, Swinkels DW. Transferrin saturation/hepcidin ratio discriminates TMPRSS6‐related iron refractory iron deficiency anemia from patients with multi‐causal iron deficiency anemia. Int J Mol Sci. 2022. Feb 8;23(3):1917. [DOI] [PMC free article] [PubMed] [Google Scholar]
- 57. Wang RS, Huang S, Waldo SW, Hess E, Gokhale M, Johnson SW, Zeder K, Choudhary G, Leopold JA, Oldham WM, Kovacs G, Freiberg MS, Tedford RJ, Maron BA, Brittain EL. Elevated pulmonary arterial compliance is associated with survival in pulmonary hypertension: results from a novel network Medicine analysis. Am J Respir Crit Care Med. 2023. Jun 5;208:312–321. [DOI] [PMC free article] [PubMed] [Google Scholar]
- 58. Weatherald J, Boucly A, Chemla D, Savale L, Peng M, Jevnikar M, Jaïs X, Taniguchi Y, O'Connell C, Parent F, Sattler C, Hervé P, Simonneau G, Montani D, Humbert M, Adir Y, Sitbon O. Prognostic value of follow‐up hemodynamic variables after initial management in pulmonary arterial hypertension. Circulation. 2018. Feb 13;137(7):693–704. [DOI] [PubMed] [Google Scholar]
- 59. Davis BH, Bigelow NC. Automated reticulocyte analysis: clinical practice and associated. Hematol Oncol Clin North Am. 1994. Aug;8(4):617–630. [PubMed] [Google Scholar]
- 60. Tsuda I, Tatsumi N. Maturity of reticulocytes in various hematological disorders. Eur J Haematol. 1989. Sep;43(3):252–254. [DOI] [PubMed] [Google Scholar]
- 61. Torres Gomez A, Casaño J, Sánchez J, Madrigal E, Blanco F, Alvarez MA. Utility of reticulocyte maturation parameters in the differential diagnosis of macrocytic anemias. Clin Lab Haematol. 2003. Oct;25(5):283–288. [DOI] [PubMed] [Google Scholar]
- 62. Kendall RG, Mellors I, Hardy J, McArdle B. Patients with pulmonary and cardiac disease show an elevated proportion of immature reticulocytes. Clin Lab Haematology. 2001. Feb;23(1):27–31. [DOI] [PubMed] [Google Scholar]
- 63. Marrone O, Salvaggio A, Gioia M, Bonanno A, Profita M, Riccobono L, Zito A, Insalaco G, Bonsignore MR. Reticulocytes in untreated obstructive sleep apnoea. Monaldi Arch Chest Dis. 2008. Sep;69(3):107–113. [DOI] [PubMed] [Google Scholar]
- 64. Lodish H, Flygare J, Chou S. From stem cell to erythroblast: regulation of red cell production at multiple levels by multiple hormones. IUBMB Life. 2010. Jul;62(7):492–496. [DOI] [PMC free article] [PubMed] [Google Scholar]
- 65. Kaiser R, Seiler S, Held M, Bals R, Wilkens H. Prognostic impact of renal function in precapillary pulmonary hypertension. J Intern Med. 2014. Feb;275(2):116–126. [DOI] [PubMed] [Google Scholar]
- 66. Smith TG, Talbot NP, Privat C, Rivera‐Ch M, Nickol AH, Ratcliffe PJ, Dorrington KL, León‐Velarde F, Robbins PA. Effects of iron supplementation and depletion on hypoxic pulmonary hypertension: two randomized controlled trials. JAMA. 2009. Oct 7;302(13):1444–1450. [DOI] [PubMed] [Google Scholar]
- 67. Satoh K, Kagaya Y, Nakano M, Ito Y, Ohta J, Tada H, Karibe A, Minegishi N, Suzuki N, Yamamoto M, Ono M, Watanabe J, Shirato K, Ishii N, Sugamura K, Shimokawa H. Important role of endogenous erythropoietin system in recruitment of endothelial progenitor cells in hypoxia‐induced pulmonary hypertension in mice. Circulation. 2006. Mar 21;113(11):1442–1450. [DOI] [PubMed] [Google Scholar]
- 68. van Albada ME, du Marchie Sarvaas GJ, Koster J, Houwertjes MC, Berger RMF, Schoemaker RG. Effects of erythropoietin on advanced pulmonary vascular remodelling. Eur Respir J. 2008. Jan;31(1):126–134. [DOI] [PubMed] [Google Scholar]
- 69. Asosingh K, Farha S, Lichtin A, Graham B, George D, Aldred M, Hazen SL, Loyd J, Tuder R, Erzurum SC. Pulmonary vascular disease in mice xenografted with human BM progenitors from patients with pulmonary arterial hypertension. Blood. 2012. Aug 9;120(6):1218–1227. [DOI] [PMC free article] [PubMed] [Google Scholar]
- 70. Bhagwani AR, Farkas D, Harmon B, Authelet KJ, Cool CD, Kolb M, Goncharova E, Yoder MC, Clauss M, Freishtat R, Farkas L. Clonally selected primitive endothelial cells promote occlusive pulmonary arteriopathy and severe pulmonary hypertension in rats exposed to chronic hypoxia. Sci Rep. 2020. Jan 24;10(1):1136. [DOI] [PMC free article] [PubMed] [Google Scholar]
- 71. Davie NJ, Crossno JT, Frid MG, Hofmeister SE, Reeves JT, Hyde DM, Carpenter TC, Brunetti JA, McNiece IK, Stenmark KR. Hypoxia‐induced pulmonary artery adventitial remodeling and neovascularization: contribution of progenitor cells. Am J Physiol Lung Cellular Molecular Physiol. 2004. Apr;286(4):L668–L678. [DOI] [PubMed] [Google Scholar]
- 72. Nickel N, Golpon H, Greer M, Knudsen L, Olsson K, Westerkamp V, Welte T, Hoeper MM. The prognostic impact of follow‐up assessments in patients with idiopathic pulmonary arterial hypertension. Eur Respir J. 2012. Mar;39(3):589–596. [DOI] [PubMed] [Google Scholar]
- 73. Rafanan AL, Golish JA, Dinner DS, Hague LK, Arroliga AC. Nocturnal hypoxemia is common in primary pulmonary hypertension. Chest. 2001. Sep;120(3):894–899. [DOI] [PubMed] [Google Scholar]
- 74. Jilwan FN, Escourrou P, Garcia G, Jaïs X, Humbert M, Roisman G. High occurrence of hypoxemic sleep respiratory disorders in precapillary pulmonary hypertension and mechanisms. Chest. 2013. Jan;143(1):47–55. [DOI] [PubMed] [Google Scholar]
- 75. Farha S, Asosingh K, Xu W, Sharp J, George D, Comhair S, Park M, Tang WHW, Loyd JE, Theil K, Tubbs R, Hsi E, Lichtin A, Erzurum SC. Hypoxia‐inducible factors in human pulmonary arterial hypertension: a link to the intrinsic myeloid abnormalities. Blood. 2011. Mar 31;117(13):3485–3493. [DOI] [PMC free article] [PubMed] [Google Scholar]
Associated Data
This section collects any data citations, data availability statements, or supplementary materials included in this article.
Supplementary Materials
Supplementary Figure 1. Correlation of IRF with hemodynamic variables in non‐iron deficient PAH patients according to the soluble transferrin receptor index definition: (A) mean pulmonary artery pressure (mPAP), (B) pulmonary vascular resistance (PVR), (C) cardiac index (CI), (D) pulmonary arterial compliance (PAC), (E) right atrial pressure (RAP), (F) stroke volume index (SVI), (G) mixed venous oxygen saturation (SvO2). Spearman correlation coefficients are depicted with 95% confidence intervals.
Supplementary Figure 2. Correlation of IRF with hemodynamic variables in PAH patients with transferrin saturation > 20%: (A) mean pulmonary artery pressure (mPAP), (B) pulmonary vascular resistance (PVR), (C) cardiac index (CI), (D) pulmonary arterial compliance (PAC), (E) right atrial pressure (RAP), (F) stroke volume index (SVI), (G) mixed venous oxygen saturation (SvO2). Spearman correlation coefficients are depicted with 95% confidence intervals.
Supplementary Figure 3. Box plots of the immature (A) and mature (B) reticulocyte counts in the pulmonary arterial hypertension (PAH) cohort vs. healthy controls. There was a significantly elevated immature reticulocyte count in the PAH cohort compared to HC [9.9 (6.7‐14.6) vs. 4.9 cells /mL (3.1‐7.2), P<0.001], and no significant difference in the absolute mature reticulocyte count between the two cohorts [73 (54‐88) vs. 66 cells /mL (49‐73), P=0.16].
Supplementary Figure 4. Correlation of hepcidin with iron deficiency markers: (A) transferrin saturation (TSAT), (B) log ferritin, (C) soluble transferrin receptor (sTfR) in the PAH cohort. Spearman correlation coefficients are depicted with 95% confidence intervals.
Supporting Information.