

SUMMARY
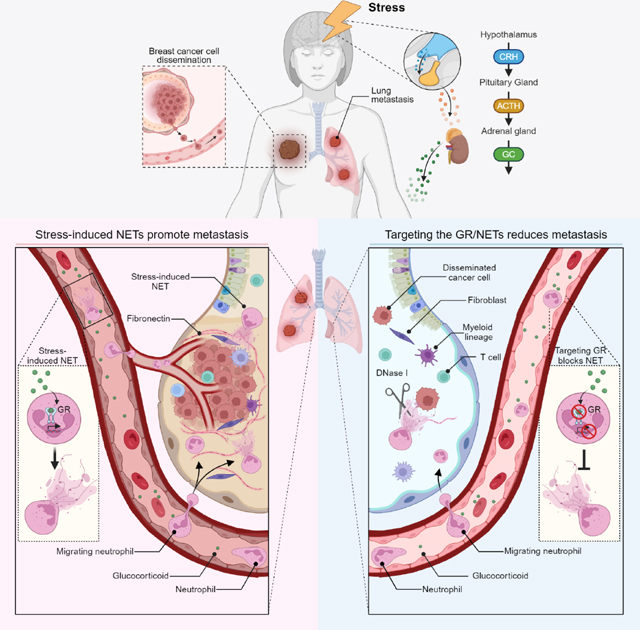
Chronic stress is associated with increased risk of metastasis and poor survival in cancer patients, yet the reasons are unclear. We show that chronic stress increases lung metastasis from disseminated cancer cells 2- to 4-fold in mice. Chronic stress significantly alters the lung microenvironment, with fibronectin accumulation, reduced T cell infiltration, and increased neutrophil infiltration. Depleting neutrophils abolishes stress-induced metastasis. Chronic stress shifts normal circadian rhythm of neutrophils and causes increased neutrophil extracellular trap (NET) formation via glucocorticoid release. In mice with neutrophil-specific glucocorticoid receptor deletion, chronic stress fails to increase NETs and metastasis. Furthermore, digesting NETs with deoxyribonuclease (DNase) I prevents chronic stress-induced metastasis. Together, our data show that glucocorticoids released during chronic stress cause NET formation and establish a metastasis-promoting microenvironment. Therefore, NETs could be targets for preventing metastatic recurrence in cancer patients, many of whom will experience chronic stress due to their disease.
Keywords: Chronic stress, neutrophil extracellular traps, glucocorticoids, metastasis, breast cancer
eTOC BLURB
Chronic stress is linked to increased metastasis in cancer patients, but the underlying mechanisms remain unclear. In this study, He et al. show that chronic stress increases metastasis by affecting neutrophils. Chronic stress, via glucocorticoids, alters neutrophils’ circadian rhythm and establishes a metastasis-promoting microenvironment by inducing neutrophil extracellular trap formation.
Graphical Abstract
INTRODUCTION
Cancer patients have many sources of severe stress, including worrying about their prognosis and enduring weeks of therapy. Chronic stress is a physiological process initiated by environmental and/or psychosocial factors. Stress affects memory, cognition, and behavior, as well as whole-body homeostasis, including the cardiovascular, gastrointestinal, and immune systems1. Chronic stress activates the hypothalamic-pituitary-adrenal axis, resulting in the release of glucocorticoid class stress hormones (cortisol in human and corticosterone in mouse)2. Glucocorticoids (GCs) bind to the glucocorticoid receptor (GR) to form a receptor-ligand complex, which regulates gene expression3. Chronic stress is associated with increased risk of metastasis and poor survival in cancer patients4,5. In mice, chronic stress can promote primary tumor growth, therapy resistance, and metastatic colonization from disseminated cancer cells (DCCs)6–8. While stress may promote metastasis by increasing the cancer cells’ ability to proliferate, migrate, and seed distant tissues6,9–11, the tissue being colonized must also support the DCCs’ outgrowth by establishing a pro-metastatic niche12. A key question remains: is metastasis affected by stress-induced changes to the host?
An elevated neutrophil-to-lymphocyte ratio indicates a dysregulated balance between innate and adaptive immune cells and is associated with poor prognosis in breast and other cancers13,14. This elevated ratio is also observed in animals and humans subjected to stress13,15,16. In the metastatic tissue microenvironment, T lymphocytes can keep DCCs dormant17,18, while neutrophils can promote metastasis. Neutrophils’ pro-metastatic effects include the inhibition of T cell-mediated immunosurveillance19 and formation of neutrophil extracellular traps (NETs)—meshes of DNA containing neutrophil proteins. NETs are released in response to e.g., pathogens. However, NETs also have pro-metastatic roles, including promoting cancer cell migration and invasion20,21, remodeling the extracellular matrix (ECM)22, and stimulating fibroblasts and immune cells (reviewed in 23,24). Here, we used mouse models to determine how chronic stress affects neutrophils to promote metastasis. Addressing how stress induces metastasis is critical for identifying cancer patients at-risk of recurrence and for developing metastasis preventing strategies.
RESULTS
Chronic stress promotes metastasis
To determine the effects of chronic stress on cancer progression, we first used the classical chronic restraint stress model2,25, which mimics exposure to predictable, constant stress, such as that which occurs after a cancer diagnosis. Daily restraint of mice increased their plasma corticosterone levels, an increase that were dependent on the adrenal glands (Figure S1A). We next subjected genetically engineered MMTV-PyMT mice, which develop mammary carcinomas, or mice orthotopically transplanted with breast cancer cells from MMTV-PyMT mice (hereafter, “PyMT cells”), to chronic restraint stress, starting from when their tumors first became palpable (Figures 1A and S1B). Chronic restraint stress approximately doubled tumor size and increased metastasis 2- to 4-fold (Figures 1B, 1C, S1C, S1D). Moreover, the immuno-microenvironment of the primary tumors showed decreased infiltration of T cells, B cells, natural killer (NK) cells, and activated macrophages, and increased infiltration of neutrophils (Figures S1E and S1F). Chronic restraint stress also increased spleen metastasis >5-fold in an orthotopic pancreatic cancer model (Figures S1G–J). To model the unpredictable stress experienced by cancer patients, e.g., due to treatment responses or financial concerns, we employed the chronic unpredictable mild stress (CUMS) model8,26,27: animals with disseminated PyMT cells in the lungs (after intravenous injection, i.e., an experimental metastasis model) were subjected to two randomly selected stressors daily (Figure S1K), resulting in elevated plasma corticosterone levels (Figure S1L). The mice also showed anxiety-like behavioral changes consistent with chronic stress exposure, namely, a decrease in the frequency and duration of time spent in the center in the open field test, and an increase in frequency and duration within the closed arm in an elevated plus maze test (Figures S1M and S1N). Finally, CUMS-exposed mice experienced a doubling in lung metastasis (Figures 1D–G). Thus, the ability to increase metastasis was comparable between the chronic restraint stress and CUMS models.
Figure 1. Chronic stress promotes metastasis.

(A) Schematic of restraint stress exposure of the MMTV-PyMT breast tumor model.
(B) Tumor growth curve (left) (n=10 for control, n=16 for stress) and tumor weight (right, endpoint) (n=12 for control, n=11 for stress) of primary MMTV-PyMT tumors. Tumor volume/weight indicated is the total volume/weight of all tumors for each mouse.
(C) Lung metastatic burden in MMTV-PyMT mice exposed to chronic restraint stress and their controls (n=21 for control, n=16 for stress).
(D) Schematic of the chronic unpredictable mild stress (CUMS) exposure of an experimental lung metastasis model.
(E–G) H&E staining of lung sections after CUMS exposure at endpoint (E), number of lung metastatic lesions (F) and total metastatic burden (G) (n=10 for control, n=15 for stress).
(H) Schematic of corticosterone pellet treatment in the spontaneous dissemination model.
(I) Representative H&E staining of lungs at the endpoint from (H).
(J, K) Number of lung metastatic lesions (J) and total metastatic burden (K) from (H) (n=5 mice/group).
Data are represented as mean ± SEM. *P<0.05; **P<0.01 (B, F, G, J, K: two-tailed unpaired Student’s t-test; C: two-tailed Mann-Whitney test). See also Figures S1 and S2.
The elevated plasma corticosterone levels in both stress models and prior reports on corticosterone’s metastasis-promoting effects6,11 prompted us to test whether corticosterone was sufficient to promote metastasis. We refined our metastasis model by transplanting mice with primary PyMT cells to allow spontaneous dissemination before surgical removal of the primary tumors (Figure 1H). After the primary tumor was removed, the implantation of slow-releasing corticosterone pellets increased both the numbers of metastatic lesions and total metastatic burden compared to placebo pellets (Figures 1I–K).
Corticosterone can promote breast cancer metastasis by activating the tyrosine kinase ROR1 in cancer cells6. To determine whether stress-induced corticosterone promoted metastasis through direct effects on the cancer cells, we generated GR-null PyMT cell lines using CRISPR/Cas9-mediated gene editing of the GR-encoding gene Nr3c1 (Figure S2A). Deleting the GR did not affect cancer cell proliferation in vitro under normal culture conditions nor in cultures supplemented with corticosterone or the synthetic GC dexamethasone (Dex) (Figures S2B–D). Parental PyMT cell proliferation was also not affected by corticosterone or Dex supplementation (Figure S2E). Chronic restraint stress still increased metastasis from GR-deleted PyMT cells (Figures S2F–H), and there was no selection against GR-deleted cells in the metastases from the Nr3c1-null PyMT lines (Figure S2I). Together, these results indicate that chronic stress promoted metastasis from DCCs independently of cancer cell GR expression.
Chronic stress induces a pro-metastatic microenvironment
Given that the cancer cell GR played no role in stress-induced metastasis, we hypothesized that microenvironmental changes were critical for stress-induced metastasis. To characterize such changes, we analyzed the lungs of mice subjected to chronic stress by bulk RNA sequencing (RNA-seq). From a gene ontology (GO) analysis, we found that stress significantly upregulated the expression of genes related to ECM organization and downregulated genes involved in T cell activation and the adaptive immune response, compared to controls (Figures 2A and S3A). Consistent with the GO analysis, lungs from stress-exposed mice or mice treated with corticosterone or Dex had a marked increase in the deposition of fibronectin (Figures 2B, S3B, and S3C), a metastasis-promoting ECM protein28. Using immunofluorescence, we found that fibronectin in the lungs of chronically stressed mice was associated with cells expressing markers of fibroblasts: α-SMA (smooth muscle actin) and PDGFR (platelet-derived growth factor receptor)-α (Figure S3D). Also consistent with the GO analysis, T cell infiltration was reduced in the lungs of chronically stressed mice (Figures 2C and S3E). Nevertheless, stress-induced lung metastasis was not decreased in mice with conditional GR deletion in T cells (GRΔT mice: Lck-icre; Nr3c1fl/fl mice, Figures 2D, 2E, S3F, and S3G).
Figure 2. Chronic stress establishes a pro-metastatic lung microenvironment.

(A) Gene Ontology (GO) term analysis of enriched pathways in the lungs of control and stressed mice (bulk RNA-seq; n=2 mice/condition).
(B) Representative immunofluorescence staining (left) and normalized integrated density (IntDen) of fibronectin in lungs at experimental day 21. DAPI stains DNA (n=5 mice/group).
(C) T cell populations in the lungs determined by flow cytometry at experimental day 21 (n=5 mice/group).
(D) Schematic of chronic restraint stress exposure in the spontaneous breast cancer dissemination model used for (E–G).
(E) Total metastatic burden of mice of indicated genotype at the endpoint of stress exposure (n=4–7 mice for each group).
(F, G) Lung infiltration of neutrophils at day 21 (F, immunofluorescence staining for myeloperoxidase [MPO] with DAPI counterstaining; G, flow cytometry; n=10 mice in control and stress groups, n=6 in Dex group).
(H) Schematic of neutrophil-CD8+ T cell co-culture assay.
(I) Percentage of activated CD8+T cells (indicated by expression of CD69, CD137, Granzyme B, or IFN-γ) in neutrophil co-cultures (H) determined by flow cytometry (n=5 mice/group,).
(J) Schematic of chronic restraint stress exposure in experimental lung metastasis model with neutrophil depletion.
(K) Lung metastatic lesions and the total metastatic burden after stress exposure and neutrophil depletion with anti-Ly6G antibodies (n=9–12 mice/group).
Data are represented as mean ± SEM. *P<0.05; **P<0.01; ***P<0.001; ****P<0.0001; N.S., not significant (B, C: two-tailed unpaired Student’s t-test; E, G, K: one-way ANOVA with Dunnett’s multiple comparisons test; I: one-way ANOVA with Tukey’s multiple comparison test). See also Figure S3.
A common feature of pro-metastatic niches is the infiltration of myeloid-derived cells, especially neutrophils12,19. In the lungs of stressed mice, we observed elevated mRNA and protein levels of two chemokines, Cxcl2 and Cxcl5, that mediate neutrophil recruitment (Figures S3H and S3I). Consistently, we found that chronic restraint stress or treatment with GCs increased neutrophil infiltration in the lungs and the percentage of neutrophils circulating in blood (Figures 2F, 2G, S3J, and S3K). These increases were accompanied by an expansion of stem and progenitor cell populations in bone marrow (LSKs [Lin/Sca1+/c-Kit+ cells] and GMPs [granulocyte-monocyte progenitors]) during chronic stress exposure (Figure S3L). Antibiotic treatment did not affect the lung infiltration of neutrophils, monocytes, dendritic cells, or total T cells in stressed mice, although a reduction in γδ T cell infiltration was observed (Figure S3M and S3N). This result suggested that the changes in immune cell infiltration were not due to infections caused by stress-induced immunosuppression.
A reduced adaptive immune response can enable DCCs to form metastases18, we tested whether there was crosstalk between neutrophils and T cells. CD8+ T cells were incubated overnight with neutrophils, either pharmacologically activated with a GR agonist (GSK9027) or vehicle-treated, to determine effects on anti-CD3-induced T cell activation (i.e., CD69, CD137, Granzyme B, and IFN-γ expression). GSK9027-treated neutrophils failed to activate the T cells, while vehicle-treated neutrophils were able to (Figures 2H and 2I). Consistently, the GSK9027-treated neutrophils secreted increased levels of several cytokines, including interleukin (IL)-10 (Figure S3O), a known suppressor of T cell activation. Finally, we sought to determine neutrophils’ importance in vivo by depleting them in an experimental lung metastasis model (Figures 2J and S3P). In the neutrophil-depleted mice, stress exposure no longer increased metastasis (Figures 2K). Together, these data show that chronic stress induces a pro-metastatic lung microenvironment and that neutrophils play a key role in orchestrating stress-induced metastasis.
Stress alters neutrophil diurnal aging and induces NET formation through GR signaling
To investigate how stress affects neutrophils to drive metastasis, we analyzed the gene expression changes of neutrophils isolated from the lungs of stressed mice (Figure S4A). Most of the top upregulated genes, e.g., Zbtb16, Map3k6, Hif3a, and Fkbp5, overlapped with the genes upregulated in bone marrow-derived neutrophils treated with either Dex or GSK9027 (Figures S4A and S4B). Moreover, a gene set enrichment analysis showed that neutrophils isolated from the lungs of stressed mice showed significant upregulation of the gene signature of in vitro Dex- or GSK9027-treated neutrophils (Figures S4C–F). These findings suggested that the gene expression changes in the neutrophils of stress-exposed mice were primarily caused by GCs. We therefore used in vitro GSK9027-treated neutrophils to determine that the GR was recruited to the sites of the top upregulated genes, including Zbtb16, Per1, Fkbp5, and Map3k6, as assessed by chromatin immunoprecipitation sequencing (ChIP-seq) (Figure S4G) and validated by ChIP-qPCR (Figure S4H).
Dex treatment upregulated genes involved in the circadian clock and oxidative stress response in neutrophils (Figure 3A). Neutrophils undergo major circadian fluctuations in phenotype and behavior, including in trafficking and NET formation—changes that are regulated by their cell-intrinsic clock29 and by oscillatory microenvironmental expression of the chemokine CXCL1230. We found that the GR directly controlled expression of the key clock gene, Per1, in neutrophils (Figures S4G and S4H)31. Plasma corticosterone levels undergo diurnal changes (Figure S5A)32, and in neutrophils, so did both Nr3c1 mRNA and GR protein expression (Figures S5B and S5C). Chronic stress exposure shifted the normal diurnal fluctuation in neutrophil numbers in the blood, with the peak of neutrophil numbers occurring 5–8 hours earlier than normally (Figure S5D). Additionally, the percentage of neutrophils out of all leukocytes was higher in the stressed mice than control mice for most of the diurnal cycle (Figure S5E). Chronic stress also shifted the expression of surface markers for trafficking/aging on the neutrophils (Figures S5F and S5G). Therefore, we inspected key genes involved in regulating the diurnal aging process in neutrophils, which underlies the circadian fluctuation in the neutrophils’ activities29. Dex treatment increased the expression of clock-related genes, especially Per1 and Per2, and induced gene expression changes in neutrophil diurnal aging markers (low Cxcr2 and high Cxcr4, Figure 3B), suggesting an abnormally “aged” phenotype. A similar change in the expression of clock-related genes was also observed in neutrophils isolated from the lungs of stressed mice (Figures S5H). At the protein level, neutrophils from the blood of stressed mice showed increased CXCR4 and reduced CD62L expression, consistent with a diurnal “aged” phenotype (Figures S5I and S5J), and neutrophils from Dex- or corticosterone-treated mice showed reduced CD62L expression (Figures S5K and S5L). Notably, a high tumor burden can alter neutrophil phenotype33, and in tumor-bearing animals, stress exposure did not further alter the expression of neutrophil aging markers (Figure S5M).
Figure 3. Glucocorticoids induce NETs through the GR.

(A) Gene Ontology (GO) term analysis of enriched pathways in bone marrow-derived neutrophils with or without dexamethasone (Dex) treatment for 4 hours (n=2 biological replicates).
(B, C) Heatmap of selected genes, including (B) circadian clock genes and genes related to migration and inflammation/survival (categorized as in 29) and (C) oxidative and antioxidative genes. Color scale indicates log2 fold-change in transcripts per million (TPM) for each gene relative to the average TPM of control samples (n=2 biological replicates, each pooled from two mice).
(D) Enzyme-linked immunosorbent assay (ELISA) analysis of plasma samples for corticosterone (left) and NETs (right) from control and stressed mice (21 days) subjected to adrenalectomy (AGX) or sham surgery (n=4–5 mice/group).
(E) NET formation assessed by immunofluorescence co-staining for anti-MPO and anti-histone H2B, with DAPI staining, of mouse neutrophils cultured overnight under indicated conditions (veh: vehicle).
(F, G) NET release [quantified as % field of view (FOV) covered by NETs] of mouse neutrophils cultured under indicated conditions (dots represents FOV, neutrophils were from 2–8 mice/group).
(H) Spontaneously formed NETs (yellow arrows) in ex vivo cultures of neutrophils isolated from the blood of mice of indicated genotype after 14 days of chronic restraint stress [left: representative immunofluorescence staining; right: quantification (n=4 mice/group)].
(I) Mouse neutrophils from mice of indicated genotype were cultured in vitro as indicated, and NET formation was assessed and quantified as in (E) and (F) (dots represents FOV, neutrophils were from 2 mice/group).
Data are represented as mean ± SEM. *P<0.05; **P<0.01; ***P<0.001; ****P<0.0001; N.S., not significant (D, F, G, H: one-way ANOVA with Dunnett’s multiple comparisons test; I: two-tailed unpaired Student’s t-test). See also Figures S4–7.
Neutrophils with low CD62L expression produce more reactive oxygen species (ROS)34. Consistently, we observed upregulation in oxidative and downregulation in anti-oxidative gene expression in GSK9027-treated neutrophils (Figure 3C), as well as increased cellular ROS levels (Figure S5N). Neutrophils with increased ROS levels are more prone to form NETs34,35 and oxidative genes, e.g., Ncf1, regulate NET formation36. We found that circulating neutrophils from stressed mice spontaneously formed more NETs ex vivo (Figures S6A and S6B) than control neutrophils. We also detected more NETs in plasma from chronically stressed than control mice (Figures 3D and S6C). Moreover, we found that plasma NET levels were not increased in chronically stressed mice that had undergone adrenalectomy before stress exposure (Figure 3D) and that corticosterone-treated mice had increased levels of NETs in their plasma and lungs (Figures S6D and S6E). Together, these data suggest that GCs released during stress cause NET formation.
To determine whether GCs directly induce NET formation, we isolated neutrophils from bone marrow and stimulated them ex vivo. Similar to a classical NET inducer—phorbol 12-myristate 13-acetate (PMA)—corticosterone, Dex, and GSK9027 all induced NETs, while epinephrine, also released during stress, did not (Figures 3E and 3F). GCs also induced NET formation in neutrophils from healthy human donors (Figure S6F). Next, we sought to characterize the signaling pathway mediating glucocorticoid-induced NET formation. Unlike PMA-induced NETs, GC-induced NETs did not require peptidyl arginine deiminase-4 (PAD4) activity (Figures 3G and S6G). NET formation can be regulated by cyclin-dependent kinases 4 and 6 (CDK4/6)37, and GSK9027 induced GR occupancy at the gene site of Ccnd3, which encodes Cyclin D3 (CCDN3), a regulator of CDK4/6 (Figures S4G and S4H). We further determined that GSK-treated neutrophils upregulated CCDN3 protein expression (Figure S6H). In addition to CCND3-mediated regulation, MAPK signaling can also regulate CDK4/6 activity38, and we found that p38 MAPK phosphorylation, indicative of kinase activation, was increased in GSK-treated neutrophils (Figure S6H). These data are consistent with the GSK-induced GR binding to the gene site of Map3k6 (Figures S4G and S4H), which encodes the kinase ASK2, an upstream activator of p38 MAPK39,40. We thus tested two CDK4/6 inhibitors (abemaciclib and palbociclib) and a transcriptional activity inhibitor (α-Amanitin) and found that they effectively prevented GC-induced NET formation (Figures 3G and S6G). In addition, GC-induced NETs also depended on cathepsin G activity (Figures 3G and S6G). Furthermore, using two separate ROS inhibitors, we found that ROS were required for GC-induced NET formation, p38 MAPK phosphorylation, and cyclin D3 upregulation (Figures S6I–K). Together, our data suggest a model in which GC-induced ROS leads to cyclin D3 upregulation and p38 MAPK phosphorylation, together increasing CDK4/6 activity, and culminating in NET formation.
To determine the importance of neutrophil GR signaling for NET formation in vivo, we generated mice with conditionally deleted GRs in neutrophils: Mrp8-cre; Nr3c1fl/fl mice (hereafter, “GRΔNeu mice”) (Figures S7A–D). In contrast to neutrophils from littermate GRWT (Nr3c1fl/fl) control mice, neutrophils from stress-exposed GRΔNeu mice did not show increased spontaneous NET formation ex vivo (Figure 3H). Moreover, corticosterone, Dex, and GSK9027 failed to induce NET formation in neutrophils from GRΔNeu mice (Figures 3I and S7E). Collectively, our results show that GC-GR signaling altered neutrophil gene expression, caused an abnormal diurnal aging phenotype, and increased spontaneous NET formation during chronic stress.
Targeting stress-induced NETs rescues metastases
We next assessed additional effects of the GR on neutrophil phenotypes. GR deletion in neutrophils did not alter the percentage of neutrophils in blood under normal conditions (Figure S7F). Furthermore, whereas chronic stress reduced the life span of circulating neutrophils, this effect was not GR-dependent (Figure S7G). However, neutrophils from GRΔNeu mice exhibited increased migration and phagocytic ability in vivo (Figure S7H and S7I). Next, we examined the expression of aging markers: whereas CD62L levels were reduced after chronic stress in wild-type mice (Figure S5J), neutrophils from stressed GRΔNeu mice had significantly higher CD62L expression than neutrophils from stressed littermate GRWT mice (Figure S7J). Conversely, whereas CXCR4 expression was increased in neutrophils from stressed GRWT mice, CXCR4 expression was not significantly increased in stressed GRΔNeu mice (Figure S7K). Together, these data suggest that neutrophils from GRΔNeu mice did not undergo the same abnormal, stress-induced diurnal aging as those from GRWT mice. Furthermore, chronic stress did not induce fibronectin deposition in the lungs of GRΔNeu or neutrophil-depleted wild-type mice (Figures 4A, 4B, S7L, and S7M). To test whether the neutrophil GR is required for stress-induced metastasis, GRWT and GRΔNeu mice were orthotopically transplanted with primary PyMT cells, allowing spontaneous cancer cell dissemination. Loss of the GR in neutrophils did not affect growth of the primary tumors prior to surgical resection and stress exposure (Figure S7N). However, strikingly, GR deletion in neutrophils abrogated chronic stress-induced lung metastasis from breast DCCs (Figure 4C) and pancreatic cancer metastasis to the spleen (Figure S7O).
Figure 4. Glucocorticoid-induced NETs are required for stress-induced lung metastasis.

(A, B) Representative fibronectin immunofluorescence staining (A) and quantification of staining (B) in the lungs of mice with indicated genotype, subjected or not subjected to chronic restraint stress for 21 days (n=3–4 mice/group).
(C) Number of lung metastatic lesions and total lung metastatic burden of mice with indicated genotype using the spontaneous dissemination model followed by chronic restraint stress for 49 days (experimental design as in Fig. 2D; n=10–14 mice/group).
(D–F) Stress-induced NET formation in the lungs of mice (D), detected by immunofluorescence staining (yellow arrows indicate NETs; lungs analyzed 24 days after primary tumor resection). (E) Representative fibronectin immunofluorescence staining in the lungs of non-tumor-bearing mice, treated as indicated for 21 days. (F) NET plasma levels (left) and lung fibronectin expression (right) of mice treated as depicted in (G) (left: n=4 mice/group; right: n=3 mice/group).
(G) Schematic of spontaneous dissemination model combined with chronic restraint stress and DNase I treatment.
(H–J) (H) Representative H&E staining (upper row) and immunofluorescence for proliferating (Ki67+) PyMT cancer cells (bottom row) in lungs at endpoint (see G). (I) Lung metastatic lesions and (J) total metastatic burden at endpoint (see G) (n=8–17 mice/group).
(K) Kaplan-Meier plots of the overall survival of breast cancer patients with high (black line) or low (red line) “chronic stress exposure gene signature” segmented by subtypes using data from the Kaplan-Meier Plotter (http://www.kmplot.com/, n is indicated in each plot, and subtypes are specified in the figure).
Data are represented as mean ± SEM. *P<0.05; **P<0.01; ***P<0.001; ****P<0.0001; N.S., not significant (B: one-way ANOVA with Dunnett’s multiple comparisons test; C, F, G, I, J: one-way ANOVA with Tukey’s multiple comparison test). See also Figure S7.
Considering the pro-metastatic effects of NETs41 and the GR-dependent elevated NET levels observed in chronically stressed mice, we tested whether NETs were required for stress-induced metastasis. Treating stressed mice daily with NET-digesting deoxyribonuclease (DNase) I effectively decreased their NET levels in both lungs and plasma (Figures 4D–F). Furthermore, DNase I abolished stress-induced fibronectin deposition in the lungs, without affecting neutrophil infiltration (Figures 4E, 4F, and S7P), suggesting that NETs are required for stressed-induced fibronectin deposition. DNase I reduced experimental lung metastasis in non-stressed control mice, confirming that NETs in the PyMT model are pro-metastatic regardless of whether they are stress-induced (Figure S7Q). Dramatically, in the spontaneous dissemination model (Figure 4G), using mice with comparable tumor sizes at the time of surgical removal (Figure S7R), DNase I-mediated NET digestion reduced stress-induced lung metastasis: compared to the highly proliferative metastases in the lungs of stressed control mice, the DCCs in the lungs of DNase I-treated stressed mice were largely non-proliferating (Figure 4H), and DNase I caused a striking reduction in stress-induced metastasis (Figures 4H–J). Similarly, stress-induced pancreatic cancer metastasis to the spleen was reduced by DNase I (Figures S7S and S7T).
To our knowledge, there have been no clinical studies linking stress, GC levels, and NETs with cancer patient outcomes. A key barrier to such an analysis is the circadian fluctuations of plasma GC levels: it is impractical to synchronize plasma collection times with individual patients’ diurnal rhythms. To explore associations between molecular indicators of stress exposure and breast cancer patient survival, we generated a “chronic stress exposure” gene signature. As our RNA-seq analysis of lung tissue showed that the stress-induced downregulation of pathways and genes was more pronounced than the upregulation (Figure 2A), we focused on downregulated genes. The signature comprised the top 50 highest-expressed genes among the top 100 downregulated genes when comparing the primary tumors of control and chronic restraint stress-exposed mice (Figures S7U–W, additional details in Methods). We found that patients with breast cancer whose tumors exhibited the chronic stress-exposed gene expression signature (with low expression of the stress-downregulated genes) had reduced overall survival (Figure 4K). The reduced overall survival was notable for patients with breast cancer positive for the estrogen receptor [ER] and progesterone receptor [PR], but did not reach significance for patients with human epidermal growth factor receptor 2 [HER2] (p=0.059) or triple-negative breast cancers (Figure 4K).
In summary, our data reveal that chronic stress exposure drives metastasis through the release of GCs. These GCs establish a pro-metastatic microenvironment by inducing neutrophils to form NETs.
DISCUSSION
Here, we used two mouse models that have been used extensively in studies of stress-related disorders42–44 to demonstrate that chronic stress increases metastasis. A key driver of stress-induced metastasis was GCs, through their effects on neutrophils. This finding agrees with prior reports that elevated GCs promote metastasis6,11 and immune dysfunction45–48. We identified NETs as a critical factor in stress-induced metastasis. Importantly, the presence of NETs in the lungs and liver has been associated with the subsequent development of metastases in breast cancer patients20, and it is now clear that NETs promote metastasis through multiple parallel mechanisms (reviewed in24,41).
We showed that the GR is required for stress-induced NET formation and identified several GC-activated downstream target genes in neutrophils. It is unclear which GR target(s) mediate NET formation, but we note that inhibitors of CDK4/6, cathepsin G, and ROS all blocked GC-induced NET formation. PAD4 is classically required for NET formation, but inhibiting it had no effect on GC-induced NETs, in agreement with a previous report that neutrophils promote stress-induced metastasis independently of PAD449.
Stress had multiple effects on neutrophils. The percentage of neutrophils, relative to other white blood cells, increased in the circulation, and myeloid progenitor cell populations in the bone marrow expanded. Other effects of stress on neutrophils included abnormal diurnal rhythm and increased NET formation; future studies are needed to determine whether the abnormal diurnal rhythms of neutrophils, and potentially other immune cells, promote metastasis. Most of the observed effects of stress, including NET formation, depended on neutrophil GR expression. However, the chronic stress-induced reduction in neutrophil life span was GR-independent, highlighting that chronic stress affects the host via additional mechanisms besides GR activation. We note that GCs’ effects may be cell-type dependent, as GCs can inhibit intracellular ROS production in some cell types50,51, while increasing ROS production in neutrophils (this study), cancer cells52, chondrocytes53, and hippocampal tissue54,55.
In the metastatic niche, the adaptive immune system can prevent cancer cells from forming metastases17. GCs have previously been shown to play a tumor-promoting role by reducing T cell infiltration47, but we found that GCs did not act directly on T cells to promote stress-induced metastasis. Rather, GC-stimulated neutrophils may inhibit cytotoxic T cell activation—an idea supported by previous reports that neutrophils can promote metastasis by inhibiting T cell-mediated immunosurveillance19,56,57. In addition to being immunosuppressive, the pro-metastatic niche is characterized by vascular leakiness, bone marrow-derived cell recruitment, and ECM alterations12,58. In the lungs of stressed animals, we observed an accumulation of fibronectin, which promotes the adhesion of bone marrow-derived cells and cancer cells in the pro-metastatic niche28. We found that stress-induced fibronectin protein expression in the lung was associated with fibroblasts, yet, specifically depended on GR expression in neutrophils and on NETs. This result suggests that NETs stimulate fibroblasts to secrete fibronectin. Therefore, targeting NETs could have broad, normalizing effects on the lung microenvironment. Moreover, reducing the elevated plasma levels of NETs observed during chronic stress may also be beneficial, as NETs in blood can support circulating cancer cells, damage the endothelium, and cause blood clots59–62.
Similar to chronic stress, cellular aging is also associated with cancer progression63,64 and chronic inflammation: so-called “inflammaging”65. Interestingly, inflammaging and chronic stress share many phenotypes, including increased gut permeability66, cellular senescence67, and immune cell dysregulation68. Additionally, neutrophils from aged mice, like stressed mice, have a higher spontaneous NET formation rate ex vivo69. These similarities suggest that beyond the chronic stress context, NETs could also be important targets in elderly cancer patients.
Altogether, our study strongly suggests that reducing stress for cancer patients should be an integrated component of cancer treatment. Additionally, our study has implications for the use of synthetic GCs, which are widely used to overcome the side effects of chemotherapy and to treat symptoms of advanced cancer. Indeed, at least in mice, there is now ample evidence that GCs can promote metastasis and reduce therapy responses6,7,47,70. Thus, the possibility that stress and synthetic GC treatment are detrimental to cancer patient survival warrants further investigation.
METHODS
RESOURCE AVAILABILITY
Lead contact
Further information and requests for resources and reagents should be directed to and will be fulfilled by the lead contact, Mikala Egeblad (mikala.egeblad@jhmi.edu).
Materials availability
Plasmids and vectors used in this study are available at Addgene (LentiV_Cas9_puro, #108100, and LRG2.1_Neo, #125593). Mouse lines used in this paper are all available at Jackson Lab, as listed in the key resources table. Mouse C57BL/6-PyMT cell line generated in this study is available upon request to David Spector. Mouse C57BL/6-PyMT-Cas9-SgNr3c1/SgRosa cell lines are available upon request to Xue-Yan He.
KEY RESOURCES TABLE
| REAGENT or RESOURCE | SOURCE | IDENTIFIER |
|---|---|---|
| Antibodies | ||
| Glucocorticoid Receptor antibody (G-5) | Santa Cruz Biotechnology | Cat #sc-393232 |
| glyceraldehyde-3-phosphate dehydrogenase (GAPDH) antibody (0411) | Santa Cruz Biotechnology | Cat #sc-47724 |
| IRDye 800CW Goat anti-Mouse IgG Secondary antibody | LI-COR Biosciences | Cat #926–32210 |
| Human/Mouse Myeloperoxidase/MPO antibody | R&D Systems | Cat #AF3667 |
| Anti-Histone H3 (citrulline R2 + R8 + R17) antibody | Abcam | Cat #ab5103 |
| Goat polyclonal anti-Neutrophil Elastase antibody | Santa Cruz Biotechnology | Cat #sc-9521 |
| Rat monoclonal anti-PyMT antigen | Abcam | Cat #ab15085 |
| Alexa Fluor® 488 donkey anti-rabbit IgG secondary antibody | Thermo Fisher Scientific | Cat #A21206 |
| Alexa Fluor® 568 donkey anti-goat IgG secondary antibody | Thermo Fisher Scientific | Cat #A11057 |
| Alexa Fluor® 488 donkey anti-mouse IgG secondary antibody | Thermo Fisher Scientific | Cat #A21202 |
| Alexa Fluor® 488 donkey anti-rat IgG secondary antibody | Thermo Fisher Scientific | Cat #A21208 |
| Alexa Fluor® 647 donkey anti-rat IgG secondary antibody | Thermo Fisher Scientific | Cat #A48272 |
| Ki-67 (D3B5) Rabbit mAb (monoclonal antibody) (Alexa Fluor® 647 Conjugate) | Cell Signaling Technology | Cat #12075 |
| Alpha smooth muscle actin antibody (Cy3 Conjugated) | Sigma | Cat #C6198 |
| PDGFR-alpha antibody | Thermo Fisher Scientific | Cat #14–1401-82 |
| Fibronectin monoclonal antibody (FBN11) | Thermo Fisher Scientific | Cat #MA5–11981 |
| Neutrophil Elastase antibody (G-2) | Santa Cruz Biotechnology | Cat #sc-55549 |
| anti-DNA-peroxidase conjugated antibody | Sigma | Cat #11544675001 |
| Glucocorticoid Receptor antibody | Thermo Fisher Scientific | Cat #MA1–510 |
| Glucocorticoid Receptor antibody | Thermo Fisher Scientific | Cat #PA1–511A |
| Glucocorticoid Receptor antibody | Abcam | Cat #ab3671 |
| Cyclin D3 antibody | Cell Signaling Technology | Cat #2936 |
| CDK4 antibody | GeneTex | Cat #GTX102993 |
| CDK6 antibody | Abcam | Cat #Ab54576 |
| Phospho-p38 MAPK (Thr180/Tyr182) antibody | Cell Signaling Technology | Cat #9211 |
| p38 MAPK antibody | Cell Signaling Technology | Cat #8690 |
| HSP90 antibody | Cell Signaling Technology | Cat #4874 |
| Alexa Fluor® 647 anti-mouse CD3 antibody | BioLegend | Cat #100209 |
| Purified anti-mouse CD3ε antibody | BioLegend | Cat #100302 |
| Biotin anti-mouse CD3 antibody | BioLegend | Cat #100244 |
| FITC anti-mouse CD4 antibody | BioLegend | Cat #100510 |
| APC/Cy7 anti-mouse Ly6C antibody | BioLegend | Cat #128026 |
| FITC anti-mouse CD69 antibody | BioLegend | Cat #104505 |
| PE Rat Anti-CD11b Clone M1/70 (RUO) antibody | BD Biosciences | Cat #557397 |
| PE/Cy7 anti-mouse CD11c antibody | BioLegend | Cat #107508 |
| PE anti-mouse γδTCR antibody | BioLegend | Cat #107507 |
| FITC anti-mouse CD8a antibody | BioLegend | Cat #100706 |
| APC anti-mouse CD8a antibody | BioLegend | Cat #100711 |
| FITC anti-mouse Granzyme B antibody | BioLegend | Cat #515403 |
| anti-mouse CD137 antibody | BioLegend | Cat #106105 |
| anti-mouse IFN-γ antibody | BioLegend | Cat #505807 |
| FITC anti-mouse Ly6G antibody | BioLegend | Cat #127605 |
| Alexa Fluor® 488 anti-mouse CD62L antibody | BioLegend | Cat #104420 |
| CD184 (CXCR4) monoclonal antibody (2B11) | eBioscience™ | Cat #14–9991-82 |
| APC anti-mouse CD326 (EpCAM) antibody | BioLegend | Cat #118214 |
| Anti-Ly6G MicroBeads | Miltenyi Biotec | Cat #130–120-337 |
| Anti-Biotin Microbeads | Miltenyi Biotec | Cat #130–094-973 |
| InVivoMAb anti-mouse Ly6G antibody | Bio X Cell | Cat #BE0075–1 |
| InVivoMAb rat IgG2a isotype control antibody | Bio X Cell | Cat #BE0089 |
| Chemicals, peptides, and recombinant proteins | ||
| Growth factor reduced Matrigel | Corning | Cat #356231 |
| 2-mercaptoethanol | Gibco | Cat #31350010 |
| Collagenase/hyaluronidase | STEMCELL Technologies | Cat #07912 |
| DNase I (for in vivo mouse models) | Roche | Cat #4716728001 |
| Dispase | STEMCELL Technologies | Cat #07913 |
| Collagenase D | Sigma | Cat #11088866001 |
| DNase I (for tissue digestion) | Sigma | Cat #045362820 |
| Liberase DL | Sigma | Cat #05466202001 |
| TrypLE Express Enzyme | Gibco | Cat #12605010 |
| Taqman™ Universal Master Mix II, no UNG | Applied Biosystems | Cat #4440040 |
| RIPA lysis buffer | Thermo Fisher Scientific | Cat #89990 |
| Protease and phosphatase inhibitor | Thermo Fisher Scientific | Cat #78440 |
| Protease inhibitor cocktail | Sigma | Cat #P8340 |
| Fc receptor blocker | Innovex | Cat #NB309 |
| Goat serum | Dako | Cat #X0907 |
| Anti-fade mounting medium | Thermo Fisher Scientific | Cat #P36961 |
| Sheep anti-rabbit IgG Dynabeads | Thermo Fisher Scientific | Cat #11203D |
| DAPI (4’,6-Diamidino-2-Phenylindole, Dihydrochloride) | Thermo Fisher Scientific | Cat #D1306 |
| Triton X-100 | Thermo Fisher Scientific | Cat #BB151–500 |
| Bovine serum albumin (BSA) | Sigma | Cat #A3294 |
| Percoll | GE Healthcare | Cat #17–0891-02 |
| Polymorphprep | ProteoGenix | Cat #1114683 |
| ACK Lysing Buffer | Thermo Fisher Scientific | Cat #A1049201 |
| Hanks’ Balanced Salt Solution | Thermo Fisher Scientific | Cat #14175 |
| Dulbecco’s phosphate-buffered saline (DPBS) | Thermo Fisher Scientific | Cat #14040117 |
| alamarBlue® reagent | Thermo Fisher Scientific | Cat #DAL1025 |
| TRIzol™ Reagent | Thermo Fisher Scientific | Cat #15596026 |
| Gibco™ Puromycin Dihydrochloride | Fisher Scientific | Cat #A1113803 |
| Blasticidin S HCl | Thermo Fisher Scientific | Cat #A1113903 |
| 2x Laemmli sample buffer | Bio-Rad Laboratories | Cat #1610737 |
| Tissue-Tek® O.C.T. Compound | Sakura Finetek USA | Cat #4583 |
| GSK9027 | Tocris | Cat #4116 |
| Corticosterone | Sigma | Cat #27840 |
| Dexamethasone | Sigma | Cat #D2915 |
| PMA (phorbol 12-myristate 13-acetate) | Sigma | Cat #16561–29-8 |
| GSK484 (PAD4 inhibitor) | Cayman Chemical | Cat #17488 |
| Palbociclib | Selleck Chemicals | Cat #PD-0332991 |
| Abemaciclib | Selleck Chemicals | Cat #LY2835219 |
| Cathepsin G inhibitor I | EMD Millipore | Cat #219372 |
| Apocynin | Sigma | Cat #498–02-2 |
| NAC (N-Acetyl-L-cysteine) | Sigma | Cat #A7250 |
| Alsterpaullone | Tocris | Cat #6400 |
| α-Amanitin | Sigma | Cat #A2263 |
| Formaldehyde | Pierce | Cat #PI28908 |
| AMPure XP beads | Beckman Coulter | Cat #A63881 |
| Corticosterone pellet (15 mg, 60 days) | Innovative Research of America | Cat #SG-111 |
| Placebo pellet (15 mg, 60 days) | Innovative Research of America | Cat #SC-111 |
| Zymosan A from S. cerevisiae | Sigma | Cat #58856–93-2 |
| Zymosan A (S. cerevisiae) BioParticles™, Alexa Fluor™ 488 conjugate | Thermo Fisher Scientific | Cat #Z23373 |
| Critical commercial assays | ||
| RNeasy Mini kit | Qiagen | Cat #74104 |
| Fixation/Permeabilization Solution Kit | BD Biosciences | Cat #554714 |
| llumina TruSeq RNA library prep kit v2 | Illumina | Cat #RS-122–2001, |
| Illumina TruSeq ChIP library prep kit | Illumina | Cat #IP-202–1012 |
| MinElute PCR purification kit | Qiagen | Cat #28004 |
| Mouse on Mouse (M.O.M.) detection kit | Vector Laboratories | Cat #BMK-2202 |
| Naive CD4+ T Cell Isolation Kit, mouse | Miltenyi Biotec | Cat #130–104-453 |
| Naive CD8a+ T Cell Isolation Kit, mouse | Miltenyi Biotec | Cat #130–104-075 |
| Proteome Profiler Mouse XL Cytokine Array Kit |
R&D Systems | Cat #ARY028 |
| Cell Death Detection ELISA Kit | Roche | Cat #11774425001 |
| TaqMan Reverse Transcription Reagents | Invitrogen | Cat #N8080234 |
| Corticosterone ELISA assay | IBL International GmbH | Cat #RE52211 |
| In Vivo EdU Flow Cytometry 50 Kit 488 | Sigma | Cat #BCK488-IV-FC-S |
| DCFDA / H2DCFDA – Cellular ROS Assay Kit | Abcam | Cat #ab113851 |
| Deposited data | ||
| High-throughput sequence database | This paper | GSE: GSE247144 |
| Experimental models: Cell lines | ||
| Mouse: C57BL/6-PyMT cell line | This paper | N/A |
| Mouse: PyMT-Cas9 cell line | This paper | N/A |
| Mouse: PyMT-Cas9-SgRosa cell line | This paper | N/A |
| Mouse: PyMT-Cas9-SgNr3c1-#1 cell line | This paper | N/A |
| Mouse: PyMT-Cas9-SgNr3c1-#2 cell line | This paper | N/A |
| Mouse: PDA FC1245 cell line | David A. Tuveson | N/A |
| Human: HEK293T cell line | Cold Spring Harbor Laboratory shared resource | N/A |
| Experimental models: Organisms/strains | ||
| MMTV-PyMT mice (on C57BL/6 background) | Jackson Laboratory | Cat #022974 |
| Mrp8-Cre mice | Jackson Laboratory | Cat #021614 |
| Nr3c1flox/flox mice | Jackson Laboratory | Cat #021021 |
| Lck-iCre mice | Jackson Laboratory | Cat #012837 |
| C57BL/6J mice | Jackson Laboratory | Cat #000664 |
| Oligonucleotides | ||
| Taqman Probe for mouse Nr3c1 | Thermo Fisher Scientific | Mm00433833_mH |
| Taqman Probe for mouse Tbp | Thermo Fisher Scientific | Mm01277042_m1 |
| Taqman Probe for mouse Actb | Thermo Fisher Scientific | Mm04394036_g1 |
| Taqman Probe for mouse Cxcl1 | Thermo Fisher Scientific | Mm04207460_m1 |
| Taqman Probe for mouse Cxcl2 | Thermo Fisher Scientific | Mm00436450_m1 |
| Taqman Probe for mouse Cxcl5 | Thermo Fisher Scientific | Mm00436451_g1 |
| Taqman Probe for mouse Mmp3 | Thermo Fisher Scientific | Mm00440295_m1 |
| Primers for ChIP-qPCR assay, see Table S1 | This paper | N/A |
| sgRNA for mouse Rosa | This paper | GAAGATGGGCGGGAGTCTTC |
| sgRNA for mouse Nr3c1 #1 | This paper | GTGTGCTCCGATGAAGCTTC |
| sgRNA for mouse Nr3c1 #2 | This paper | ATGACCACGCTCAACATGTT |
| Recombinant DNA | ||
| LentiV_Cas9_puro | Tarumoto et al., 201873 | Addgene, 108100 |
| LRG2.1_Neo | Tarumoto et al., 201974 | Addgene, 125593 |
| LRG2.1-GFP-P2A-BlastR | Gao et al., 202375 | N/A |
| Software and algorithms | ||
| RNA STAR | Dobin et al., 201376 | https://github.com/alexdobin/STAR/releases |
| FeatureCounts | Liao et al. 201477 | https://subread.sourceforge.net/featureCounts.html |
| DESeq2 | Love et al., 201478 | https://bioconductor.org/packages/release/bioc/html/DESeq2.html |
| Bowtie2 | Langmead and Salzberg 201279 | http://bowtie-bio.sourceforge.net/bowtie2/index.shtml |
| GSEA | Subramanian et al., 200580 | https://www.gsea-msigdb.org/gsea/index.jsp |
| Kallisto | Bray et al., 201681 | https://github.com/pachterlab/kallisto |
| deepTools | Ramírez et al., 201682 | https://deeptools.readthedocs.io/en/develop/ |
| ImageJ | NIH | https://imagej.nih.gov/ij/ |
| GraphPad PRISM (version 9) | GraphPad Software | https://www.graphpad.com/scientific-software/prism/ |
| Leica LAS X software | Leica Microsystems | https://www.leica-microsystems.com/products/microscope-software/p/leica-las-x-ls/downloads/ |
| FlowJo™ (v10.6.2) | BD Biosciences | https://www.flowjo.com/solutions/flowjo/downloads |
| Aperio ImageScope | Leica Microsystems | https://www.leicabiosystems.com/us/digital-pathology/manage/aperio-imagescope/ |
| Other | ||
| 96-well Enzyme ImmunoAssay/Radio Immuno-Assay (EIA/RIA) plates | Costar | Cat #3590 |
| Reflex 7 mm wound clips | CellPoint Scientific | Cat #203–1000 |
| PVDF membrane | Bio-Rad | Cat #1620177 |
| Corning™ Falcon™ 50 mL Conical Centrifuge Tubes | Corning™ | Cat #14–432-22 |
| Computerized video tracking system | Noldus | Ethovision XT 5.1 |
| poly-L-lysine-covered 8-well μ-Slides | Ibidi | Cat #80827 |
| Falcon® 40 μm Cell Strainer | Fisher Scientific | Cat #352340 |
| Falcon® 70 μm Cell Strainer | Fisher Scientific | Cat #352350 |
| Falcon® 100 μm Cell Strainer | Fisher Scientific | Cat #352360 |
| U-100 BD Ultra-Fine™ Short Insulin Syringes | VWR | Cat #BD328438 |
| BD Ultra-Fine™ 6mm x 31G insulin syringes | VWR | Cat #75796–482 |
Data and code availability
RNA-seq data have been deposited at GEO and are publicly available as of the date of publication. Accession number is listed in the key resources table. This paper does not report original code. Any additional information required to reanalyze the data reported in this paper is available from the lead contact upon request.
EXPERIMENTAL MODEL AND SUBJECT DETAILS
Mice
Mouse mammary tumor virus (MMTV)-polyoma middle T antigen (PyMT) mice (on C57BL/6 background [hereafter referred to as “BL/6”]) were bred at Cold Spring Harbor Laboratory (CSHL). Mrp8-Cre (#021614), Nr3c1flox/flox (#021021), and Lck-iCre (#012837) mice were purchased from The Jackson Laboratory and bred at CSHL. To generate GR conditional neutrophil knockout (KO) mice, we crossed Nr3c1flox/flox mice71 with Mrp8-Cre mice, which express Cre in neutrophils72, resulting in GRΔNeu mice (short for Mrp8-cre; Nr3c1fl/fl mice). To generate GR conditional T cell KO mice, we crossed Nr3c1fl/fl mice with Lck-iCre mice, resulting in GRΔT mice (short for Lck-iCre; Nr3c1fl/fl mice). Female BL/6 experimental mice (aged 6–8 weeks) were purchased from The Jackson Laboratory and acclimated to the animal facility for one week prior to initiating experiments. Mice were housed in conventional facilities with food and water available ad libitum.
All animal experiments were approved by the Institutional Animal Care and Use Committee (IACUC) at CSHL and were conducted in accordance with the National Institutes of Health (NIH) Guide for the Care and Use of Laboratory Animals.
Generation of the C57BL/6-PyMT cell line
To generate the PyMT cell line, a single cancer cell suspension was first obtained from primary tumors (see detailed protocol described in “Isolation of primary cancer cells from breast tumors of mice” section below), then plated in a 10-cm petri dish (2×10⁶) and cultured in Dulbecco’s Modified Eagle Medium (DMEM) supplemented with 10% fetal bovine serum (FBS), 100 U/mL penicillin, and 100 μg/mL streptomycin. Adherent PyMT cancer cells were dissociated with TrypLE Express Enzyme (1x, Thermo Fisher Scientific #12605010) and passaged to a new plate when the cells reached 90% confluency. They were then re-passaged until stable growth of the cells was achieved, at which point, a population of EpCAM+ cancer cells was obtained by fluorescence-activated cell sorting (FACS).
Tumor mouse models
For the classical, genetically engineered MMTV-PyMT breast cancer mouse model, tumor onset was defined when the first tumor became palpable (only female mice were used). Upon detection of tumors, MMTV-PyMT mice were randomly assigned to the control or stress-exposed groups, and tumor growth was measured weekly thereafter. Tumor length and width were measured with a caliper, and tumor volume was calculated as (length x width2)/2. MMTV-PyMT mice develop multiple mammary tumors, so the total tumor volume was calculated as the sum of the volumes of all tumors per mouse. Mice were sacrificed at endpoint (13 weeks after tumor onset), or when any of the tumors reached 20 mm on longest diameter or ulcerated.
For the orthotopic transplanted MMTV-PyMT breast cancer model, freshly isolated primary cancer cells from MMTV-PyMT mice (see “Isolation of primary cancer cells from breast tumors of mice” below for details) were resuspended on ice in 1:1 PBS/growth factor-reduced Matrigel (#356231, Corning). Cancer cells (2.5×10⁵ in 20 μl) were injected orthotopically into each of the two inguinal mammary glands of female BL/6 mice using a 31G insulin syringe (thus resulting in two tumors per mouse, one on each side). Tumor sizes were measured weekly by a caliper, and tumor volumes were calculated as described above.
For the surgical tumor-removal model, female BL/6 host mice were first orthotopically transplanted with freshly isolated MMTV-PyMT primary cancer cells in both inguinal mammary glands. When the primary tumors reached approximately 8 mm in diameter, after 3 to 4 weeks, surgery was performed to remove the tumors. Briefly, tumor-bearing mice were anesthetized with 2.5% isoflurane, and the fur on the skin above and around the tumor sites was shaved. An incision was made to the skin next to the tumor. Tumors were surgically removed from the mammary glands on both sides, and the surgical wound was closed by wound clips. Fifty-two (52) days after the surgery, the mice were euthanized, the lungs were collected, and metastatic burden was assessed as described below.
For the experimental lung metastasis model, freshly isolated MMTV-PyMT primary cancer cells, or PyMT cells (expressing Cas9 and indicated sgRNAs, see below) were washed, resuspended in Dulbecco’s phosphate-buffered saline (DPBS), and injected intravenously through the tail vein into female host BL/6 mice (1×10⁶ in 100 μl of DPBS). All mice were euthanized 3 weeks after injections, and lungs were collected for analysis of metastasis.
For the experimental lung metastasis model combined with the chronic unpredictable mild stress (CUMS) model, 0.75×10⁶ PyMT cells in 100 μl of DPBS were injected intravenously through the tail vein of female host BL/6 mice. Behavioral tests (elevated plus maze and open field tests) were done on day 22 (see “Behavior tests” below). All mice were euthanized 23 days after injection, and blood and lungs were collected for corticosterone ELISA and analysis of metastatic burden, respectively.
For the orthotopic pancreatic cancer model, murine pancreatic ductal adenocarcinoma (PDA) FC1245 cells (1×10⁵ in 50 μl of 1:1 PBS/growth factor-reduced Matrigel [#356231, Corning]) were orthotopically transplanted into the tail of the pancreas of female BL/6 mice. After 2 weeks, pancreatic tumors and spleens were harvested for metastasis analyses.
Physical restraint stress mouse model
Mice were exposed to physical restraint stress as previously described73. Briefly, female mice were restrained in individual, homemade 50 mL Falcon tubes with air holes for 2 hours per day. Mice could move backward and forward slightly in the restraining tube. For the classical MMTV-PyMT breast cancer model, stress exposure was started when the tumor became palpable. For the surgical tumor-removal model, stress exposure was started 3 days after surgical removal of the primary tumors. For the experimental lung metastasis model and the orthotopic pancreatic cancer model, stress exposure was started the day after cancer cell injection. When a model included DNase I or antibody treatment, DNase I (300 units/mouse/daily for the breast cancer model and 300 units/mouse/twice daily for the pancreatic cancer model), IgG control antibody (200 μg/mouse in 200 μl of PBS), or Ly6G depleting antibody (200 μg/mouse in 200 μl of PBS) was injected intraperitoneally right before stress exposure on the days indicated in the figure legends.
Chronic unpredictable mild stress (CUMS) model
Female BL/6 mice were exposed to CUMS on the day following intravenous injection of PyMT cells (see “Tumor mouse models” section). Animals in the CUMS cohort were subjected to two stressors per day, for 21 consecutive days. The stressors were based on published models of CUMS8,26,27, selected randomly among the following list (also see Fig. S1K): tail pinch (5 minutes, 1 cm from the distal portion of the tail); physical restraint, where mice were placed in a 50 mL tube for 30 minutes; cold swimming (3 minutes at 4˚C); noise stress (80 decibels of white noise for 30 minutes); food deprivation (overnight); water deprivation (overnight); moist bedding (3–4 hours); removal of all bedding (3–4 hours); removal of all bedding and the addition of 30°C H2O (3–4 hours); 30° cage tilt (12 hours); stroboscopic lights (overnight); and overnight illumination, where mice were exposed to regular room light during the night period. Several of these stressors disrupt normal circadian rhythms. Of note, all mice from the CUMS group (n=15) received the same combination of stressors every day. No individual stressor was repeated on two consecutive days. Animals in the control group were injected with the same cancer cells at the same time as the CUMS-exposed mice, but were not subjected to any of the stressors. Mice were subjected to the CUMS protocol until day 21, behavioral tests were done on day 22, and blood and tissue for analysis were collected on 23.
METHOD DETAILS
Isolation of primary cancer cells from breast tumors of mice
We recently reported a detailed, step-by-step protocol for isolating primary cancer cells from PyMT tumors74. Briefly, primary tumors (6–8 mm in diameter) from MMTV-PyMT mice were mechanically dissociated and digested in 1x collagenase/hyaluronidase solution (10X Solution; STEMCELL Technologies), diluted in Roswell Park Memorial Institute (RPMI) 1640 medium containing DNase I (4 U/mL) and 5% FBS at 37°C for 2 hours. The dissociated tissue was subjected to pulse centrifugation (450 × g) in DPBS supplemented with 5% FBS three times. The cancer organoids in pellets obtained after the last centrifugation were further dissociated into single cells with TrypLE Express Enzyme (1x, Thermo Fisher Scientific #12605010) containing DNase I (4 U/mL) at 37°C for 15 minutes. The resulting cancer cell suspension was passed through a 40-μm cell strainer (BD Biosciences) to enrich for single cells and was washed twice with DPBS.
Behavioral tests
On day 22 of the CUMS protocol, both control and CUMS-exposed mice were subjected to the elevated plus maze (EPM) and open field (OF) test to evaluate their anxiety levels. The apparatus used for the EPM test consisted of two “open” arms (30 × 5 × 2 cm) and two “closed” arms (30 × 5 × 15 cm), forming a cross. The arms were separated by a central platform (5 × 5 cm), and the maze was elevated 60 cm above the floor. Mice were placed on the central platform facing one of the open arms75. Behavior was monitored using a USB 1080p camera connected to a computerized video tracking system (Ethovision XT 5.1, Noldus). The apparatus was cleaned thoroughly between each trial. The number of entries into and time spent in the open and closed arms were measured. The OF test was performed in a nontransparent box (43 × 43 × 40 cm). Mice were placed in one of the corners of the arena at the start of each session. The center zone was set to 21 × 21 cm in the middle of the arena. Mice explored the arena for 5 minutes while being monitored using a USB 1080p web camera connected to a computerized video tracking system (Ethovision XT 5.1, Noldus). The arena was cleaned thoroughly between each trial. Total number (frequency) of center entries and time spent (duration) in the center zone were measured in OF test. For the EPM test, the time spent (duration) in the closed arms (CA) and open arms (OA), as well as the number of entries (frequency) into both arms were measured.
Cell culture
The PyMT cell line was established as described above. The murine PDA FC1245 cell line (generated from a female KPC [KrasG12D/+, p53R172H/+, Pdx1-Cretg/+] mouse) was kindly provided by Dr. David A. Tuveson. HEK293T cells were obtained from the CSHL Tissue Culture Facility. PyMT-Cas9-sgRNA cell lines were generated and selected with antibiotics, as noted in the “CRISPR/Cas9-mediated gene editing” section below. All of the cell lines were cultured in DMEM supplemented with 10% FBS, 100 U/mL penicillin, and 100 μg/mL streptomycin. Cultured cells were tested repeatedly for mycoplasma over the course of this study and remained negative for the duration of the study.
Lung metastasis analysis
Lungs were collected and fixed in 4% paraformaldehyde (PFA) at 4°C overnight, and then washed with PBS three times (for 10 minutes each time). The number of metastatic lesions was counted under a stereoscope (ZEISS SteREO Discovery.V8). Then, the lung lobes were removed from the trachea, processed for histology, and embedded together in paraffin for full, cross-sectional profile cuts. The area of metastatic burden was determined on hematoxylin & eosin (H&E)-stained slides using Aperio eSlide Capture Devices software (Leica Biosystems). Metastatic burden was calculated as the percentage metastatic area of total lung area evaluated.
Isolation of mouse neutrophils from bone marrow
Mouse neutrophils were isolated from the bone marrow of 8-week-old female BL/6 mice as previously described22. Briefly, bone marrow was flushed from both femurs and tibias with 1x Hanks’ Balanced Salt Solution (HBSS) using a syringe with a 26G needle. After washing the bone marrow cells once with 1x HBSS, the cells were resuspended in ammonium-chloride-potassium (ACK) lysis buffer for 3 minutes on ice. The cells were then washed twice with 1x HBSS, resuspended in 2 mL of HBSS. Neutrophils were isolated by density gradient separation. The density gradient was made by layering 2 mL of bone marrow cells on top of 3 mL of 62% Percoll (#17–0891-02, GE Healthcare) on top of 3 mL of 81% Percoll in a 15 mL Falcon tube, followed by centrifugation at 2,500 × g for 20 minutes at 4°C. Neutrophils were then taken from the middle interface, washed in HBSS, and resuspended in serum-free DMEM before use in the assays described below.
In vitro NET formation assay
The neutrophils isolated from bone marrow by density gradient separation were used for the NET formation assay in vitro. Briefly, 250,000 neutrophils per well were cultured overnight on poly-L-lysine-coated coverslips (#354085, Corning) in a 24-well plate in DMEM supplemented with 0.5% FBS and other stimulators (vehicle, phorbol 12-myristate 13-acetate [PMA], corticosterone, GSK9027, dexamethasone). NET inhibitors (the PAD4 inhibitor GSK484 [10 μM], the glucocorticoid receptor inhibitor alsterpaullone [10 μM], the CDK4/6 inhibitors palbociclib [10 μM] and abemaciclib [10 μM], cathepsin G inhibitor I [2 μM], transcriptional inhibitor α-Amanitin [10 μM], DNase I (0.02U), and the reactive oxygen species (ROS) inhibitors N-acetyl-l-cysteine [5 mM] and apocynin [1 mM, 5 mM]) were added to the medium 30 minutes before neutrophil activation. To assess NET formation, coverslips were fixed 20 hours after initiating NET induction with 4% PFA for 10 minutes at room temperature, followed by 10 minutes of washing in PBS (three times), 5 minutes of permeabilization with PBS containing 0.5% Triton X-100 (#BB151–500, Thermo Fisher Scientific), and 60 minutes of blocking with PBS containing 1% bovine serum albumin (BSA, #A3294, Sigma). The coverslips were then incubated with primary antibodies: anti-histone H2B (1:250, Abcam) and anti-myeloperoxidase (MPO, 1:100, Dako) in blocking buffer overnight at 4°C. After rinsing twice with PBS, slides were stained with fluorochrome-conjugated secondary antibodies (1:400, Thermo Fisher Scientific) and DAPI (10 μg/mL; D1306, Thermo Fisher Scientific) for 1 hour at room temperature. Coverslips were mounted onto glass slides facing down with anti-fade mounting medium (P36961, Thermo Fisher Scientific). Images were taken at 40x magnification using a Leica TCS SP8 confocal microscope and processed with Leica LAS X software. NET-forming ability was determined as the percentage of the field of view positive for the merged signal of DAPI, MPO, and histone, as previously described21.
Isolation, culturing, and in vitro NET formation of human neutrophils
Human neutrophils were isolated from the peripheral blood of healthy donors with Polymorphprep (#1114683, ProteoGenix), according to the manufacturer’s instructions. The lower leukocyte band was collected, and associated red blood cells were lysed with ACK lysis buffer. Purified neutrophils were counted and seeded to μ-Slide 8 Well Poly-L-Lysine (#80824, Ibidi), at a concentration of 1×10⁵ neutrophils/well in 100 μl of serum-free DMEM. Seeded neutrophils settled for 30 minutes before proceeding. Then, another 100 μl of serum-free DMEM containing other stimulators was added to each well at the concentrations indicated on the figures (vehicle, GSK9027, dexamethasone). To assess NET formation, chamber slides were fixed 20 hours after initiating NET formation using 4% PFA, for 10 minutes at room temperature. This step was followed by processing, staining, and quantification, as described above for mouse neutrophils in the “in vitro NET formation assay” section.
Spontaneous NET formation in vitro
Whole blood samples from cheek bleeding were used for the spontaneous NET formation protocol76. Briefly, after lysing the red blood cells with ACK lysis buffer, 5×10⁴ of the total white blood cells collected were plated on poly-L-lysine-covered 8-well μ-Slides (#80827, Ibidi) in serum-free RPMI-1640 medium for 2 hours. The chamber was then fixed with 4% PFA for 10 minutes. The cells were permeabilized and blocked with PBS containing 0.1% Triton X-100, 25% FBS, and 5% BSA, and then stained with antibodies against MPO (1:400, AF3667, R&D Systems) and cit-H3 (1:250, ab5103, Abcam). After rinsing twice with PBS, cells were stained with fluorochrome-conjugated secondary antibodies (1:400, Thermo Fisher Scientific) and DAPI (10 μg/mL; D1306, Thermo Fisher Scientific) for 1 hour at room temperature. Images from random parts of the central region of the well were taken at 20x magnification using a Leica TCS SP8 confocal microscope and processed with Leica LAS X software. NETs were defined as being triple positively stained for DAPI, MPO, and cit-H3. NET-forming neutrophils (triple positive for DAPI, MPO, and cit-H3) out of total neutrophils (double positive for MPO and cit-H3) were quantified using ImageJ software.
In vitro cell viability assay
PyMT cells were seeded in a 96-well plate (1,000 cells per well) and treated with corticosterone (1 μM, 10 μM) or dexamethasone (1 μM, 10 μM) for 3 days. On each day, 10 μl of alamarBlue® reagent (#DAL1025, Thermo Fisher Scientific) was added to each well containing PyMT cells in 100 μl of medium. Then the cells were incubated with alamarBlue® for 4 hours at 37°C. Absorbance at 570 nm was measured using a SpectraMax MiniMax 300 Imaging Cytometer (Molecular Devices), and absorbance at 600 nm was used as the reference wavelength. Culture medium only plus alamarBlue® reagent (#DAL1025, Thermo Fisher Scientific) was used as background blank control.
Adrenalectomy
Adrenalectomy (AGX) was performed as previously described77. Briefly, female BL/6 mice were anesthetized with isoflurane, and the fur on the skin above the operative sites was shaved. An incision was made through first the skin and then the peritoneum above the adrenal glands. Both adrenal glands were removed using curved forceps, and the surgical site was closed using absorbable suture for the peritoneal wall and wound clips for the skin. The sham group of mice underwent the same surgical procedures on both sides, but no tissue was removed. After the surgery, all mice, including those subjected to sham surgeries, received 0.9% saline solution as drinking water.
Flow cytometry
Flow cytometry was performed on cells isolated from tumors or lungs as previously described78. Briefly, single cells were isolated from tumors as described78 and resuspended in FACS buffer (DPBS containing 1% FBS and 0.02% sodium azide). Lungs were first chopped into small pieces and then digested at 37°C for 30 minutes in 5 mL of lung digesting buffer: RPMI-1640 medium containing 2% FBS, as well as Dispase (2.5 U/mL, #07913, STEMCELL Technologies), collagenase D (0.1 mg/mL, #11088866001, Sigma), DNase I (25 U/mL, #04536282001, Sigma), and Liberase DL (0.2 mg/mL, #05466202001, Sigma). Lung cell suspensions were then filtered through a 70-μm strainer (#352340, BD Falcon), red blood cells were lysed with ACK lysis buffer, and remaining cells were pelleted and resuspended in FACS buffer (DPBS, 1% FBS, 0.02% sodium azide) and then filtered through a 40-μm cell strainer.
Flow cytometry was performed on bone marrow and whole blood samples as previously reported29. Briefly, bone marrow cells were obtained by flushing the femurs with 1x HBSS buffer using a syringe with a 26G needle, followed by red blood cell lysis by incubation in ACK buffer for 5 minutes. Whole blood samples were collected into blood collection tubes (ethylenediaminetetraacetic acid [EDTA]-coated, VWR, #BDAM368841), followed by red blood cell lysis with ACK buffer. The cells were then resuspended with FACS buffer (DPBS, 1% FBS, 0.02% sodium azide), and passed through a 40-μm strainer.
For flow cytometry staining, 1×10⁶ cells per staining were incubated with Fc receptor blocker for 10 minutes at 4°C, then incubated with the appropriate antibodies to surface markers for 30 minutes at 4°C, and/or fixed/permeabilized (Fixation/Permeabilization Solution Kit, #554714, BD Biosciences) and stained with intracellular antibodies at 4°C for 30 minutes. Surface marker antibodies included anti-CD45, anti-CD3, anti-CD8a, anti-CD4, anti-CD11b, anti-Ly6G, anti-Ly6C, anti-CD69, anti-CD11c, anti-γδTCR, anti-CD137, anti-CD62L, and anti-CXCR4 (also known as CD184); antibodies against intracellular proteins included anti-Granzyme B and anti-IFN-γ. All antibodies were used at a dilution of 1:100 (additional information is listed in the key resources table). The cells were then washed twice in FACS buffer and resuspended in 450 μl of FACS buffer before analysis using a Fortessa flow cytometer (BD Biosciences) and FlowJo software (BD Biosciences).
Circadian neutrophil aging analysis
To analyze circadian fluctuations in neutrophil numbers and marker expression, blood samples were extracted every 4 hours during a 24-hour period from wild-type or experimental mice, starting at ZT5 (Zeitgeber time, 5 hours after the onset of light). For circadian surface marker analysis, blood counts were analyzed using a ProCyte Dx Hematology Analyzer (Idexx Laboratories). Red blood cells were lysed in hypotonic lysis buffer (ACK buffer); incubated for 15 minutes with 0.25 μg of anti-Ly6G (clone 1A8, Bio X Cell), anti-CD62L (clone MEL-14, BioLegend), and anti-CXCR4 (clone 2B11, eBioscience), antibodies; washed; and analyzed using a Fortessa flow cytometer (BD Biosciences). Analysis was performed using FlowJo (Tree Star Inc.).
Neutrophil in vivo functional assays
Zymosan-induced peritonitis was used to measure extravasation and migration efficiency. Briefly, GRWT and GRΔNeu mice were intraperitoneally injected with 1 mg of zymosan (Sigma). After 2 hours, blood samples were collected and peritoneal lavage was obtained by flushing the peritoneal cavity with 10 mL of PBS. The same amounts of blood and peritoneal lavage from each mouse were further processed for flow cytometry (see details in the “Flow Cytometry” section above). The number of neutrophils in the peritoneal lavage and blood was determined by flow cytometry with counting beads, following the manufacturer’s instructions (BD Biosciences, #340334).
To analyze the neutrophils’ ability to phagocytose in vivo, GRWT and GRΔNeu mice were intravenously injected with 100 μg of Alexa Fluor 488-conjugated Zymosan BioParticles (Invitrogen, #Z23373). Two hours later, blood was collected and prepared for flow cytometry (see details in the “Flow Cytometry” section above), and the number of AF488-containing neutrophils (DAPI-; AF488+; Ly6G+) was quantified out of total neutrophils (DAPI-; Ly6G+).
EdU pulse-labeling and half-life calculation: Pulse-labeling of neutrophils in GRWT and GRΔNeu mice was performed by intraperitoneal injection of 50 mg/kg EdU (BaseClick In Vivo EdU Flow Cytometry Kit, BCK488-IV-FC-S) after 21 days of restraint stress exposure. Naïve GRWT and GRΔNeu mice were used as controls. Then, the percentage of EdU+Ly6G+ cells out of Ly6G+ cells was determined at days 1, 3, and 5 after EdU injection using flow cytometry and according to the manufacturer’s instructions. The half-life (h) of neutrophils in circulation was calculated as follows: first the decay constant λ was calculated from the formula: Nt=Np*ê(-λ*Δt), where Nt is the percentage of EdU+/Ly6G+ at time t, Np is the percentage at peak, and Δt is the difference in hours between Np and Nt. Then, using the decay constant λ, the half-life “h” was calculated using the formula: 1=2*ê(-λ*h).
Histology and immunofluorescence staining
Tissue samples were harvested and fixed in 4% PFA overnight at 4°C, and then washed 3 times with PBS. Fixed tissues were sent to the Histology Core at CSHL for tissue processing, embedding, and cutting (5 microns per section). Frozen samples were fixed with 4% PFA overnight, immersed in 30% sucrose/PBS overnight at 4°C, embedded in optimal cutting temperature compound (OCT, Sakura Finetek, 4583), and sent to the Histology Core at CSHL for cutting (10 microns per section). Immunofluorescence staining on paraffin sections was performed as previously described22. Briefly, after being deparaffinized and rehydrated, slides were boiled in Tris-EDTA antigen retrieval buffer (10 mM Tris Base, 1 mM EDTA, 0.05% Tween20, pH 9.0) for 8 minutes in a pre-heated pressure cooker. The slides were then blocked with Fc receptor blocker (Innovex Biosciences) for 30 minutes, followed by 1x blocking buffer (PBS containing 0.1% Triton X-100, 2.5% BSA, and 5% donkey serum) for 1 hour at room temperature. Sections were then incubated with primary antibodies in 0.5x blocking buffer overnight at 4°C using goat anti-MPO (1:100, AF3667, R&D Systems), rabbit anti-cit-H3 (1:250, ab5103, Abcam), mouse anti-glucocorticoid receptor (1:200, sc-393232 Santa Cruz), or rat anti-PyMT (1:100, ab15085, Abcam). After rinsing twice with PBS, the sections were incubated with secondary antibodies, using donkey anti-rabbit Alexa Fluor 488 (1:400, A21206, Thermo Fisher Scientific), donkey anti-goat Alexa Fluor 568 (1:400, A11057, Thermo Fisher Scientific), donkey anti-mouse Alexa Fluor 488 (1:400, A21202, Thermo Fisher Scientific), and/or donkey anti-rat Alexa Fluor 488 (1:400, A21208, Thermo Fisher Scientific), depending on which primary antibodies were used. Rabbit anti-Ki67 (Alexa Fluor® 647 conjugated, 1:100; #12075 Cell Signaling) was incubated after secondary antibody for 1 hour at room temperature. Lastly, the slides were counterstained with DAPI (10 μg/mL; D1306, Thermo Fisher Scientific) for 1 hour at room temperature.
For fibronectin staining, frozen sections were washed with PBS and blocked using a Mouse on Mouse (M.O.M.) detection kit (BMK-2202, Vector Laboratories), then incubated with mouse-anti-fibronectin (#MA5–11981, Thermo Fisher Scientific) and rat anti-PDGFR-α antibody (Thermo, 14–1401-82) overnight at 4°C. After rinsing twice with PBS, the sections were incubated with secondary antibodies: donkey anti-mouse Alexa Fluor 488 (1:400, A21202, Thermo Fisher Scientific) and donkey anti-rat Alexa Fluor 647 (1:400, A48272, Thermo Fisher Scientific). Mouse anti-α smooth muscle actin antibody (cy3 conjugated, 1:100, C6198, Sigma) and DAPI (10 μg/mL; D1306, Thermo Fisher Scientific) were incubated after the secondary antibody for 1 hour at room temperature. Slides were mounted with anti-fade mounting medium (P36961, Thermo Fisher Scientific). Images were taken at 40x magnification using a Leica TCS SP8 confocal microscope and were processed with Leica LAS X software. Fibronectin expression was quantified by the normalized integrated density (IntDen) of fibronectin to DAPI using ImageJ software.
Enrichment of neutrophils and T cells by magnetic separation
Neutrophils were enriched by magnetic beads from gender- and age-matched Mrp8-cre; Nr3c1fl/fl mice and their littermate controls (Nr3c1fl/fl mice). Specifically, Ly6G+ neutrophils from bone marrow, blood, spleen, and lung were enriched using anti-Ly6G MicroBeads (#130–120-337, Miltenyi Biotec) and magnetically separated according to the manufacturer’s instructions. Briefly, single-cell suspensions were first generated from bone marrow (collected as above), whole blood (collected into EDTA-coated blood collection tubes, VWR, #BDAM368841), or spleen tissue (pushed through a 100-μm strainer). Single-cell suspensions from lung were obtained by digestion as described above for flow cytometry analysis. Red blood cell lysis was performed prior to magnetic labeling by incubating the cell pellets with ACK lysis buffer for 3 minutes on ice. After washing, the cells were incubated with anti-Ly6G MicroBeads, followed by magnetic separation on LS MACS Columns (#130–042-401, Miltenyi Biotec). Unlabeled (Ly6G-) cells were flow-through cells from the column (washed three times with MACS buffer [0.5% FBS, 0.02 M EDTA in PBS]). After washing, the column with magnetically labeled (Ly6G+) cells was placed in a new 15 mL Falcon tube, and the magnetically labeled (Ly6G+) cells were flushed out by firmly pushing the plunger from the kit into the column containing 5 mL of MACS buffer. The collected cells were counted before further use.
T cells (CD3, CD4, and CD8, isolated separately) were enriched by magnetic beads from gender- and age-matched Lck-iCre; Nr3c1fl/fl mice and their littermate controls (Nr3c1fl/fl mice). CD3+ T cells were enriched from the spleen by incubating with CD3-Biotin antibody (BioLegend, #100244) followed by anti-Biotin Microbead (#130–094-973, Miltenyi Biotec) binding and magnetic separation. CD4+ and CD8+ T cells were enriched from the spleen using a “Naive CD4+ T Cell Isolation Kit” (#130–104-453, Miltenyi Biotec) or a “Naive CD8a+ T Cell Isolation Kit” (#130–096-543, Miltenyi Biotec), separately. Briefly, single-cell suspensions were first generated by pushing the spleen through a 100-μm strainer. Red blood cell lysis was performed prior to antibody labeling by incubating the cell pellets with ACK lysis buffer for 3 minutes on ice. After washing, the cells were incubated with anti-CD3-biotin antibody, a Naive CD4+ T Cell Biotin-Antibody Cocktail, or a Naive CD8a+ T Cell Biotin-Antibody Cocktail (from the above-mentioned kits), separately, for 5 minutes at 4°C, followed by anti-biotin MicroBead labeling for 10 minutes at 4°C. The labeled cell suspensions were then loaded onto LS MACS Columns (#130–042-401, Miltenyi Biotec) for magnetic separation. For CD3+ T cells, magnetically labeled (CD3ε+) cells were collected after washing off the unlabeled cells from the column by firmly pushing the plunger from the kit into the column with 5 mL of MACS buffer. For CD4+ and CD8a+ T cell isolation, the flow-through of the unlabeled cells was collected as the enriched population and counted for further use, as the magnetically labeled cells were the non-T cell population.
In vitro T cell activation assay
A T cell activation assay was adapted from a previously described protocol78 using co-cultures of CD8a+ T cells and neutrophils in vitro. Naïve CD8a+ T cells were isolated from the spleens of BL/6 mice by magnetic separation using a CD8a+ T Cell Isolation Kit (#130–104-075, Miltenyi Biotec), following the manufacturer’s instructions. Neutrophils were obtained from the bone marrow by density gradient separation as described above, then treated with or without the glucocorticoid receptor agonist GSK9027 (#4116, Tocris) at 10 μM in DMEM for 4 hours. After washing off the GSK9027 or vehicle (DMSO, 1:1000) by centrifuging the neutrophils at 300 × g, the neutrophils were added to CD8a+ T cells at a ratio of 1:7 (i.e., one neutrophil to seven T cells) in T cell culture medium (RPMI 1640 with 10% FBS, 200 mM L-glutamine, 10 mM sodium pyruvate, 50 mM 2-mercaptoethanol, and 10 ng/mL anti-CD3ɛ antibody) and co-cultured with the T cells overnight. T cell activation was determined by the percent of CD69-, CD137-, Granzyme B-, or IFN-γ-positive cells (see antibody details in the key resources table) out of the total CD8-positive cells using flow cytometry.
RNA extraction and quantitative real-time PCR
Total RNA from lung tissues was purified using a RNeasy mini kit (Qiagen), following the manufacturer’s instructions. Total RNA from enriched or cultured neutrophils was purified using TRIzol (Thermo Fisher Scientific) according to the manufacturer’s instructions. The RNA concentration was determined by a Nanodrop 2000 spectrophotometer (Thermo Fisher Scientific). One μg of RNA from each sample was reverse transcribed using a RevertAid First Strand cDNA Synthesis system (K1622, Thermo Fisher Scientific). Quantitative real-time PCR was performed in a 384-well format on a QuantStudio 6-flex Instrument (Applied Biosystems) using TaqMan Universal Master Mix II (Thermo Fisher Scientific) with the following specific primers: Nr3c1: Mm00433833_mH, Tbp: mm01277042_m1, Actb: Mm04394036_g1, Cxcl1: Mm04207460_m1, Cxcl2: Mm00436450_m1, Cxcl5: Mm00436451_g1, Il-1b: Mm01336189_m1, Nos2: Mm00440502_m1, Il6: Mm00446190_m1, Mmp3: Mm00440295_m1, and Vim: Mm01333430_m1. Relative quantitation was performed with the 2(−ΔΔCT) method using Actb or Tbp expression for normalization.
Western blot
Cultured PyMT cancer cells, isolated neutrophils, or T cells from different organs (as induced in figure legends) were counted and resuspended in PBS at a concentration of 1×10⁷ cells/mL. Then, an equal amount of 2x Laemmli sample buffer (#1610737, Bio-Rad Laboratories) containing 5% β-mercaptoethanol was added to the cell suspension to lyse the cells. Cell lysates were vortexed for 2 minutes, followed by 10 minutes of incubation at 95°C. Equal volumes of protein samples were loaded into SDS-PAGE gels, and then transferred to a polyvinylidene difluoride membrane (Bio-Rad Laboratories). The membranes were then blocked in 5% non-fat milk for 1 hour and probed with primary antibodies against GR/NR3C1 (G-5, sc-393232, Santa Cruz Biotechnology, 1:1000), glyceraldehyde-3-phosphate dehydrogenase (GAPDH) (sc-47724, Santa Cruz Biotechnology, 1:5000), Cyclin D3 (#2936, Cell Signaling Technology), CDK4 (#GTX102993, GeneTex), CDK6 (#Ab54576, Abcam), Phospho-p38 MAPK (Thr180/Tyr182) (#9211, Cell Signaling Technology), p38 MAPK (#8690, Cell Signaling Technology), and HSP90 (#4874, Cell Signaling Technology) overnight at 4°C. On the next day, the membranes were washed three times with Tris-buffered saline with 0.1% Tween 20 detergent (TBST) followed by incubation with fluorescent secondary antibody (goat-anti-mouse IRDye® 800CW, 1:20000, LI-COR Biosciences). Protein detection was performed using the Odyssey Classic Imaging System (LI-COR Biosciences).
Cytokine array
Lungs from control and stress-exposed mice (at day 21 after the initiation of chronic restraint stress) were collected, weighed, and homogenized with NP40 lysis buffer (50 mM Tris, pH 7.4, 250 mM NaCl, 5 mM EDTA, 50 mM NaF, 1 mM Na3VO4, and 1% NP40) supplemented with Protease Inhibitor Cocktail (#87786, Thermo Fisher Scientific). After centrifugation at 12,000 × g for 15 minutes, the supernatants were collected from the lung lysates. After culturing freshly isolated bone marrow-derived neutrophils for 4 hours, neutrophil conditioned medium was collected for the cytokine array. An equal amount of tissue lysate supernatant (normalized to tissue weight) or volume of conditioned medium was analyzed using the Proteome Profiler Mouse XL Cytokine Array Kit (ARY028, R&D Systems), according to the manufacturer’s instructions. Films were scanned, quantified, and then analyzed using ImageJ software.
NET enzyme-linked immunosorbent assay (ELISA)
NET levels in plasma were quantified as previously described22. Blood was collected from the heart of the mouse immediately after euthanasia using a 1 mL syringe with a 26G needle containing 25 μl of 0.5M EDTA. The blood was then transferred into an EDTA-coated blood collection tube. Whole blood was then centrifuged at 2,000 × g for 10 minutes at 4°C, and the plasma layer on top was collected and stored at −80°C. For NET ELISA, a 96-well Enzyme ImmunoAssay/Radio Immuno-Assay (EIA/RIA) plate was coated with the capture antibody anti-neutrophil elastase (#sc-55549, Santa Cruz Biotechnology, 1:250) in coating buffer (15 mM Na2CO3, 35 mM NaHCO3, pH 9.6) overnight at 4°C. Then, the wells were rinsed with PBS and blocked with 5% BSA for 2 hours at room temperature, followed by washing in PBS three times. Plasma samples (50 μl) were added to the wells and incubated for 2 hours at room temperature on a shaker, and the wells were washed three times with washing buffer (1% BSA, 0.05% Tween20 in PBS). Next, anti-DNA-peroxidase conjugated antibody (1:50, part of the Cell Death Detection ELISA Kit, #11544675001, Sigma) in 1% BSA in PBS was added to the wells for 2 hours at room temperature, and the wells were washed five times with washing buffer before the addition of 2,2’-azino-bis (3-ethylbenzothiazoline-6-sulphonic acid) (ABTS). Optical density was read 10–30 minutes later at 405 nm using a SpectraMax MiniMax 300 Imaging Cytometer (Molecular Devices).
Corticosterone ELISA
Blood samples were collected from tail bleeds with capillary blood collection tubes (Sarstedt, #16.443.100, lithium heparin [LH] coated), and plasma was isolated from the top layer after centrifugation as above in the “NET ELISA” section. Diluted plasma samples (20 μl, diluted to 1:10 with Standard 0 from the kit) or standards were used for the competitive binding corticosterone ELISA assay (RE52211, IBL International GmbH), according to the manufacturer’s instructions. Absorbance at 450 nm was measured using a SpectraMax MiniMax 300 Imaging Cytometer (Molecular Devices). Concentrations of corticosterone were calculated according to the standard curve.
CRISPR/Cas9-mediated gene editing
A Cas9-expressing PyMT cancer cell line was generated by lentiviral transduction with the Cas9 expression vector EFS-Cas9-P2A-PuroR (#108100, Addgene). DNA oligos of the sgRNAs were cloned into the lentiviral backbone LRG2.1-GFP-P2A-BlastR (cloned from LRG2.1_Neo [#125593, Addgene] by replacing the neomycin resistant gene with a blastcidin resistant gene) using a BsmBI restriction site. Forty-eight (48) hours post-blasticidin selection, knockout efficiency was assessed by Western blot. The sgRNA sequences used in this study were: sg Rosa: GAAGATGGGCGGGAGTCTTC, sg Nr3C1 #1: GTGTGCTCCGATGAAGCTTC, and sg Nr3C1 #2: ATGACCACGCTCAACATGTT.
Administration of antibiotics in vivo
Mice were treated with a cocktail of antibiotics consisting of ampicillin (100 mg/kg dissolved in water), vancomycin (50 mg/kg dissolved in water), metronidazole (100 mg/kg dissolved in DMSO), neomycin (100 mg/kg dissolved in water), and amphotericin B (1 mg/kg dissolved in water). This cocktail was given via oral gavage to animals twice daily for 3 weeks. Control cohorts were given oral gavages of 10% DMSO in water. After three weeks, mice were euthanized and lungs were collected for flow cytometry.
RNA sequencing and data analysis
RNA concentration and RNA integrity were determined using a ND-1000 spectrophotometer (NanoDrop). Two (2) μg of total RNA was used to construct the RNA-seq library using an Illumina TruSeq RNA library prep kit v2 (#RS-122–2001, Illumina), following the manufacturer’s instructions. Briefly, purified RNA was polyA-enriched and fragmented with fragmentation enzyme; cDNA was synthesized using Super Script II reverse transcriptase (#18064014, Thermo Fisher Scientific), followed by end repair, A-tailing, barcoded adaptor ligation, and PCR amplification. The library was single end sequenced for 76 bp using a NextSeq platform (Illumina). Sequencing reads were mapped to the reference genome mm10 using RNA STAR with default parameters79. Read count tables were created using FeatureCounts80 with a custom GTF file containing protein-coding genes only. Differentially expressed genes were analyzed using DESeq2 with two independent replicates using default parameters81. The top 500 and bottom 500 genes with no fewer than 5 counts in dexamethasone- (or GSK9027)-treated versus vehicle samples defined the glucocorticoid agonists’ up- and downregulation signatures, respectively. To generate a ranked gene list for pre-ranked gene set enrichment analysis (GSEA)82, the genes were ranked by their log2 fold change defined by DESeq2 in neutrophils from stressed versus normal lungs. The TPM (transcripts per million) value for each gene was calculated using Kallisto83. Gene Ontology (GO) analysis was performed using Metascape (http://metascape.org)84.
ChIP-qPCR
A total of 6×10⁷ mouse neutrophils were cross-linked with 1% formaldehyde (#PI28908, Pierce) for 10 minutes at room temperature and quenched with 125 mM glycine for 5 minutes. After washing twice with cold Tris-buffered saline (50 mM Tris, pH 7.5, 150 mM NaCl), pelleted neutrophils were suspended in lysis buffer (10 mM Tris, pH 8.0, 10 mM NaCl, 0.2% NP-40, and protease inhibitor cocktail [#P8340, Sigma]) and incubated on ice for 15 minutes. After centrifugation at 3,000 × g for 5 minutes, pellets were resuspended in nuclear lysis buffer (50 mM Tris, pH 8.0, 10 mM EDTA, 1% SDS, protease inhibitor cocktail). The nuclear lysates were then sonicated for 15 minutes (30 seconds ON/30 seconds OFF) with a Bioruptor Pico sonication device (#B01060010, Diagenode) and centrifuged at 20,000 × g for 10 minutes. Supernatants containing the chromatin were diluted 8 times with immunoprecipitation dilution buffer (20 mM Tris, pH 8.0, 2 mM EDTA, 150 mM NaCl, 1% Triton X-100, 0.01% SDS).
Sheep anti-rabbit IgG Dynabeads (#11203D, Thermo Fisher Scientific) were pre-coated by rocking with glucocorticoid receptor antibody cocktail (#MA1–510, #PA1–511A, Thermo Fisher Scientific, #ab3671, Abcam, 0.5 μg each) in 0.5% BSA/PBS for 4 hours at 4°C. The bead-antibody complexes were then incubated with the chromatin overnight at 4°C. The beads were washed twice with ChIP buffer (50 mM Tris-HCl, pH 8.0, 10 mM EDTA, 100 mM NaCl, 1% Triton X-100, 0.1% sodium deoxycholate), high salt buffer (ChIP buffer with 500 mM NaCl), LiCl buffer (10 mM Tris-HCl, pH 8.0, 0.25 M LiCl, 0.5% NP-40, 0.5% sodium deoxycholate, 1 mM EDTA), and Tris-EDTA (10 mM Tris-HCl, pH 8.0, 10 mM EDTA) buffer. The bound chromatin was eluted and reverse-crosslinked at 65°C overnight. DNA was purified after treatment with RNase A and proteinase K using a MinElute PCR purification kit (#28004, Qiagen). Then, qPCR was performed in a 384-well format on a QuantStudio 6-flex Instrument (Applied Biosystems) using SYBR Green master mix (#A25742, Applied Biosystems). ChIP-qPCR primers can be found in Table S1.
ChIP-seq library construction and data analysis
The ChIP-seq library was constructed using an Illumina TruSeq ChIP library prep kit (#IP-202–1012, Illumina) based on the manufacturer’s instructions. Briefly, ChIP DNA was first end-repaired, A-tailed, and adaptor-ligated to different barcodes. Adaptor-ligated ChIP-DNA were size selected using AMPure XP beads (#A63881, Beckman Coulter), followed by 15 cycles of PCR amplification. The quality of the ChIP-seq library was checked on a 2100 Bioanalyzer Instrument using the High Sensitivity chip (#5067–4626, Agilent). Libraries were single end sequenced for 76 bp on a NextSeq platform (Illumina). Raw reads from ChIP-seq were aligned to the reference genome mm10 using Bowtie285,86 with the sensitive end-to-end setting. Genome-wide read coverage was calculated by deepTools87 with a bin size of 50 bp.
Patient survival data analyses
To determine whether there was an association between stress exposure and the survival of breast cancer patients, we generated a “chronic stress exposure gene signature,” consisting of the most highly expressed, downregulated genes in the primary tumors of mice subjected to chronic restraint stress compared to the genes of primary tumors from control mice. Briefly, the mice were injected orthotopically with primary PyMT cells (see details in the “Tumor mouse models” section) and subjected to 35 days of daily restraint stress. On day 35, primary tumors were collected from both the control and stress groups (n=3 mice per group) for RNA extraction and sequencing. The gene expression changes in the primary tumors from stressed mice were calculated using DEseq2 as described above. We identified the top 100 genes that were most downregulated in tumors from the stress group compared to tumors from the control group. To exclude the artifact of lowly expressed genes, we then ranked these top 100 downregulated genes based on the average of their RNA-seq counts in all the samples (both control and stress) and took the top 50 highly expressed candidate genes as the “chronic stress exposure gene signature” (see gene list in Figure S7W). The relationship between the “chronic stress exposure gene signature” and breast cancer patient outcome was then examined via analysis of overall survival data, using a Kaplan–Meier survival plot (http://www.kmplot.com/; a manually curated database of gene expression, and relapse-free and overall survival information from Gene Expression Omnibus [GEO], The European Genome-phenome Archive [EGA] and The Cancer Genome Atlas [TCGA])with automatically selected best cutoffs88. Patients were stratified into high- and low-expression signature groups based on the median signature score. The hazard ratio (HR) and 95% confidence intervals, as well as log rank P, which assessing the significance of the separation between groups, were calculated. This analysis was repeated for different breast cancer subtypes, as indicated in Figure 4K.
QUANTIFICATION AND STATISTICAL ANALYSIS
Statistical analyses were performed using GraphPad Prism (version 9, GraphPad Software). For all experiments with two groups, two-tailed unpaired Student’s t-tests (equal variances) or two-tailed Mann-Whitney tests were used. One-way ANOVA (with equal variances) with correction for multiple comparisons was performed for experiments with more than two groups. To determine diurnal patterns, we performed Cosinor fitting of circadian curves as previously described89. The data are presented as mean ± SEM. All p-values<0.05 were considered statistically significant. Mice were randomized before grouping.
Supplementary Material
HIGHLIGHTS.
Chronic stress increases metastasis in mice.
Chronic stress establishes a pro-metastatic lung microenvironment.
Deleting the neutrophil-glucocorticoid receptor abolishes stress-induced metastasis.
Chronic stress induces metastasis-promoting neutrophil extracellular traps.
ACKNOWLEDGMENTS
We acknowledge members of the Egeblad lab and Drs. Bo Li and Tobias Janowitz for discussions and suggestions throughout the course of this study. We thank Dr. David A. Tuveson for sharing the murine PDA FC1245 cell line. This work was performed with assistance from Cold Spring Harbor Laboratory Shared Resources, which are supported by Cancer Center Support (P30CA045508). Funding was provided to M.E. by the National Institutes of Health (NIH) (1R01CA2374135) and Department of Defense (DoD) Breast Cancer Research Program (BCRP, W81XWH-20-1-0753), and to L.V.A. by the NIH (R01MH119819, R01NS116897) and the DoD BRCP (W81XWH-20-1-0754). C.R.V. and D.L.S. were supported by the NIH 5P01CA013106. X.-Y.H, J.M.A., and J.D.-P. were recipients of the 2021 AACR-AstraZeneca Breast Cancer Research Fellowship (21-40-12-HE), the Cancer Research Institute/Irvington Postdoctoral Fellowship (CRI award no. 3435), and a Deutsche Forschungsgemeinschaft Fellowship (DA-2249/1-1), respectively. Y.G and X.H. are recipients of NIH awards (K99CA273523 and F99CA284292, respectively). The schematic diagrams were created with BioRender (agreement numbers AC262XYRPD and VM26DBA6KS).
Footnotes
DECLARATION OF INTERESTS
M.E. serves on the advisory board of Cancer Cell. C.R.V. has received consulting fees from Flare Therapeutics, Roivant Sciences, and C4 Therapeutics; has served on the advisory boards of KSQ Therapeutics, Syros Pharmaceuticals and Treeline Biosciences; and owns stock from Treeline Biosciences.
Publisher's Disclaimer: This is a PDF file of an unedited manuscript that has been accepted for publication. As a service to our customers we are providing this early version of the manuscript. The manuscript will undergo copyediting, typesetting, and review of the resulting proof before it is published in its final form. Please note that during the production process errors may be discovered which could affect the content, and all legal disclaimers that apply to the journal pertain.
REFERENCES
- 1.Yaribeygi H, Panahi Y, Sahraei H, Johnston TP, and Sahebkar A. (2017). The impact of stress on body function: A review. EXCLI J 16, 1057–1072. 10.17179/excli2017-480. [DOI] [PMC free article] [PubMed] [Google Scholar]
- 2.McEwen BS (2007). Physiology and neurobiology of stress and adaptation: central role of the brain. Physiol Rev 87, 873–904. 10.1152/physrev.00041.2006. [DOI] [PubMed] [Google Scholar]
- 3.Newton R. (2000). Molecular mechanisms of glucocorticoid action: what is important? Thorax 55, 603–613. DOI 10.1136/thorax.55.7.603. [DOI] [PMC free article] [PubMed] [Google Scholar]
- 4.Chida Y, Hamer M, Wardle J, and Steptoe A. (2008). Do stress-related psychosocial factors contribute to cancer incidence and survival? Nat Clin Pract Oncol 5, 466–475. 10.1038/ncponc1134. [DOI] [PubMed] [Google Scholar]
- 5.Moreno-Smith M, Lutgendorf SK, and Sood AK (2010). Impact of stress on cancer metastasis. Future Oncol 6, 1863–1881. 10.2217/fon.10.142. [DOI] [PMC free article] [PubMed] [Google Scholar]
- 6.Obradovic MMS, Hamelin B, Manevski N, Couto JP, Sethi A, Coissieux MM, Munst S, Okamoto R, Kohler H, Schmidt A, and Bentires-Alj M. (2019). Glucocorticoids promote breast cancer metastasis. Nature 567, 540–544. 10.1038/s41586-019-1019-4. [DOI] [PubMed] [Google Scholar]
- 7.Yang H., Xia L., Chen J., Zhang S., Martin V., Li Q., Lin S., Chen J., Calmette J., Lu M., et al. (2019). Stress-glucocorticoid-TSC22D3 axis compromises therapy-induced antitumor immunity. Nature medicine 25, 1428–1441. 10.1038/s41591-019-0566-4. [DOI] [PubMed] [Google Scholar]
- 8.Zhou Q, Ding W, Qian Z, Jiang G, Sun C, and Xu K. (2020). Chronic Unpredictable Mild Stress Accelerates the Growth of Bladder Cancer in a Xenograft Mouse Model. Psychol Res Behav Manag 13, 1289–1297. 10.2147/PRBM.S288983. [DOI] [PMC free article] [PubMed] [Google Scholar]
- 9.Flores IE, Sierra-Fonseca JA, Davalos O, Saenz LA, Castellanos MM, Zavala JK, and Gosselink KL (2017). Stress alters the expression of cancer-related genes in the prostate. BMC Cancer 17, 621. 10.1186/s12885-017-3635-4. [DOI] [PMC free article] [PubMed] [Google Scholar]
- 10.Zhidkova EM, Lylova ES, Savinkova AV, Mertsalov SA, Kirsanov KI, Belitsky GA, Yakubovskaya MG, and Lesovaya EA (2020). A Brief Overview of the Paradoxical Role of Glucocorticoids in Breast Cancer. Breast Cancer (Auckl) 14, 1178223420974667. 10.1177/1178223420974667. [DOI] [PMC free article] [PubMed] [Google Scholar]
- 11.Pang JM, Huang YC, Sun SP, Pan YR, Shen CY, Kao MC, Wang RH, Wang LH, and Lin KT (2020). Effects of synthetic glucocorticoids on breast cancer progression. Steroids 164, 108738. 10.1016/j.steroids.2020.108738. [DOI] [PubMed] [Google Scholar]
- 12.Peinado H, Zhang H, Matei IR, Costa-Silva B, Hoshino A, Rodrigues G, Psaila B, Kaplan RN, Bromberg JF, Kang Y, et al. (2017). Pre-metastatic niches: organ-specific homes for metastases. Nature reviews. Cancer 17, 302–317. 10.1038/nrc.2017.6. [DOI] [PubMed] [Google Scholar]
- 13.Hickman DL (2017). Evaluation of the neutrophil:lymphocyte ratio as an indicator of chronic distress in the laboratory mouse. Lab Animal 46, 303–307. DOI 10.1038/laban.1298. [DOI] [PMC free article] [PubMed] [Google Scholar]
- 14.Sacdalan DB, Lucero JA, and Sacdalan DL (2018). Prognostic utility of baseline neutrophil-to-lymphocyte ratio in patients receiving immune checkpoint inhibitors: a review and meta-analysis. Oncotargets Ther 11, 955–965. 10.2147/Ott.S153290. [DOI] [PMC free article] [PubMed] [Google Scholar]
- 15.Zahorec R. (2001). Ratio of neutrophil to lymphocyte counts--rapid and simple parameter of systemic inflammation and stress in critically ill. Bratisl Lek Listy 102, 5–14. [PubMed] [Google Scholar]
- 16.Aydin Sunbul E, Sunbul M, Yanartas O, Cengiz F, Bozbay M, Sari I, and Gulec H. (2016). Increased Neutrophil/Lymphocyte Ratio in Patients with Depression is Correlated with the Severity of Depression and Cardiovascular Risk Factors. Psychiatry Investig 13, 121–126. 10.4306/pi.2016.13.1.121. [DOI] [PMC free article] [PubMed] [Google Scholar]
- 17.Romero I, Garrido F, and Garcia-Lora AM (2014). Metastases in immune-mediated dormancy: a new opportunity for targeting cancer. Cancer research 74, 6750–6757. 10.1158/0008-5472.CAN-14-2406. [DOI] [PubMed] [Google Scholar]
- 18.Pommier A, Anaparthy N, Memos N, Kelley ZL, Gouronnec A, Yan R, Auffray C, Albrengues J, Egeblad M, Iacobuzio-Donahue CA, et al. (2018). Unresolved endoplasmic reticulum stress engenders immune-resistant, latent pancreatic cancer metastases. Science 360. 10.1126/science.aao4908. [DOI] [PMC free article] [PubMed] [Google Scholar]
- 19.Wculek SK, and Malanchi I. (2015). Neutrophils support lung colonization of metastasis-initiating breast cancer cells. Nature 528, 413–417. 10.1038/nature16140. [DOI] [PMC free article] [PubMed] [Google Scholar]
- 20.Yang L, Liu Q, Zhang X, Liu X, Zhou B, Chen J, Huang D, Li J, Li H, Chen F, et al. (2020). DNA of neutrophil extracellular traps promotes cancer metastasis via CCDC25. Nature 583, 133–138. 10.1038/s41586-020-2394-6. [DOI] [PubMed] [Google Scholar]
- 21.Park J, Wysocki RW, Amoozgar Z, Maiorino L, Fein MR, Jorns J, Schott AF, Kinugasa-Katayama Y, Lee Y, Won NH, et al. (2016). Cancer cells induce metastasis-supporting neutrophil extracellular DNA traps. Sci Transl Med 8, 361ra138. 10.1126/scitranslmed.aag1711. [DOI] [PMC free article] [PubMed] [Google Scholar]
- 22.Albrengues J, Shields MA, Ng D, Park CG, Ambrico A, Poindexter ME, Upadhyay P, Uyeminami DL, Pommier A, Kuttner V, et al. (2018). Neutrophil extracellular traps produced during inflammation awaken dormant cancer cells in mice. Science 361, eaao4227. 10.1126/science.aao4227. [DOI] [PMC free article] [PubMed] [Google Scholar]
- 23.He XY, Ng D, and Egeblad M. (2022). Caught in a Web: Emerging Roles of Neutrophil Extracellular Traps in Cancer. Annual Review of Cancer Biology 6, 223–243. 10.1146/annurev-cancerbio-080421-015537. [DOI] [Google Scholar]
- 24.Adrover JM, McDowell SAC, He XY, Quail DF, and Egeblad M. (2023). NETworking with cancer: The bidirectional interplay between cancer and neutrophil extracellular traps. Cancer cell 41, 505–526. 10.1016/j.ccell.2023.02.001. [DOI] [PMC free article] [PubMed] [Google Scholar]
- 25.Tan S., Wang Y., Chen K., Long Z., and Zou J. (2017). Ketamine Alleviates Depressive-Like Behaviors via Down-Regulating Inflammatory Cytokines Induced by Chronic Restraint Stress in Mice. Biol Pharm Bull 40, 1260–1267. 10.1248/bpb.b17-00131. [DOI] [PubMed] [Google Scholar]
- 26.Xu XR, Xiao Q, Hong YC, Liu YH, Liu Y, and Tu J. (2021). Activation of dopaminergic VTA inputs to the mPFC ameliorates chronic stress-induced breast tumor progression. CNS Neurosci Ther 27, 206–219. 10.1111/cns.13465. [DOI] [PMC free article] [PubMed] [Google Scholar]
- 27.Lippi SLP (2021). Chronic Mild Unpredictable Stress and High-Fat Diet Given during Adolescence Impact Both Cognitive and Noncognitive Behaviors in Young Adult Mice. Brain Sci 11. 10.3390/brainsci11020260. [DOI] [PMC free article] [PubMed] [Google Scholar]
- 28.Erler JT, Bennewith KL, Cox TR, Lang G, Bird D, Koong A, Le QT, and Giaccia AJ (2009). Hypoxia-Induced Lysyl Oxidase Is a Critical Mediator of Bone Marrow Cell Recruitment to Form the Premetastatic Niche. Cancer cell 15, 35–44. 10.1016/j.ccr.2008.11.012. [DOI] [PMC free article] [PubMed] [Google Scholar]
- 29.Adrover JM, Del Fresno C, Crainiciuc G, Cuartero MI, Casanova-Acebes M, Weiss LA, Huerga-Encabo H, Silvestre-Roig C, Rossaint J, Cossio I, et al. (2019). A Neutrophil Timer Coordinates Immune Defense and Vascular Protection. Immunity 50, 390–402 e310. 10.1016/j.immuni.2019.01.002. [DOI] [PubMed] [Google Scholar]
- 30.Ella K, Csepanyi-Komi R, and Kaldi K. (2016). Circadian regulation of human peripheral neutrophils. Brain Behav Immun 57, 209–221. 10.1016/j.bbi.2016.04.016. [DOI] [PubMed] [Google Scholar]
- 31.Reddy TE, Gertz J, Crawford GE, Garabedian MJ, and Myers RM (2012). The hypersensitive glucocorticoid response specifically regulates period 1 and expression of circadian genes. Mol Cell Biol 32, 3756–3767. 10.1128/MCB.00062-12. [DOI] [PMC free article] [PubMed] [Google Scholar]
- 32.Oishi K, Ohkura N, Kadota K, Kasamatsu M, Shibusawa K, Matsuda J, Machida K, Horie S, and Ishida N. (2006). Clock mutation affects circadian regulation of circulating blood cells. J Circadian Rhythms 4, 13. 10.1186/1740-3391-4-13. [DOI] [PMC free article] [PubMed] [Google Scholar]
- 33.Casbon AJ, Reynaud D, Park C, Khuc E, Gan DD, Schepers K, Passegue E, and Werb Z. (2015). Invasive breast cancer reprograms early myeloid differentiation in the bone marrow to generate immunosuppressive neutrophils. Proceedings of the National Academy of Sciences of the United States of America 112, E566–E575. 10.1073/pnas.1424927112. [DOI] [PMC free article] [PubMed] [Google Scholar]
- 34.Zhang DC, Chen G, Manwani D, Mortha A, Xu CL, Faith JJ, Burk RD, Kunisaki Y, Jang JE, Scheiermann C, et al. (2015). Neutrophil ageing is regulated by the microbiome. Nature 525, 528-+. 10.1038/nature15367. [DOI] [PMC free article] [PubMed] [Google Scholar]
- 35.Brinkmann V, Reichard U, Goosmann C, Fauler B, Uhlemann Y, Weiss DS, Weinrauch Y, and Zychlinsky A. (2004). Neutrophil extracellular traps kill bacteria. Science 303, 1532–1535. 10.1126/science.1092385. [DOI] [PubMed] [Google Scholar]
- 36.Biermann MH, Podolska MJ, Knopf J, Reinwald C, Weidner D, Maueroder C, Hahn J, Kienhofer D, Barras A, Boukherroub R, et al. (2016). Oxidative Burst-Dependent NETosis Is Implicated in the Resolution of Necrosis-Associated Sterile Inflammation. Front Immunol 7, 557. 10.3389/fimmu.2016.00557. [DOI] [PMC free article] [PubMed] [Google Scholar]
- 37.Amulic B, Knackstedt SL, Abu Abed U, Deigendesch N, Harbort CJ, Caffrey BE, Brinkmann V, Heppner FL, Hinds PW, and Zychlinsky A. (2017). Cell-Cycle Proteins Control Production of Neutrophil Extracellular Traps. Developmental Cell 43, 449-+. 10.1016/j.devcel.2017.10.013. [DOI] [PubMed] [Google Scholar]
- 38.Scheiblecker L, Kollmann K, and Sexl V. (2020). CDK4/6 and MAPK-Crosstalk as Opportunity for Cancer Treatment. Pharmaceuticals-Base 13. 10.3390/ph13120418. [DOI] [PMC free article] [PubMed] [Google Scholar]
- 39.Takeda K, Shimozono R, Noguchi T, Umeda T, Morimoto Y, Naguro I, Tobiume K, Saitoh M, Matsuzawa A, and Ichijo H. (2007). Apoptosis signal-regulating kinase (ASK) 2 functions as a mitogen-activated protein kinase kinase kinase in a heteromeric complex with ASK1. Journal of Biological Chemistry 282, 7522–7531. 10.1074/jbc.M607177200. [DOI] [PubMed] [Google Scholar]
- 40.Hattori K, Wakatsuki H, Sakauchi C, Furutani S, Sugawara S, Hatta T, Natsume T, and Ichijo H. (2020). β-adrenergic receptor signaling evokes the PKA-ASK axis in mature brown adipocytes. Plos One 15. 10.1371/journal.pone.0232645. [DOI] [PMC free article] [PubMed] [Google Scholar]
- 41.He X-Y, Ng D, and Egeblad M. (2022). Caught in a Web: Emerging Roles of Neutrophil Extracellular Traps in Cancer. Annual Review of Cancer Biology 6, 223–243. 10.1146/annurev-cancerbio-080421-015537. [DOI] [Google Scholar]
- 42.Wen G, Yao H, Li Y, Ding R, Ren X, Tan Y, Ren W, Yu H, Zhan X, Wang X, et al. (2019). Regulation of Tau Protein on the Antidepressant Effects of Ketamine in the Chronic Unpredictable Mild Stress Model. Front Psychiatry 10, 287. 10.3389/fpsyt.2019.00287. [DOI] [PMC free article] [PubMed] [Google Scholar]
- 43.Tan SJ., Wang Y., Chen K., Long ZF., and Zou J. (2017). Ketamine Alleviates Depressive-Like Behaviors via Down-Regulating Inflammatory Cytokines Induced by Chronic Restraint Stress in Mice. Biological & Pharmaceutical Bulletin 40, 1260–1267. DOI 10.1248/bpb.b17-00131. [DOI] [PubMed] [Google Scholar]
- 44.Nollet M. (2021). Models of Depression: Unpredictable Chronic Mild Stress in Mice. Curr Protoc 1, e208. 10.1002/cpz1.208. [DOI] [PubMed] [Google Scholar]
- 45.Cain DW, and Cidlowski JA (2017). Immune regulation by glucocorticoids. Nature reviews. Immunology 17, 233–247. 10.1038/nri.2017.1. [DOI] [PMC free article] [PubMed] [Google Scholar]
- 46.Perego M, Tyurin VA, Tyurina YY, Yellets J, Nacarelli T, Lin C, Nefedova Y, Kossenkov A, Liu Q, Sreedhar S, et al. (2020). Reactivation of dormant tumor cells by modified lipids derived from stress-activated neutrophils. Science Translational Medicine 12. 10.1126/scitranslmed.abb5817. [DOI] [PMC free article] [PubMed] [Google Scholar]
- 47.Flint TR, Janowitz T, Connell CM, Roberts EW, Denton AE, Coll AP, Jodrell DI, and Fearon DT (2016). Tumor-Induced IL-6 Reprograms Host Metabolism to Suppress Antitumor Immunity. Cell Metab 24, 672–684. 10.1016/j.cmet.2016.10.010. [DOI] [PMC free article] [PubMed] [Google Scholar]
- 48.Poller WC, Downey J, Mooslechner AA, Khan N, Li L, Chan CT, McAlpine CS, Xu CL, Kahles F, He S, et al. (2022). Brain motor and fear circuits regulate leukocytes during acute stress. Nature 607, 578–584. 10.1038/s41586-022-04890-z. [DOI] [PMC free article] [PubMed] [Google Scholar]
- 49.Perego M, Tyurin VA, Tyurina YY, Yellets J, Nacarelli T, Lin C, Nefedova Y, Kossenkov A, Liu Q, Sreedhar S, et al. (2020). Reactivation of dormant tumor cells by modified lipids derived from stress-activated neutrophils. Sci Transl Med 12. 10.1126/scitranslmed.abb5817. [DOI] [PMC free article] [PubMed] [Google Scholar]
- 50.Barnes PJ (1998). Anti-inflammatory actions of glucocorticoids: molecular mechanisms. Clin Sci (Lond) 94, 557–572. 10.1042/cs0940557. [DOI] [PubMed] [Google Scholar]
- 51.Sanner BM, Meder U, Zidek W, and Tepel M. (2002). Effects of glucocorticoids on generation of reactive oxygen species in platelets. Steroids 67, 715–719. 10.1016/s0039-128x(02)00024-7. [DOI] [PubMed] [Google Scholar]
- 52.Flaherty RL, Owen M, Fagan-Murphy A, Intabli H, Healy D, Patel A, Allen MC, Patel BA, and Flint MS (2017). Glucocorticoids induce production of reactive oxygen species/reactive nitrogen species and DNA damage through an iNOS mediated pathway in breast cancer. Breast Cancer Research 19. 10.1186/s13058-017-0823-8. [DOI] [PMC free article] [PubMed] [Google Scholar]
- 53.Huang Y, Cai GQ, Peng JP, and Shen C. (2018). Glucocorticoids induce apoptosis and matrix metalloproteinase-13 expression in chondrocytes through the NOX4/ROS/p38 MAPK pathway. J Steroid Biochem 181, 52–62. 10.1016/j.jsbmb.2018.03.001. [DOI] [PubMed] [Google Scholar]
- 54.You JM, Yun SJ, Nam KN, Kang C, Won R, and Lee EH (2009). Mechanism of glucocorticoid-induced oxidative stress in rat hippocampal slice cultures. Can J Physiol Pharm 87, 440–447. 10.1139/Y09-027. [DOI] [PubMed] [Google Scholar]
- 55.Sato H, Takahashi T, Sumitani K, Takatsu H, and Urano S. (2010). Glucocorticoid Generates ROS to Induce Oxidative Injury in the Hippocampus, Leading to Impairment of Cognitive Function of Rats. J Clin Biochem Nutr 47, 224–232. DOI 10.3164/jcbn.10-58. [DOI] [PMC free article] [PubMed] [Google Scholar]
- 56.Zhang Y, Chandra V, Riquelme Sanchez E, Dutta P, Quesada PR, Rakoski A, Zoltan M, Arora N, Baydogan S, Horne W, et al. (2020). Interleukin-17-induced neutrophil extracellular traps mediate resistance to checkpoint blockade in pancreatic cancer. J Exp Med 217, e20190354. 10.1084/jem.20190354. [DOI] [PMC free article] [PubMed] [Google Scholar]
- 57.Casbon AJ., Reynaud D., Park C., Khuc E., Gan DD., Schepers K., Passegue E., and Werb Z. (2015). Invasive breast cancer reprograms early myeloid differentiation in the bone marrow to generate immunosuppressive neutrophils. Proceedings of the National Academy of Sciences of the United States of America 112, E566–575. 10.1073/pnas.1424927112. [DOI] [PMC free article] [PubMed] [Google Scholar]
- 58.Liu Y, and Cao X. (2016). Characteristics and Significance of the Pre-metastatic Niche. Cancer cell 30, 668–681. 10.1016/j.ccell.2016.09.011. [DOI] [PubMed] [Google Scholar]
- 59.Ren J, He J, Zhang H, Xia Y, Hu Z, Loughran P, Billiar T, Huang H, and Tsung A. (2021). Platelet TLR4-ERK5 axis facilitates NET-mediated capturing of circulating tumor cells and distant metastasis after surgical stress. Cancer research 81, 2373–2385. 10.1158/0008-5472.CAN-20-3222. [DOI] [PMC free article] [PubMed] [Google Scholar]
- 60.Cools-Lartigue J, Spicer J, McDonald B, Gowing S, Chow S, Giannias B, Bourdeau F, Kubes P, and Ferri L. (2013). Neutrophil extracellular traps sequester circulating tumor cells and promote metastasis. The Journal of clinical investigation 123, 3446–3458. 10.1172/JCI67484. [DOI] [PMC free article] [PubMed] [Google Scholar]
- 61.Brill A, Fuchs TA, Savchenko AS, Thomas GM, Martinod K, De Meyer SF, Bhandari AA, and Wagner DD (2012). Neutrophil extracellular traps promote deep vein thrombosis in mice. J Thromb Haemost 10, 136–144. 10.1111/j.1538-7836.2011.04544.x. [DOI] [PMC free article] [PubMed] [Google Scholar]
- 62.Middleton EA, He XY, Denorme F, Campbell RA, Ng D, Salvatore SP, Mostyka M, Baxter-Stoltzfus A, Borczuk AC, Loda M, et al. (2020). Neutrophil Extracellular Traps (NETs) Contribute to Immunothrombosis in COVID-19 Acute Respiratory Distress Syndrome. Blood. 10.1182/blood.2020007008. [DOI] [PMC free article] [PubMed] [Google Scholar]
- 63.Leonardi GC, Accardi G, Monastero R, Nicoletti F, and Libra M. (2018). Ageing: from inflammation to cancer. Immun Ageing 15. 10.1186/s12979-017-0112-5. [DOI] [PMC free article] [PubMed] [Google Scholar]
- 64.Bottazzi B, Riboli E, and Mantovani A. (2018). Aging, inflammation and cancer. Seminars in Immunology 40, 74–82. 10.1016/j.smim.2018.10.011. [DOI] [PubMed] [Google Scholar]
- 65.Ferrucci L, and Fabbri E. (2018). Inflammageing: chronic inflammation in ageing, cardiovascular disease, and frailty. Nat Rev Cardiol 15, 505–522. 10.1038/s41569-018-0064-2. [DOI] [PMC free article] [PubMed] [Google Scholar]
- 66.Xu C, Lee SK, Zhang D, and Frenette PS (2020). The Gut Microbiome Regulates Psychological-Stress-Induced Inflammation. Immunity 53, 417–428 e414. 10.1016/j.immuni.2020.06.025. [DOI] [PMC free article] [PubMed] [Google Scholar]
- 67.Rentscher KE, Carroll JE, Repetti RL, Cole SW, Reynolds BM, and Robles TF (2019). Chronic stress exposure and daily stress appraisals relate to biological aging marker p16(INK4a). Psychoneuroendocrinology 102, 139–148. 10.1016/j.psyneuen.2018.12.006. [DOI] [PMC free article] [PubMed] [Google Scholar]
- 68.Zhang L, Pan J, Chen W, Jiang J, and Huang J. (2020). Chronic stress-induced immune dysregulation in cancer: implications for initiation, progression, metastasis, and treatment. Am J Cancer Res 10, 1294–1307. [PMC free article] [PubMed] [Google Scholar]
- 69.Martinod K, Witsch T, Erpenbeck L, Savchenko A, Hayashi H, Cherpokova D, Gallant M, Mauler M, Cifuni SM, and Wagner DD (2017). Peptidylarginine deiminase 4 promotes age-related organ fibrosis. J Exp Med 214, 439–458. 10.1084/jem.20160530. [DOI] [PMC free article] [PubMed] [Google Scholar]
- 70.He XY, Ng D, Van Aelst L, and Egeblad M. (2019). Stressing Out about Cancer Immunotherapy. Cancer cell 36, 468–470. 10.1016/j.ccell.2019.10.013. [DOI] [PubMed] [Google Scholar]
- 71.Mittelstadt PR, Monteiro JP, and Ashwell JD (2012). Thymocyte responsiveness to endogenous glucocorticoids is required for immunological fitness. Journal of Clinical Investigation 122, 2384–2394. 10.1172/Jci63067. [DOI] [PMC free article] [PubMed] [Google Scholar]
- 72.Passegue E, Wagner EF, and Weissman IL (2004). JunB deficiency leads to a myeloproliferative disorder arising from hematopoietic stem cells. Cell 119, 431–443. 10.1016/j.cell.2004.10.010. [DOI] [PubMed] [Google Scholar]
- 73.Zhang B, Ma S, Rachmin I, He M, Baral P, Choi S, Goncalves WA, Shwartz Y, Fast EM, Su Y, et al. (2020). Hyperactivation of sympathetic nerves drives depletion of melanocyte stem cells. Nature 577, 676–681. 10.1038/s41586-020-1935-3. [DOI] [PMC free article] [PubMed] [Google Scholar]
- 74.Sun L, Han X, and Egeblad M. (2022). Isolation of mouse mammary carcinoma-derived macrophages and cancer cells for co-culture assays. STAR Protoc 3, 101833. 10.1016/j.xpro.2022.101833. [DOI] [PMC free article] [PubMed] [Google Scholar]
- 75.File SE, Lippa AS, Beer B, and Lippa MT (2005). Animal tests of anxiety. Curr Protoc Pharmacol Chapter 5, Unit 5 38. 10.1002/0471141755.ph0538s27. [DOI] [PubMed] [Google Scholar]
- 76.Adrover JM., Aroca-Crevillen A., Crainiciuc G., Ostos F., Rojas-Vega Y., Rubio-Ponce A., Cilloniz C., Bonzon-Kulichenko E., Calvo E., Rico D., et al. (2020). Programmed ‘disarming’ of the neutrophil proteome reduces the magnitude of inflammation. Nature immunology 21, 135–144. 10.1038/s41590-019-0571-2. [DOI] [PMC free article] [PubMed] [Google Scholar]
- 77.Choi S, Zhang B, Ma S, Gonzalez-Celeiro M, Stein D, Jin X, Kim ST, Kang YL, Besnard A, Rezza A, et al. (2021). Corticosterone inhibits GAS6 to govern hair follicle stemcell quiescence. Nature 592, 428–432. 10.1038/s41586-021-03417-2. [DOI] [PMC free article] [PubMed] [Google Scholar]
- 78.Sun L, Kees T, Almeida AS, Liu B, He XY, Ng D, Han X, Spector DL, McNeish IA, Gimotty P, et al. (2021). Activating a collaborative innate-adaptive immune response to control metastasis. Cancer cell 39, 1361–1374 e1369. 10.1016/j.ccell.2021.08.005. [DOI] [PMC free article] [PubMed] [Google Scholar]
- 79.Dobin A, Davis CA, Schlesinger F, Drenkow J, Zaleski C, Jha S, Batut P, Chaisson M, and Gingeras TR (2013). STAR: ultrafast universal RNA-seq aligner. Bioinformatics 29, 15–21. 10.1093/bioinformatics/bts635. [DOI] [PMC free article] [PubMed] [Google Scholar]
- 80.Liao Y, Smyth GK, and Shi W. (2014). featureCounts: an efficient general purpose program for assigning sequence reads to genomic features. Bioinformatics 30, 923–930. 10.1093/bioinformatics/btt656. [DOI] [PubMed] [Google Scholar]
- 81.Love MI, Huber W, and Anders S. (2014). Moderated estimation of fold change and dispersion for RNA-seq data with DESeq2. Genome Biol 15, 550. 10.1186/s13059-014-0550-8. [DOI] [PMC free article] [PubMed] [Google Scholar]
- 82.Subramanian A, Tamayo P, Mootha VK, Mukherjee S, Ebert BL, Gillette MA, Paulovich A, Pomeroy SL, Golub TR, Lander ES, and Mesirov JP (2005). Gene set enrichment analysis: a knowledge-based approach for interpreting genome-wide expression profiles. Proceedings of the National Academy of Sciences of the United States of America 102, 15545–15550. 10.1073/pnas.0506580102. [DOI] [PMC free article] [PubMed] [Google Scholar]
- 83.Bray NL, Pimentel H, Melsted P, and Pachter L. (2016). Near-optimal probabilistic RNAseq quantification. Nat Biotechnol 34, 525–527. 10.1038/nbt.3519. [DOI] [PubMed] [Google Scholar]
- 84.Zhou Y, Zhou B, Pache L, Chang M, Khodabakhshi AH, Tanaseichuk O, Benner C, and Chanda SK (2019). Metascape provides a biologist-oriented resource for the analysis of systems-level datasets. Nat Commun 10, 1523. 10.1038/s41467-019-09234-6. [DOI] [PMC free article] [PubMed] [Google Scholar]
- 85.Langmead B, and Salzberg SL (2012). Fast gapped-read alignment with Bowtie 2. Nat Methods 9, 357–359. 10.1038/nmeth.1923. [DOI] [PMC free article] [PubMed] [Google Scholar]
- 86.Langmead B, Trapnell C, Pop M, and Salzberg SL (2009). Ultrafast and memory-efficient alignment of short DNA sequences to the human genome. Genome Biol 10, R25. 10.1186/gb-2009-10-3-r25. [DOI] [PMC free article] [PubMed] [Google Scholar]
- 87.Ramirez F, Ryan DP, Gruning B, Bhardwaj V, Kilpert F, Richter AS, Heyne S, Dundar F, and Manke T. (2016). deepTools2: a next generation web server for deep-sequencing data analysis. Nucleic Acids Res 44, W160–165. 10.1093/nar/gkw257. [DOI] [PMC free article] [PubMed] [Google Scholar]
- 88.Gyorffy B. (2021). Survival analysis across the entire transcriptome identifies biomarkers with the highest prognostic power in breast cancer. Comput Struct Biotechnol J 19, 4101–4109. 10.1016/j.csbj.2021.07.014. [DOI] [PMC free article] [PubMed] [Google Scholar]
- 89.Vicanolo T, Hidalgo A, and Adrover JM (2022). Measuring Circadian Neutrophil Infiltration in Tissues by Paired Whole-Mount Tissue Clearing and Flow Cytometry. Methods Mol Biol 2482, 265–284. 10.1007/978-1-0716-2249-0_18. [DOI] [PubMed] [Google Scholar]
Associated Data
This section collects any data citations, data availability statements, or supplementary materials included in this article.
Supplementary Materials
Data Availability Statement
RNA-seq data have been deposited at GEO and are publicly available as of the date of publication. Accession number is listed in the key resources table. This paper does not report original code. Any additional information required to reanalyze the data reported in this paper is available from the lead contact upon request.