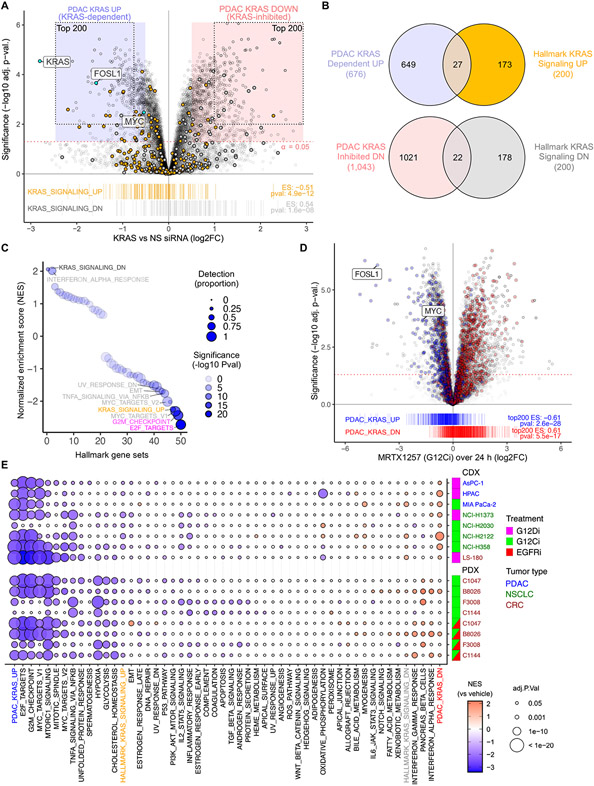
Fig. 1. Establishment and evaluation of a KRAS-dependent gene expression program in KRAS-mutant PDAC.
(A) KRAS-dependent gene expression changes upon acute (24 hours) KRAS suppression in eight KRAS-mutant PDAC cell lines transiently transfected with KRAS or control non-specific (NS) siRNA. Enrichment of Hallmark KRAS signaling gene sets is shown below. The 677 KRAS-dependent (UP) and 1,051 KRAS-suppressed (DN) genes (log2 fold-change/FC > 0.5, adj. p-val. < 0.05) are indicated by blue and red shaded circles, respectively. The top 200 KRAS-dependent (UP) and KRAS-inhibited (DN) genes comprising the PDAC KRAS UP/DN signatures are indicated by the dotted outlines. (B) Venn diagram indicates the overlap of differentially expressed genes (with unique Entrez gene IDs) upon KRAS siRNA treatment (refer to blue/red shading in (A)) compared to Hallmark KRAS signaling genes. N = 8 (cell lines as biological replicates) for each treatment and control. (C) GSEA for 50 Hallmark gene sets within DE genes following KRAS siRNA treatment. Detection is based on presence of a gene in all 8 PDAC cell lines at >5 reads. NES, normalized enrichment score. (D) KRAS-G12Ci (MRTX1257, 20 nM) induced expression changes summarized over 24 hours and three cell lines (PDAC, CRC, and NSCLC). Genes from siKRAS experiment shown as blue/red boxes in (A) are highlighted with blue/red and indicated by barcode plot below. Enrichment scores (ES) for top 200 UP/DN genes are indicated. (E) GSEA for 50 Hallmark gene sets within RNA-seq data from the indicated human cancer cell line-derived (CDX) or patient-derived (PDX) xenograft tumor samples. CDX mice were treated orally (24 hours) with either KRASG12C or KRASG12D selective inhibitors (G12Ci adagrasib or G12Di MRTX1133, respectively) or vehicle control. PDX mice were treated (21 days) with G12Ci sotorasib alone or together with the EGFRi panitumumab. The top 200 genes from the PDAC KRAS UP/DN gene sets (panel A) were also evaluated. N = 3 for each cell line/treatment combination except HPAC (control) and LS-180 (G12Di), where n = 6.

