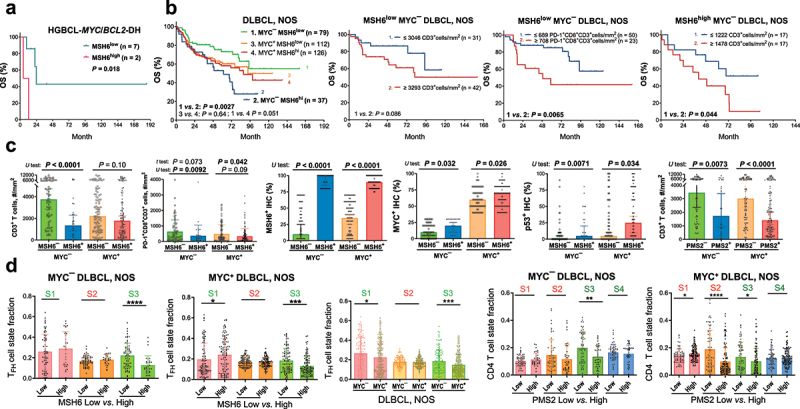
Figure 6.

Prognostic effects of high MMR protein expression and correlative analyses.
(a) High MSH6 expression (cutoff, >70%) was associated with significantly poorer overall survival (OS) in evaluated MYC/BCL2 double-hit cases. (b) High MSH6 expression was associated with significantly poorer OS only in patients with MYC¯ (<40%) DLBCL-NOS. In MYC¯ patients with low MSH6 expression, high T cell densities were associated with a non-significant trend of poorer OS, and high cell densities of PD-1+CD8+ T cells were associated with significantly poorer OS. In MYC¯ patients with high MSH6 expression, high T cell densities were associated with significantly poorer OS. (c) Scatter plots for comparisons between MSH6low and MSH6high or between PMS2low and PMS2high patients with MYC¯ or MYC+ DLBCLs. Low and high expression were denoted with negative and positive signs, respectively. U test and median values (bars) were shown because in MYC+ patients, comparing between MSH6low and MSH6high DLBCLs, the mean T-cell densities were not significantly different (P = 0.32 by t test). For comparisons in the third to sixth plots, the differences were significant by both t and U tests. (d) Only in MYC+ patients, MSH6high expression was associated with significantly higher fractions of TFH cell state S1, PMS2high expression (cutoff: ≥90%) was associated with significantly higher fractions of CD4 T cell state S1 and lower fractions of CD4 T-cell state S2 (featuring co-inhibitory and stimulatory molecules). In cell state labeling, red color indicates unfavorable prognostic effect, and green color indicates favorable prognostic effect according to Reference 37. MYC+ compared with MYC¯ patients had significantly lower fractions of TFH cell states S1 and S3.
