

Abstract
How the dorsal-ventral axis of the vertebrate jaw, particularly the position of tooth initiation site, is established remains a critical and unresolved question. Tooth development starts with the formation of the dental lamina, a localized thickened strip within the maxillary and mandibular epithelium. To identify transcriptional regulatory networks (TRN) controlling the specification of dental lamina from the naïve mandibular epithelium, we utilized Laser Microdissection coupled low-input RNA-seq (LMD-RNA-seq) to profile gene expression of different domains of the mandibular epithelium along the dorsal-ventral axis. We comprehensively identified transcription factors (TFs) and signaling pathways that are differentially expressed along mandibular epithelial domains (including the dental lamina). Specifically, we found that the TFs Sox2 and Tfap2 (Tfap2a/Tfap2b) formed complimentary expression domains along the dorsal-ventral axis of the mandibular epithelium. Interestingly, both classic and novel dental lamina specific TFs—such as Pitx2, Ascl5 and Zfp536—were found to localize near the Sox2:Tfap2a/Tfap2b interface. To explore the functional significance of these domain specific TFs, we next examined loss-of-function mouse models of these domain specific TFs, including the dental lamina specific TF, Pitx2, and the ventral surface ectoderm specific TFs Tfap2a and Tfap2b. We found that disruption of domain specific TFs leads to an upregulation and expansion of the alternative domain’s TRN. The importance of this cross-repression is evident by the ectopic expansion of Pitx2 and Sox2 positive dental lamina structure in Tfap2a/Tfap2b ectodermal double knockouts and the emergence of an ectopic tooth in the ventral surface ectoderm. Finally, we uncovered an unappreciated interface of mesenchymal SHH and WNT signaling pathways, at the site of tooth initiation, that were established by the epithelial domain specific TFs including Pitx2 and Tfap2a/Tfap2b. These results uncover a previously unknown molecular mechanism involving cross-repression of domain specific TFs including Pitx2 and Tfap2a/Tfap2b in patterning the dorsal-ventral axis of the mouse mandible, specifically the regulation of tooth initiation site.
Author summary
For adults, especially in the elderly population, tooth loss is one of the most common organ failures. Tooth development starts with formation of dental lamina that have the capability to induce a tooth development program even when recombined with non-dental mesenchyme. However, how this dental lamina is specified within the continuous naïve maxillary and mandibular ectoderm, remains poorly understood. To identify genes that are critical for dental lamina formation and dorsal-ventral axis establishment, we generated transcriptome profiles of four domains along the dorsal-ventral axis of the mouse E11.5 mandibular ectoderm. We comprehensively identified domain specific and enriched transcription factors and signaling genes along dorsal-ventral axis of the mandibular epithelium. We then investigated two loss of function mouse models for domain specific transcription factors including the dental lamina specific transcription factor Pitx2, and the ventral surface ectoderm specific transcription factor Tfap2a/Tfap2b. Unexpectedly, we found a cross-repressive relationship between domain specific transcription factors. Additionally, we found this cross-repression relationship between Pitx2 and Tfap2a/Tfap2b play a critical role in patterning the dorsal-ventral axis of the mouse mandible and the initiation of tooth development program. Results from this study provide a new framework for future tooth regeneration research.
Introduction
The development of vertebrate jaws, the primary feeding apparatus, requires the precise coordination of gene regulatory programs and signaling interactions among different tissue layers [1,2]. Recent studies indicate that the cranial neural crest cells (CNCCs), which migrate into the nascent mandibular (lower jaw) and maxillary (upper jaw) prominences, are genetically poised and their fates are primarily determined by signaling from the covering epithelial cells [3–6]. The patterning of mandibular and maxillary epithelium in-turn is thought to be established by gradients of inductive signaling pathways. For example, by embryonic day 9.5 (E9.5), the mouse mandibular epithelium can be divided broadly into a few domains by the expression pattern of Fgf8, Bmp4, Shh, and additional signaling pathways [7–10]. Ultimately, this partitioning results in non-dental oral epithelial, dental epithelial, and surface skin epithelial program along the dorsal-ventral axis, respectively. While the expression pattern of many signaling pathways is known, it is still unclear how gradients of these signaling pathways can precisely segregate the mandibular epithelium into distinct domains.
Proper cell lineage segregation of the epithelium is critical for tooth positioning during development of the upper and lower jaws. The precise location of teeth is essential for their function. Tooth development is governed by reciprocal interactions between dental epithelium and the underlying CNCC-derived mesenchyme. It has been shown that in most species, including mice and humans, initiation of a tooth development program is marked with a localized thickening of the maxillary and mandibular epithelium. This thickening results in a ‘strip’ of dental epithelium, known as the dental lamina (DL). Importantly, the DL has the molecular capacity to induce a tooth development program, even when recombined with non-dental mesenchyme [11]. All teeth will originate within this DL ‘strip’, going through a series of developmental transitions including the placode, bud, cap, and bell stage. Previous studies have shown that FGF and BMP pathways in maxillary and mandibular epithelium antagonize each other at the site of DL formation [7,8,12–14]. Mouse knockout (KO) models of many genes expressed in the maxillary and mandibular epithelium before DL formation—including Pitx2, Sox2, Irx1, Lef1, Tbx1, Fgf8, among others—have been generated and studied. However, despite tooth development defects at later stages, all these models present with normal DL formation [14–30]. Thus, how the DL is specified within the continuous naïve maxillary and mandibular epithelium, remains a critical and unresolved question.
The recent development of low-input RNA-seq technology—such as Smart-Seq2—provides new opportunities to address these questions by allowing transcriptome profiling of small tissues [31]. In this study, we coupled Laser Microdissection (LMD) and the Smart-Seq2 protocol (termed LMD-RNA-seq in this study) to generate transcriptome profiles of four domains—including the dental lamina (DL)—of the E11.5 mouse mandibular epithelium along its dorsal-ventral axis. Leveraging these comprehensive and spatially resolved datasets, we comprehensively identified domain specific and enriched transcription factors (TFs) and signaling genes that are differentially expressed along dorsal-ventral domains of the mandibular epithelium. To validate the functional significance of these domain specific TFs in mandibular epithelium patterning and tooth initiation, we next investigated loss of function mouse models for these domain specific TFs; namely, the DL-specific TF Pitx2[15], and the ventral surface ectoderm specific TF Tfap2a/Tfap2b[32]. Unexpectedly, these analyses identified a cross-repressive relationship between epithelial domain specific networks. Furthermore, we found this cross-repressive relationship of epithelial domains’ TRNs also regulates the mesenchymal SHH and WNT pathways activity at the site of tooth initiation.
In sum, these results highlight a previously unknown molecular mechanism involving cross-repression of domain specific TFs—including Pitx2 and Tfap2a/Tfap2b—in patterning the dorsal-ventral axis of the mouse mandible and specifically the regulation of a tooth initiation site. As such, they provide a new framework from which to test molecular models of tooth development, congenital tooth defects, and future tooth regeneration research.
Results
Transcriptome profiles of mandibular epithelial domains along the dorsal-ventral axis
To identify genes that are critical for mandibular epithelial patterning, we first applied Laser Microdissection (LMD) coupled Smart-Seq2 RNA-seq [31] (LMD-RNA-seq) to generate transcriptome profiles of four domains along the dorsal-ventral axis of the E11.5 mouse mandibular epithelium (also known as the oral-aboral axis, we will refer to it as the dorsal-ventral axis throughout this study, Fig 1A). The four domains, from dorsal to ventral, included: 1) a posterior/dorsal domain, located posterior to the dental lamina (DL) that will develop into non-dental oral epithelium; 2) a DL domain, developing into dental epithelium; 3) an anterior domain, located anterior to the DL and developing into surface skin epithelium; and, 4) an aboral/ventral domain, also developing into surface skin epithelium (Fig 1B). We performed differentially expressed gene (DEG) analysis between the transcriptome profiles of these four domains with DESeq2[33] (Figs 1C and S1). To control for variability associated with lowly expressed genes, we further applied the ASHR algorithm [34] to estimate shrunken (conservative) log2 fold changes.
Fig 1. Transcriptome profiling of the E11.5 mouse mandibular epithelium along the dorsoventral axis.
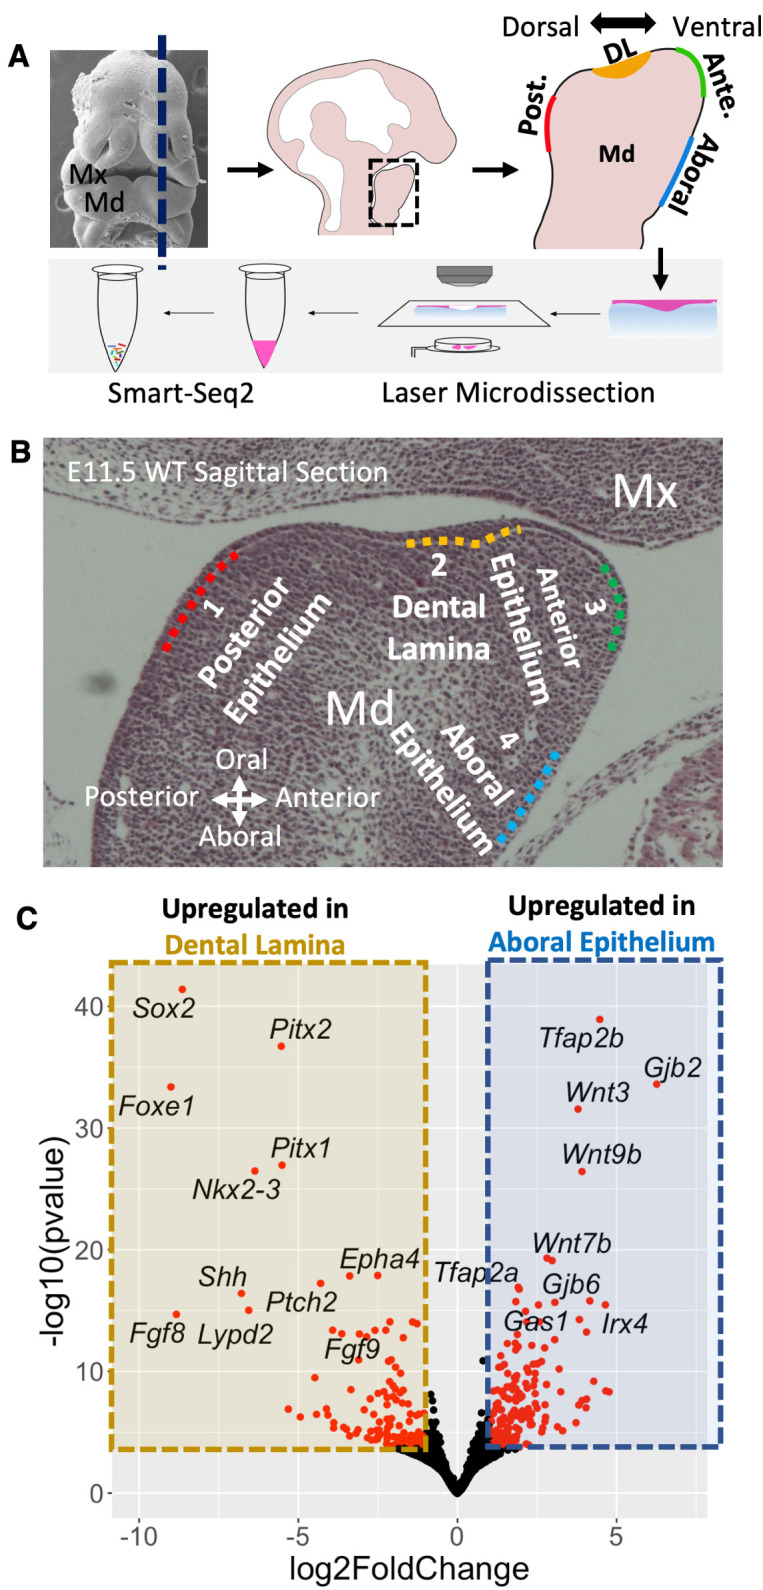
A) Workflow of Laser microdissection coupled with smart-seq2 RNA-seq (LMD-RNA-seq) protocol. B) LMD-RNA-seq libraries were prepared for 4 domains of mouse E11.5 mandibular epithelium along the dorsoventral axis. Dotted lines (#1–4) define the regions of epithelial cells that were collected with laser microdissection. C) Volcano plot showing differentially expressed genes (DEGs) of the E11.5 dental lamina (#2 domain) compared with the aboral ectoderm (#4 domain). Red dots indicate DEGs with a absolute log2 fold-change larger than 1.0 and a adjusted p value less than 0.01. Abbreviations: DL, dental lamina; Md, Mandible; Mx, Maxilla.
During initial analysis, we found that the anterior domain epithelium and aboral domain epithelium are molecularly similar (S1E Fig). Therefore, in the subsequent analysis, we focused on three domains: the posterior domain, the DL domain, and the aboral domain. Pair-wise DEG analysis comprehensively identified two classes of genes that we termed, “domain specific” or “domain enriched”. Specifically, we defined domain specific genes as genes that were significantly upregulated in one domain relative to the other two domains. In contrast, we defined domain enriched genes as genes that were significantly upregulated in one domain relative to one other domain. For example, Pitx2 is a domain specific gene for the DL domain; Sox2 is a domain enriched gene for both the posterior domain and the DL domain. Through this analysis, we defined 36 posterior domain specific genes, 36 DL specific genes; and 76 aboral domain specific genes. Similarly, we identified 175 posterior domain enriched genes, 848 DL enriched genes, and 239 aboral domain enriched genes (S1 Table).
Closer examination of domain specific and domain enriched genes revealed that a large number encoded transcription factor (TF) and signaling pathway proteins. For example, DEGs analysis comparing the DL with the aboral epithelium identified significant enrichment for Sox2, Pitx2, Foxe1, Pitx1, Nkx2-3, Shh, and Fgf8 within the DL and Tfap2b, Gjb2, Wnt3, Wnt9b, Wnt7b, Tfap2a, and Irx4 within the aboral epithelium (Fig 1C). To focus our analysis on only domain specific or enriched TFs, we next intersected the identified DEGs with all known mouse TFs listed in the AnimalTFDB database [35]. We identified the following domain specific TFs in the E11.5 mandibular epithelium: Foxa1, Foxa2, Plagl1, Dmrta2, and Foxe1 defined the posterior epithelium; Pitx2, Irx1, Evx1, Ascl4, Ascl5, Sp6, and Zfp536 defined the DL; Tfap2a, Tfap2b, Msx2, Irx3, Irx4, Irx5, Lmx1b, Nr2e3, Dnajc1, Elf4, Hic1, and Otx1 defined the aboral epithelium (Fig 2A). We generated an expression heatmap to visualize expression of domain specific and enriched TFs in different domains of mandibular epithelium (Figs 2B and S2A). The heatmap revealed that the anterior epithelium and aboral epithelium expressed a large set of shared TFs, including Tfap2a, Tfap2b, Msx1, Msx2, Dlx3, and Lef1. Similarly, the posterior epithelium and DL shared expression of some TFs including Sox2, Nkx2-3, Pitx1, Isl1, and Tbx1. Some of the DL specific or enriched TFs (e.g., Pitx2, Sox2, Tbx1, etc.) are known to have critical roles during tooth development [15,16,26,28,36–41], while for others TFs (e.g., Foxe1, Nkx2-3, Klf5, Zfp536, Ascl5, etc.), their function, specifically during mandibular epithelium patterning and DL formation, is unclear.
Fig 2. Domain specific and domain enriched transcription factors along the mandibular epithelial dorsoventral axis.

A) List of domain specific transcription factors associated with the 4 domains profiled along the dorsoventral axis of the mouse E11.5 mandibular epithelium. B) Expression heatmap of domain specific and domain enriched transcription factors, including those listed in panel A, along the dorsoventral axis of the E11.5 mandibular epithelium. Rows represent genes, columns represent samples. Dorsal enriched genes are shown in top panel while ventral enriched genes are shown in bottom panel. log2(TPM+1) expression values were used in the heatmap. Abbreviation: TPM, Transcript Per Million.
Finally, to verify the expression pattern of these domain specific or enriched TFs in situ, we utilized immunofluorescent staining (IF) of a subset of TFs to directly visualize expression along the dorsal-ventral axis of the mandibular epithelium at E9.5 and E11.5 (Figs 3 and S3). Interestingly, we found that SOX2 and TFAP2A/TFAP2B expression broadly divided the mandibular epithelium into two complementary domains along the dorsal-ventral axis. Specifically, at E11.5, SOX2 expression covered the dorsal side of the mandibular epithelium, and up to the posterior part of the DL, with expression reduced in the anterior DL and ceasing further ventral (Fig 3A, 3C, 3D and 3F). In contrast, at E11.5, TFAP2A/TFAP2B expression, while being high throughout the ventral side of the mandibular epithelium, was dramatically reduced after reaching SOX2 positive cells in the DL (Fig 3B and 3H). Further, PITX2 and LEF1 were expressed at the interface of SOX2 and TFAP2A/TFAP2B domains, which in part, coincided with the DL (Fig 3). Specifically, while PITX2 expression covered the entire DL (Fig 3G and 3I), LEF1 expression was restricted to the anterior part of the DL (Figs 3E–3F, and S3J–S3L). Interestingly, at E9.5—and in contrast to E11.5—the expression pattern of SOX2, TFAP2A, TFAP2B and LEF1 had broader overlapping regions within the “naïve” mandibular epithelium (S3 Fig). These findings are consistent with a progressive restriction, or enrichment of expression, of these domain specific or enriched TFs. Indeed, it has been shown that Pitx2 expression is initially broad in the oral cavity [12], contributing to cells eventually found in the non-dental and facial skin epithelium [15], but later becomes highly restricted to the dental epithelium. We found protein expression pattern detected by IF staining (Figs 3 and S3) agreed with mRNA expression detected by LMD-RNA-seq (Fig 2). Additionally, mRNA expression pattern detected by In-situ hybridization (ISH) of selected TFs (Pitx2 and Lef1, S3M–S3O Fig) shows similar expression pattern detected by IF staining (S3J–S3L Fig).
Fig 3. Complementary expression patterns of domain specific transcription factors.

A, B, C) SOX2, TFAP2B and merged immunofluorescent (IF) staining of an E11.5 mouse head sagittal section. C’: higher magnification of the dental lamina region in panel C. D, E, F) SOX2, LEF1 and merged IF staining of an E11.5 mouse head sagittal section. F’: higher magnification of dental lamina region in panel F. G, H, I) PITX2, TFAP2A and merged IF staining of an E11.5 mouse head sagittal section. I’: higher magnification of dental lamina region of I. White arrowheads in all panels point to the dental lamina. Abbreviations: DAPI, DAPI nuclear counterstain; DL, dental lamina; Md, Mandible; Mx, Maxilla. Scale bar = 100 μm.
Correlation between domain specific transcription factors and signaling pathways
In addition to domain specific or enriched TFs, LMD-RNA-seq analyses also identified many signaling pathway genes that correlated with TF-expression patterns. Using LMD-RNA-seq data (Figs 1 and S1) and the KEGG pathway database [42], we constructed a domain expression heatmap of genes belonging to known signaling pathways (S4 Fig). Doing such, we identified that expression of dorsal domain TFs (e.g., Sox2, Foxe1, Foxa1, and Foxa2) correlated with several genes of the SHH-signaling pathway (S4A Fig). For example, consistent with previous studies [10,43,44], Shh expression was restricted to the dorsal side—including the DL—and absent from the ventral side of the E11.5 mandibular epithelium. Additionally, SHH-associated receptors, Ptch1 and Ptch2, and downstream TF, Gli1, were also enriched on the dorsal side of the mandibular epithelium. Interestingly, expression of Gas1, a negative regulator of the SHH pathway, was restricted to the ventral side. In contrast to SHH-pathway components, we identified that expression of ventral domain TFs (e.g., Tfap2a, Tfap2b, Msx1, and Irx4) correlated with several genes of the WNT-signaling pathway (S4B and S4C Fig). For example, the majority of WNT ligands (e.g., Wnt3a, Wnt3, Wnt7a, Wnt9b, Wnt10a and Wnt10b) was restricted to the aboral/ventral side of the E11.5 mandibular epithelium. Even the few WNT ligands whose expression extended more posteriorly (e.g., Wnt6, Wnt4, Wnt7b and Wnt5a) had higher expression in ventral epithelial domains. Interestingly, in addition to ligands expression, we also found high expression of several negative regulators of the WNT pathway (e.g., Axin2, Kremen2, Sostdc1, and Ctnnd2[45]) in ventral domain epithelium. Accordingly, assessemnt of WNT pathway activity via α-LEF1 IF, revealed the highest epithelial enrichment in the anterior part of the DL with a gradual diminishment moving towards ventral epithelium (Fig 3E and 3F). However, in contrast to the ventral epithelium, α-LEF1 signal was highly enriched in the underlying ventral mesenchyme, consistent with the secreted WNT ligands from ventral epithlium inducing WNT pathway activity in the underlying mesenchyme (Fig 3E and 3F). Given that constitutive activation of the WNT pathway in oral and dental epithelium leads to supernumary teeth formation [46–49], we suspect that the negative regulators of the WNT pathway prevent the dental lineage fate in ventral domain epithelium. Interestingly, at E11.5, we found expression of genes indicative of SHH (e.g., Ptch1, Ptch2 and Gli1) and WNT (e.g., Lef1 and Axin2) pathway activity converged at the site of DL formation (S4 Fig). Finally, in addition to SHH and WNT signaling, we found expression of multiple genes in the FGF and BMP pathway that were restricted or enriched in the dental epithelium (e.g., Fgf20, Bmp2, Fgf9, Fgf8, and Id4) (S4D Fig). In sum, similar to TFs, we found complementary expression domains of signaling pathways along the dorsal-ventral axis of the mandibular epithelium, typified by SHH dorsally and WNT ventrally.
Loss-of-function models provide evidence of a mutually restrictive relationship between DL and aboral domain networks
To determine the role of domain specific TFs in mandibular epithelium patterning and DL formation, we next examined two loss-of-function mouse models. First, we examined gene expression changes associated with loss of Pitx2, one of the earliest and most specific markers for the dental epithelium. Here, we utilized a Pitx2 ‘knockout’ (Pitx2 KO) allele [15], which harbors an IRES-Cre knock-in cassette at the Pitx2 locus, preventing protein production. Previous studies have shown that loss of Pitx2 doesn’t affect dental lamina formation but causes tooth development arrest at placode (maxillary teeth) or bud (mandibular teeth) stage with full penetrance [15,16,30,36,50,51]. Consistent with previous reports, we found the localized thickening DL strip formation is presented in Pitx2 KO mice at E11.5 (Figs 4 and S5A–S5F). To assess DL specific gene expression changes upon loss of Pitx2, we next used LMD-RNA-seq to profile the E11.5 DL from both Pitx2 KOs and littermate controls. In both incisor and molar sites, we found that ventral domain specific TFs—including Tfap2a and Tfap2b—were among the top upregulated genes in Pitx2 KOs, while DL specific TFs—including Ascl5 and Zfp536—were among the top downregulated genes (Fig 4A and 4B). Additional ventral domain specific or enriched genes, including WNT ligands (Wnt9b, Wnt3, Wnt7b, and Wnt4) and a WNT inhibitor (Sostdc1), were also significantly upregulated in the DL of Pitx2 KOs. Conversely, DL specific or enriched genes, including FGF ligands (Fgf8 and Fgf20) and EPH receptors (Epha7 and Epha4), were significantly downregulated in Pitx2 KOs. Reduction of Fgf8 in the DL of Pitx2 KOs has been reported in previous studies [15,16,36]. IF staining confirmed that ventral domain specific TF expression, including that of TFAP2A and TFAP2B, was upregulated and expanded dorsally into the DL of Pitx2 KOs (Fig 4C–4J). Thus, loss of a dental epithelium specific TF correlated with a gain of ventral domain specific genes’ expression.
Fig 4. Upregulation of aboral domain specific or enriched genes in the dental lamina of the Pitx2 KO.

A, B) Volcano plots of DEGs comparing the dental lamina at the mesial/incisor site (A) or the distal/molar site (B) of E11.5 Pitx2 KOs with littermate controls. Red dots indicate DEGs with an absolute log2 fold-change larger than 1.0 and a adjusted p value less than 0.01. C-J) TFAP2A (C-F) or TFAP2B (G-J) immunofluorescent (IF) staining of an E11.5 mouse head sagittal section in a control (C, E, G, I) or Pitx2 KO (D, F, H, J). Note, panels E, F, I, and J are the same section as in panels C, D, G, and H, respectively, but include visualization of the DAPI counterstain. White arrowheads in all panels point to the dental lamina. Abbreviations: DAPI, DAPI nuclear counterstain; DL, dental lamina; Md, Mandible. Scale bar = 100 μm.
Next, we examined the early ectodermal (using the CRECT Cre mouse line, driven by a Tfap2a ectodermal specific enhancer [52], which active by ~ E7.5) double knockout of Tfap2a and Tfap2b mouse model (referred to as Tfap2a; Tfap2b EDKO in this study) to determine the effect of removal of an ventral domain specific TFs. Previous analyses of this loss-of-function model found an ectopic incisor (EI) forming on the aboral/ventral side of the mandible [32]. Given that previous analyses of Tfap2a; Tfap2b EDKOs did not include early stages of odontogenesis (e.g., DL formation), we first examined early stages of tooth development in mutants versus controls by histology (Figs 5 and S5G–S5K). We found, at E11.5, an epithelium characteristic of the DL (e.g., thickened multilayer epithelium) expanded ventrally in Tfap2a; Tfap2b EDKOs (Fig 5A and 5B). Subsequently, at E12.5, an ectopic tooth placode formed at the bottom of the aboral/ventral side of the mandible (separated from the normal incisor (I1) placode) in Tfap2a; Tfap2b EDKOs (S5H and S5H’ Fig). Consistent with the previous findings [32], late stage (E14.5-E18.5) H&E and skeletal preparations revealed that in most Tfap2a; Tfap2b EDKOs, this ectopic placode eventually developed into an aboral ectopic incisor. While the ectopic incisor grew with grossly normal morphology and size, the lingual-labial axis of this ectopic incisor was inverted (S5I–S5K and S6 Figs). Thus, histology suggested that in Tfap2a; Tfap2b EDKOs, the ventral domain of the mandibular epithelium, which normally commits to the surface skin lineage, is converted into dental epithelium lineage.
Fig 5. Upregulation of dental lamina specific or enriched genes in the aboral domain of the Tfap2a; Tfap2b EDKO.

A, B) H&E staining of a sagittal section of an E11.5 control and Tfap2a; Tfap2b EDKO head. Black arrowheads point to the multilayered dental lamina, including the ectopic multilayered epithelium found in the aboral domain of the Tfap2a; Tfap2b EDKO in panel B. A’, B’, B”: Higher magnification of dental lamina and ectopic dental lamina in panel A and B. C) Volcano plot of DEGs comparing the aboral epithelium of E11.5 Tfap2a; Tfap2b EDKOs with littermate controls. Red dots indicate DEGs with a absolute log2 fold-change larger than 1.0 and a adjusted p value less than 0.01. D-K) PITX2 (D-G) or SOX2 (H-K) immunofluorescent (IF) staining of an E11.5 mouse head sagittal section in a control (D, F, H, J) or Tfap2a; Tfap2b EDKO (E, G, I, K). Note, panels F, G, J, and K are the same section as panels D, E, H, and I, respectively, but include visualization of the DAPI counterstain. Original and ectopic dental lamina are marked by white arrowheads. Abbreviations: DAPI, DAPI nuclear counterstain; DL, dental lamina; DL*, ectopic dental lamina; Md, Mandible; Mx, Maxilla. Scale bar = 100 μm.
To determine the molecular level changes in Tfap2a; Tfap2b EDKOs, we generated transcriptome profiles of E11.5 ventral epithelium in Tfap2a; Tfap2b EDKOs and littermate controls using LMD-RNA-seq. DEG analysis of RNA-seq data revealed that DL specific or enriched TFs—including Sox2, Foxe1, Pitx2, Pitx1, Nkx2-3, Tbx1 and Isl1—were among the top upregulated genes in the ventral epithelium of Tfap2a; Tfap2b EDKOs (Fig 5C). In contrast, ventral epithelium specific or enriched TFs—including Irx4, Irx3 and Irx5—were among the top downregulated genes in the Tfap2a; Tfap2b EDKOs (Fig 5C). Along with changes of domain specific or enriched TF expression, we also found upregulation of FGF and SHH pathway genes (e.g., Fgf8, Fgf9, Shh, and Ptch2) and downregulation of WNT pathway genes (e.g., Wnt3, Sostdc1, and Wnt9b) in the ventral epithelium of Tfap2a; Tfap2b EDKOs (Fig 5C). Consistent with LMD-RNA-seq analysis, IF staining of two key DL TFs, PITX2 and SOX2, confirmed their ectopic and ventrally expanded expression in the ventral epithelium of Tfap2a; Tfap2b EDKOs (Fig 5D–5K). However, this ventrally expansion of DL specific/enriched genes expression was not observed in either single KOs (S7 Fig). In summary, loss of ventral domain epithelial specific TFs correlated with a gain of DL domain specific genes’ expression.
LMD-RNA-seq analysis of epithelial tissue from Pitx2 KOs and Tfap2a; Tfap2b EDKOs identified that loss of domain specific TFs correlated with upregulation of genetic program defining the reciprocal domain. To further test the nature of the potential cross-repression between PITX2 and TFAP2A/TFAP2B in a more homogenous, tractable system, we utilized a human oral epithelial cell line, GMSM-K cells [53]. Note, GMSM-K cells have robust TFAP2A expression but very low TFAP2B expression (personal communication with Robert Cornell, based on RNA-seq data). First, to determine PITX2’s impact on TFAP2A expression, we transfected GMSM-K cells with either a GFP or PITX2 encoding construct and monitored TFAP2A expression. Compared to un-transfected or GFP transfected control cells, PITX2 transfected cells had a significant reduction in TFAP2A mRNA and protein levels (S8A–S8B Fig). Secondly, to determine TFAP2’s impact on PITX2’s activity, we utilized an in vitro luciferase reporter assay comprised of the Pitx2 promoter driving luciferase expression. Given PITX2 can autoregulate its own promoter [26,28,40], transfection of GMSM-K cells with both the Pitx2 promoter reporter and the PITX2 encoding construct resulted in a significant increase in luciferase activity. However, this activation was significantly decreased in a dose responsive manner upon co-transfection with Tfap2a or Tfap2b (S8C Fig). Collectively, these data highlight the cross-repressive relationship between PITX2 and TFAP2 paralogs.
Communication between epithelium and mesenchyme defines the tooth initiation site and the dorsal-ventral axis of the mandible
The development of teeth is governed by reciprocal interactions between dental epithelium and the underlying neural crest derived mesenchyme. While previous tissue recombination studies have shown that the tooth initiation capacity first resides in the dental epithelium [54–56], odontogenic competent mesenchyme is also a prerequisite for the tooth development [57]. Having delineated the cross-repressive nature of core networks in the overlying mandibular epithelium, we next examined how these networks impinge upon the underlying mesenchyme in both wild-type and loss-of-function models.
First, we applied LMD-RNA-seq in WT embryos to understand positional gene expression patterns in the dental mesenchyme during normal tooth initiation. Specifically, we partitioned the E11.5 WT dental mesenchyme into three parts: lingual/posterior, middle (right under the DL) and labial/anterior mesenchyme (S9A Fig). We found Foxf1 and Foxf2, known SHH downstream readouts [58], were enriched in lingual mesenchyme, while Msx1, Msx2, and Lef1, known BMP and WNT readouts [57,59,60], were enriched in labial mesenchyme (S9A Fig). IF analysis of FOXF1 and LEF1 revealed two complementary domains (e.g., FOXF1 in dorsal part, LEF1 in ventral part) in the E10.5 mandibular mesenchyme (S9B Fig). Moreover, at E11.5, this FOXF1-LEF1 (i.e., SHH-WNT pathway activity) interface persisted and was positioned directly below the DL, with a few cells in the dental mesenchyme expressing both genes (S10A–S10C Fig). This complementary SHH-WNT pathway activity pattern is consistent with the expression of SHH and WNT pathway ligands in the overlying epithelium.
Second, to examine how these mesenchymal domains were impacted upon perturbation of epithelial programs, we next examined SHH and WNT pathway activity in the mesenchyme of Pitx2 KOs and Tfap2a; Tfap2b EDKOs by IF for FOXF1 and LEF1. In E11.5 Pitx2 KOs—associated with an upregulation of TFAP2A/TFAP2B and WNT ligands in the DL (Fig 4)—we found dorsal expansion and upregulation of LEF1 and CTNNB1 (β-catenin), along with a reduction of FOXF1, on the posterior side of the dental mesenchyme (S10D–S10F, and S11C and S11D Figs, arrows in S10F’ and S11D’ Figs), relative to controls (S10A–S10C, and S11A and S11B Figs). Interestingly, we found no significant changes in Shh expression in Pitx2 KOs, measured by LMD-RNA-seq. In contrast to Pitx2 KOs, in E11.5 Tfap2a; Tfap2b EDKOs—associated with a reduction of WNT ligands in the ventral domain epithelium (Fig 5)—we found a reduction of LEF1 in the mandibular mesenchyme (Fig 6B), relative to controls (Fig 6A). Moreover, the LEF1 reduction was associated with an ventral expansion of FOXF1 throughout the E11.5 Tfap2a; Tfap2b EDKO mandibular mesenchyme (Fig 6B), in contrast to FOXF1’s dorsal restriction in controls (Fig 6A). This ectopic expansion of FOXF1 correlated with the ectopic expansion of SHH-pathway components, Shh, Ptch1, and Gli1 in the ventral domain epithelium of Tfap2a; Tfap2b EDKOs (Fig 5C). Thus, epithelial disruption of signaling pathways in loss-of-function models was mirrored by corresponding changes in the mandibular mesenchyme.
Fig 6. Both original and ectopic tooth initiation sites correlate with a mesenchymal SHH-WNT interface.

A-D) IF staining of FOXF1 (red, a readout of SHH pathway activity) and LEF1 (green, a readout of WNT pathway activity) in an E11.5 (A, B) or E12.5 (C, D) control (A, C) or Tfap2a; Tfap2b EDKO (B, D) mouse head sagittal section. The white arrowhead in panels A-D points to the mesenchymal SHH-WNT pathway interface at the site of original incisor formation. The red arrowhead in panels B and D points to the mesenchymal SHH-WNT pathway interface at the site of ectopic incisor formation. E-M) Higher magnification of the site of original incisor formation (E-G) in panel C or of the site of original (H-J) or ectopic (K-M) incisor formation in panel D. Yellow dashed line in panels F, I, and L labels the relative position of the forming dental placode. Abbreviations: DAPI, DAPI nuclear counterstain; EI, ectopic incisor; I1, original incisor; Md: mandible. Scale bar = 100 μm.
Finally, we leveraged our Tfap2a; Tfap2b EDKO model—which presented with the ectopic ventral incisor—to further decipher the importance of these networks in defining tooth placement. Interestingly, despite the broad expansion of PITX2 and SOX2 expression in mutants (Fig 5), we found the ectopic incisor was always located at the bottom of the ventral/aboral side of the mandible (S5G–S5K and S6 Figs). Given the correlation of a SHH-WNT interface at the site of wild-type incisor formation, we predicted that such an interface could define the placement of the ectopic incisor. Because we observed a slight developmental delay of the ectopic incisor in Tfap2a; Tfap2b EDKOs, relative to the normal incisor, we examined FOXF1 and LEF1 expression at E12.5 when the site of ectopic incisor is clearly identifiable. Similar to E11.5 controls (S10A–S10C Fig), in E12.5 controls, FOXF1 and LEF1 expression formed a converging interface underneath the incisor placode (Fig 6C and 6G). Consistent with functional significance of the SHH-WNT interface, in Tfap2a; Tfap2b EDKOs we found a convergence of FOXF1 and LEF1 expression at not only the ‘original’ incisor site (Fig 6H–6J), but the ectopic incisor site as well (Fig 6K–6M). Interestingly, compared to the ‘original’ incisor, the orientation of the FOXF1-LEF1 interface was reversed at the site of the ectopic incisor placode (Fig 6D, 6J and 6M), consistent with the inverted lingual-labial axis of the ectopic incisor (S6 Fig) [61].
Collectively, these results suggest that in Tfap2a; Tfap2b EDKOs the ventral mandibular mesenchyme is converted to a mirrored image of dorsal mesenchyme. Thus, epithelial signaling to the mesenchyme helps establish the dorsal-ventral axis of the mandible. Further, this communication—particularly between SHH and WNT pathways—correlates with the location, and orientation, of tooth development. While correlative, these findings suggest functional significance of this interface in tooth development, consistent with previous reports of their individual roles in such [8,10,58,62–64].
Discussion
In this study, through LMD-RNA-seq, we comprehensively profiled gene expression pattern for different regions of the developing mandible during dental lamina formation. We uncovered a previously unknown molecular mechanism establishing the dorsal-ventral axis of the mouse mandible, which in turn specifies the site of tooth initiation (Fig 7). We identified groups of ‘domain specific’ and ‘domain enriched’ transcription factors and signaling pathway genes that play major roles in coordinating these processes. Specifically, our results identified that Tfap2a and Tfap2b establish the ventral domain epithelium through promoting expression of WNT ligands, resulting in WNT pathway activation in ventral mesenchyme. In contrast, Shh expression is enriched within the dorsal domain epithelium, stimulating SHH activity in the dorsal mesenchyme. Several previous studies have shown the importance of SHH and WNT pathways in tooth development, including: 1) triple KO of foxf1; foxf2a; foxf2b in zebrafish leads to a complete absence of tooth buds [58]; 2) conditional KO of SHH signaling in the mesenchyme leads to disruption of the mandibular oral-aboral axis [10]; 3) double KO of Msx1 and Msx2 leads to tooth development arrest at the DL to placode stage [8,62]; 4) conditional KO of β-catenin (i.e., removal of WNT pathway activity) in the dental mesenchyme leads to tooth development arrest at the cap stage [63] while excessive WNT activity in the mesenchyme also inhibits tooth formation [64]; 5) Constitutively activation of the WNT signaling pathway in dental and oral epithelium (e.g., K14-CreER; Apc cKO model) leads to supernumerary teeth formation [46–49], while over-expression of Lef1 in dental epithelium leads to active cell proliferation and an enlarged & branching incisor’s stem cell compartment [40].
Fig 7. Working model for establishment of the mandibular dorsoventral axis and dental lamina placement.

Gradients of inductive signals—including SHH, FGF, BMP and WNT—establish broad domains of mandibular epithelium by induction of transcription factor expression. Domain specific transcription factors—including PITX2 and TFAP2A/TFAP2B—inhibit each other, refining epithelial domains. Further, domain specific transcription factors feedback on expression of signaling pathway genes. Cumulatively, refined signaling pathways communicate with the underlying mesenchyme to establish the mandibular dorsoventral axis and the site of tooth initiation.
At the interface of SHH and WNT pathways, Pitx2 expression establishes the dental epithelium, in part through forming feedback loop with FGF ligands expression. Further, we identified cross-repression between the domain specific transcription factors Pitx2 and Tfap2a/Tfap2b, which provides molecular explanation for the previously reported tooth development phenotypes: early tooth development arrest in Pitx2 KO mice [15] and ectopic tooth formation in Tfap2a; Tfap2b EDKO mice [32]. We speculate that cross-repression between domain specific transcription factors provides a mechanism to translate broad domains—established by gradients of inductive signal pathways including SHH, FGF, BMP and WNT—into precisely segregated domains within the mandibular epithelium (Fig 7).
Genetic redundancy provided by transcription factor paralogs
While our study identified dorsoventral localized ‘domain specific’ and ‘domain enriched’ TFs within the mandibular epithelium, another key observation in this study was the common co-expression of TF paralogs within domains. For example, Foxa1/Foxa2, Pitx1/Pitx2, Irx3/Irx4/Irx5, Msx1/Msx2, and Tfap2a/Tfap2b have similar, although slightly different, expression pattern in the mandibular epithelium. Along with the technical limitations of previous epithelial CRE lines (i.e., not expressed early enough to target ‘pre-dental lamina’ epithelium), we speculate that the genetic redundancy of co-expressed paralogs has likely contributed to the paucity of loss-of-function models with altered dental lamina formation and disruption of the dorsal-ventral axis of the mouse mandible. Indeed, paralog redundancy may provide robust developmental buffering from the misplacement of teeth—an outcome having potentially devastating consequences in the context of evolutionary survival of jawed vertebrates. The importance of redundancy is specifically highlighted by our Tfap2a; Tfap2b EDKO model. For example, while epithelial loss of either Tfap2a or Tfap2b alone did not impact dental lamina placement or gross tooth development, only with their simultaneous loss did an aboral, ectopic dental lamina and incisor form [32]. Similar studies have yet to be completed for paralogs expressed in other domains and thus the generation of double, or potentially triple, knockout mouse models may be necessary to uncover additional details of these very early steps of dental lamina development. For example, while Pitx2—arguable one of the most well-known dental lamina markers—mutants display tooth bud arrest, the relative development and placement of the dental lamina occurs normally [16]. Likewise, loss of Pitx1, although associated with upper and lower jaw defects, does not grossly impact early tooth development [14,65]. While Pitx1/Pitx2 compound mutants have been generated, an assessment of dental lamina development has yet to be completed, in part, owing to the early embryonic lethality associated with loss of both paralogs [66]. Thus, conditional approaches targeting the epithelium alone, such as we have conducted for Tfap2a and Tfap2b, may be necessary to fully elucidate these networks.
Limitations of current study and considerations for future studies
While our study has uncovered a previously unrecognized competitive intersection of signaling pathways and transcriptional networks driving dental lamina placement and establishing the dorsal-ventral axis of the mouse mandible, several important questions remain. For example, why—despite the shared overlap of several domain specific TFs in dorsal-ventral domains of the incisor and molar epithelium, including aboral expression of Tfap2a and Tfap2b—do Tfap2a; Tfap2b EDKOs not display ectopic molars? While it is possible that the temporal and spatial expression—and thus functional activity of CRE—driven by the ectodermal CRE, CRECT [52], may account for differences in incisor-molar phenotypic outcomes upon recombination, it is also interesting to note that Tfap2c, a third TFAP2 paralog, is also expressed at low levels, potentially providing additional compensation at the site of the molar. Equally plausible is that although core gene sets are shared between incisor and molar sites, enough divergence in networks exist that phenotypic outcomes are distinct between the two sites. Indeed, previous studies have shown genetic differences in the development of subsets of teeth [67]. A thorough assessment of these different possibilities will be required to fully understand how the network identified here applies to molars.
Further, what is the relationship between signaling pathways, core TF expression, and downstream TF output during dental lamina formation? Two major approaches that will be critical in defining these relationships include signaling pathway perturbation and molecular analysis of direct versus indirect effects. First, both genetic and pharmacological manipulation of signaling pathways in vivo or ex vivo will provide crucial insights into the initial establishment of domain specific TFs. Second, direct binding assays (e.g., CUT&RUN analysis) of both downstream outputs of signaling pathways (e.g., ß-catenin, LEF1, phospho-SMAD, etc.) and domain specific TFs (e.g., TFAP2A, TFAP2B, PITX2, SOX2) within relevant tissues (e.g., E10.5 orofacial epithelium) will narrow down key non-coding elements responsible for orchestrating these responses.
Finally, what are the causal mechanisms responsible for converting broad domains established by signaling molecules into sharp and precise boundaries? While our study suggests this is mediated by cross-repression between key groups of TFs, notably TFAP2 and PITX2, these interactions, and their molecular underpinnings, remain to be fully resolved. However, two mechanisms that likely account for this cross-repression include regulation at both transcriptional (i.e., non-coding cis-regulatory elements) and protein levels. In support of the former, we identified a highly conserved cis-regulatory elements near Pitx2 and Fgf8 loci with ATAC-seq data from our previous study [61]. Interestingly, accessibility at these elements negatively correlated with Pitx2 and Fgf8 gene expression and accessibility at these elements are decreased in Tfap2a; Tfap2b EDKO’s, suggesting that Tfap2a/Tfap2b might repress Pitx2 at the transcriptional level (directly, or indirectly through regulation of FGF8). Conversely, in vitro luciferase reporter assays identified that TFAP2 can repress PITX2’s activation of a PITX2 responsive element (S8C Fig). Coupled with TFAP2A: PITX2 co-immunoprecipitation (Co-IP) experiment (S8D Fig), these data are consistent with potential direct protein-protein interaction in mediating repression. Whether similar mechanisms are deployed by PITX2 to counter a TFAP2-induced skin program will require additional studies. Ultimately, determining the molecular mechanisms of the cross-repression between domain specific TFs, including Pitx2 and Tfap2a/Tfap2b, will provide a genetic blueprint for future regenerative strategies.
Materials and methods
Ethics statement
Mouse maintenance and mouse-related procedures were performed following protocols approved by the Institutional Animal Care and Use Committee of the University of Iowa.
Mouse procedures and mouse lines
Embryos were staged by checking for vaginal plugs in the crossed females, with noon on the day a copulatory plug was present denoted as E0.5. Littermate embryos were used when comparing between genotypes. Yolk sacs or tail clips were used for genotyping of embryos. The Pitx2 general knockout line (Pitx2 KO) has been previously described [15,68]. The Tfap2a conditional allele (Tfap2aflox) and Tfap2b conditional allele (Tfap2bflox) have been described previously [61,69–71]. To conditionally knockout Tfap2a and Tfap2b in mandibular epithelium starting around E7.5, we utilized the early ectodermal Cre line, CRECT, which is driven by a Tfap2a intronic ectodermal specific enhancer [52]. To monitor Cre recombination activity, we utilized the Rosa26-mTmG reporter line [72] (Jax Strain #:007576).
Histology, H&E and immunofluorescence staining
Mouse embryos were harvested and washed with ice-cold 1× phosphate-buffered saline (PBS) and fixed with 4% paraformaldehyde in PBS for 4 hours. Samples for LMD-RNA-seq were fixed with methacarn (60% (vol/vol) absolute methanol, 30% chloroform, and 10% glacial acetic acid) for 4 hours. Following fixation, samples were dehydrated through a graded ethanol series, embedded in paraffin and sectioned (7 μm). Standard Hematoxylin and Eosin (H&E) staining was used to examine tissue morphology. For immunohistochemistry and immunofluorescence, sections were incubated in 0.01 M citrate buffer (pH = 6.0) in a 100°C water bath for 20 min or autoclaved in 0.1 M Tris-HCl buffer (pH 9.0) for 5 minutes. Sections were then blocked with 20% donkey serum and incubated with primary antibodies overnight at 4°C. Primary antibodies (αTFAP2A, DSHB, 3B5; αTFAP2B, Santa Cruz, sc-8976, Cell Signaling, 2509; αLEF1, Cell Signaling, 2230; FoxF1, R&D Systems, AF4798; αSOX2, R&D Systems, AF2018, Abcam, ab92494; αPITX1, Novusbio, NBP1-88644; and αPITX2, R&D Systems, AF7388) were diluted in PBS containing 1% donkey serum. Then sections were washed with PBST (0.05% Tween-20 in PBS), incubated with secondary antibodies, and stained with DAPI. Images were captured using a Nikon Eclipse microscope or a Zeiss 700 confocal microscope.
in situ hybridization (ISH)
Mouse embryos were fixed in 4% paraformaldehyde (PFA) at 4°C for 24 hours, dehydrated in 30% sucrose/PBS at 4°C overnight, and cryoembedded in optimal cutting temperature (OCT) embedding medium. 10-μm-thick frozen sections were cut and preserved at -80°C before in situ hybridization. A single molecule fluorescence in situ hybridization method named PLISH was performed as previously described [73] with some modifications [74]. Briefly, frozen sections were post-fixed in cold 4% PFA for 20 minutes, incubated in citrate-based target unmasking solution (Vector laboratories, H-3300, Burlingame, CA) with 0.05% lithium dodecyl sulfate (Sigma, L4632, St. Louis, MO) at 65°C for 30 minutes. The slides were then incubated with freshly prepared 0.05 mg/ml pepsin (Sigma-Aldrich, P6887, St. Louis, MO) in 0.1 M HCl for 10 minutes at 37°C. Next, tissue sections were sequentially incubated with short-paired hybridization probes for Pitx2 and Lef-1 (2 hours), circle and bridge probes (1 hour), T4 DNA ligase mixture (ligation, 2 hours), DNA polymerase mixture (rolling circle amplification, 4 hours), and fluorescence labeling probes (30 minutes). Sections were briefly washed, mounted in anti-fade mounting medium with DAPI (Vector Laboratories, H-1500), and imaged with a 60x/1.42 oil lens using the Olympus FV3000 Confocal Laser Scanning Microscope.
RNA sequences that were targeted by short-paired hybridization probes were:
Mouse Pitx2-1: 5’-CGCGCCGCCGACTCCTCCGTACGTTTATAGGGACACATGT-3’;
Mouse Pitx2-2: 5’-GAAAGACTGAGAATTGTGCTAGAAGGTCGTGCGCACTATG-3’;
Mouse Pitx2-3: 5’-AGGAATGTCCCCAAGTGTCTACGTCTTTCGCTAAGAGTAT-3’;
Mouse Pitx2-4: 5’-CCACAAATGTTTGACTGGATATGACATTTTAACATTACTA-3’;
Mouse Lef1-1: 5’-GTGTGTGTGTAAGTGTGTGTATCGGCCCGAGCTGCGGGCT-3’;
Mouse Lef1-2: 5’-AAGGGAAGGAAAGAAGCTCTAACGCGGACGTCTGCAGCCC-3’;
Mouse Lef1-3: 5’-CAGCCCTGGCAGCCTAGCCTAGTGCACGCGGAGCGGCGTA-3’;
Mouse Lef1-4: 5’-CCCGCAGCGGAGCGGAGATTACACAGCCGCCGGGATGCCC-3’;
Laser Microdissection (LMD) coupled RNA-seq
Laser Microdissection was performed with the Leica LMD7000 Laser Microdissection System. For tissue fixation, Methacarn solution was used. Tissues were then dehydrated through a graded ethanol series, embedded in paraffin wax and sectioned (7 μm). Selected regions of tissue sections were cut at 20× magnification while keeping laser power to a minimum. At least 3 embryos per genotype were used to collect tissues for LMD-RNA-seq. After cells were collected in cap, tubes were spun down quickly and 5 μl of Smart-seq2 lysis buffer (with 0.5% Triton X-100, 5μg Proteinase K and 2 U μl−1 RNase inhibitor) was added, followed by pipetting up and down to mix. Cells were lysed for 1 hour at 60°C. Then samples were treated with 1U DNase I for 30 min. The standard Smart-seq2 protocol was followed for cDNA preparation, Tn5 Tagmentation, and library preparation for next generation sequencing. Quality of cDNA and sequencing libraries were determined using a Bioanalyzer system (Agilent) and real time PCR. The KAPA Library Quantification Kit (Roche) was used for quantification of RNA sequencing libraries.
RNA-seq data analysis
RNA-seq reads were quality checked using the FastQC tool (http://www.bioinformatics.babraham.ac.uk/projects/fastqc). Low-quality and adapter sequences were removed using Trimmomatic [75]. Expression of transcripts was quantified using Salmon [76], and estimates of transcript abundance for gene-level analysis were imported and summarized using the tximport [77] function of the R/Bioconductor software suite [78]. Differentially expressed genes (DEGs) were identified by applying the R/Bioconductor package DeSeq2[33]. To control for variability associated with lowly expressed genes, we further applied the ASHR algorithm [34] to estimate shrunken (conservative) log2 fold-change. We use following threshold to identify DEGs: absolute log2 fold-change larger than 1.0 and adjusted p value less than 0.01. We use Heatmaps were generated with Morpheus (https://software.broadinstitute.org/morpheus).
Cloning, transient transfection, luciferase assay, RT-PCR and western blotting
A 1.6 kilobase (kb) fragment, encompassing the Pitx2 promoter and including an auto-regulatory PITX2-binding site, was cloned and inserted into the pGL4 luciferase reporter vector. A modified sequence- and ligation-independent cloning (SLIC)[79] protocol was used for cloning. GMSM-K[53] cells, a human oral epithelial cell line, were seeded in flasks or plates in Dulbecco’s Modified Eagle’s Medium (DMEM) with 10% fetal bovine serum, and fed at least 24 hours prior to the experiments. GMSM-K cells were transfected with DNA constructs (total 1 μg/well in a 12-well plate) using Lipofectamine 2000 reagent (Invitrogen, 11668019, Calsbad, CA) in Opti-MEM medium (Thermo Fisher Scientific, 31985088, Waltham, MA). At 48 hours post transfection, the activities of Firefly luciferase and β-galactosidase activity were measured using the Luciferase Assay System (Promega, E1500, Madison, WI) and β-galactosidase Assay System (Galacto-Light Plus reagents, Tropix Inc), separately according to the methods previously described [80]. For quantitative real-time RT-PCR, total RNA was isolated using the Trizol reagent (Invitrogen, 15596026, Carlsbad, CA) and reverse transcribed into cDNA using a PrimeScript RT Master Mix (Takara RR036A, Kusatsu, Shiga, Japan). Quantitative real-time RT-PCR analysis was performed using TB Green Premix Ex Taq (Clontech, RR420A, Mountain View, CA) and following primers: ACTB-F:CTCTTCCAGCCTTCCTTC; ACTB-R:ATCTCCTTCTGCATCCTGTC; Hprt-F:CAGTCCCAGCGTCGTGATTA; Hprt-R:GGCCTCCCATCTCCTTCATG; TFAP2A-rtF1,GACCTCTCGATCCACTCCTTAC; TFAP2A-rtR1,GAGACGGCATTGCTGTTGGACT. Statistical differences of numeric parameters between two groups were determined with one-way ANOVA. The statistical analyses were performed in Prism. For western blotting, cells were lysed with a lysis buffer containing 1% of NP-40, 0.1% SDS, 0.25% deoxycholate and protease inhibitors cocktail (Sigma-Aldrich, P8340, St. Louis, MO). Protein concentration was determined by Pierce BCA kit (Thermo Fisher Scientific, 23225, Waltham, MA) and samples were subjected to SDS-polyacrylamide gel electrophoresis. Membranes were immunoblotted with anti-TFAP2A (DSHB, 3B5) at a 1:500 dilution. Signal was detected using the Clarity Western ECL Blotting Substrate (BioRad, Hercules, CA).
Supporting information
A-E) Volcano plot showing pairwise differentially expressed genes (DEGs) analysis of 4 different domains (as shown in Fig 1B) of mouse E11.5 mandibular epithelium along the dorsoventral axis at future incisor site (medial). F) Comparing dental lamina and aboral epithelium at future molar site (lateral) of mouse E11.5 mandibular epithelium. Red dots indicate DEGs with a absolute log2 fold-change larger than 1.0 and a adjusted p value less than 0.01.
(TIF)
A) Expression heatmap of domain specific and domain enriched transcription factors, including those not presented in Fig 2B, along the dorsoventral axis of the E11.5 mandibular epithelium. Rows represent genes, columns represent samples. log2(TPM+1) expression values were used in the heatmap. Abbreviation: TPM, Transcript Per Million.
(TIF)
A, B, C) SOX2, TFAP2B and merged immunofluorescent (IF) staining of an E9.5 mouse head sagittal section. D, E, F) SOX2, LEF1 and merged IF staining of an E9.5 mouse head sagittal section. G, H, I) PITX2, PITX1 and merged IF staining of an E11.5 mouse head sagittal section. J, K, L) PITX2, LEF1 and merged IF staining (protein level) of an E11.5 mouse head sagittal section. M, N, O) Pitx2, Lef1 and merged ISH staining (mRNA level) of an E11.5 mouse head sagittal section. White arrowheads in all panels point to the dental lamina. Abbreviations: DAPI, DAPI nuclear counterstain; DL, dental lamina; Md, Mandible; Mx, Maxilla. Scale bar for panels A-C; 100 μm; Scale bar for panels D-F: 20 μm; Scale bar for panels G-O: 100 μm.
(TIF)
A) Expression heatmap of differentially expressed signaling pathway genes associated with the 4 domains profiled along the dorsoventral axis of the mouse E11.5 mandibular epithelium. Rows represent genes, columns represent samples. log2(TPM+1) expression values were used in the heatmap. Abbreviations: TPM, transcript per million.
(TIF)
A-F) H&E staining of a sagittal section of an E9.5; E11.5; and E12.5 control and Pitx2 KO head. Black dashed lines outline the dental lamina and dental placode. G, H) H&E staining of a sagittal section of an E12.5 control and Tfap2a; Tfap2b EDKO head. H’: Higher magnification of boxed region in panel H. Black dashed lines outline the placode of the first incisor (I1) and ectopic incisor (EI) in Tfap2a; Tfap2b EDKOs. I, J) H&E staining of a sagittal section of an E14.5 control and Tfap2a; Tfap2b EDKO head. I’: Higher magnification of boxed region in panel I. J’: Higher magnification of boxed region in panel J. Black and red dashed lines outline the first incisor (I1) and ectopic incisor (EI), respectively, in Tfap2a; Tfap2b EDKOs. K) A table summarizing the penetrance of the ectopic incisor phenotype in Tfap2a; Tfap2b EDKOs at different developmental stages. H&E refers to visualization by H&E staining of sagittal sections, like in panels G-J, whereas ’skeleton’ refers to visualization by bone and cartilage staining of the craniofacial skeleton. Abbreviations: EI, ectopic incisor; I1, incisor at original site; M, molar; Md, mandible; T, tongue.
(TIF)
A, B) H&E staining of a sagittal section of an E14.5 control and Tfap2a; Tfap2b EDKO mandible. For Tfap2a; Tfap2b EDKO mandible, medial to lateral sections reveal the labial-lingual axis of the ectopic incisor is reversed. Abbreviations: EI, ectopic incisor; I1, incisor at original site. Scale bar = 100 μm.
(TIF)
A-C) SOX2 immunofluorescent staining of an E11.5 mouse head sagittal section in a control; Tfap2a single KO and Tfap2b single KO. D-F) PITX2 immunofluorescent staining of an E11.5 mouse head sagittal section in a control; Tfap2a single KO and Tfap2b single KO. White arrowheads in all panels point to the dental lamina. Abbreviations: DAPI, DAPI nuclear counterstain; DL, dental lamina; Md, Mandible; Mx, Maxilla. Scale bar = 100 μm.
(TIF)
A) TFAP2A mRNA relative expression measured by real-time qPCR in GMSMK cells transfected with GFP or Pitx2 plasmids. B) Western blot of TFAP2A in GMSMK cells transfected with GFP or Pitx2 plasmids. C) Tfap2a repress Pitx2’s activation of Pitx2 promoter in dose responsive manner. D) Western blot of TFAP2A after Co-immunoprecipitation (Co-IP) with PITX2 or IgG antibody in HEK293T cells transfected with the indicated constructs. * means p value less than 0.05; **** means p value less than 0.0001.
(TIF)
A) A volcano plot of DEGs comparing the E11.5 WT mesenchyme on the posterior or anterior side of the dental lamina. Red dots indicate DEGs with a absolute log2 fold-change larger than 1.0 and a adjusted p value less than 0.01. B) FOXF1 (top, red) or LEF1 (middle, green) immunofluorescent (IF) staining of an E10.5 mouse head sagittal section. Note, the bottom panel includes visualization of both channels along with the DAPI counterstain. Abbreviations: 2nd, second brachial arch; DAPI, DAPI nuclear counterstain; DL, dental lamina; Md, Mandible. Scale bar = 100 μm.
(TIF)
A-F) FOXF1 (A, D) or LEF1 (B, E) IF staining of an E11.5 mouse head sagittal section in a control (A-C) or Pitx2 KO (D-F). Note, panels C and F are the same section as in panels A, B or D, E, respectively, but include both channels and visualization of the DAPI counterstain. The white arrowhead in all panels point to the dental lamina. C’ and F’ show higher magnification of the dental lamina from panels C and F. The three white arrowheads highlight the reduction of FOXF1 and upregulation of LEF1 in the posterior dental mesenchyme of Pitx2 KOs (F’), relative to controls (C’). Abbreviations: DAPI, DAPI nuclear counterstain; DL, dental lamina; Md, mandible; Mx, maxillary. Scale bar = 100 μm.
(TIF)
A, C) LEF1 immunofluorescent staining of an E11.5 mouse head sagittal section in a control and Pitx2 KOs. A’, C’: higher magnification of dental lamina region in panel A and C. B, D) CTNNB1 (β-catenin) immunofluorescent staining of an E11.5 mouse head sagittal section in a control and Pitx2 KOs. B’, D’: higher magnification of dental lamina region in panel B and D. Three arrows point to posterior side of the dental mesenchyme.
(TIF)
Columns A-C: domain specific genes for dorsal/posterior domain epithelium; dental lamina; and ventral/aboral domain epithelium. Columns D-F: domain enriched genes for dorsal/posterior domain epithelium; dental lamina; and ventral/aboral domain epithelium.
(XLSX)
Acknowledgments
We are grateful to the Central Microscopy Research Facility (University of Iowa) for providing us training and support of Laser Microdissection experiments. We are grateful to the Iowa Institute of Human Genetics (IIHG) Genomics Division (University of Iowa) for helping us with genomic sequencing. We also thank University of Iowa Research Services for providing High Performance Computing Resources. Figs 1A, 2A and 7 were created with BioRender.com. Additionally, we would like to thank members of the Cao, Van Otterloo, Cornell, Amendt, Liu and Balic laboratories for helpful discussion and suggestions.
Data Availability
RNA sequencing reads files and normalized read counts file have been deposited to the Gene Expression Omnibus (GEO) under accession number GSE249180.
Funding Statement
This study was supported by grants from National Institute of Dental and Craniofacial Research (R21DE029828 and R03DE028354 to HC; R01DE033009 to HC and EVO) and seed grants from University of Iowa College of Dentistry and Dental Clinics (to HC and EVO). The funders had no role in study design, data collection and analysis, decision to publish, or preparation of the manuscript.
References
- 1.Chai Y, Maxson RE Jr. Recent advances in craniofacial morphogenesis. Dev Dyn. 2006;235(9):2353–75. doi: 10.1002/dvdy.20833 . [DOI] [PubMed] [Google Scholar]
- 2.Dixon MJ, Marazita ML, Beaty TH, Murray JC. Cleft lip and palate: understanding genetic and environmental influences. Nat Rev Genet. 2011;12(3):167–78. doi: 10.1038/nrg2933 ; PubMed Central PMCID: PMC3086810. [DOI] [PMC free article] [PubMed] [Google Scholar]
- 3.Trainor PA, Krumlauf R. Hox genes, neural crest cells and branchial arch patterning. Curr Opin Cell Biol. 2001;13(6):698–705. doi: 10.1016/s0955-0674(00)00273-8 . [DOI] [PubMed] [Google Scholar]
- 4.Miyashita T. Fishing for jaws in early vertebrate evolution: a new hypothesis of mandibular confinement. Biol Rev Camb Philos Soc. 2016;91(3):611–57. Epub 20150421. doi: 10.1111/brv.12187 . [DOI] [PubMed] [Google Scholar]
- 5.Minoux M, Rijli FM. Molecular mechanisms of cranial neural crest cell migration and patterning in craniofacial development. Development. 2010;137(16):2605–21. doi: 10.1242/dev.040048 . [DOI] [PubMed] [Google Scholar]
- 6.Minoux M, Holwerda S, Vitobello A, Kitazawa T, Kohler H, Stadler MB, et al. Gene bivalency at Polycomb domains regulates cranial neural crest positional identity. Science. 2017;355(6332). doi: 10.1126/science.aal2913 . [DOI] [PubMed] [Google Scholar]
- 7.Neubüser A, Peters H, Balling R, Martin GR. Antagonistic Interactions between FGF and BMP Signaling Pathways: A Mechanism for Positioning the Sites of Tooth Formation. Cell. 1997;90(2):247–55. doi: 10.1016/s0092-8674(00)80333-5 [DOI] [PubMed] [Google Scholar]
- 8.Bei M, Maas R. FGFs and BMP4 induce both Msx1-independent and Msx1-dependent signaling pathways in early tooth development. Development. 1998;125(21):4325–33. Epub 1998/10/01. doi: 10.1242/dev.125.21.4325 . [DOI] [PubMed] [Google Scholar]
- 9.Liu W, Selever J, Murali D, Sun X, Brugger SM, Ma L, et al. Threshold-specific requirements for Bmp4 in mandibular development. Developmental Biology. 2005;283(2):282–93. doi: 10.1016/j.ydbio.2005.04.019 [DOI] [PubMed] [Google Scholar]
- 10.Xu J, Liu H, Lan Y, Adam M, Clouthier DE, Potter S, et al. Hedgehog signaling patterns the oral-aboral axis of the mandibular arch. eLife. 2019;8:e40315. doi: 10.7554/eLife.40315 [DOI] [PMC free article] [PubMed] [Google Scholar]
- 11.Jernvall J, Thesleff I. Tooth shape formation and tooth renewal: evolving with the same signals. Development. 2012;139(19):3487–97. doi: 10.1242/dev.085084 [DOI] [PubMed] [Google Scholar]
- 12.St.Amand TR, Zhang Y, Semina EV, Zhao X, Hu Y, Nguyen L, et al. Antagonistic Signals between BMP4 and FGF8 Define the Expression of Pitx1 and Pitx2 in Mouse Tooth-Forming Anlage. Developmental Biology. 2000;217(2):323–32. doi: 10.1006/dbio.1999.9547 [DOI] [PubMed] [Google Scholar]
- 13.Stottmann RW, Anderson RM, Klingensmith J. The BMP antagonists Chordin and Noggin have essential but redundant roles in mouse mandibular outgrowth. Dev Biol. 2001;240(2):457–73. Epub 2002/01/11. doi: 10.1006/dbio.2001.0479 . [DOI] [PubMed] [Google Scholar]
- 14.Mitsiadis TA, Drouin J. Deletion of the Pitx1 genomic locus affects mandibular tooth morphogenesis and expression of the Barx1 and Tbx1 genes. Developmental Biology. 2008;313(2):887–96. doi: 10.1016/j.ydbio.2007.10.055 [DOI] [PubMed] [Google Scholar]
- 15.Liu W, Selever J, Lu M-F, Martin JF. Genetic dissection of Pitx2 in craniofacial development uncovers new functions in branchial arch morphogenesis, late aspects of tooth morphogenesis and cell migration. Development. 2003;130(25):6375–85. doi: 10.1242/dev.00849 [DOI] [PubMed] [Google Scholar]
- 16.Lin CR, Kioussi C, O’Connell S, Briata P, Szeto D, Liu F, et al. Pitx2 regulates lung asymmetry, cardiac positioning and pituitary and tooth morphogenesis. Nature. 1999;401(6750):279. doi: 10.1038/45803 [DOI] [PubMed] [Google Scholar]
- 17.Satokata I, Maas R. Msx1 deficient mice exhibit cleft palate and abnormalities of craniofacial and tooth development. Nat Genet. 1994;6(4):348–56. Epub 1994/04/01. doi: 10.1038/ng0494-348 . [DOI] [PubMed] [Google Scholar]
- 18.Mills AA, Zheng B, Wang XJ, Vogel H, Roop DR, Bradley A. p63 is a p53 homologue required for limb and epidermal morphogenesis. Nature. 1999;398(6729):708–13. Epub 1999/05/05. doi: 10.1038/19531 . [DOI] [PubMed] [Google Scholar]
- 19.De Moerlooze L, Spencer-Dene B, Revest JM, Hajihosseini M, Rosewell I, Dickson C. An important role for the IIIb isoform of fibroblast growth factor receptor 2 (FGFR2) in mesenchymal-epithelial signalling during mouse organogenesis. Development. 2000;127(3):483–92. Epub 2000/01/13. doi: 10.1242/dev.127.3.483 . [DOI] [PubMed] [Google Scholar]
- 20.Andl T, Ahn K, Kairo A, Chu EY, Wine-Lee L, Reddy ST, et al. Epithelial Bmpr1a regulates differentiation and proliferation in postnatal hair follicles and is essential for tooth development. Development. 2004;131(10):2257–68. Epub 2004/04/23. doi: 10.1242/dev.01125 . [DOI] [PubMed] [Google Scholar]
- 21.Laurikkala J, Mikkola ML, James M, Tummers M, Mills AA, Thesleff I. p63 regulates multiple signalling pathways required for ectodermal organogenesis and differentiation. Development. 2006;133(8):1553–63. doi: 10.1242/dev.02325 [DOI] [PubMed] [Google Scholar]
- 22.Trumpp A, Depew MJ, Rubenstein JLR, Bishop JM, Martin GR. Cre-mediated gene inactivation demonstrates that FGF8 is required for cell survival and patterning of the first branchial arch. Genes Dev. 1999;13(23):3136–48. doi: 10.1101/gad.13.23.3136 [DOI] [PMC free article] [PubMed] [Google Scholar]
- 23.Peters H, Neubuser A, Kratochwil K, Balling R. Pax9-deficient mice lack pharyngeal pouch derivatives and teeth and exhibit craniofacial and limb abnormalities. Genes Dev. 1998;12(17):2735–47. Epub 1998/09/10. doi: 10.1101/gad.12.17.2735 ; PubMed Central PMCID: PMC317134. [DOI] [PMC free article] [PubMed] [Google Scholar]
- 24.Sasaki T, Ito Y, Xu X, Han J, Bringas P Jr, Maeda T, et al. LEF1 is a critical epithelial survival factor during tooth morphogenesis. Developmental Biology. 2005;278(1):130–43. doi: 10.1016/j.ydbio.2004.10.021 [DOI] [PubMed] [Google Scholar]
- 25.Dassule HR, Lewis P, Bei M, Maas R, McMahon AP. Sonic hedgehog regulates growth and morphogenesis of the tooth. Development. 2000;127(22):4775–85. doi: 10.1242/dev.127.22.4775 [DOI] [PubMed] [Google Scholar]
- 26.Cao H, Florez S, Amen M, Huynh T, Skobe Z, Baldini A, et al. Tbx1 regulates progenitor cell proliferation in the dental epithelium by modulating Pitx2 activation of p21. Dev Biol. 2010;347(2):289–300. Epub 2010/09/08. doi: 10.1016/j.ydbio.2010.08.031 ; PubMed Central PMCID: PMC3334818. [DOI] [PMC free article] [PubMed] [Google Scholar]
- 27.Yu W, Li X, Eliason S, Romero-Bustillos M, Ries RJ, Cao H, et al. Irx1 regulates dental outer enamel epithelial and lung alveolar type II epithelial differentiation. Dev Biol. 2017;429(1):44–55. Epub 2017/07/27. doi: 10.1016/j.ydbio.2017.07.011 ; PubMed Central PMCID: PMC5599132. [DOI] [PMC free article] [PubMed] [Google Scholar]
- 28.Yu W, Sun Z, Sweat Y, Sweat M, Venugopalan SR, Eliason S, et al. Pitx2-Sox2-Lef1 interactions specify progenitor oral/dental epithelial cell signaling centers. Development. 2020;147(11):dev186023. doi: 10.1242/dev.186023 [DOI] [PMC free article] [PubMed] [Google Scholar]
- 29.Bei M. Molecular genetics of tooth development. Current Opinion in Genetics & Development. 2009;19(5):504–10. doi: 10.1016/j.gde.2009.09.002 [DOI] [PMC free article] [PubMed] [Google Scholar]
- 30.Balic A. Cellular and molecular mechanisms regulating tooth initiation: Cellular and molecular mechanisms regulating tooth initiation. STEM CELLS. 2018. doi: 10.1002/stem.2917 [DOI] [PubMed] [Google Scholar]
- 31.Picelli S, Bjorklund AK, Faridani OR, Sagasser S, Winberg G, Sandberg R. Smart-seq2 for sensitive full-length transcriptome profiling in single cells. Nat Methods. 2013;10(11):1096–8. Epub 2013/09/24. doi: 10.1038/nmeth.2639 . [DOI] [PubMed] [Google Scholar]
- 32.Woodruff ED, Gutierrez GC, Van Otterloo E, Williams T, Cohn MJ. Anomalous incisor morphology indicates tissue-specific roles for Tfap2a and Tfap2b in tooth development. Developmental Biology. 2021;472:67–74. doi: 10.1016/j.ydbio.2020.12.017 [DOI] [PMC free article] [PubMed] [Google Scholar]
- 33.Love MI, Huber W, Anders S. Moderated estimation of fold change and dispersion for RNA-seq data with DESeq2. Genome Biol. 2014;15(12):550. Epub 2014/12/18. doi: 10.1186/s13059-014-0550-8 ; PubMed Central PMCID: PMC4302049. [DOI] [PMC free article] [PubMed] [Google Scholar]
- 34.Stephens M. False discovery rates: a new deal. Biostatistics. 2017;18(2):275–94. doi: 10.1093/biostatistics/kxw041 ; PubMed Central PMCID: PMC5379932. [DOI] [PMC free article] [PubMed] [Google Scholar]
- 35.Shen WK, Chen SY, Gan ZQ, Zhang YZ, Yue T, Chen MM, et al. AnimalTFDB 4.0: a comprehensive animal transcription factor database updated with variation and expression annotations. Nucleic Acids Res. 2022. Epub 20221021. doi: 10.1093/nar/gkac907 . [DOI] [PMC free article] [PubMed] [Google Scholar]
- 36.Lu MF, Pressman C, Dyer R, Johnson RL, Martin JF. Function of Rieger syndrome gene in left-right asymmetry and craniofacial development. Nature. 1999;401(6750):276–8. Epub 1999/09/28. doi: 10.1038/45797 . [DOI] [PubMed] [Google Scholar]
- 37.Arnold K, Sarkar A, Yram MA, Polo JM, Bronson R, Sengupta S, et al. Sox2(+) adult stem and progenitor cells are important for tissue regeneration and survival of mice. Cell Stem Cell. 2011;9(4):317–29. Epub 2011/10/11. doi: 10.1016/j.stem.2011.09.001 ; PubMed Central PMCID: PMC3538360. [DOI] [PMC free article] [PubMed] [Google Scholar]
- 38.Juuri E, Saito K, Ahtiainen L, Seidel K, Tummers M, Hochedlinger K, et al. Sox2+ Stem Cells Contribute to All Epithelial Lineages of the Tooth via Sfrp5+ Progenitors. Developmental Cell. 2012;23(2):317–28. doi: 10.1016/j.devcel.2012.05.012 [DOI] [PMC free article] [PubMed] [Google Scholar]
- 39.Juuri E, Jussila M, Seidel K, Holmes S, Wu P, Richman J, et al. Sox2 marks epithelial competence to generate teeth in mammals and reptiles. Development. 2013;140(7):1424–32. doi: 10.1242/dev.089599 [DOI] [PMC free article] [PubMed] [Google Scholar]
- 40.Sun Z, Yu W, Sanz Navarro M, Sweat M, Eliason S, Sharp T, et al. Sox2 and Lef-1 interact with Pitx2 to regulate incisor development and stem cell renewal. Development. 2016;143(22):4115–26. doi: 10.1242/dev.138883 [DOI] [PMC free article] [PubMed] [Google Scholar]
- 41.Caton J, Luder HU, Zoupa M, Bradman M, Bluteau G, Tucker AS, et al. Enamel-free teeth: Tbx1 deletion affects amelogenesis in rodent incisors. Dev Biol. 2009;328(2):493–505. Epub 20090220. doi: 10.1016/j.ydbio.2009.02.014 ; PubMed Central PMCID: PMC2880856. [DOI] [PMC free article] [PubMed] [Google Scholar]
- 42.Kanehisa M, Goto S. KEGG: kyoto encyclopedia of genes and genomes. Nucleic Acids Res. 2000;28(1):27–30. doi: 10.1093/nar/28.1.27 ; PubMed Central PMCID: PMC102409. [DOI] [PMC free article] [PubMed] [Google Scholar]
- 43.Cobourne MT, Miletich I, Sharpe PT. Restriction of sonic hedgehog signalling during early tooth development. Development. 2004;131(12):2875–85. doi: 10.1242/dev.01163 [DOI] [PubMed] [Google Scholar]
- 44.Sarkar L, Cobourne M, Naylor S, Smalley M, Dale T, Sharpe PT. Wnt/Shh interactions regulate ectodermal boundary formation during mammalian tooth development. PNAS. 2000;97(9):4520–4. doi: 10.1073/pnas.97.9.4520 [DOI] [PMC free article] [PubMed] [Google Scholar]
- 45.Turner TN, Sharma K, Oh EC, Liu YP, Collins RL, Sosa MX, et al. Loss of delta-catenin function in severe autism. Nature. 2015;520(7545):51–6. Epub 20150325. doi: 10.1038/nature14186 ; PubMed Central PMCID: PMC4383723. [DOI] [PMC free article] [PubMed] [Google Scholar]
- 46.Wang X-P O’Connell DJ, Lund JJ, Saadi I, Kuraguchi M, Turbe-Doan A, et al. Apc inhibition of Wnt signaling regulates supernumerary tooth formation during embryogenesis and throughout adulthood. Development. 2009;136(11):1939–49. doi: 10.1242/dev.033803 [DOI] [PMC free article] [PubMed] [Google Scholar]
- 47.Zhou N, Li N, Liu J, Wang Y, Gao J, Wu Y, et al. Persistent Wnt/β-catenin signaling in mouse epithelium induces the ectopic Dspp expression in cheek mesenchyme. Organogenesis. 2019;15(1):1–12. doi: 10.1080/15476278.2018.1557026 [DOI] [PMC free article] [PubMed] [Google Scholar]
- 48.Liu F, Chu EY, Watt B, Zhang Y, Gallant NM, Andl T, et al. Wnt/β-catenin signaling directs multiple stages of tooth morphogenesis. Developmental Biology. 2008;313(1):210–24. doi: 10.1016/j.ydbio.2007.10.016 [DOI] [PMC free article] [PubMed] [Google Scholar]
- 49.Järvinen E, Salazar-Ciudad I, Birchmeier W, Taketo MM, Jernvall J, Thesleff I. Continuous tooth generation in mouse is induced by activated epithelial Wnt/β-catenin signaling. PNAS. 2006;103(49):18627–32. doi: 10.1073/pnas.0607289103 [DOI] [PMC free article] [PubMed] [Google Scholar]
- 50.Mucchielli M-L, Mitsiadis TA, Raffo S, Brunet J-F, Proust J-P, Goridis C. MouseOtlx2/RIEGExpression in the Odontogenic Epithelium Precedes Tooth Initiation and Requires Mesenchyme-Derived Signals for Its Maintenance. Developmental Biology. 1997;189(2):275–84. doi: 10.1006/dbio.1997.8672 [DOI] [PubMed] [Google Scholar]
- 51.Thesleff I. Tooth organogenesis and regeneration. StemBook. 2008. doi: 10.3824/stembook.1.37.1 [DOI] [PubMed] [Google Scholar]
- 52.Schock EN, Struve JN, Chang CF, Williams TJ, Snedeker J, Attia AC, et al. A tissue-specific role for intraflagellar transport genes during craniofacial development. PLoS One. 2017;12(3):e0174206. Epub 2017/03/28. doi: 10.1371/journal.pone.0174206 ; PubMed Central PMCID: PMC5367710. [DOI] [PMC free article] [PubMed] [Google Scholar]
- 53.Gilchrist EP, Moyer MP, Shillitoe EJ, Clare N, Murrah VA. Establishment of a human polyclonal oral epithelial cell line. Oral Surg Oral Med Oral Pathol Oral Radiol Endod. 2000;90(3):340–7. Epub 2000/09/13. doi: 10.1067/moe.2000.107360 . [DOI] [PubMed] [Google Scholar]
- 54.Mina M, Kollar EJ. The induction of odontogenesis in non-dental mesenchyme combined with early murine mandibular arch epithelium. Arch Oral Biol. 1987;32(2):123–7. Epub 1987/01/01. doi: 10.1016/0003-9969(87)90055-0 . [DOI] [PubMed] [Google Scholar]
- 55.Lumsden AG. Spatial organization of the epithelium and the role of neural crest cells in the initiation of the mammalian tooth germ. Development. 1988;103 Suppl:155–69. Epub 1988/01/01. doi: 10.1242/dev.103.Supplement.155 . [DOI] [PubMed] [Google Scholar]
- 56.Hu X, Lin C, Shen B, Ruan N, Guan Z, Chen Y, et al. Conserved odontogenic potential in embryonic dental tissues. J Dent Res. 2014;93(5):490–5. Epub 2014/02/21. doi: 10.1177/0022034514523988 . [DOI] [PubMed] [Google Scholar]
- 57.Zhang YD, Zhi C, Song YQ, Chao LIU, Chen YP. Making a tooth: growth factors, transcription factors, and stem cells. Cell research. 2005;15(5):301–16. doi: 10.1038/sj.cr.7290299 [DOI] [PubMed] [Google Scholar]
- 58.Xu P, Balczerski B, Ciozda A, Louie K, Oralova V, Huysseune A, et al. Fox proteins are modular competency factors for facial cartilage and tooth specification. Development. 2018;145(12):dev165498. doi: 10.1242/dev.165498 [DOI] [PMC free article] [PubMed] [Google Scholar]
- 59.Chen Y, Bei M, Woo I, Satokata I, Maas R. Msx1 controls inductive signaling in mammalian tooth morphogenesis. Development. 1996;122(10):3035–44. Epub 1996/10/01. doi: 10.1242/dev.122.10.3035 . [DOI] [PubMed] [Google Scholar]
- 60.O’Connell DJ, Ho JWK, Mammoto T, Turbe-Doan A, O’Connell JT, Haseley PS, et al. A Wnt-Bmp Feedback Circuit Controls Intertissue Signaling Dynamics in Tooth Organogenesis. Sci Signal. 2012;5(206):ra4-ra. doi: 10.1126/scisignal.2002414 [DOI] [PMC free article] [PubMed] [Google Scholar]
- 61.Van Otterloo E, Milanda I, Pike H, Thompson JA, Li H, Jones KL, et al. AP-2alpha and AP-2beta cooperatively function in the craniofacial surface ectoderm to regulate chromatin and gene expression dynamics during facial development. Elife. 2022;11. Epub 2022/03/26. doi: 10.7554/eLife.70511 ; PubMed Central PMCID: PMC9038197. [DOI] [PMC free article] [PubMed] [Google Scholar]
- 62.Chen Y, Zhang Y, Jiang T-X, Barlow AJ, Amand TRS, Hu Y, et al. Conservation of early odontogenic signaling pathways in Aves. PNAS. 2000;97(18):10044–9. doi: 10.1073/pnas.160245097 [DOI] [PMC free article] [PubMed] [Google Scholar]
- 63.Chen J, Lan Y, Baek JA, Gao Y, Jiang R. Wnt/beta-catenin signaling plays an essential role in activation of odontogenic mesenchyme during early tooth development. Dev Biol. 2009;334(1):174–85. Epub 2009/07/28. doi: 10.1016/j.ydbio.2009.07.015 ; PubMed Central PMCID: PMC2752344. [DOI] [PMC free article] [PubMed] [Google Scholar]
- 64.Järvinen E, Shimomura-Kuroki J, Balic A, Jussila M, Thesleff I. Mesenchymal Wnt/β-catenin signaling limits tooth number. Development. 2018;145(4):dev158048. doi: 10.1242/dev.158048 [DOI] [PubMed] [Google Scholar]
- 65.Lanctot C, Moreau A, Chamberland M, Tremblay ML, Drouin J. Hindlimb patterning and mandible development require the Ptx1 gene. Development. 1999;126(9):1805–10. doi: 10.1242/dev.126.9.1805 . [DOI] [PubMed] [Google Scholar]
- 66.Marcil A, Dumontier É, Chamberland M, Camper SA, Drouin J. Pitx1 and Pitx2 are required for development of hindlimb buds. Development. 2003;130(1):45–55. doi: 10.1242/dev.00192 [DOI] [PubMed] [Google Scholar]
- 67.Laugel-Haushalter V, Paschaki M, Thibault-Carpentier C, Dembele D, Dolle P, Bloch-Zupan A. Molars and incisors: show your microarray IDs. BMC Res Notes. 2013;6:113. Epub 20130326. doi: 10.1186/1756-0500-6-113 ; PubMed Central PMCID: PMC3658942. [DOI] [PMC free article] [PubMed] [Google Scholar]
- 68.Cao H, Wang J, Li X, Florez S, Huang Z, Venugopalan SR, et al. MicroRNAs play a critical role in tooth development. J Dent Res. 2010;89(8):779–84. Epub 2010/05/28. doi: 10.1177/0022034510369304 ; PubMed Central PMCID: PMC3014323. [DOI] [PMC free article] [PubMed] [Google Scholar]
- 69.Brewer S, Feng W, Huang J, Sullivan S, Williams T. Wnt1-Cre-mediated deletion of AP-2alpha causes multiple neural crest-related defects. Dev Biol. 2004;267(1):135–52. doi: 10.1016/j.ydbio.2003.10.039 . [DOI] [PubMed] [Google Scholar]
- 70.Martino VB, Sabljic T, Deschamps P, Green RM, Akula M, Peacock E, et al. Conditional deletion of AP-2beta in mouse cranial neural crest results in anterior segment dysgenesis and early-onset glaucoma. Dis Model Mech. 2016;9(8):849–61. Epub 20160623. doi: 10.1242/dmm.025262 ; PubMed Central PMCID: PMC5007979. [DOI] [PMC free article] [PubMed] [Google Scholar]
- 71.Van Otterloo E, Li H, Jones KL, Williams T. AP-2α and AP-2β cooperatively orchestrate homeobox gene expression during branchial arch patterning. Development. 2018;145(2):dev157438. doi: 10.1242/dev.157438 [DOI] [PMC free article] [PubMed] [Google Scholar]
- 72.Muzumdar MD, Tasic B, Miyamichi K, Li L, Luo L. A global double-fluorescent Cre reporter mouse. Genesis. 2007;45(9):593–605. Epub 2007/09/18. doi: 10.1002/dvg.20335 . [DOI] [PubMed] [Google Scholar]
- 73.Nagendran M, Riordan DP, Harbury PB, Desai TJ. Automated cell-type classification in intact tissues by single-cell molecular profiling. Elife. 2018;7. Epub 2018/01/11. doi: 10.7554/eLife.30510 ; PubMed Central PMCID: PMC5802843. [DOI] [PMC free article] [PubMed] [Google Scholar]
- 74.Yu W, Moninger TO, Thurman AL, Xie Y, Jain A, Zarei K, et al. Cellular and molecular architecture of submucosal glands in wild-type and cystic fibrosis pigs. Proc Natl Acad Sci U S A. 2022;119(4). Epub 2022/01/21. doi: 10.1073/pnas.2119759119 ; PubMed Central PMCID: PMC8794846. [DOI] [PMC free article] [PubMed] [Google Scholar]
- 75.Bolger AM, Lohse M, Usadel B. Trimmomatic: a flexible trimmer for Illumina sequence data. Bioinformatics. 2014;30(15):2114–20. Epub 20140401. doi: 10.1093/bioinformatics/btu170 ; PubMed Central PMCID: PMC4103590. [DOI] [PMC free article] [PubMed] [Google Scholar]
- 76.Patro R, Duggal G, Love MI, Irizarry RA, Kingsford C. Salmon provides fast and bias-aware quantification of transcript expression. Nat Methods. 2017;14(4):417–9. Epub 20170306. doi: 10.1038/nmeth.4197 ; PubMed Central PMCID: PMC5600148. [DOI] [PMC free article] [PubMed] [Google Scholar]
- 77.Soneson C, Love MI, Robinson MD. Differential analyses for RNA-seq: transcript-level estimates improve gene-level inferences. F1000Res. 2015;4:1521. Epub 20151230. doi: 10.12688/f1000research.7563.2 ; PubMed Central PMCID: PMC4712774. [DOI] [PMC free article] [PubMed] [Google Scholar]
- 78.Huber W, Carey VJ, Gentleman R, Anders S, Carlson M, Carvalho BS, et al. Orchestrating high-throughput genomic analysis with Bioconductor. Nat Methods. 2015;12(2):115–21. doi: 10.1038/nmeth.3252 ; PubMed Central PMCID: PMC4509590. [DOI] [PMC free article] [PubMed] [Google Scholar]
- 79.Li MZ, Elledge SJ. SLIC: a method for sequence- and ligation-independent cloning. Methods Mol Biol. 2012;852:51–9. doi: 10.1007/978-1-61779-564-0_5 . [DOI] [PubMed] [Google Scholar]
- 80.Cao H, Jheon A, Li X, Sun Z, Wang J, Florez S, et al. The Pitx2:miR-200c/141:noggin pathway regulates Bmp signaling and ameloblast differentiation. Development. 2013;140(16):3348–59. Epub 2013/07/19. doi: 10.1242/dev.089193 ; PubMed Central PMCID: PMC3737717. [DOI] [PMC free article] [PubMed] [Google Scholar]
Associated Data
This section collects any data citations, data availability statements, or supplementary materials included in this article.
Supplementary Materials
A-E) Volcano plot showing pairwise differentially expressed genes (DEGs) analysis of 4 different domains (as shown in Fig 1B) of mouse E11.5 mandibular epithelium along the dorsoventral axis at future incisor site (medial). F) Comparing dental lamina and aboral epithelium at future molar site (lateral) of mouse E11.5 mandibular epithelium. Red dots indicate DEGs with a absolute log2 fold-change larger than 1.0 and a adjusted p value less than 0.01.
(TIF)
A) Expression heatmap of domain specific and domain enriched transcription factors, including those not presented in Fig 2B, along the dorsoventral axis of the E11.5 mandibular epithelium. Rows represent genes, columns represent samples. log2(TPM+1) expression values were used in the heatmap. Abbreviation: TPM, Transcript Per Million.
(TIF)
A, B, C) SOX2, TFAP2B and merged immunofluorescent (IF) staining of an E9.5 mouse head sagittal section. D, E, F) SOX2, LEF1 and merged IF staining of an E9.5 mouse head sagittal section. G, H, I) PITX2, PITX1 and merged IF staining of an E11.5 mouse head sagittal section. J, K, L) PITX2, LEF1 and merged IF staining (protein level) of an E11.5 mouse head sagittal section. M, N, O) Pitx2, Lef1 and merged ISH staining (mRNA level) of an E11.5 mouse head sagittal section. White arrowheads in all panels point to the dental lamina. Abbreviations: DAPI, DAPI nuclear counterstain; DL, dental lamina; Md, Mandible; Mx, Maxilla. Scale bar for panels A-C; 100 μm; Scale bar for panels D-F: 20 μm; Scale bar for panels G-O: 100 μm.
(TIF)
A) Expression heatmap of differentially expressed signaling pathway genes associated with the 4 domains profiled along the dorsoventral axis of the mouse E11.5 mandibular epithelium. Rows represent genes, columns represent samples. log2(TPM+1) expression values were used in the heatmap. Abbreviations: TPM, transcript per million.
(TIF)
A-F) H&E staining of a sagittal section of an E9.5; E11.5; and E12.5 control and Pitx2 KO head. Black dashed lines outline the dental lamina and dental placode. G, H) H&E staining of a sagittal section of an E12.5 control and Tfap2a; Tfap2b EDKO head. H’: Higher magnification of boxed region in panel H. Black dashed lines outline the placode of the first incisor (I1) and ectopic incisor (EI) in Tfap2a; Tfap2b EDKOs. I, J) H&E staining of a sagittal section of an E14.5 control and Tfap2a; Tfap2b EDKO head. I’: Higher magnification of boxed region in panel I. J’: Higher magnification of boxed region in panel J. Black and red dashed lines outline the first incisor (I1) and ectopic incisor (EI), respectively, in Tfap2a; Tfap2b EDKOs. K) A table summarizing the penetrance of the ectopic incisor phenotype in Tfap2a; Tfap2b EDKOs at different developmental stages. H&E refers to visualization by H&E staining of sagittal sections, like in panels G-J, whereas ’skeleton’ refers to visualization by bone and cartilage staining of the craniofacial skeleton. Abbreviations: EI, ectopic incisor; I1, incisor at original site; M, molar; Md, mandible; T, tongue.
(TIF)
A, B) H&E staining of a sagittal section of an E14.5 control and Tfap2a; Tfap2b EDKO mandible. For Tfap2a; Tfap2b EDKO mandible, medial to lateral sections reveal the labial-lingual axis of the ectopic incisor is reversed. Abbreviations: EI, ectopic incisor; I1, incisor at original site. Scale bar = 100 μm.
(TIF)
A-C) SOX2 immunofluorescent staining of an E11.5 mouse head sagittal section in a control; Tfap2a single KO and Tfap2b single KO. D-F) PITX2 immunofluorescent staining of an E11.5 mouse head sagittal section in a control; Tfap2a single KO and Tfap2b single KO. White arrowheads in all panels point to the dental lamina. Abbreviations: DAPI, DAPI nuclear counterstain; DL, dental lamina; Md, Mandible; Mx, Maxilla. Scale bar = 100 μm.
(TIF)
A) TFAP2A mRNA relative expression measured by real-time qPCR in GMSMK cells transfected with GFP or Pitx2 plasmids. B) Western blot of TFAP2A in GMSMK cells transfected with GFP or Pitx2 plasmids. C) Tfap2a repress Pitx2’s activation of Pitx2 promoter in dose responsive manner. D) Western blot of TFAP2A after Co-immunoprecipitation (Co-IP) with PITX2 or IgG antibody in HEK293T cells transfected with the indicated constructs. * means p value less than 0.05; **** means p value less than 0.0001.
(TIF)
A) A volcano plot of DEGs comparing the E11.5 WT mesenchyme on the posterior or anterior side of the dental lamina. Red dots indicate DEGs with a absolute log2 fold-change larger than 1.0 and a adjusted p value less than 0.01. B) FOXF1 (top, red) or LEF1 (middle, green) immunofluorescent (IF) staining of an E10.5 mouse head sagittal section. Note, the bottom panel includes visualization of both channels along with the DAPI counterstain. Abbreviations: 2nd, second brachial arch; DAPI, DAPI nuclear counterstain; DL, dental lamina; Md, Mandible. Scale bar = 100 μm.
(TIF)
A-F) FOXF1 (A, D) or LEF1 (B, E) IF staining of an E11.5 mouse head sagittal section in a control (A-C) or Pitx2 KO (D-F). Note, panels C and F are the same section as in panels A, B or D, E, respectively, but include both channels and visualization of the DAPI counterstain. The white arrowhead in all panels point to the dental lamina. C’ and F’ show higher magnification of the dental lamina from panels C and F. The three white arrowheads highlight the reduction of FOXF1 and upregulation of LEF1 in the posterior dental mesenchyme of Pitx2 KOs (F’), relative to controls (C’). Abbreviations: DAPI, DAPI nuclear counterstain; DL, dental lamina; Md, mandible; Mx, maxillary. Scale bar = 100 μm.
(TIF)
A, C) LEF1 immunofluorescent staining of an E11.5 mouse head sagittal section in a control and Pitx2 KOs. A’, C’: higher magnification of dental lamina region in panel A and C. B, D) CTNNB1 (β-catenin) immunofluorescent staining of an E11.5 mouse head sagittal section in a control and Pitx2 KOs. B’, D’: higher magnification of dental lamina region in panel B and D. Three arrows point to posterior side of the dental mesenchyme.
(TIF)
Columns A-C: domain specific genes for dorsal/posterior domain epithelium; dental lamina; and ventral/aboral domain epithelium. Columns D-F: domain enriched genes for dorsal/posterior domain epithelium; dental lamina; and ventral/aboral domain epithelium.
(XLSX)
Data Availability Statement
RNA sequencing reads files and normalized read counts file have been deposited to the Gene Expression Omnibus (GEO) under accession number GSE249180.