

Abstract
Intense environmental pressures can yield both regressive and constructive traits through complex evolutionary mechanisms. Although regression is well-studied, the biological bases of constructive features are less well understood. Cave-dwelling Astyanax fish harbor prolific extraoral taste buds on their heads, which are absent in conspecific surface-dwellers. Here, we present novel ontogenetic data demonstrating extraoral taste buds appear gradually and late in life history. This appearance is similar but non-identical in different cavefish populations, where patterning has evolved to permit taste bud re-specification across the endoderm-ectoderm germ layer boundary. Quantitative genetic analyses revealed that spatially distinct taste buds on the head are primarily mediated by two different cave-dominant loci. While the precise function of this late expansion on to the head is unknown, the appearance of extraoral taste buds coincides with a dietary shift from live-foods to bat guano, suggesting an adaptive mechanism to detect nutrition in food-starved caves. This work provides fundamental insight to a constructive evolutionary feature, arising late in life history, promising a new window into unresolved features of vertebrate sensory organ development.
Subject terms: Evolutionary developmental biology, Evolutionary genetics
Long-term developmental and genetic studies reveal that extraoral taste buds on the head develop late into life history in different populations of cave-dwelling fish, and are mediated by two principal genetic loci.
Introduction
Understanding the biological underpinnings of adaptation is a central challenge in evolutionary biology. Organisms living under intense environment pressures provide useful models because ecological pressures are often stable1, resulting in recurrent phenotypic change across lineages2. For instance, cave animals living in darkness evolve regressed vision and pigmentation3. While much is known of the biological mechanisms of regression4,5, far less is known of the genetic and biological bases of constructive traits6, including enhanced (non-visual) sensation.
Blind Mexican cavefish (Astyanax mexicanus) demonstrate obvious sensory enhancements to the lateral line7, olfaction8, and taste9. Of these, perhaps least is known of the biological underpinnings of taste expansion. This is because several features of taste are coordinately augmented in cavefish. In the 1940s, a behavioral study showed cavefish respond to extremely low levels of dissolved tastants10 indicating clear perceptual improvements in chemical detection. More recent work indicates perceptual improvements in olfaction enable cave morphs to detect amino acids at much lower concentrations compared to surface morphs11, but how this sensory feature intersects with taste sensation remains unclear. In the 1960s, it was discovered that cave morphs have a dramatically expanded number (and density) of external taste buds on their head and chin12 (Fig. 1). Recent studies identified molecular differences in the expression of signaling molecules in taste buds9, as well as a genomic expansion of the bitter taste receptor (T2R) gene family in cavefish13. It should be noted, however, it is unclear if this genomic expansion was specific to the cave lineages. A recent publication indicates a large T2R gene family is also present in the surface morph genome14, suggesting the expansion preceded cave colonization by surface-dwelling ancestors13.
Fig. 1. Wild populations of the Mexican tetra (Astyanax mexicanus) demonstrate profound differences in extraoral taste bud distribution.

Numerous cave localities across the Sierra de El Abra region of northeastern Mexico (black dots, A) house cavefish populations, many of which are independently derived from surface-dwelling ancestors (A). We examined three populations: surface fish, and cavefish from the Pachón and Tinaja caves (A). Classic work by Schemmel12 depicted the extraoral distribution of taste buds in extant surface- (red dots, B) and Pachón cave-dwelling (red dots, C) individuals. Images adapted from Schemmel12.
Irrespective, it remains unclear what is the precise functional and adaptive relevance of this augmented taste system. The ventral expansion of taste buds along the chin (Fig. 1C) was once believed to influence feeding posture (specifically, a reduced feeding angle) in cavefish—however, two studies found no clear association between posture and taste bud distribution15,16. Taste was also hypothesized to have expanded as a “compensatory” feature for vision loss17. Indeed, experimental studies showed that sonic hedgehog expression couples early eye regression with taste system expansion18, however, this gene does not map to the position of established vision QTL19. Additionally, studies of taste bud development have been limited to the first few weeks post-fertilization20, by which time the extraoral expansion of taste buds to the head and chin has not yet occurred.
Here, we sought to inform the developmental basis of this feature by identifying when during life history extraoral taste buds appear. A classic report depicted the sagittal aspect of extraoral taste buds in adults12 (Fig. 1B, C), however, the temporal component of this patterning has long remained unknown. Catfish have external taste buds covering their entire bodies21,22, which are present by 7 days post-hatching23. Unexpectedly, we discovered that cavefish external taste buds are a prolonged feature that appears well into adulthood. Differences in number and position between cave and surface morphs only first emerge around 5 months post-fertilization. These differences continue to expand between morphotypes through at least 1.5 years post-fertilization.
Clear positional differences in external taste buds between morphotypes enabled us to examine genomic regions associated with this constructive sensory feature. A classical genetic analysis estimated ~10–12 “genetic factors” (i.e., loci) mediate this trait in cavefish from the Pachón locality24, which was reported as having the most extraoral taste buds among Astyanax populations25. Pachón cavefish and surface morphs were bred to generate an F2 hybrid pedigree which demonstrated substantial extraoral taste bud variation. Owing to the spatial complexity of variation, we scored 57 taste bud phenotypes in 129 F2 individuals based on calretinin immunoreactivity (a pan-taste bud marker in poikilotherms26). Our analyses repeatedly converged on two regions of the genome. Both regions lie within deeply conserved syntenic blocks evident across divergent teleost fish genomes.
Collectively this work provides novel insight to the spatiotemporal appearance of extraoral taste buds in two geographically-distinct cavefish populations. While timing of taste bud appearance was comparable for the Pachón and Tinaja cavefish populations, some differences were evident with respect to density and timing of expansion (particularly on the ventral head). These features may signal distinct genetic mechanisms governing the expansion of extraoral taste buds in different cavefish populations, as indicated by Kowalko et al.15. Additionally, unlike catfish, the timing of distributional expansion was protracted and gradual—extending well beyond embryogenesis, into juvenile stages and adulthood. Our genetic analysis approximates the predicted number of genomic regions implicated in taste expansion, as estimated from prior classical analyses. Taken together, this work provides the first insight to the protracted development, and genetic features, of the constructive evolutionary feature of extraoral taste buds.
Results
Developmental studies reveal a robust expansion of taste buds on the dorsal and ventral head of cavefish between 5 and 18 months post-fertilization
Our initial observations revealed few differences between surface fish and cave morphs until about 4 months post-fertilization (“mpf”). Beginning around 5 mpf, apparent differences emerged with respect to the number of taste buds on the head of different populations. The differences, however, were not identical between cave populations. The number and position of taste buds is likely influenced by organismal growth23, therefore we normalized all scores (dorsal and ventral number; dorsal and ventral distance to the furthest taste bud) to the standard length of each individual (Methods). In surface fish, this measure yielded lower scores across the entire assay period from 5 to 18 mpf (Fig. 2). In contrast, scores for cavefish from both populations increased across the assay period, albeit with slightly different trajectories. Pachón and Tinaja cavefish showed nearly identical numerical expansions on the dorsal head from 5 to 9 mpf, however numerical expansion occurred faster in Tinaja cavefish from 9 to 18 mpf (Fig. 2B, C). Single-factor ANOVA tests were significant for all three populations across all timepoints (Supplementary Data). A post-hoc Wilcoxon rank order test revealed that the source of differences at 5 mpf was between the Tinaja and surface populations (Fig. 3). Between 6 and 12 mpf, there were significant differences in both cave populations compared to surface morphs. By the 18 mpf time-period, the most significant differences were evident between all three populations (Fig. 2, 3).
Fig. 2. The dorsal distribution of extraoral taste buds expands significantly in two cave morphs over the course of 18 months.

Representative individuals from each of five juvenile stages are depicted from the dorsal aspect. The distribution of taste buds is indicated by red dots, revealing positional differences between surface fish (A), Pachón cavefish (B), and Tinaja cavefish (C). While both Tinaja and Pachón cavefish demonstrate an expanded domain of taste buds, the nature of the distribution is qualitatively different. Scale = 1 mm.
Fig. 3. Quantifying dorsal head taste bud numbers and distribution reveals the expansion of extraoral taste buds over life history in two cavefish populations compared to surface-dwelling fish.

The mean number of taste buds (corrected for body size) in Pachón cavefish (orange) and Tinaja cavefish (gray) differs significantly from surface fish (blue) between 5 and 18 months post-fertilization (A). When considering the distance of the furthest extraoral taste buds from the mouth (B), cavefish show a substantial difference in the mean distance beginning around 6 months in Tinaja cavefish (gray, B), and 9 months of development in Pachón cavefish (orange, B) compared to surface fish (blue, B). Timeline represents key features of life history including the first notable differences in oral taste bud numbers between cave and surface morphs (~22 dpf; left), and post-breeding adults (right). A sample size of n = 6 was used for each population at all five-time points.
On the ventral head, surface fish taste buds showed a similar pattern to the dorsal head—trending far lower compared to cave morphs across the entire assay period (Fig. 4). By 5 mpf, Pachón, and Tinaja cavefish had similar numbers of extraoral taste buds—and both were significantly higher compared to surface fish. The ventral expansion of taste buds was highly similar between both cavefish populations through the remaining assay period to 18 mpf (Figs. 4, 5). The ventral expansions of taste buds differed both qualitatively and quantitatively, compared to dorsal expansions, between Pachón and Tinaja (Fig. 4B, C). For instance, normalized taste bud scores on the ventral head of Pachón cavefish exceeded those of the dorsal head (Fig. 5A). However, the same scores were lower on the ventral head of Tinaja cavefish compared to the dorsal aspect (Fig. 5A). Single-factor ANOVA tests revealed highly significant group level differences for ventral taste bud numbers across populations at all six timepoints (Fig. 5). Post-hoc Wilcoxon analyses revealed that the cave populations did not differ significantly, however, both cave populations significantly differed from surface morphs across all time points (Figs. 4, 5).
Fig. 4. The ventral distribution of extraoral taste buds expands significantly in two cave morphs over the course of 18 months.

Representative individuals from five juvenile stages are depicted from the ventral aspect. Ventral extraoral taste buds are indicated by red dots, showing clear positional differences between surface fish (A), Pachón cavefish (B), and Tinaja cavefish (C). Both cavefish populations harbor a distribution of taste buds that is far more prolific compared to surface morphs. Scale = 1 mm.
Fig. 5. Quantifying ventral head taste bud numbers and distribution reveals the expansion of extraoral taste buds over life history in two cavefish populations compared to surface-dwelling fish.
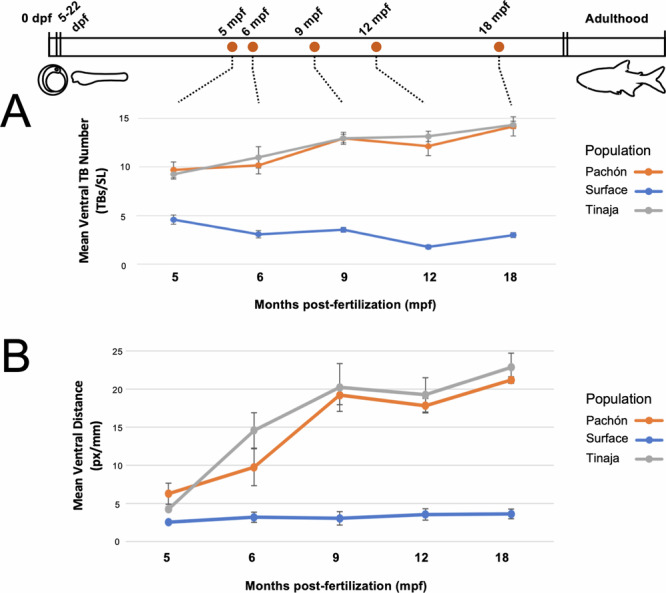
The mean number of taste buds (corrected for body size) in Pachón cavefish (orange) and Tinaja cavefish (gray) are virtually the same, but differing significantly from surface fish (blue), across the entire assay period of 5–18 mpf (A). When considering the distance of the furthest extraoral taste buds from the mouth (B), cavefish show a substantial difference in the mean distance beginning around 6 months in both Tinaja (gray, B), and Pachón cavefish (orange, B) compared to surface fish (blue, B). Timeline represents key features of life history (see Fig. 3). A sample size of n = 6 was used for each population at all five-time points.
Surface morphs do not demonstrate dispersion of taste buds
To examine dispersion of taste buds on the head, we scored the distance from the oral cavity to the most distal taste bud in both dorsal and ventral aspects. As with our numerical analysis, this distance was normalized to the standard length to control for allometric differences. Single-factor ANOVA tests revealed highly significant group level differences for dorsal dispersion in populations across development (Supplementary Data). Post-hoc Wilcoxon analyses revealed that these indices of dorsal dispersion did not differ significantly among any population at the first two time-points (5 mpf and 6 mpf). The first differences appeared to emerge between 9 and 18 mpf. Both cavefish populations followed a very similar trajectory, collectively departing significantly from surface morphs (Fig. 3B). This may indicate that 9–18 mpf represents a critical period during which the dorsal field of taste buds is expanded.
Ventral dispersion showed a similar pattern of distributional expansion. The results of our ANOVA tests showed marginally significant differences among groups at 5 mpf (Supplementary Data), but highly significant differences at all remaining time points (Fig. 5B). Post-hoc Wilcoxon analyses revealed that cavefish populations were statistically very similar, and quite distinct from surface morphs, with the exception of 6 mpf. At this stage, Pachón cavefish did not differ statistically from surface populations (Fig. 5B). Collectively, this suggests that ventral expansion commences earlier than the dorsal dispersion of extraoral taste buds.
We performed a Delauney Triangulation analysis (see Methods), to quantitatively compare the extent to which the distributions of taste buds differ in their clustering. Overall, we found that there were differences in clustering of extraoral taste buds early on the dorsal head at 6mpf (F = 6.73; p = 0.008; see Supplementary Data). In contrast, we found significant ventral head differences in clustering of taste buds between populations at 6mpf (F = 19.21; p = 7.28 × 10⁻³), 12 mpf (F = 17.93; p = 1.05 × 10⁻⁴) and 18 mpf (F = 6.30; p = 0.010; Supplementary Data). All other time points were insignificant in our Delauney analyses. This analysis revealed that certain time points differed significantly with respect the numerical or distance variation in extraoral taste buds, but did not differ with respect to clustering. We feel this suggests that even if the numbers of extraoral taste buds differ between populations at a given time point, they may not necessarily differ with respect to how the taste buds are clustered on the head. We note that clustering was more often associated with taste buds present on the ventral head. Interestingly, Wilkens24 also reported substantial variation in density of extraoral taste buds on the ventral head20, however at present the biological basis for this feature remains unknown6.
Genetic analyses reveal the complex genetic architecture of taste bud expansion in cavefish
Based on the robust differences in extraoral taste buds in adult Astyanax morphotypes, we performed a genetic analysis of this trait. Owing to their broad distribution, we examined several metrics of extraoral taste buds in an experimental surface x cavefish F2 pedigree. Individuals from this pedigree recapitulated dorsal and ventral taste bud variation ranging from “surface-like” to “cave-like” (Fig. 6). In total, 57 phenotypic measures were assessed across four anatomical aspects of the head: dorsal, right (lateral), left (lateral) and ventral. All scores were collected from high-resolution montage imaging of each individual, which limited inaccurate scoring due to edge effects and z-plane differences (see Methods). The dorsal aspect was the most consistent regionally, and therefore only a single phenotypic category was scored for this region (i.e., numerical variation of taste buds; Fig. 7; Table 1).
Fig. 6. Members of an F2 hybrid pedigree demonstrate the scope of variation in external taste bud distribution across cave and surface morphs.

The observed variation in dorsal taste buds stretched from “surface-like” (e.g., Asty66-56) to “cave-like” (Asty66-32) distributions, with a broad range of intermediate variation (A). A similar range of variation was observed for the ventral aspect of the head of F2 individuals, wherein some individuals showed more modest “surface-like” (Asty66-82) patterns, while others were more “cave-like” (Asty66-32), with a broad range of intermediate variation (B).
Fig. 7. One genetic marker is recurrently associated with extraoral taste buds on the dorsal head. Scoring of eight anatomical zones of the head (red; dorsal, RLtotal, RL1, RL2, RL3, RL4, LLTotal, LL1) yielded 17 significant QTL.

These QTL were identified based on variation in these regions for numerical variation (n = 9), area of distribution (n = 7), and density (n = 1). One genomic marker, TP75903 (bold; located on linkage group 7), was recurrently identified eight times across the dorsal, right and left lateral aspects of the head. The polarity of effect plots show the majority of these QTL are associated with higher phenotypic values in the homozygous cave (“CC”) condition (see key; blue dots).
Table 1.
Summary of 34 significant QTL associated with peripheral expansion of extraoral taste buds in Astyanax cavefish
| Aspect | Zone | LG | Phenotype | Peak Marker (Pseudomarker) | LOD Value | LOD Significance Threshold | Phenotypic polarity |
|---|---|---|---|---|---|---|---|
| Dorsal | Dorsal | 7 | Number | TP75903 (c7.loc44) | 5.42 | 4.05 | Cave dominant |
| Right Lateral | RL_Total_Number (RL Total) | 7 | Number | TP75903 (c7.loc44) | 4.09 | 3.94 | Cave dominant |
| RL_Total_Number | 15 | Number | TP23620 (c15.loc28) | 5.51 | 3.94 | Cave dominant | |
| RL_Total_Area | 7 | Area | TP75903 (c7.loc43) | 4.26 | 4.05 | Cave dominant | |
| RL_Total_Area | 15 | Area | TP67133 (c15.loc22) | 4.43 | 4.05 | Cave dominant | |
| RL_Zone_1 (RL1) | 7 | Number | TP75903 (c7.loc44) | 5.16 | 3.94 | Cave dominant | |
| RL_Zone_1 | 15 | Number | TP52027 | 4.11 | 3.94 | Cave dominant | |
| RL_Zone_2 (RL2) | 15 | Number | TP23620 (c15.loc28) | 5.45 | 3.89 | Cave dominant | |
| RL_Zone_3_Area (RL3) | 9 | Area | TP38511 | 5.34 | 4.03 | Het dominant | |
| RL_Zone_4 (RL4) | 15 | Number | TP90156 (c15.loc8) | 4.32 | 3.95 | Cave dominant | |
| RL_Zone_4_Area | 15 | Area | TP90156 (c15.loc8) | 4.74 | 4.03 | Cave dominant | |
| RL_Zone_4_Area | 24 | Area | TP63839 | 4.17 | 4.03 | Het dominant | |
| RL_Z4_TB/Area | 23 | Density | TP38583 | 4.02 | 3.99 | Cave dominant | |
| Left Lateral | LL_Total_Number (LLTotal) | 7 | Number | TP75903 (c7.loc44) | 4.72 | 4.05 | Cave dominant |
| LL_Total_Area | 7 | Area | TP75903 (c7.loc44) | 4.26 | 3.95 | Cave dominant | |
| LL_Zone_1 (LL1) | 7 | Number | TP75903 (c7.loc44) | 6.03 | 3.96 | Cave dominant | |
| LL_Zone_1_Area | 7 | Area | TP75903 (c7.loc44) | 4.11 | 3.94 | Cave dominant | |
| Ventral | V_Total_TB (VTotal) | 15 | Number | TP23620 | 6.83 | 4.52 | Cave dominant |
| V_Total_Area | 15 | Area | TP23620 | 6.94 | 4.54 | Cave dominant | |
| V_Z1 (V1) | 15 | Number | TP23620 (c15.loc28) | 4.34 | 3.99 | Cave dominant | |
| V_Z1_Area | 15 | Area | TP67133 (c15.loc22) | 4.96 | 4.00 | Cave dominant | |
| V_Total_Z2 (V2Total) | 15 | Number | TP44378 (c15.loc29) | 5.91 | 4.54 | Cave dominant | |
| V_Total_Z2_Area | 15 | Area | TP23620 | 7.2 | 4.46 | Cave dominant | |
| V_Z2/Area_2 | 12 | Density | TP41258 (c12.loc57) | 4.66 | 4.08 | Het dominant | |
| V_Total_Z3 (V3Total) | 15 | Number | TP23620 (c15.loc28) | 5.56 | 3.98 | Cave dominant | |
| V_Total_Z3_Area | 15 | Area | TP23620 (c15.loc28) | 4.22 | 4.00 | Cave dominant | |
| V_R_Z2 (VR2) | 15 | Number | TP44378 (c15.loc29) | 5.27 | 4.44 | Cave dominant | |
| V_R_Z2_Area | 7 | Area | TP27793 | 5.03 | 4.49 | Cave dominant | |
| V_R_Z2_Area | 15 | Area | TP23620 | 6.42 | 4.49 | Cave dominant | |
| V_R_Z3 (VR3) | 15 | Number | TP23620 (c15.loc28) | 5.06 | 3.99 | Cave dominant | |
| V_L_Z2 (VL2) | 15 | Number | TP44378 (c15.loc29) | 5.63 | 4.52 | Cave dominant | |
| V_L_Z2_Area | 15 | Area | TP23620 | 6.57 | 4.46 | Cave dominant | |
| V_L_Z2_Density | 12 | Density | TP2957 | 4.72 | 4.03 | Het dominant | |
| V_L_Z3 (VL3) | 15 | Number | TP23620 (c15.loc28) | 4.55 | 4.01 | Cave dominant |
The remaining three anatomical aspects showed substantial regional variation, requiring separation into multiple zones. The right (lateral) aspect was examined in four individual zones (1–4), each of which were scored separately as discrete zones anatomically situated from dorsal to ventral, respectively (Fig. 7). These zones collectively covered the entire right lateral aspect, enabling a comprehensive examination of taste buds in this anatomical region. Accordingly, summed scores for each zone provided total values for number and area. Zones were assessed for numerical variation (i.e., raw counts) and the calculated area within which taste buds were distributed. A derivative measure of these scores, density, was calculated as the number of taste buds per unit area. Of the 15 phenotypes scored for the right (lateral) region, five phenotypes returned twelve significant QTL with LOD values exceeding our significance threshold (p > 0.05, 1000 permutations; Table 1). The five phenotypes that yielded significant QTL were “RL Total” (i.e., taste buds on the right lateral head), as well as those of all four constituent zones 1–4 (RL1–RL4; Fig. 7; Table 1). Six of the significant QTL were linked to numerical variation of taste buds, five QTL were associated with variation in the area encompassing taste buds, and one QTL was associated with density of taste buds within zone 4 (Table 1).
The left (lateral) aspect was similarly scored for taste bud numbers, areas within which taste buds were found, and density. QTL were detected using three algorithms: Expectation-Maximization (EM), Haley-Knott (HK), and Marker Regression (MR), as previously described27. Significance thresholds were calculated (alpha = 0.5, 0.1) based on 1000 permutations for each phenotype28–30. Interestingly, although the same number of phenotypes were examined as for the right lateral aspect, fewer significant associations were detected. At present it is unclear if this feature reflects a lateral asymmetry in extraoral taste buds in Astyanax cavefish, as has been shown for cranial features27,31 and swimming preference32,33. Of the 15 phenotypic scores examined for the left (lateral) region, only two phenotypes yielded four significant QTL (Fig. 7; Table 1). The two phenotypes yielding significant QTL were “LL Total” (i.e., taste buds on the left lateral head) and those of constituent zone 1 (LL1; Fig. 7). Two of the four significant QTL were linked to numerical variation of taste buds, while the other two QTL were associated with variation in the area harboring taste buds (Table 1).
In the ventral aspect, of 24 phenotypic zones scored we detected 17 significant QTL in eight phenotypic zones (Fig. 8). The eight phenotypic zones included “V Total” (i.e., taste buds on the entire ventral region), as well as those of constituent ventral zones 1–3 (i.e., VZ1–VZ3; Table 1). We note that zones VZ2 and VZ3 were subdivided into left and right domains (e.g., V_R_Z2 represents scores on the right domain of ventral zone 2, see Fig. 8; Table 1). Of the 17 significant QTL identified on the ventral head, eight were associated with numerical variation of taste buds, seven were associated with the area encompassing taste buds, and two were associated with the density of taste buds in a given zone (Table 1).
Fig. 8. One genetic marker is recurrently associated with extraoral taste buds on the dorsal head. Scoring of eight anatomical zones of the head (red; VTotal, V1, V2Total, V3Total, VR2, VR3, VL2, VL3) yielded 17 significant QTL.

These QTL were identified based on variation in these regions for numerical variation (n = 8), area of distribution (n = 7), and density (n = 2). One genomic marker, TP23620 (bold; located on linkage group 15), was recurrently identified ten times on the ventral aspect of the head. The polarity of effect plots show the majority of these QTL are associated with higher phenotypic values in the homozygous cave (“CC”) condition (see key; blue dots).
In sum, we examined 57 phenotypes distributed across the dorsal, lateral, and ventral heads of members of an experimental F2 pedigree. Of these, we discovered 34 QTL associated with 16 phenotypes. Intriguingly, the 34 QTL were inclusive of only 12 distinct peak markers (Supplementary Fig. 1C). In other words, many of the same loci were repeatedly detected in our analysis. Two markers neighbor one another (7486 bp apart) on the latest draft genome. Based on this analysis, we conclude that extraoral taste bud expansion is a polygenic trait that evolved through 11 different regions of the genome.
Two genomic markers are associated with the majority of extraoral taste bud expansion on the dorsal and ventral head
Despite independently scoring 57 phenotypes, numerous anatomical regions, and subregions, two genomic regions were repeatedly detected. The most common QTL marker was TP23620 (Fig. 8, bold), a marker developed from genotyping-by-sequencing analyses34. This marker resides on linkage group 15 and yielded a significant QTL for 12 phenotypic scores (35% of significant QTL associations; Table 1). The second most commonly detected QTL marker was TP75903 (Fig. 7, bold), on linkage group 7, which yielded eight significant QTL (24% of the significant QTL associations). Of note, the third most commonly detected marker, TP44378 (associated with three significant QTL), directly neighbors TP23620 on our linkage map (see above). These two markers collectively accounted for 44% of the detected loci in this study, suggesting this genomic region on linkage group 15 harbors an essential genetic element associated with evolutionary expansion of taste in cavefish. Of the nine remaining loci detected in our analysis, only two markers were detected more than once: TP67133 and TP90156, both of which were detected twice.
Interestingly, the two primary genomic regions identified by our analysis demonstrate phenotypic regionality. Neighboring markers TP23620 and TP44378 (on linkage group 15) were associated with ventral extraoral taste bud phenotypes in 13 of 15 associations (~87% of the ventral head QTL; Table 1). The other two QTL associated with these markers were associated with right lateral distributions of taste buds. In contrast, marker TP75903 on linkage group 7 was strictly associated with dorsal, right lateral and left lateral taste bud phenotypes (Table 1). This suggests that different (but partially overlapping) genomic regions are associated with the expansion of extraoral taste buds on the dorsal and ventral cavefish head, respectively.
The two loci principally associated with ventral taste buds, TP23620 and TP44378, were detected by phenotypic scoring of both the number of taste buds (~62%), and the area of taste bud distributions (~38%; Table 1). Similarly, the most common locus associated with dorsal and lateral taste buds scores (TP75903) was detected by scoring taste bud number (~63%) and distributional area populated by taste buds (~37%; Table 1). Since the same marker was identified from two discrete metrics (i.e., numerical counts, and distributional area), this suggests they may be associated with the mechanism by which extraoral taste buds are developmentally patterned. Specifically, the genomic regions we identified harbor allelic changes in cavefish capable of expanding both taste bud numbers and the domain in which taste buds are found (i.e., area). Among the 34 significant QTL detected in this study (Supplementary Fig. 1D), 50% were identified based on scoring taste bud numbers (n = 17). For the remaining significant loci, 14 were identified based on variation in distributional area (~41%), and only 3 were identified based on variation in density (~9%).
Phenotypic effect studies reveal constructive taste evolution evolves principally through cave-associated alleles
We next examined the phenotypic polarity of peak QTL markers associated with extraoral taste buds. For every significant QTL we detected, the homozygous cave condition (i.e., “CC”) was associated with higher phenotypic values compared to the homozygous surface condition (i.e., “SS”; Supplementary Fig. 1C, D). In only four instances, the heterozygous condition (i.e., “CS”) was marginally higher than the homozygous cave condition (i.e., modest overdominance). Prior studies showed eye and lens regression occurs uniformly through cave alleles associated with smaller visual structures19. Accordingly, the homozygous surface condition was always associated with larger eyes (Supplementary Fig. 1A, n = 12 loci; Protas et al.19). In the same study, a pigmentation-associated trait (numerical variation of pigment-producing melanophores) yielded mixed phenotypic polarities. For eight loci, the homozygous surface condition was associated with more melanophores. For four loci, however, the homozygous cave condition was associated with more melanophores (Supplementary Fig. 1B; n = 12 loci19).
Here, we found that the homozygous cave condition (“CC”) in cavefish is associated with more taste buds in the vast majority of taste bud QTL. This finding holds if considering only unique genetic markers (i.e., 12 different peak associated markers; Supplementary Fig. 1C) for which eight are cave-dominant and four show marginal overdominance. When considering all peak QTL (n = 34) inclusive of repeatedly identified markers (Supplementary Fig. 1D), 30 of 34 markers show a cave-dominant polarity. Phenotypic effects demonstrating the association of cave alleles with more taste buds are illustrated in the dorsal (Supplementary Fig. 1E), right lateral (Supplementary Fig. 1F), left lateral (Supplementary Fig. 1G), and ventral (Supplementary Fig. 1H) aspects of the head for two key markers (TP75903 and TP23620; Supplementary Fig. 1). We acknowledge that in some cases, the variation in phenotype observed for surface homozygous genotypes (“SS”), e.g., dorsal taste bud numbers (Supplementary Fig. 1E) are high (e.g., TP75903). Because taste bud number is likely a complex, polygenic trait, we attribute this observation to the likely participation of other loci, or perhaps environmental features, in the individual phenotypes of certain hybrid individuals. Nevertheless, these empirical results are underpinned by the statistical significance of each QTL (see Table 1). Thus, numerical and distributional expansion of taste buds represents a constructive evolutionary trait demonstrating clear phenotypic polarities for which cave alleles are associated with extraoral taste bud expansion.
The two principal genomic regions associated with extraoral taste bud expansion reside within highly conserved syntenic blocks shared between Astyanax and Danio
The heritable and causative genetic lesion(s) underlying taste bud QTL are currently unknown. We sought to identify candidate genes influencing these traits using the NCBI Comparative Genome Browser (Methods), by estimating critical regions for the two most common QTL detected in our analysis. Within both genomic intervals, we found that the positions and order of orthologous genes between Astyanax and zebrafish were highly syntenic (i.e., conserved in lineal position; see blue lines, Fig. 9C, D). The first genomic marker, TP23630, associated with ventral distributions of extraoral taste buds resides on linkage group 15 in our linkage map34. In the surface fish genome, this marker resides on chromosome 13 at position 3072485 (red asterisk, Fig. 9A). Interestingly, the adjacent marker on our linkage map, TP44378, is ~7.4 kb away from TP23630 in the surface fish genome, providing confirmation that linkage map construction correctly placed the relative positions of these two neighboring markers. Both markers are nested within a ~609 kb syntenic block shared with the zebrafish genome, on chromosome 23 (red asterisk, Fig. 9A), extending from the gene lrp1ab (13:2691483) to the gene arhgap4a (13:3268161; Fig. 9C).
Fig. 9. The Astyanax reference genome reveals genes within the critical interval of two principal QTL mediating taste bud evolution.

Dorsal and lateral head extraoral taste buds linked to the genomic marker TP75903 reside on linkage group 7. This marker is present on Astyanax chromosome 2 (asterisks; A), nested within a syntenic block (blue lines; A, C) shared with zebrafish (Danio rerio) chromosome 4. Genes within this interval include tnnl4a and cald1a. Ventral extraoral taste buds linked to the genomic marker TP23620 (and neighboring TP44738) reside on linkage group 15. This marker is present on Astyanax chromosome 13 (asterisks; B), nested within a syntenic block (blue lines; B, D) shared with zebrafish (Danio rerio) chromosome 23. Genes within this interval include lrp1ab, fmnl3, esyt1a, pa2g4b, erbb3b, wnk3, fam3a, idh3g, avpr2aa, and arhgap4a. Images adapted using the Comparative Genome Viewer tool (NCBI, NIH).
The second genomic marker, TP75903, which was associated with dorsal and lateral head distributions of taste buds resides on linkage group 7 in our GBS-based linkage map34. In the reference surface fish genome, this marker resides on chromosome 2 at position 12860395 (red asterisk, Fig. 9B). We discovered that this marker resides within a ~422 kb syntenic block shared with the zebrafish genome. This critical region extends from the gene cald1a (2:12605416) through the GBS marker TP62041 (2:13028050), with the syntenic region in zebrafish residing on chromosome 4 (Fig. 9D).
Interestingly, when we profiled the genes within each interval, we did not find substantive coding sequence alterations with predicted functional impacts. Coding sequence alterations, however, may not govern the evolved differences in cavefish taste bud development. Indeed, the protracted development associated with extraoral taste buds in cavefish may more likely be attributed to cis-regulatory alterations. Based on previously reported functions in the literature, we identified no candidate genes in the genetic interval surrounding marker TP75903 (Fig. 9D). In the genetic interval surrounding markers TP44378 and TP23620, we identified only one candidate gene, erbb3bb, with a putative role in taste bud formation. In rodents, the gene erbb3b (an orthologue to the teleost form of this gene) encodes a tyrosine kinase receptor, which is expressed in developing and adult taste papillae and taste buds33. Intriguingly this gene is expressed around the basal papillae early in development, and is found later in development in differentiated taste cells within taste buds, suggesting it plays a role in both the initiation and maintenance of mature taste buds35.
Discussion
The spatiotemporal and genetic control of extraoral taste buds in cavefish
Since the late 1960s, expanded taste buds on the head and chin of cavefish have been known, specifically in the sagittal aspect12 (Fig. 1). Schemmel12 showed that two cavefish populations have fish with broader taste bud distributions compared to surface morphs (Fig. 1B). Among cavefish populations, fish from the Pachón cave (Fig. 1C) had substantially more taste buds than fish from the Sabinos cave12,24. Although differences in oral taste bud numbers between cave and surface morphotypes appear around three weeks post-fertilization20, the timing and distribution of extraoral taste buds in different cave localities has long remained unknown.
Here, we show that cavefish extraoral taste buds, like catfish23, appear to extend from the positional field of oral taste buds. This domain gradually extends first along the ventral region, starting by 5 mpf, and expands in density and area through 18 mpf (Fig. 4). Dorsally, the expansion is slightly delayed, but follows a similar trajectory of numerical increases in two cavefish populations that was not observed in surface fish (Fig. 5). Adult-level differences in parental morphotypes were recapitulated in hybrid offspring (Fig. 6), providing a window into genetic contributions to taste system evolution. Although taste bud expansion on the head is a complex trait, as predicted years ago from classical studies16,24, we found only two principal regions of the genome contribute substantially to this constructive trait.
Interestingly, the phenotypic polarity of taste expansion is controlled through cave-associated alleles (Supplementary Fig. 1), in contrast to polarities for regressive and neutral phenotypes evolving in cavefish19. Additionally, we found more taste bud QTL on the right side of the head compared to the left side of the head. The significance of this finding is currently unclear, but it may relate to other lateralized phenotypes reported in cavefish populations. For instance, cavefish demonstrate coordinated changes in bony morphology that appear to track with mechanosensory neuromasts36, swimming preferences32, and foraging behavior37,38. Future work is needed to determine if lateralized taste bud positions, and perhaps the tastants to which they are tuned, are present across different cavefish populations. Conceivably they could tie together complex foraging behaviors with sensory expansions at the periphery, in the context of a nutritionally-sparse cave environment.
Extraoral taste buds represent a robust example of a late-developmental (i.e., non-embryonic) adaptive phenotype that crosses germ layer boundaries. Intriguingly, taste bud expansion is similar in two different cavefish populations—however we mapped this trait in only one cavefish population (Pachón). Kowalko et al.15 discovered that QTL associated with the taste system reside in different regions of the genome using separate mapping populations derived from Pachón and Tinaja cavefish, respectively15. Thus, an important direction for future work will be to apply identical phenotypic scoring at identical life history stages in hybrid pedigrees from both populations. This will enable identification of distinct genetic lesions evolving in parallel to yield analogous taste bud expansions of at the periphery. More broadly, this feature has the unique potential to provide new insight to the role of nerve fibers in the developmental appearance of vertebrate chemosensory organs. This study provides a key first step towards understanding the biological basis for an adaptive phenotype evolving under intense environmental pressures.
The unknown mechanisms mediating peripheral taste organ development in cavefish
It remains unknown how the dorsal and ventral head of cavefish become populated with extraoral taste buds. The spatiotemporal data we present here suggests extraoral taste buds extend from an oral domain, given the gradual rostrocaudal appearance of buds. But what is the mechanism of this expansion? The “neural induction” hypothesis of taste bud formation39 would suggest that by 5 mpf gustatory nerve fibers advance into the extraoral region and induce the formation of taste buds from naïve but competent overlying epithelium. A second model of “early specification”40 would suggest progenitor cells in the extraoral skin epithelium are patterned autonomously (in the absence of nerves) but rely on contact from gustatory neurons to differentiate.
Recent mammalian studies of taste system formation support the latter model41. Accordingly, expression of early taste patterning molecules may prefigure the appearance of taste buds before arrival of gustatory innervation. Mammalian taste buds are mostly nested within epithelial specializations called “papillae”42 Marker expression for the progenitors of papillae appear before gustatory neurite arrival43. However, taste papillae are not found in fish, and it remains unknown if homologous progenitor markers label taste bud progenitors in fish. Alternately, it may be that the first appearance of markers associated with papillae in fact label future taste bud tissues, and the papillae forms secondarily around these tissues44. Forthcoming studies on the developmental regulation of extraoral taste buds may provide insight to this question, and inform unresolved aspects of the early regulation of vertebrate taste bud formation.
One candidate gene identified from our genetic analysis, erbb3bb, is expressed in the developing taste papillae (an early taste system structure in mammals), and later in mature taste buds. This receptor is associated with the early development of other epithelial-derived tissues such as mammary epithelial cells45 and acinar cells of the salivary gland46. Interestingly, the mechanism by which acinar specification arises is through a form of neuronal-epithelial crosstalk involving nerve-derived expression of the ligand neuregulin146. Future work is necessary to determine if the protracted development of extraoral taste buds may be mediated by a similar orchestration of signaling between gustatory neuronal populations and the extraoral epithelium of cavefish.
Conversely, extraoral taste bud development may fundamentally differ between mammals and fish. In other cold-blooded systems, taste buds can differentiate in vivo in the absence of innervation26. Barlow et al.26 isolated early endodermal tissue in salamanders fated to give rise to taste buds. Explants were grown in culture, without nerves, but nevertheless produced differentiated, calretinin-positive taste bud organs26. This suggests a mechanism whereby early autonomous specification of taste buds occurs in the oropharyngeal endoderm which advances to taste organ differentiation in a nerve-independent manner40. Perhaps extraoral cavefish taste buds are autonomously specified in the head epithelium prior to innervation, but provide signals to gustatory neurites which arrive to taste buds later in development.
Another open question is how taste buds cross the germ-layer threshold of endodermal- to ectodermal-derived tissue. Oral taste buds in fish and amphibians are primarily endoderm-derived organs47,48, alongside the pancreas and liver. Extraoral taste buds in cavefish cross this “germ-layer boundary” in extending from oral to extraoral domains. Indeed, over a 100 years ago, Landacre22 suggested, based on to their anatomical position, external taste buds in catfish are derived from surface ectoderm22 (reviewed in ref. 49). Our finding of different QTL mediating the dorsal and ventral extraoral distributions of taste buds is congruent with developmental findings in mammals. Specifically, the anterior and posterior taste papillae in mice are regulated through different developmental signaling50, which may be a function of the anterior tongue being ectoderm-derived, while the posterior tongue is endoderm-derived in mammals (reviewed in ref. 49). Oral and extraoral taste buds in cavefish demonstrate no obvious structural or cellular differences17. Therefore, we suspect the same developmental mechanisms at play early on in the oral cavity have been co-opted, later in life history, for taste bud development in extraoral regions.
Developmental and histological studies in catfish, which have taste buds distributed along their entire head and flank21–23, may provide further mechanistic insight. First, flank (extraoral) taste buds are innervated by a recurrent branch of the facial cranial nerve23, which innervates taste buds in the oral cavity of vertebrates51. Second, these nerve fibers arrive to the skin epithelium prior to the appearance of differentiated taste buds23. Third, these taste buds are not suspected to arise from the migration of progenitors, but rather from specification within the epithelium itself—based on classical histology22 and calretinin-positive immunohistology23. These features are therefore consistent with a model of extraoral taste bud development wherein early progenitors (may) arise independent of neural input, but then rely on neural-epithelial interactions later in development, presumably involving gustatory neurites of the facial cranial nerve.
Understanding the spatiotemporal pattern of extraoral taste bud appearance is fundamental to examining these outstanding questions. Knowledge of the timing of extraoral taste bud appearance (and differences between cavefish and surface fish) enable insight to the timing, identity, and role of gustatory innervation in the development of this feature. Additionally, examining progenitor markers, based on studies in other vertebrates, will inform whether the extraoral epithelium is pre-patterned in the absence of nerve fibers, and shares features of early taste tissue specification in mammals. Future studies will inform whether early papillae formation in mammals, and early taste bud formation in fish, are governed by similar developmental and genetic regulators.
The adaptive relevance of taste bud expansion in animals living in complete darkness
The functional significance of extraoral taste buds in Astyanax is unknown6. In other organisms, numerical increases in peripheral sensory organs are associated with reductions in detection threshold52. Humans with more taste papillae have a higher sensitivity to dissolved tastants53. If this is the case, why would cavefish harbor a lower detection threshold in their environment? Perhaps taste buds serve a central role in detecting scarce nutrition in the food-starved caves of the Sierra de El Abra region (where they are found in nature)54. Indeed, recent work shows that concentrations at which chemicals are detected in the environment are dependent in part on olfaction11, however, the fundamental role of gustation in food detection remains incompletely understood.
The convergence in extraoral taste bud presence in different cavefish populations suggests shared cave pressures may drive the evolution of this phenotype, albeit through different genetic loci15. It should be noted, however, that work suggests that the Pachón and Tinaja cavefish populations arose from a single colonization event55. Therefore, although these populations continue to evolve independently, similarities in taste bud expansion between Pachón and Tinaja likely reflect both shared and convergent evolutionary changes.
One way to resolve this mystery is to understand the taste reception potential of extraoral taste buds. Given the large number of T2R gene family members in the Astyanax cavefish genome13, extraoral taste buds may be principally tuned to bitter. Perhaps bitter reception has become adaptive for detecting bat guano (rich in urea), one of the few nutritional inputs to the cave56. Despite the canonical valence of repulsion for bitter tastants57, cavefish may identify and pursue bitterness from guano (as nutrition) through learning and exposure58. Notably, the appearance of extraoral taste buds corresponds to a dietary shift in feeding over cavefish life history from live foods as juveniles, to bat guano as adults59. Heightened detection to guano may therefore be adaptive to cavefish competing for nutrition in the cave environment.
Alternately, taste buds may serve a different purpose. The expansion of extraoral taste buds may also correspond roughly with reproductive age in captive populations60. Given the loss of other breeding-associated cues, might taste buds serve a cryptic reproductive benefit as a chemosensory system? Aquatic mammals express bitter (T2R) and sweet (T1R2) receptors in chemosensory cells beyond their oral cavities, which is hypothesized to trigger immune responses to bacteria or other pathogens61. Perhaps a similar feature is at play with animals living in subterranean caves with a potentially high titer of bacterial and viral pathogens62. Additional future work on this fascinating system is sure to bring new insight to the evolution of constructive features generally, and shared vertebrate mechanisms of taste bud formation.
Methods
Fish husbandry, populations, and pedigrees
Developmental analyses involved three populations of Mexican tetra (Astyanax mexicanus) descended from wild-caught individuals of the Sierra de El Abra region of Mexico (Fig. 1A)63. These included a surface-dwelling population, and cavefish individuals from two cave localities: Pachón and Tinaja. All experimental animals were bred and reared in an animal husbandry unit maintained at ~23 °C under a 12 h:12 h light/dark cycle. All fish were housed in 5-gallon (~18.9 L) glass tanks in reverse-osmosis water conditioned to a conductivity level of ~700 ± 100 µS and pH 7.3 ± 0.2. Pachón cavefish (pedigrees 163 and 138), Tinaja (pedigree 19), and surface fish (pedigrees 152 and 155) which were kindly provided by Dr. Richard Borowsky (NYU), and which have been successfully bred and maintained for several generations. All experiments were carried out with Institutional Animal Care and Use Committee (IACUC) approval under protocol #22-01-06-01. We have complied with all relevant ethical regulations for animal use.
Developmental characterization of external taste bud development
Specimens were collected at five time periods: 5, 6, 9, 12, and 18 months post-fertilization (mpf). We regard these time points as juvenile developmental stages. Individuals were sacrificed at each stage and fixed in 4% PFA overnight at 4 °C. We note that individuals from our developmental analysis were reared in smaller densities and tanks (5 gallons or ~18.9 L) compared to members of our F2 mapping pedigree (below). The lower density of rearing resulted in these individuals reaching a larger overall body size more quickly than members of the experimental pedigrees.
The standard length was recorded for each specimen as the distance from the anterior-most portion of the snout to the posterior-most region of the caudal peduncle (see Supplemental Information). Specimens were stabilized on an agar bed and imaged at the following magnifications by developmental stage: 30× at 5 mpf; 25× at 6 mpf, and 20× at 9, 12, and 18 mpf. Individuals were imaged in the dorsal and ventral aspects, and taste bud numbers and distance information to the most caudal taste buds were recorded for each aspect using FIJI (Version 1.8.0_172) software. Raw distances were collected in pixels, converted to mm, and normalized by dividing by standard lengths for all specimens.
Taste bud visualization and scoring
To visualize taste buds, stage-matched individuals from all populations (Pachón cavefish, Tinaja cavefish, and surface fish) were sacrificed by overdose of 1% MS-222 anesthetic and fixed overnight in 4% paraformaldehyde (pH: 7.4). Following several rinses in phosphate-buffered saline (PBS, pH: 7.4), animals were incubated for 2 h at room temperature in a 5% normal goat serum block in PBT (PBS + 0.1% Triton-X 100; Sigma-Aldrich). Specimens were then incubated for two overnight periods at 4 °C in a primary antibody cocktail of rabbit α-calretinin polyclonal antibody (1:500, clone 6B3; Swant Ltd., Switzerland) in fresh PBT. Each specimen was then rinsed for ~8 h at room temperature in fresh PBT, followed by an overnight incubation at 4 °C in a secondary antibody cocktail of goat α-rabbit AlexaFluor 546 antibody (1:500; Life Technologies, Waltham, MA) in fresh PBT. The following morning, specimens were rinsed ~8 h at room temperature in fresh PBT and stored in sterile PBS at 4 °C until imaging.
Specimens were imaged using a Leica M205 FA stereomicroscope outfitted with a DFC310FX camera (Leica; Wetzlar, Germany). Using the MultiFocus module within the Leica LAS Application Suite, focal “montage” (z-plane stack) images were created from multiple individual images. This technique enabled us to capture and score images inclusive of the z-plane such that the entire visual field was in sharp focus. All images were saved as tiff-formatted files until analysis.
To score taste bud number, each TIFF-formatted image was opened in ImageJ (NIH, Bethesda, MD). Using the “polygon selection tool”, regions of the dorsal, right lateral, left lateral, and ventral aspects that harbored taste buds were selected for numerical and area analysis (see Supplementary Figs. 2, 3). Once selected, we implemented a semi-automated method of cell counting capitalizing on the punctate fluorescent intensity associated with calretinin-positive taste buds (“Process—Binary—Find Maxima”). Among a variety of noise tolerances, we found a value of 12 identified the most markers while minimizing false positives (Supplementary Fig. 1). To achieve the most accurate measure, we manually scored taste buds missed in the automated analysis. The area (in pixels) was recorded for every region analyzed, converted to mm2 units, and collated for subsequent scoring and normalization.
A Delauney triangulation analysis was performed for extraoral taste bud positions across development (Supplementary Data). Delauney triangulation is a computational geometric technique, spatially connecting positions of extraoral taste buds, with a minimum number of triangles. The triangular side lengths for each individual was averaged, enabling statistical comparisons across populations as a metric for clustering. Shorter average lengths indicate a set of taste buds are more closely clustered, while longer average lengths indicate points are more distantly spread out. All triangulation metrics were collected using ImageJ, and subjected to Single-Factor ANOVA tests.
Experimental F2 pedigree and animal rearing
Two Pachón cave x surface fish F2 pedigrees were bred from each of two pairs of sibling F1 individuals. Both pedigrees were derived from a parental cross between a Pachón cavefish female and a surface-dwelling fish male. The first pedigree (“Asty12”) consisted of 41 full-sibling individuals and the second pedigree (“Asty66”) consisted of 129 full-sibling individuals. Each individual was reared in groups of ~30 individuals in 10-gallon (~37.8-L) glass tanks until ~24 months. At this point, genomic DNA was extracted from fin clips of each individual using the DNeasy DNA extraction kit (Qiagen). This DNA was used to generate a GBS-based linkage map. Members of the Asty12 pedigree were unable to be labeled for taste buds, and therefore were not included in phenotypic mapping. Following this procedure, each fish was reared in a separate 1-liter tank to ensure identification of each individual (Aquaneering; San Diego, CA), in which they received independent supplies of recirculated system water. All hybrid individuals were maintained at ~22 °C and fed routine flake food (TetraMin Pro) once daily. A total of 129 individuals from the Asty66 pedigree were analyzed for taste bud number and distribution.
QTL Studies and Candidate Gene Selection
To identify taste buds for phenotypic scoring, all hybrid individuals were sacrificed and stained in whole-mount using an antibody directed against calretinin (above), a pan-taste bud marker in fish and in amphibians26. Individuals were imaged in whole-mount under UV epifluorescence to identify taste buds. Images were collected in the dorsal, left lateral, right lateral, and ventral aspects. For each aspect, we scored the following metrics: taste bud count, epithelial area in which taste buds were found, and the density of taste buds (number of taste buds divided by unit area). In total, 57 phenotypes were scored relating to external taste bud expansion (dorsal, n = 3; right lateral, n = 15; left lateral, n = 15; ventral, n = 24). All phenotypes were evaluated in R/qtl using a published linkage map of 2235 markers (assembled into 25 linkage groups) using genotyping-by-sequencing34. We performed comprehensive genome-wide scanone operations using phenotypic data collected from each F2 pedigree member using R/qtl (v.1.3.1093).
When a significant association was detected, the peak marker (or pseudomarker) was recorded alongside the peak LOD score (Table 1). Genomic intervals surrounding each QTL were estimated by identifying the position of five flanking markers on either side of the peak marker. All GBS marker sequences were blasted against the Astyanax mexicanus surface fish reference genome (Asty_Mex3; NCBI) to identify their genomic positions. Phenotypic effects for each peak marker (Table 1) were calculated in r/QTL to determine the polarity of phenotypic change at each significant locus.
Within each genomic interval, we examined candidate genes mediating taste bud expansion by profiling genes for an established role in taste bud development. For each interval, we determined whether a syntenic block exists for each interval identified using our linkage map, the reference Astyanax genome (AstMex3_surface; GCF_023375975.1), and the current draft zebrafish genome (GRCz11; GCF_000002035.6). A visualization of each block was created using the Comparative Genome Viewer tool (NCBI; https://www.ncbi.nlm.nih.gov/genome/cgv/1562060).
Statistics and reproducibility
We performed a power analysis to calculate the necessary sample size to detect differences between populations for adult external taste bud numbers. A power.anova analysis using the “pwr” R package (v.1.3.1093) indicated that a one-way ANOVA examining differences between three groups with a total sample size of 18 (i.e., n = 6 separate individuals per population) with an alpha of 0.05 would have acceptable power (0.80) to detect effect sizes of f = 0.81 or larger. This sample size was selected based on initial pilot data, which indicated a very large effect size (f = 5.09). For each developmental stage, we used an omnibus ANOVA test to examine significance for taste bud number, caudal distance, and Delauney triangulation with a Bonferroni correction for the multiple comparisons (p value threshold = 0.025). For each of three populations, n = 6 separate individuals were analyzed for each of five developmental stages. All individuals represent biological replicates. A total of n = 90 individuals (n = 30 from each population) were analyzed for developmental analyses. Post-hoc testing was performed using pairwise Wilcoxon rank sum tests to identify significant differences between each of the three populations at each developmental stage (see Supplementary Data).
Reporting summary
Further information on research design is available in the Nature Portfolio Reporting Summary linked to this article.
Supplementary information
Description of Additional Supplementary Files
Acknowledgements
The authors wish to thank members of the Gross lab for assistance, support, and suggestions throughout this project, especially Tyler Boggs, Alyssa Hamm, and Mandy Powers. D.B. was supported by a University Research Council award from the UC Office of Research. J.B.G. is currently supported by funding from the U.S. National Science Foundation (NSF IOS-2205928).
Author contributions
D.B. and J.B.G. conceived of the project; D.B. and H.H. performed experiments; D.B., H.H., and J.B.G. designed and created figures; D.B. and J.B.G. performed statistical analyses; D.B. and J.B.G. prepared the manuscript.
Peer review
Peer review information
Communications Biology thanks Maxime Policarpo and the other, anonymous, reviewer(s) for their contribution to the peer review of this work. Primary Handling Editors: Aylin Bircan and Mengtan Xing.
Data availability
All data collected in this study are available as published information or in Supplementary Data. The linkage data presented in this study is available in the original linkage map construction paper34 is available through Dryad (10.5061/dryad.6s718), and all data and analytical results have been accessioned to Supplementary Data.
Competing interests
The authors declare no competing interests.
Ethical approval
The design, execution, and reporting of research herein conforms to guidance from the Global Code of Conduct.
Footnotes
Publisher’s note Springer Nature remains neutral with regard to jurisdictional claims in published maps and institutional affiliations.
Supplementary information
The online version contains supplementary material available at 10.1038/s42003-024-06635-2.
References
- 1.Poulson, T. L. & White, W. B. The cave environment. Science165, 971–981 (1969). 10.1126/science.165.3897.971 [DOI] [PubMed] [Google Scholar]
- 2.Bradic, M., Teotonio, H. & Borowsky, R. L. The population genomics of repeated evolution in the blind cavefish Astyanax mexicanus. Mol. Biol. Evol.30, 2383–2400 (2013). 10.1093/molbev/mst136 [DOI] [PMC free article] [PubMed] [Google Scholar]
- 3.Jeffery, W. R. Regressive evolution in Astyanax cavefish. Annu. Rev. Genet.43, 25–47 (2009). 10.1146/annurev-genet-102108-134216 [DOI] [PMC free article] [PubMed] [Google Scholar]
- 4.Ma, L. et al. A hypomorphic cystathionine ß-synthase gene contributes to cavefish eye loss by disrupting optic vasculature. Nat. Commun.11, 2772 (2020). 10.1038/s41467-020-16497-x [DOI] [PMC free article] [PubMed] [Google Scholar]
- 5.Li, C., Chen, H., Zhao, Y., Chen, S. & Xiao, H. Comparative transcriptomics reveals the molecular genetic basis of pigmentation loss in Sinocyclocheilus cavefishes. Ecol. Evol.10, 14256–14271 (2020). 10.1002/ece3.7024 [DOI] [PMC free article] [PubMed] [Google Scholar]
- 6.Berning, D. & Gross, J. B. The constructive evolution of taste in Astyanax cavefish: A review. Front. Ecol. Evol.11, 1177532 (2023). 10.3389/fevo.2023.1177532 [DOI] [Google Scholar]
- 7.Alexandre, D. & Ghysen, A. Somatotopy of the lateral line projection in larval zebrafish. Proc. Natl Acad. Sci. USA96, 7558–7562 (1999). 10.1073/pnas.96.13.7558 [DOI] [PMC free article] [PubMed] [Google Scholar]
- 8.Bibliowicz, J. et al. Differences in chemosensory response between eyed and eyeless Astyanax mexicanus of the Rio Subterraneo cave. Evodevo4, 25 (2013). 10.1186/2041-9139-4-25 [DOI] [PMC free article] [PubMed] [Google Scholar]
- 9.Bensouilah, M. & Denizot, J.- Taste buds and neuromasts of Astyanax jordani: Distribution and immunochemical demonstration of co-localized substance P and enkephalins. Eur. J. Neurosci.3, 407–414 (1991). 10.1111/j.1460-9568.1991.tb00828.x [DOI] [PubMed] [Google Scholar]
- 10.Breder, C. M. & Rasquin, P. Chemical sensory reactions in the Mexican blind characins. Zoologica28, 169–200 (1943). [Google Scholar]
- 11.Blin, M. et al. Developmental evolution and developmental plasticity of the olfactory epithelium and olfactory skills in Mexican cavefish. Dev. Biol.441, 242–251 (2018). 10.1016/j.ydbio.2018.04.019 [DOI] [PubMed] [Google Scholar]
- 12.Schemmel, C. Comparative studies of the cutaneous sense organs in epigean and hypogean forms of Astyanax with regard to the evolution of cavernicoles. Z. Morphol. Tiere61, 255–316 (1967). 10.1007/BF00400988 [DOI] [Google Scholar]
- 13.Shiriagin, V. & Korsching, S. I. Massive expansion of bitter taste receptors in blind cavefish, Astyanax mexicanus. Chem. Senses44, 23–32 (2019). [DOI] [PubMed] [Google Scholar]
- 14.Policarpo, M., Baldwin, M. W., Casane, D. & Salzburger, W. Diversity and evolution of the vertebrate chemoreceptor gene repertoire. Nat. Commun.15, 1421-y (2024). 10.1038/s41467-024-45500-y [DOI] [PMC free article] [PubMed] [Google Scholar]
- 15.Kowalko, J. E. et al. Convergence in feeding posture occurs through different genetic loci in independently evolved cave populations of Astyanax mexicanus. Proc. Natl Acad. Sci. USA110, 16933–16938 (2013). 10.1073/pnas.1317192110 [DOI] [PMC free article] [PubMed] [Google Scholar]
- 16.Schemmel, C. Studies on the genetics of feeding behaviour in the cave fish Astyanax mexicanus f. Anoptichthys. an example of apparent monofactorial inheritance by polygenes. Z. Tierpsychol.53, 9–22 (1980). 10.1111/j.1439-0310.1980.tb00730.x [DOI] [PubMed] [Google Scholar]
- 17.Boudriot, F. & Reutter, K. Ultrastructure of the taste buds in the blind cave fish Astyanax jordani (“Anoptichthys”) and the sighted river fish Astyanax mexicanus (Teleostei, Characidae). J. Comp. Neurol.434, 428–444 (2001). 10.1002/cne.1185 [DOI] [PubMed] [Google Scholar]
- 18.Yamamoto, Y., Byerly, M. S., Jackman, W. R. & Jeffery, W. R. Pleiotropic functions of embryonic sonic hedgehog expression link jaw and taste bud amplification with eye loss during cavefish evolution. Dev. Biol.330, 200–211 (2009). 10.1016/j.ydbio.2009.03.003 [DOI] [PMC free article] [PubMed] [Google Scholar]
- 19.Protas, M., Conrad, M., Gross, J. B., Tabin, C. & Borowsky, R. Regressive evolution in the Mexican cave tetra, Astyanax mexicanus. Curr. Biol.17, 452–454 (2007). 10.1016/j.cub.2007.01.051 [DOI] [PMC free article] [PubMed] [Google Scholar]
- 20.Varatharasan, N., Croll, R. P. & Franz-Odendaal, T. Taste bud development and patterning in sighted and blind morphs of Astyanax mexicanus. Dev. Dyn.238, 3056–3064 (2009). 10.1002/dvdy.22144 [DOI] [PubMed] [Google Scholar]
- 21.Atema, J. Structures and functions of the sense of taste in the catfish (Ictalurus natalis). Brain Behav. Evol.4, 273–294 (1971). 10.1159/000125438 [DOI] [PubMed] [Google Scholar]
- 22.Landacre, F. L. On the place of origin and method of distribution of taste buds in Ameiurus melas. J. Comp. Neurol. Psychol.17, 1–66 (1907). 10.1002/cne.920170102 [DOI] [Google Scholar]
- 23.Northcutt, R. G. Taste bud development in the channel catfish. J. Comp. Neurol.482, 1–16 (2005). 10.1002/cne.20425 [DOI] [PubMed] [Google Scholar]
- 24.Wilkens, H. Evolution and genetics of epigean and cave Astyanax fasciatus (Characidae, Pisces): support for the neutral mutation theory. in Evolutionary Biology (eds. Hecht, M. K. & Wallace, B.) 271–367 (Plenum Publishing Corporation, 1988).
- 25.Schemmel, C. Genetische untersuchungen zur evolution des geschmacksapparates bei cavernicolen fischen. J. Zool. Syst. Evol. Res.12, 196–215 (1974). 10.1111/j.1439-0469.1974.tb00165.x [DOI] [Google Scholar]
- 26.Barlow, L. A., Chien, C. B. & Northcutt, R. G. Embryonic taste buds develop in the absence of innervation. Development122, 1103–1111 (1996). 10.1242/dev.122.4.1103 [DOI] [PubMed] [Google Scholar]
- 27.Gross, J. B., Krutzler, A. J. & Carlson, B. M. Complex craniofacial changes in blind cave-dwelling fish are mediated by genetically symmetric and asymmetric loci. Genetics196, 1303–1319 (2014). 10.1534/genetics.114.161661 [DOI] [PMC free article] [PubMed] [Google Scholar]
- 28.Broman, K. W., Wu, H. & Sen, G. A. Churchill, R/qtl: QTL mapping in experimental crosses. Bioinformatics19, 889–890 (2003). 10.1093/bioinformatics/btg112 [DOI] [PubMed] [Google Scholar]
- 29.Broman, K. W. & Sen, S. A Guide to QTL Mapping with R/Qtl (Springer, 2009).
- 30.Gross, J. B., Stahl, B. A., Powers, A. K. & Carlson, B. M. Natural bone fragmentation in the blind cave‐dwelling fish, Astyanax mexicanus: Candidate gene identification through integrative comparative genomics. Evol. Dev.18, 7–18 (2016). 10.1111/ede.12131 [DOI] [PMC free article] [PubMed] [Google Scholar]
- 31.Fernandes, V. L. F., Glaser, Y., Iwashita, M. & Yoshizawa, M. Evolution of left–right asymmetry in the sensory system and foraging behavior during adaptation to food-sparse cave environments. BMC Biol.20, 295 (2022). 10.1186/s12915-022-01501-1 [DOI] [PMC free article] [PubMed] [Google Scholar]
- 32.De Perera, T. B. & Braithwaite, V. A. Laterality in a non-visual sensory modality—the lateral line of fish. Curr. Biol.15, R241–R242 (2005). 10.1016/j.cub.2005.03.035 [DOI] [PubMed] [Google Scholar]
- 33.Smith, D. R. et al. Rapid whole-genome mutational profiling using next-generation sequencing technologies. Genome Res.18, 1638–1642 (2008). 10.1101/gr.077776.108 [DOI] [PMC free article] [PubMed] [Google Scholar]
- 34.Carlson, B. M., Onusko, S. W. & Gross, J. B. A high-density linkage map for Astyanax mexicanus using genotyping-by-sequencing technology. G3: Genes Genomes Genet.5, 241–251 (2015). [DOI] [PMC free article] [PubMed]
- 35.McLaughlin, S. K. Erb and c-kit receptors have distinctive patterns of expression in adult and developing taste papillae and taste buds. J. Neurosci.20, 5679–5688 (2000). 10.1523/JNEUROSCI.20-15-05679.2000 [DOI] [PMC free article] [PubMed] [Google Scholar]
- 36.Gross, J., Gangidine, A. & Powers, A. Asymmetric facial bone fragmentation mirrors asymmetric distribution of cranial neuromasts in blind Mexican cavefish. Symmetry8, 118 (2016). 10.3390/sym8110118 [DOI] [PMC free article] [PubMed] [Google Scholar]
- 37.Espinasa, J. & Espinasa, L. Cavefish dorsoventral axis angle during wall swimming: laterality asymmetry. Subterr. Biol.49, 19–29 (2024). 10.3897/subtbiol.49.121747 [DOI] [Google Scholar]
- 38.Fernandes, V. F. L., Macaspac, C., Lu, L. & Yoshizawa, M. Evolution of the developmental plasticity and a coupling between left mechanosensory neuromasts and an adaptive foraging behavior. Dev. Biol.441, 262–271 (2018). 10.1016/j.ydbio.2018.05.012 [DOI] [PubMed] [Google Scholar]
- 39.Hosley, M. A., Hughes, S. E. & Oakley, B. Neural induction of taste buds. J. Comp. Neurol.260, 224–232 (1987). 10.1002/cne.902600206 [DOI] [PubMed] [Google Scholar]
- 40.Barlow, L. A. & Northcutt, R. G. The role of innervation in the development of taste buds: insights from studies of amphibian embryos a. Ann. N. Y. Acad. Sci.855, 58–69 (1998). 10.1111/j.1749-6632.1998.tb10546.x [DOI] [PubMed] [Google Scholar]
- 41.Fan, D., Chettouh, Z., Consalez, G. G. & Brunet, J. Taste bud formation depends on taste nerves. Elife8, e49226 (2019). 10.7554/eLife.49226 [DOI] [PMC free article] [PubMed] [Google Scholar]
- 42.Norgren, R. The gustatory system in mammals. Am. J. Otolaryngol.4, 234–237 (1983). 10.1016/S0196-0709(83)80064-7 [DOI] [PubMed] [Google Scholar]
- 43.Hall, J. M., Hooper, J. E. & Finger, T. E. Expression of sonic hedgehog, patched, and Gli1 in developing taste papillae of the mouse. J. Comp. Neurol.406, 143–155 (1999). [DOI] [PubMed] [Google Scholar]
- 44.Thirumangalathu, S., Harlow, D. E., Driskell, A. L., Krimm, R. F. & Barlow, L. A. Fate mapping of mammalian embryonic taste bud progenitors. Development136, 1519–1528 (2009). 10.1242/dev.029090 [DOI] [PMC free article] [PubMed] [Google Scholar]
- 45.Darcy, K. M. et al. Changes in ErbB2 (her-2/neu), ErbB3, and ErbB4 during growth, differentiation, and apoptosis of normal rat mammary epithelial cells. J. Histochem. Cytochem.48, 63–80 (2000). 10.1177/002215540004800107 [DOI] [PubMed] [Google Scholar]
- 46.May, A. J. et al. Neuronal-epithelial cross-talk drives acinar specification via NRG1-ERBB3-mTORC2 signaling. Dev. Cell.57, 2550–2565.e5 (2022). 10.1016/j.devcel.2022.10.011 [DOI] [PMC free article] [PubMed] [Google Scholar]
- 47.Barlow, L. A. & Northcutt, R. G. Embryonic origin of amphibian taste buds. Dev. Biol.169, 273–285 (1995). 10.1006/dbio.1995.1143 [DOI] [PubMed] [Google Scholar]
- 48.Johnston, J. B. The limit between ectoderm and entoderm in the mouth, and the origin of taste buds. I. amphibians. Am. J. Anat.10, 41–67 (1910). 10.1002/aja.1000100103 [DOI] [Google Scholar]
- 49.Barlow, L. A. & Klein, O. D. Developing and regenerating a sense of taste. Curr. Top. Dev. Biol.111, 401–419 (2015). 10.1016/bs.ctdb.2014.11.012 [DOI] [PMC free article] [PubMed] [Google Scholar]
- 50.Petersen, C. I. et al. FGF signaling regulates the number of posterior taste papillae by controlling progenitor field size. PLoS Genet.7, e1002098 (2011). 10.1371/journal.pgen.1002098 [DOI] [PMC free article] [PubMed] [Google Scholar]
- 51.Harris, W. Fifth and seventh cranial nerves in relation to nervous mechanism of taste sensation. Br. Med. J.1, 831 (1952). 10.1136/bmj.1.4763.831 [DOI] [PMC free article] [PubMed] [Google Scholar]
- 52.Arvidson, K. & Friberg, U. Human taste: Response and taste bud number in fungiform papillae. Science209, 807–808 (1980). 10.1126/science.7403846 [DOI] [PubMed] [Google Scholar]
- 53.Arvidson, K. Location and variation in number of taste buds in human fungiform papillae. Scand. J. Dent. Res.87, 435–442 (1979). [DOI] [PubMed] [Google Scholar]
- 54.Elliott, W. R. Cave biodiversity and ecology of the Sierra de El Abra region. in Biology and Evolution of the Mexican Cavefish 59–76 (Elsevier Science, 2015).
- 55.Policarpo, M. et al. The nature and distribution of putative non-functional alleles suggest only two independent events at the origins of Astyanax mexicanus cavefish populations, BMC. Ecol. Evol.24, 41 (2024). [DOI] [PMC free article] [PubMed] [Google Scholar]
- 56.Queffelec, A., Bertran, P., Bos, T. & Lemée, L. Mineralogical and organic study of bat and chough guano: Implications for guano identification in ancient context. J. Cave Karst Stud.80, 49–65 (2018). 10.4311/2017ES0102 [DOI] [Google Scholar]
- 57.Wang, L. et al. The coding of valence and identity in the mammalian taste system. Nature558, 127–131 (2018). [DOI] [PMC free article] [PubMed]
- 58.Breslin, P. A. An evolutionary perspective on food and human taste. Curr. Biol.23, R409–R418 (2013). 10.1016/j.cub.2013.04.010 [DOI] [PMC free article] [PubMed] [Google Scholar]
- 59.Espinasa, L. et al. Contrasting feeding habits of post-larval and adult Astyanax cavefish. Subterr. Biol21, 1 (2017). 10.3897/subtbiol.21.11046 [DOI] [Google Scholar]
- 60.Simon, V., Hyacinthe, C. & Rétaux, S. Breeding behavior in the blind Mexican cavefish and its river-dwelling conspecific. PLoS ONE14, e0212591 (2019). 10.1371/journal.pone.0212591 [DOI] [PMC free article] [PubMed] [Google Scholar]
- 61.Barboza, M. L. B. & Reyno, B. Taste receptors in aquatic mammals: potential role of solitary chemosensory cells in immune responses. Anat. Rec.305, 680–687 (2022). 10.1002/ar.24708 [DOI] [PubMed] [Google Scholar]
- 62.Zada, S. et al. Cave microbes as a potential source of drugs development in the modern era. Microb. Ecol. 84, 676–687 (2021). [DOI] [PMC free article] [PubMed]
- 63.Mitchell, R. W., Russell, W. H., Elliott, W. R. Mexican Eyeless Characin Fishes, Genus Astyanax: Environment, Distribution, and Evolution (Texas Tech Press, 1977).
Associated Data
This section collects any data citations, data availability statements, or supplementary materials included in this article.
Supplementary Materials
Description of Additional Supplementary Files
Data Availability Statement
All data collected in this study are available as published information or in Supplementary Data. The linkage data presented in this study is available in the original linkage map construction paper34 is available through Dryad (10.5061/dryad.6s718), and all data and analytical results have been accessioned to Supplementary Data.