

Abstract
Background:
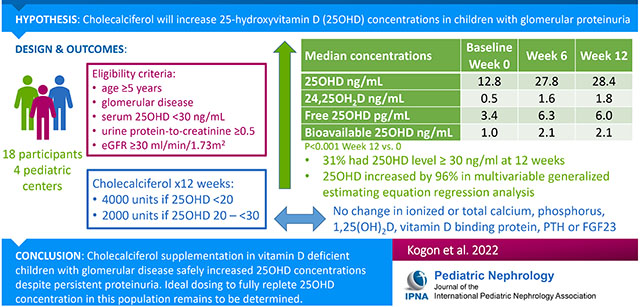
Vitamin D deficiency is common in glomerular disease. Supplementation may be ineffective due to ongoing urinary losses of vitamin D binding protein. We sought to determine if daily cholecalciferol supplementation would increase vitamin D concentrations in children with glomerular disease and persistent proteinuria, without adverse effects.
Methods:
Eighteen participants at least 5 years of age with primary glomerular disease and urine protein:creatinine ratio ≥0.5 were enrolled from four pediatric nephrology practices to receive cholecalciferol supplementation: 4000 IU or 2000 IU per day for serum 25 hydroxyvitamin vitamin D (25OHD) concentrations <20 ng/mL and 20 ng/mL to <30 ng/mL, respectively. Measures of vitamin D and mineral metabolism were obtained at baseline and weeks 6 and 12. Multivariable generalized estimating equation (GEE) regression estimated mean percent changes in serum 25OHD concentration.
Results:
Median baseline 25OHD was 12.8 ng/mL (IQR 9.3, 18.9) and increased to 27.8 ng/mL (20.5, 36.0) at week 6 (p<0.001) without further significant increase at week 12. 31% of participants had a level ≥30 ng/mL at week 12. Supplementation was stopped in two participants at week 6 for mildly elevated calcium and phosphorus, respectively, with subsequent declines in 25OHD of >20 ng/mL. In the adjusted GEE model, 25OHD was 102% (95% CI: 64, 141) and 96% (95% CI: 51, 140) higher versus baseline at weeks 6 and 12, respectively (p<0.001).
Conclusion(s):
Cholecalciferol supplementation in vitamin D deficient children with glomerular disease and persistent proteinuria safely increases 25OHD concentration. Ideal dosing to fully replete 25OHD concentrations in this population remains unknown.
Clinical Trial:
Keywords: glomerular disease, nephrotic syndrome, vitamin D deficiency, proteinuria, pediatric, vitamin D
Graphical Abstract
Introduction
Nephrotic syndrome is the most common acquired cause of chronic kidney disease (CKD) in childhood. It imposes a heavy burden of cardiovascular[1, 2], metabolic[3, 4], hematologic[5] and infectious complications.[6] Vitamin D deficiency impacts bone and mineral metabolism, cardiovascular disease, insulin resistance, autoimmunity and inflammation [7–11] and is highly prevalent in nephrotic syndrome, identified in up to 100% of patients. [11–13] Furthermore, animal studies have shown that activated vitamin D treatment reduces albuminuria and prevents podocyte loss and glomerulosclerosis. [14] Vitamin D therapy has also been shown to reduce proteinuria in adults with CKD.[15, 16] Several small studies of children with nephrotic syndrome have shown improvements in bone mineral density and bone mineral content with calcium and vitamin D supplementation[17–20].
The National Kidney Foundation and European Society of Pediatric Nephrology provide dosing recommendations for vitamin D supplementation in chronic kidney disease, but the generalizability of these recommendations to those with persistent proteinuria is unknown. [21, 22] The approach to vitamin D supplementation in patients with persistent proteinuria may require modification due to the possible impairment of its intestinal absorption [23] and its excessive elimination in the urine secondary to the loss of its carrier proteins, vitamin D binding protein (VDBP) and albumin. [23–25] Although studies have found that vitamin D supplementation for children with nephrotic syndrome leads to increased vitamin D levels, [18, 26–28] the vast majority of the participants in these studies had steroid responsive nephrotic syndrome and were in remission or went into remission during the supplementation period. Additionally, a recent study found that children with glomerular disease require higher doses of vitamin D supplementation and take longer to achieve optimal levels compared to children with CKD of non-glomerular etiology. [29]
The efficacy and safety of vitamin D supplementation in children with persistent proteinuria who have vitamin D deficiency is unclear. A previous study of seven adult patients with active nephrotic syndrome showed an elevation of serum 25OHD for up to 72 hours after oral administration without any changes in serum or urinary calcium or magnesium, but an increase in serum phosphorus. Despite a rapid increase in 25OHD concentration, intestinal absorption was slower and elimination faster in those with nephrotic syndrome compared to controls, suggesting that the metabolism of vitamin D supplementation may be altered in this setting.[30] Accordingly, our study sought to determine if the administration of vitamin D supplementation over 12 weeks in children and young adults with glomerular disease and persistent proteinuria would lead to an increase in serum 25OHD concentrations without adversely affecting other mineral metabolites. Our primary outcome was change in vitamin D concentration after 12 weeks of supplementation.
Methods
Participants were recruited from four pediatric nephrology centers: Children’s Hospital of Philadelphia (CHOP), Nemours Alfred I. DuPont Hospital for Children, Cohen Children’s Medical Center and Johns Hopkins Medical Center. Study procedures for participants recruited from Nemours were conducted at CHOP. The Institutional Review Boards at CHOP, Cohen Children’s Medical Center and Johns Hopkins Medical Center approved this study. IRB oversight for participants from Nemours was provided by the CHOP IRB through a cooperative agreement. Informed consent was obtained from all participants. The study was performed in accordance with the ethical standards as laid down in the 1964 Declaration of Helsinki and its later amendments or comparable ethical standards. Inclusion criteria included: age ≥ 5 years, a primary glomerular disorder (such as steroid-resistant nephrotic syndrome, minimal change nephropathy, focal segmental glomerulosclerosis (FSGS), membranous nephropathy, membranoproliferative glomerulonephritis, and IgA nephropathy) without systemic inflammatory disorders (i.e. lupus, vasculitis), serum 25OHD concentration <30 ng/mL and urine protein-to-creatinine ratio (UPCR) ≥0.5 at the screening visit. Exclusion criteria included an estimated glomerular filtration rate (eGFR) <30 ml/min/1.73m2, serum phosphorus >5.5 mg/dl, hypercalcemia, history of kidney stones, chronic medical conditions or medications unrelated to the glomerular disease that could impact vitamin D status, and pregnancy. eGFR was calculated using the “bedside Schwartz” equation [31] in participants <18 years of age and by the CKD-EPI equation in participants ≥18 years of age. [32]
Participants received 12 weeks of cholecalciferol supplementation according to their baseline 25OHD concentration, as recommended by the National Kidney Foundation.[33] The dosages were modified from National Kidney Foundation recommendations for simplicity. If the 25OHD was <20 ng/mL, they received a daily dose of cholecalciferol of 4000 IU for 12 weeks, and if the 25OHD was 20 to <30 ng/mL they received a daily cholecalciferol dose of 2000 IU for 12 weeks. Participants were evaluated at 6 ± 2 and 12 ± 2 weeks. Participants were provided with an 8-week supply of cholecalciferol at the screening visit and at the week 6 visit. Adherence to vitamin D supplementation was calculated based on pill counts. The participants brought their vitamin D supplement bottle(s) to the week 6 and week 12 visits, and the study staff counted the number of pills remaining from what was prescribed to estimate percent adherence. Adherence was defined as taking ≥ 85% of the prescribed pills. Dietary intake of vitamin D, including from multi-vitamins, was estimated from the average of three 24-hour diet recalls by phone interview conducted at baseline and week 12 (Nutrition Coordinating Center, University of Minnesota Nutrition Data System, Minneapolis, MN).[34]
Serum 25OHD was measured in real time by high-performance liquid chromatography-tandem mass spectrometry (HPLC-MS/MS) in the CHOP clinical laboratory and represents the sum of 25(OH)D2 and 25(OH)D3. This 25(OH)D assay gave a linear response from 1.3-135 ng/mL for both 25(OH)D2 and 25(OH)D3, and the limit of quantitation was 1.3 ng/mL. The interassay CVs were 7.3-10.0% and 4.2-4.9% for 25(OH)D2 and 25(OH)D3, respectively. Values reported as <3 ng/mL were set to 3 ng/mL for analysis.
Safety was assessed with measures of serum 25OHD concentration, serum calcium, whole blood ionized calcium, serum phosphorus and urine calcium excretion at all visits. Values of urine calcium <1.0 mg/dl were set to 1 for analysis. Actionable values and the safety protocol are outlined in the Supplemental Material. All enrolled participants were followed until the end of the study even if cholecalciferol supplementation was discontinued. Serum creatinine, albumin and intact parathyroid hormone (PTH) were also measured in real time by enzymatic assay, colorimetric assay (bromocresol green) and chemiluminescent immunoassay, respectively. We measured vitamin D and related metabolites at the baseline, week 6 and week 12 visits for all participants. Serum samples were stored at −80°C and analyzed in batch at the conclusion of the study at the University of Washington for VDBP, 25OHD, 1,25-dihydroxyvitamin D (1,25OH2D), 24,25-dihdyroxyvitamin D (24,25OH2D), and fibroblast growth factor 23 (FGF23). Serum 25OHD, 1,25OH2D, and 24,25OH2D were measured by immunoenrichment and HPLC-MS/MS. The full method of extraction and analysis for 25(OH)D has been described previously.[35] The calibration for the measurement of 25(OH)D was verified using the NIST Standard Reference Material 972 with accuracy of 91-95% for 25(OH)D3 and 100-116% for 25(OH)D2. The method has lower limits of quantification (20% CV) of 0.5 ng/mL, 1.0 ng/mL, and 5.0 ng/mL for 24,25(OH)2D3, 25(OH)D3, and 25(OH)D2, respectively. Inter-assay imprecision is 8.58% at 1.5 ng/mL for 24,25(OH)2D3, 4.40% at 10.4 ng/mL for 25(OH)D3, and 4.35% at 9.7 ng/mL for 25(OH)D2. Free 25(OH)D is a function of the isoform of VDBP, and combinations of two single-nucleotide polymorphisms produce three major DBP isoforms (Gc1f, Gc1s, and Gc2) that differ in their geographical and racial distribution and their affinities for vitamin D metabolites and circulating concentrations.[36–38] We measured VDBP concentration and identified the VDBP isoforms present using LC-MS/MS. [37] Based on the VDBP and VDBP isoforms for each participant, we also calculated the free and bioavailable vitamin D concentrations.[39]
Statistical Analysis
Analyses were performed using R 4.1 and STATA 16. For our analyses, eGFR was calculated using the Chronic Disease in Children (CKiD) Under 25 GFR estimating equations.[40]. Changes in measures of vitamin D and mineral metabolism were assessed using the Wilcoxon signed-rank test. The values for participants who discontinued the cholecalciferol at the week 6 visits were not included in the reporting of data for week 12. Generalized estimating equation (GEE) regression analysis adjusting for age, sex, season of supplementation (May through October versus November through April), eGFR, albumin, UPCR, VDBP and VDBP isoform (Gc1f present versus not) was used to determine if serum 25OHD concentrations increased, after accounting for confounding factors. Visits from the same participants were considered to have exchangeable covariance. For the GEE model, 25OHD values were re-scaled to each patient’s baseline value, and the week 12 visit data for two participants was excluded due to discontinuation of vitamin D supplementation at week 6. An additional GEE regression analysis was also performed using the log-transformed 25OHD values as the outcome to estimate mean ratios of 25OHD levels across visits and for other risk factors. Sequential levels of adjustment were performed for this model to evaluate the associations of covariates and to assess for any signs of model overfitting given the large number of covariates and relatively small number of observations. P values <0.05 were considered statistically significant.
Results
Of 35 screening visits among 31 participants, eighteen met criteria to receive cholecalciferol supplementation. Table 1 shows baseline demographic and clinical data. Median age was 13 years (IQR: 7, 16). The most common diagnosis was FSGS. Median eGFR was 90.3 ml/min/1.73m2 (IQR: 70.4, 110.3) and most of the participants were taking prednisone. Fifteen participants at each study visit returned pill bottles to perform pill counts for adherence. At the week 6 visit 73% of participants were adherent, as defined by taking at least 85% of the prescribed doses, and at the week 12 visit 60% were adherent. All participants who returned pill bottles took >50% of the prescribed pills. The median daily vitamin D intake from diet and other non-prescribed (eg multi-vitamin) sources was 222 (IQR: 99-466) units at the baseline visit and 186 (IQR: 61, 348) units at week 12.
Table 1:
Baseline characteristics of participants
| N (%) or Median (IQR) | |
|---|---|
| Age (years) | 13 (7, 16) |
| Male sex | 9 (50%) |
| Black race | 8 (44%) |
| Ethnicity | |
| Does not know | 1 (6%) |
| Not Hispanic or Latino | 15 (83%) |
| Hispanic or Latino | 2 (11%) |
| Haplotype | |
| Gc1f/Gc1f | 7 (39%) |
| Gc1f/Gc1s | 5 (28%) |
| Gc2/Gc1f | 3 (17%) |
| Gc2/Gc1s | 1 (6%) |
| Gc1s/Gc1s | 2 (11%) |
| Supplemented in winter (November to April) | 8 (44%) |
| Etiology of disease | |
| Focal segmental glomerulosclerosis | 13 (72%) |
| Other (Minimal change nephropathy, IgA nephropathy, membranoproliferative glomerulonephritis) | 5 (28%) |
| Estimated glomerular filtration rate (ml/min/1.73m2) | 90.3 (70.4, 110.3) |
| Taking an ace inhibitor or angiotensin receptor blocker | 7 (39%) |
| Taking prednisone | 14 (78%) |
| Taking calcineurin inhibitor | 9 (50%) |
The Figure and Tables 2 and 3 show the distributions of measures of vitamin D and mineral metabolism at the baseline and follow-up study visits. At baseline, the median 25OHD concentration was 12.8 ng/mL; 16 of the 18 participants had a serum 25OHD level <20 ng/mL. The median 25OHD concentration increased to 27.8 ng/mL by week 6 (p<0.001) without further significant increase at week 12 (median 28.4 ng/mL). At week 12, 31% (5 participants) had a level ≥30 ng/mL, and 19% (3 participants) had a level <10 ng/mL. 24,25OH2D concentrations increased significantly at week 6 and further increased at week 12 (p<0.001 and p=0.002, respectively). With supplementation, there was a significant increase in bioavailable and free 25(OH)D from the baseline visit to the week 6 and week 12 visits. The ratio of 24,25OH2D:25OHD increased from baseline to 12 weeks. There were no significant changes in ionized or total calcium, phosphorus, 1,25OH2D, FGF23, or VDBP.
Figure 1.
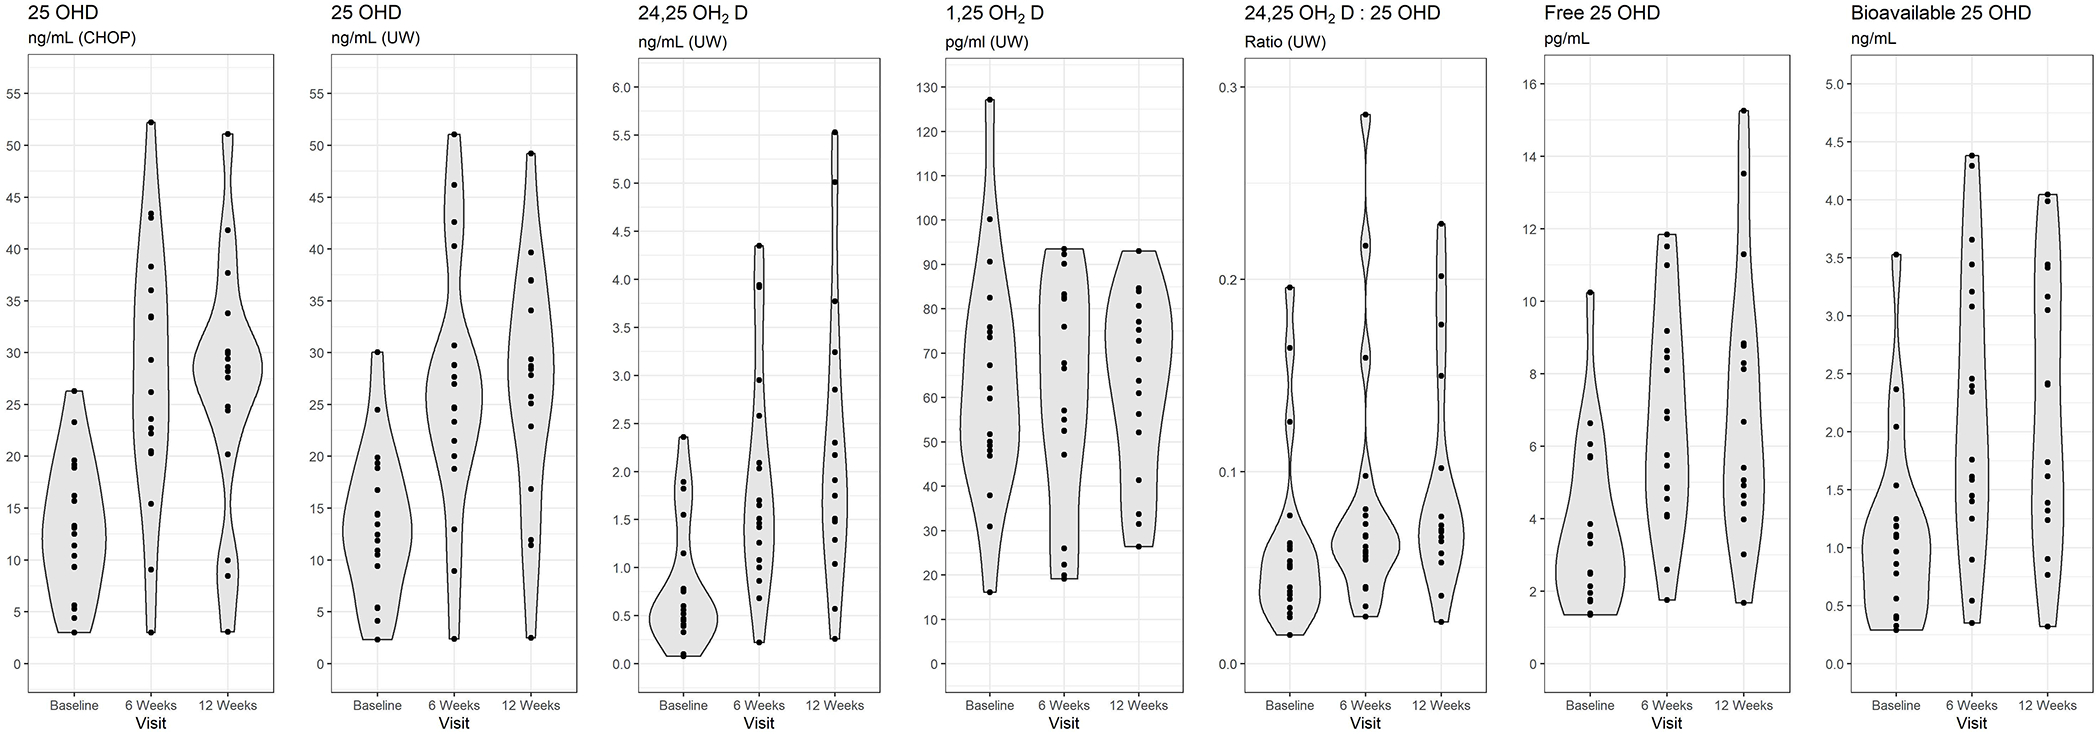
Distributions of measures of vitamin D and mineral metabolism at baseline and follow-up study visits
Table 2.
Measures of vitamin D metabolites and vitamin D binding protein at the baseline and follow-up visits
| Factor | Baseline median (IQR) | 6 weeks median (IQR) | 12 weeks median (IQR) | P value week 6 vs baseline | P value week 12 vs baseline | P value week 12 vs week 6 |
|---|---|---|---|---|---|---|
|
| ||||||
| N | 18 | 18 | 16 | |||
|
| ||||||
| 25OHD ng/mL (CHOP) | 12.8 (9.3-18.9) | 27.8 (20.5-36.0) | 28.4 (22.3-32.0) | <0.001 | <0.001 | 0.105 |
|
| ||||||
| 25OHD ng/mL (UW) | 12.9 (9.4-18.9) | 25.8 (20.0-30.7) | 28.1 (19.9-35.5) | <0.001 | <0.001 | 0.018 |
|
| ||||||
| 25OHD (CHOP) | <0.001 | 0.002 | 0.824 | |||
| <10 ng/mL | 6 (33%) | 2 (11%) | 3 (19%) | |||
| 10 to <20 ng/mL | 10 (56%) | 1 (6%) | 0 (0%) | |||
| 20 to <30 ng/mL | 2 (11%) | 7 (39%) | 8 (50%) | |||
| ≥30 ng/mL | 0 (0%) | 8 (44%) | 5 (31%) | |||
|
| ||||||
| 25OHD (UW) | 0.001 | 0.002 | 0.233 | |||
| <10 ng/mL | 5 (28%) | 2 (11%) | 1 (6%) | |||
| 10 to <20 ng/mL | 11 (61%) | 2 (11%) | 3 (19%) | |||
| 20 to <30 ng/mL | 1 (6%) | 9 (50%) | 7 (44%) | |||
| ≥30 ng/mL | 1 (6%) | 5 (28%) | 5 (31%) | |||
|
| ||||||
| 1,25OH2D pg/mL | 61.0 (48.1-75.9) | 61.8 (47.1-82.6) | 66.2 (46.8-78.9) | 0.671 | 0.562 | 0.144 |
|
| ||||||
| 24,25OH2D ng/mL | 0.5 (0.4-1.1) | 1.6 (1.1-2.6) | 1.8 (1.4-3.0) | <0.001 | <0.001 | 0.002 |
|
| ||||||
| 24,25OH2D:25OHD ratio | 0.05 (0.03-0.06) | 0.06 (0.05-0.08) | 0.07 (0.06-0.13) | <0.001 | <0.001 | 0.669 |
|
| ||||||
| Vitamin D binding protein ug/mL | 246.6 (223.7-259.6) | 239.0 (218.8-278.4) | 237.2 (215.4-275.8) | 0.393 | 0.211 | 0.464 |
|
| ||||||
| Free 25OHD pg/mL | 3.4 (1.9-5.7) | 6.3 (4.5-8.6) | 6.0 (4.5-8.8) | <0.001 | <0.001 | 0.074 |
|
| ||||||
| Bioavailable 25OHD ng/mL | 1.0 (0.4-1.2) | 2.1 (1.4-3.2) | 2.1 (1.3-3.3) | <0.001 | <0.001 | 0.193 |
Table 3:
Measures of mineral metabolism and clinical factors at the baseline and follow-up visits
| Factor | Baseline median (IQR) | 6 weeks median (IQR) | 12 weeks median (IQR) | P value week 6 vs baseline | P value week 12 vs baseline | P value week 12 vs week 6 |
|---|---|---|---|---|---|---|
| N | 18 | 18 | 16 | |||
| Ionized calcium mmol/L | 1.17 (1.15-1.21) | 1.20 (1.17-1.21) | 1.17 (1.13-1.19) | 0.193 | 0.599 | 0.276 |
| Serum total calcium mg/dL | 8.9 (8.6-9.1) | 9.2 (8.6-9.7) | 8.9 (8.6-9.3) | 0.082 | 0.410 | 0.624 |
| Serum phosphorus mg/dL | 4.2 (3.9-4.9) | 4.4 (4.2-4.9) | 4.4 (3.9-5.0) | 0.532 | 0.877 | 0.660 |
| Intact parathyroid hormone pg/mL | 45.7 (27.6-66.7) | ---- | 37.1 (32.1-54.4) | ---- | 0.706 | ---- |
| Fibroblast growth factor 23 pg/mL | 63.3 (51.6-91.4) | 61.9 (50.9-103.1) | 55.3 (47.6-99.7) | 0.523 | 0.252 | 0.074 |
| Serum albumin mg/dL | 3.4 (2.4-3.7) | 3.6 (3.2-4.1) | 3.3 (2.8-4.0) | 0.148 | 0.820 | 0.525 |
| eGFR ml/min/1.73m2 | 90.3 (70.4-110.3) | 80.4 (73.2-93.5) | 82.8 (63.4-112.4) | 0.468 | 0.782 | 0.298 |
| Urine protein:creatinine ratio | 2.8 (0.9-7.0) | 1.8 (0.7-7.1) | 2.8 (0.9-5.9) | 0.024 | 0.900 | 0.404 |
| Urine calcium:creatinine ratio | 0.02 (0.01-0.08) | 0.06 (0.02-0.11) | 0.02 (0.02-0.05) | 0.369 | 0.977 | 0.044 |
Cholecalciferol supplementation was discontinued in two participants at week 6: one for an ionized calcium of 1.36 mmol/L with a 25OHD concentration of 43.4 ng/mL (baseline 25OHD concentration was 11.4 ng/mL) and one for a phosphorus of 5.2 mg/dL with an associated 25OHD level of 52.2 ng/mL (baseline 25OHD concentration was 9.3 ng/mL). Both participants experienced subsequent declines in 25OHD concentration of more than 20 ng/mL after stopping the supplementation. The participant with mild hypercalcemia experienced a marked improvement in serum albumin between baseline and week 6 (2.7 to 4.4 g/dL) despite no change in proteinuria. The participant with mild hyperphosphatemia experienced remission from proteinuria and an associated improvement in serum albumin from baseline to week 6 (2.1 to 4.1 g/dL), although by week 12 had relapsed. Based on pill count data at the week 6 visit, we suspect that this participant over-consumed cholecalciferol. There were no other participants who experienced remission of proteinuria during the study period. Another participant experienced a decrease in 25OHD concentration from week 6 to week 12 of 25 ng/mL in the setting of acute worsening of proteinuria during that time (UPCR 2.6 to 6.0) and a decline in serum albumin from 3.9 to 2.5 g/dL. None of the participants developed hypercalciuria or vitamin D excess (serum 25OHD >80 ng/mL).
In multivariable GEE analysis, adjusting for age, sex, season of supplementation, VDBP isoform, eGFR, albumin, UPCR, and VDBP, 25OHD concentrations increased by 102% (95% CI: 64, 141) from baseline to week 6 and 96% (95% CI: 51, 140) from baseline to week 12 (Table 4) for the patients receiving cholecalciferol therapy. Results were qualitatively similar using the log-transformed 25OHD models, whether there were fewer or more adjustment covariates included in the model. In the final adjusted model, older age, higher eGFR, lower albumin, higher UPCR, having a Gc1f haplotype, and lower VDBP were also significantly associated with lower 25OHD levels during the study period. (Supplemental Table 1)
Table 4:
Mutually adjusted Generalized Estimating Equation to determine percent change in 25-hydroxyvitamin D concentration over the study period
| Variable | Mean Percentage Point Change in Vitamin D (95% CI) | P value |
|---|---|---|
| Visit | ||
| Week 6 Visit vs baseline | 102 (64, 141) | <0.001 |
| Week 12 Visit vs baseline | 96 (51, 140) | <0.001 |
Adjusted for baseline age, sex, supplementation season, Gc1f diplotype, eGFR, albumin, urine protein:cr and vitamin D binding protein. Exchangeable covariance assumed between visits from the same participant. Visits after discontinuation of calciferol supplementation were excluded from the analysis (2 visits).
Discussion
Vitamin D deficiency is highly prevalent in children with nephrotic syndrome [13] and may impact disease progression and complications.[7–10] Although there are other studies describing effective treatment of low vitamin D levels in children with nephrotic syndrome, these studies almost exclusively evaluated children who had steroid sensitive nephrotic syndrome.[18, 26] This study specifically evaluated cholecalciferol supplementation for vitamin D deficient children with persistent proteinuria secondary to glomerular disease. At the end of 12 weeks of supplementation, 25OHD concentrations significantly increased from baseline, without any serious adverse events and with very minimal changes in associated mineral metabolism. Additionally, there was a significant increase in bioavailable and free 25(OH)D. Vitamin D supplementation was discontinued in two participants after 6 weeks of supplementation for mild hypercalcemia and hyperphosphatemia respectively, in conjunction with 25OHD concentrations >30 ng/mL. Both participants experienced a concurrent improvement in serum albumin from the hypoalbuminemic to normal range, thereby highlighting the influence that serum albumin has on vitamin D status and associated labs of mineral metabolism. Both participants also subsequently experienced dramatic reductions in 25OHD concentrations to deficient levels with discontinuation of supplementation and ongoing or relapse of proteinuria, highlighting the strong influence of proteinuria on vitamin D levels. These examples also illustrate the need to re-examine vitamin D dosing when there is a marked change in either serum albumin or urine protein levels.
Despite supplementing vitamin D at doses similar to established CKD guidelines[33], most children failed to achieve a level ≥30 ng/mL after 12 weeks of supplementation, suggesting that our dosage algorithm may be inadequate. Non-adherence could explain the sub-optimal vitamin D levels achieved in many participants. It is unclear whether target vitamin D levels would be achieved with a more prolonged supplementation course since there was not a further significant increase in 25OHD concentration from week 6 to week 12.
In our study, despite the significant increase in 25OHD concentrations, there was not a significant decrease in PTH levels. This is consistent with prior literature on vitamin D supplementation in healthy adults and adults with CKD in which neither group demonstrated a change in PTH or FGF23 in response to increasing 25OHD concentrations.[41] In contrast, a study of pediatric patients with CKD, 17% of whom had glomerular disease, found that 6 weeks after supplementation with 60,000 IU of cholecalciferol divided over three days, the median PTH significantly decreased.[42] Our study’s lack of a change in PTH may be because, despite low 25OHD concentrations at baseline, the median PTH level was well below the threshold for hyperparathyroidism, as has been shown in other studies in children with nephrotic syndrome[43].
This study is strengthened by the evaluation of changes in 24,25OH2D, the product of CYP24A1-mediated catabolism of 25OHD that is stimulated by 1,25OH2D. The ratio of 24,25OH2D:25OHD significantly increased from baseline suggesting a change in vitamin D activity in addition to and beyond the change in 25OHD level.[44] 25OHD is not the active form of vitamin D and therefore, may not fully represent vitamin D receptor activity by 1,25OH2D. 24,25OH2D concentrations may reflect the downstream activity of 25OHD and thereby serve as a more meaningful indicator of tissue level vitamin D activity. This hypothesis is supported by a study of community dwelling adults that showed that 25OHD concentrations did not correlate with hip fracture, but higher 24,25OH2D concentrations and higher 24,25OH2D:25OHD ratios both correlated with a lower risk of hip fracture.[45] Lower 24,25OH2D:25OHD ratio was also found to be associated with all-cause mortality in a large cohort of adults with CKD.[46] Additonally, unlike 25OHD, the 24,25OH2D:25OHD metabolite ratio is independent of VDBP, [47] which may be affected in proteinuric states due to urinary losses.
To further evaluate the importance of vitamin D supplementation in the setting of nephrotic syndrome, we calculated the free and bioavailable 25(OH)D concentrations. Despite some concern that low vitamin D levels in the setting of nephrotic syndrome do not reflect a true vitamin D deficiency, we found low levels of free and bioavailable vitamin D levels in the participants at baseline suggesting a true deficiency. [41, 48–50] The free and bioavailable vitamin D levels significantly increased with supplementation. The relevance of free and bioavailable vitamin D to related outcomes has been previously reported.[12, 48, 50, 51] Contrary to our findings, a study by Banerjee et al did not find lower free 25(OH)D concentrations in participants with steroid sensitive nephrotic syndrome compared to controls , despite finding significantly lower levels of total 25(OH)D. This may be due to the different patient populations studied. The difference in findings highlight the importance of duration of proteinuria when supplementing with vitamin D, and the lack of generalizability between patients with steroid sensitive nephrotic syndrome and those with persistent proteinuria.
Limitations of this study include the small sample size, although we were able to detect significant correlates of response to vitamin D therapy. We also do not have a control group of participants with persistent proteinuria who were not supplemented with vitamin D over this time. Lastly, since we did not evaluate a longer course of therapy or analyze vitamin D concentration changes in relation to the supplementation dose, the best prescription to achieve sufficient vitamin D levels in this population is still not clear.
This is the first study evaluating the efficacy and safety of vitamin D supplementation in children with glomerular disease and persistent proteinuria. Altough vitamin D levels improved after 12 weeks of supplementation in the setting of ongoing proteinuria, vitamin D levels remained <20 ng/ml in almost 20% of the cohort. The NKF suggested dosing regimen for CKD did not reliably achieve goal vitamin D levels ≥30 ng/mL in persistently proteinuric children with glomerular disease. The ideal vitamin D regimen to achieve higher rates of vitamin D sufficiency in this population still needs to be determined.
Supplementary Material
Ackowledgements:
The authors would like to thank Amy York, PA and Maryjane Benton, RN, BSN for their assistance with study coordination and project management.
Funding:
This was work was supported by K23 DK093556 and the Nephcure Foundation-American Society of Nephrology Research Grant (PI: Michelle Denburg). Statistical analysis was supported by The Children’s Hospital of Philadelphia Pediatric Center of Excellence in Nephrology (P50 DK114786). The content is solely the responsibility of the authors and does not necessarily represent the official views of the National Institutes of Health, Nephcure Foundation or the American Society of Nephrology.
Footnotes
The authors do not have any conflicts of interest to disclose.
References:
- 1.Adedoyin O, Frank R, Vento S, Vergara M, et al. (2004) Cardiac disease in children with primary glomerular disorders - Role of focal segmental glomerulosclerosis. Pediatr. Nephrol 19:408–412 [DOI] [PubMed] [Google Scholar]
- 2.Ashoor IF, Mansfield SA, O’Shaughnessy MM, Parekh RS, et al. (2019) Prevalence of Cardiovascular Disease Risk Factors in Childhood Glomerular Diseases. J Am Heart Assoc 8:e012143. 10.1161/JAHA.119.012143 [DOI] [PMC free article] [PubMed] [Google Scholar]
- 3.Rheault MN, Zhang L, Selewski DT, Kallash M, et al. (2015) AKI in Children Hospitalized with Nephrotic Syndrome. Clin J Am Soc Nephrol 10:2110–2118. 10.2215/CJN.06620615 [DOI] [PMC free article] [PubMed] [Google Scholar]
- 4.Kyrieleis HAC, Löwik MM, Pronk I, Cruysberg HRM, et al. (2009) Long-term outcome of biopsy-proven, frequently relapsing minimal-change nephrotic syndrome in children. Clin J Am Soc Nephrol 4:1593–600. 10.2215/CJN.05691108 [DOI] [PMC free article] [PubMed] [Google Scholar]
- 5.Kerlin BA, Blatt NB, Fuh B, Zhao S, et al. (2009) Epidemiology and risk factors for thromboembolic complications of childhood nephrotic syndrome: a Midwest Pediatric Nephrology Consortium (MWPNC) study. J Pediatr 155:105–10, 110.e1. 10.1016/j.jpeds.2009.01.070 [DOI] [PMC free article] [PubMed] [Google Scholar]
- 6.Zhang Q, Zeng C, Cheng Z, Xie K, et al. (2012) Primary focal segmental glomerulosclerosis in nephrotic patients: common complications and risk factors. J Nephrol 25:679–688. 10.5301/jn.5000040 [DOI] [PubMed] [Google Scholar]
- 7.Chonchol M, Scragg R (2007) 25-Hydroxyvitamin D, insulin resistance, and kidney function in the Third National Health and Nutrition Examination Survey. Kidney Int 71:134–139. 10.1038/sj.ki.5002002 [DOI] [PubMed] [Google Scholar]
- 8.Lac PT, Choi K, Liu I-A, Meguerditchian S, et al. (2010) The effects of changing vitamin D levels on anemia in chronic kidney disease patients: a retrospective cohort review. Clin Nephrol 74:25–32. 10.5414/CNP74025 [DOI] [PubMed] [Google Scholar]
- 9.Holick MF (2008) The vitamin D deficiency pandemic and consequences for nonskeletal health: mechanisms of action. Mol Aspects Med 29:361–8. 10.1016/j.mam.2008.08.008 [DOI] [PMC free article] [PubMed] [Google Scholar]
- 10.Holick MF (2007) Vitamin D Deficiency. N Engl J Med 357:266–281. 10.1056/NEJMra070553 [DOI] [PubMed] [Google Scholar]
- 11.Cetin N, Gencler A, Sivrikoz IA (2019) Bone mineral density and vitamin D status in children with remission phase of steroid-sensitive nephrotic syndrome. Saudi J Kidney Dis Transpl 30:853–862. 10.4103/1319-2442.265461 [DOI] [PubMed] [Google Scholar]
- 12.Aggarwal A, Yadav AK, Ramachandran R, Kumar V, et al. (2016) Bioavailable vitamin D levels are reduced and correlate with bone mineral density and markers of mineral metabolism in adults with nephrotic syndrome. Nephrology 21:483–489. 10.1111/nep.12638 [DOI] [PubMed] [Google Scholar]
- 13.Selewski DT, Chen A, Shatat IF, Pais P, et al. (2016) Vitamin D in incident nephrotic syndrome: a Midwest Pediatric Nephrology Consortium study. Pediatr Nephrol 31:465–472. 10.1007/s00467-015-3236-x [DOI] [PMC free article] [PubMed] [Google Scholar]
- 14.Kuhlmann A, Haas CS, Gross M-L, Reulbach U, et al. (2004) 1,25-Dihydroxyvitamin D 3 decreases podocyte loss and podocyte hypertrophy in the subtotally nephrectomized rat. Am J Physiol Physiol 286:F526–F533. 10.1152/ajprenal.00316.2003 [DOI] [PubMed] [Google Scholar]
- 15.Susantitaphong P, Nakwan S, Peerapornratana S, Tiranathanagul K, et al. (2017) A double-blind, randomized, placebo-controlled trial of combined calcitriol and ergocalciferol versus ergocalciferol alone in chronic kidney disease with proteinuria. BMC Nephrol 18: 10.1186/s12882-017-0436-6 [DOI] [PMC free article] [PubMed] [Google Scholar]
- 16.Liyanage P, Lekamwasam S, Weerarathna T, Liyanage C (2018) Effect of Vitamin D therapy on urinary albumin excretion, renal functions, and plasma renin among patients with diabetic nephropathy: A randomized, double-blind clinical trial. J Postgrad Med 64:10–15. 10.4103/jpgm.JPGM_598_16 [DOI] [PMC free article] [PubMed] [Google Scholar]
- 17.Gulati S, Sharma RK, Gulati K, Singh U, et al. (2005) Longitudinal follow-up of bone mineral density in children with nephrotic syndrome and the role of calcium and vitamin D supplements. Nephrol Dial Transplant 20:1598–1603. 10.1093/ndt/gfh809 [DOI] [PubMed] [Google Scholar]
- 18.Bak M, Serdaroglu E, Guclu R (2006) Prophylactic calcium and vitamin D treatments in steroid-treated children with nephrotic syndrome. Pediatr Nephrol 21:350–354. 10.1007/s00467-005-2118-z [DOI] [PubMed] [Google Scholar]
- 19.Choudhary S, Agarwal I, Seshadri MS (2014) Calcium and vitamin D for osteoprotection in children with new-onset nephrotic syndrome treated with steroids: a prospective, randomized, controlled, interventional study. Pediatr Nephrol 29:1025–1032. 10.1007/s00467-013-2720-4 [DOI] [PubMed] [Google Scholar]
- 20.Singh DN, Krishnamurthy S, Kamalanathan SK, Harichandrakumar KT, et al. (2018) Three-monthly bolus vitamin D supplements (1000 vs 400 IU/day) for prevention of bone loss in children with difficult-to-treat nephrotic syndrome: a randomised clinical trial. Paediatr Int Child Health 38:251–260. 10.1080/20469047.2018.1505589 [DOI] [PubMed] [Google Scholar]
- 21.Eknoyan G, Levin A, Levin NW (2003) Bone metabolism and disease in chronic kidney disease. Am J Kidney Dis 42:1–201. 10.1016/s0272-6386(03)00905-3 [DOI] [Google Scholar]
- 22.Shroff R, Wan M, Nagler EV, Bakkaloğlu S, et al. (2017) Clinical practice recommendations for native Vitamin D therapy in children with chronic kidney disease Stages 2-5 and on dialysis. Nephrol Dial Transplant 32:1098–1113. 10.1093/ndt/gfx065 [DOI] [PMC free article] [PubMed] [Google Scholar]
- 23.GOLDSTEIN DA, HALDIMANN B, SHERMAN D, NORMAN AW, et al. (1981) Vitamin D Metabolites and Calcium Metabolism in Patients with Nephrotic Syndrome and Normal Renal Function*. J Clin Endocrinol Metab 52:116–121. 10.1210/jcem-52-1-116 [DOI] [PubMed] [Google Scholar]
- 24.Barragry JM, France MW, Carter ND, Auton JA, et al. (1977) Vitamin-D metabolism in nephrotic syndrome. Lancet (London, England) 2:629–32. 10.1016/s0140-6736(77)92498-9 [DOI] [PubMed] [Google Scholar]
- 25.Schmidt-Gayk H, Grawunder C, Tschöpe W, Schmitt W, et al. (1977) 25-HYDROXY-VITAMIN-D IN NEPHROTIC SYNDROME. Lancet 310:105–108. 10.1016/S0140-6736(77)90118-0 [DOI] [PubMed] [Google Scholar]
- 26.Banerjee S, Basu S, Sen A, Sengupta J (2017) The effect of vitamin D and calcium supplementation in pediatric steroid-sensitive nephrotic syndrome. Pediatr Nephrol 32:2063–2070. 10.1007/s00467-017-3716-2 [DOI] [PubMed] [Google Scholar]
- 27.Muske S, Krishnamurthy S, Kamalanathan SK, Rajappa M, et al. (2018) Effect of two prophylactic bolus vitamin D dosing regimens (1000 IU/day vs. 400 IU/day) on bone mineral content in new-onset and infrequently-relapsing nephrotic syndrome: a randomised clinical trial. Paediatr Int Child Health 38:23–33. 10.1080/20469047.2017.1319528 [DOI] [PubMed] [Google Scholar]
- 28.Banerjee S, Basu S, Sengupta J (2013) Vitamin D in nephrotic syndrome remission: A case-control study. Pediatr Nephrol 28:1983–1989. 10.1007/s00467-013-2511-y [DOI] [PubMed] [Google Scholar]
- 29.Iyengar A, Kamath N, Reddy HV, Sharma J, et al. (2020) Determining the optimal cholecalciferol dosing regimen in children with CKD: a randomized controlled trial. Nephrol Dial Transplant. 10.1093/NDT/GFAA369 [DOI] [PubMed] [Google Scholar]
- 30.Haldimann B, Healy M, Jelliffe R, Goldstein DA, Pattabhiraman R <assry SG. (1980) Effect of an Oral Dose of 25-Hydroxyvitamin D3 on Its Blood Levels in Patients with the Nephrotic Syndrome. J Clin Endocrinol Metab 50: [DOI] [PubMed] [Google Scholar]
- 31.Schwartz GJ, Muñoz A, Schneider MF, Mak RH, et al. (2009) New equations to estimate GFR in children with CKD. J Am Soc Nephrol 20:629–37. 10.1681/ASN.2008030287 [DOI] [PMC free article] [PubMed] [Google Scholar]
- 32.Levey AS, Stevens LA, Schmid CH, Zhang YL, et al. (2009) A new equation to estimate glomerular filtration rate. Ann Intern Med 150:604–12 [DOI] [PMC free article] [PubMed] [Google Scholar]
- 33.Rucker D, Tonelli M, Coles MG, Yoo S, et al. Vitamin D insufficiency and treatment with oral vitamin D3 in northern-dwelling patients with chronic kidney disease. J Nephrol 22:75–82 [PubMed] [Google Scholar]
- 34.Feskanich D, Sielaff BH, Chong K, Buzzard IM (1989) Computerized collection and analysis of dietary intake information. Comput Methods Programs Biomed 30:47–57. 10.1016/0169-2607(89)90122-3 [DOI] [PubMed] [Google Scholar]
- 35.Laha TJ, Strathmann FG, Wang Z, De Boer IH, et al. (2012) Characterizing antibody cross-reactivity for immunoaffinity purification of analytes prior to multiplexed liquid chromatography-tandem mass spectrometry. Clin Chem 58:1711–1716. 10.1373/clinchem.2012.185827 [DOI] [PMC free article] [PubMed] [Google Scholar]
- 36.Arnaud J, Constans J (1993) Affinity differences for vitamin D metabolites associated with the genetic isoforms of the human serum carrier protein (DBP). Hum Genet 92:183–188. 10.1007/BF00219689 [DOI] [PubMed] [Google Scholar]
- 37.Henderson CM, Lutsey PL, Misialek JR, Laha TJ, et al. (2016) Measurement by a novel LC-MS/MS methodology reveals similar serum concentrations of Vitamin D-binding protein in blacks and whites. Clin Chem 62:179–187. 10.1373/clinchem.2015.244541 [DOI] [PMC free article] [PubMed] [Google Scholar]
- 38.Speeckaert MM, Speeckaert R, van Geel N, Delanghe JR (2014) Vitamin D binding protein. A multifunctional protein of clinical importance. Adv Clin Chem 63:1–57. 10.1016/B978-0-12-800094-6.00001-7 [DOI] [PubMed] [Google Scholar]
- 39.Powe CE, Evans MK, Wenger J, Zonderman AB, et al. (2013) Vitamin D-binding protein and vitamin D status of black Americans and white Americans. N Engl J Med 369:1991–2000. 10.1056/NEJMOA1306357 [DOI] [PMC free article] [PubMed] [Google Scholar]
- 40.Pierce CB, Muñoz A, Ng DK, Warady BA, et al. (2020) Age- and sex-dependent clinical equations to estimate glomerular filtration rates in children and young adults with chronic kidney disease. Kidney Int. 10.1016/j.kint.2020.10.047 [DOI] [PMC free article] [PubMed] [Google Scholar]
- 41.Batacchi Z, Robinson-Cohen C, Hoofnagle AN, Isakova T, et al. (2017) Effects of vitamin D2 supplementation on vitamin D3 metabolism in health and CKD. Clin J Am Soc Nephrol 12:1498–1506. 10.2215/CJN.00530117 [DOI] [PMC free article] [PubMed] [Google Scholar]
- 42.Hari P, Gupta N, Hari S, Gulati A, et al. (2010) Vitamin D insufficiency and effect of cholecalciferol in children with chronic kidney disease. Pediatr Nephrol 25:2483–2488. 10.1007/s00467-010-1639-2 [DOI] [PubMed] [Google Scholar]
- 43.Weng FL, Shults J, Herskovitz RM, Zemel BS, et al. (2005) Vitamin D insufficiency in steroid-sensitive nephrotic syndrome in remission. Pediatr Nephrol 20:56–63. 10.1007/s00467-004-1694-7 [DOI] [PubMed] [Google Scholar]
- 44.Bosworth CR, Levin G, Robinson-Cohen C, Hoofnagle AN, et al. (2012) The serum 24,25-dihydroxyvitamin D concentration, a marker of vitamin D catabolism, is reduced in chronic kidney disease. Kidney Int 82:693–700. 10.1038/ki.2012.193 [DOI] [PMC free article] [PubMed] [Google Scholar]
- 45.Ginsberg C, Katz R, de Boer IH, Kestenbaum BR, et al. (2018) The 24,25 to 25-hydroxyvitamin D ratio and fracture risk in older adults: The cardiovascular health study. Bone 107:124–130. 10.1016/j.bone.2017.11.011 [DOI] [PMC free article] [PubMed] [Google Scholar]
- 46.Bansal N, Katz R, Appel L, Denburg M, et al. (2019) Vitamin D Metabolic Ratio and Risks of Death and CKD Progression. Kidney Int Reports 4:1598–1607. 10.1016/j.ekir.2019.08.014 [DOI] [PMC free article] [PubMed] [Google Scholar]
- 47.Ginsberg C, Hoofnagle AN, Katz R, Becker JO, et al. (2021) The Vitamin D Metabolite Ratio Is Independent of Vitamin D Binding Protein Concentration. Clin Chem 67:385–393. 10.1093/CLINCHEM/HVAA238 [DOI] [PMC free article] [PubMed] [Google Scholar]
- 48.Rebholz CM, Grams ME, Lutsey PL, Hoofnagle AN, et al. (2016) Biomarkers of Vitamin D Status and Risk of ESRD. Am J Kidney Dis 67:235–242. 10.1053/J.AJKD.2015.08.026 [DOI] [PMC free article] [PubMed] [Google Scholar]
- 49.Ko DH, Jun SH, Nam Y, Song SH, et al. (2021) Multiplex LC–MS/MS for simultaneous determination of 25-hydroxyvitamin D, 24,25-dihydroxyvitamin D3, albumin, and vitamin D-binding protein with its isoforms: One-step estimation of bioavailable vitamin D and vitamin D metabolite ratio. J Steroid Biochem Mol Biol 206:105796. 10.1016/J.JSBMB.2020.105796 [DOI] [PubMed] [Google Scholar]
- 50.Robinson-Cohen C, Zelnick LR, Hoofnagle AN, Lutsey PL, et al. (2017) Associations of Vitamin D-Binding Globulin and Bioavailable Vitamin D Concentrations With Coronary Heart Disease Events: The Multi-Ethnic Study of Atherosclerosis (MESA). J Clin Endocrinol Metab 102:3075–3084. 10.1210/JC.2017-00296 [DOI] [PMC free article] [PubMed] [Google Scholar]
- 51.Powe CE, Ricciardi C, Berg AH, Erdenesanaa D, et al. (2011) Vitamin D-binding protein modifies the vitamin D-bone mineral density relationship. J Bone Miner Res 26:1609–1616. 10.1002/JBMR.387 [DOI] [PMC free article] [PubMed] [Google Scholar]
Associated Data
This section collects any data citations, data availability statements, or supplementary materials included in this article.