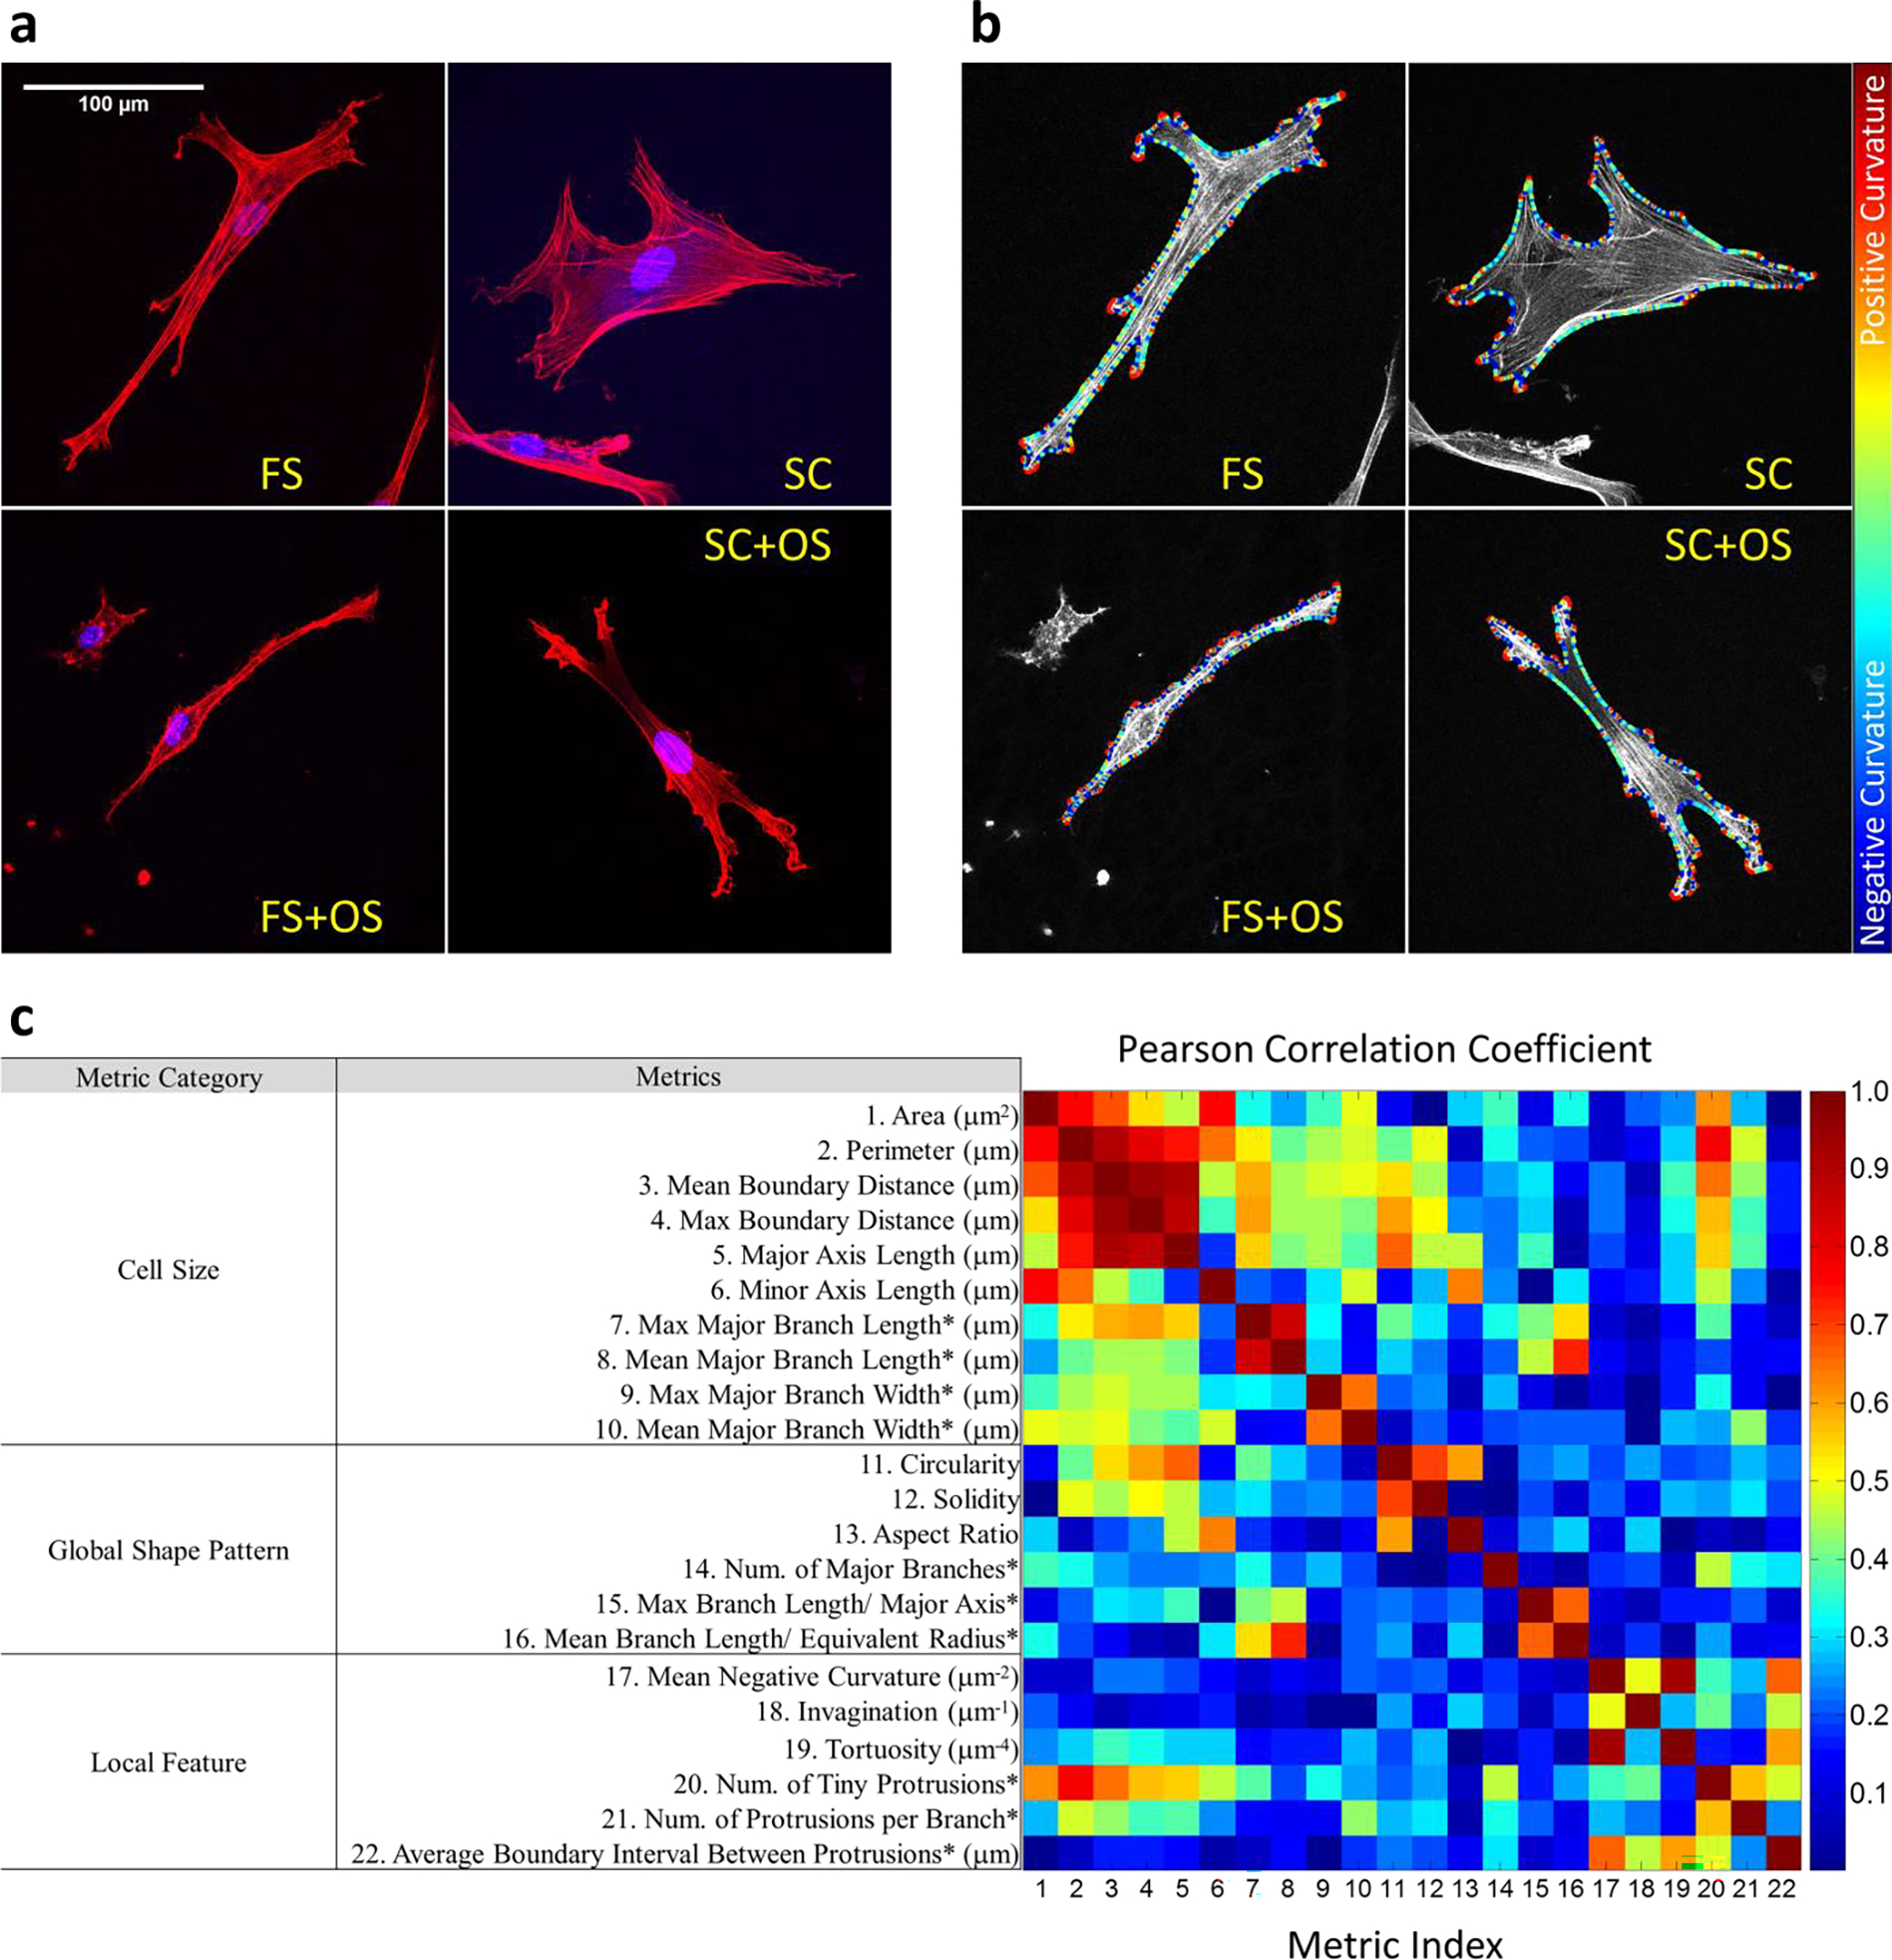
Fig 2.

(2-column). Quantification of cell shapes in different microenvironment (FS and SC with or without OS). (a) Maximum intensity projections of the confocal z-stack images (red: actin, blue: nucleus). (b) Outlines of hBMSCs were obtained with snake algorithm which allowed calculation of local curvature. Boundary regions were colored differently according to local curvatures. (c) 22 metrics were quantified to describe hBMSCs shapes and sorted into 3 categories about different aspects of cell shape. 12 metrics were obtained with the snake outlines (without asterisks) and 10 metrics were obtained from branch analysis (with asterisks). The correlations between shape metrics were calculated with Pearson correlation coefficient.
