

Abstract
We introduce a new procedure for the efficient isolation and subsequent separation of double-wall carbon nanotubes (DWCNTs). A simplified, rate zonal ultracentrifugation (RZU) process is first applied to obtain samples of highly-enriched DWCNTs from a raw carbon nanotube material that has both single- and double-wall carbon nanotubes. Using this purified DWCNT suspension, we demonstrate for the first time that DWCNTs can be further processed using aqueous two-phase extraction (ATPE) for sequential separation by electronic structure and diameter. Additionally, we introduce analytical ultracentrifugation (AUC) as a new method for DWCNT characterization to assess DWCNT purity in separated samples. Results from AUC analysis are utilized to compare two DWCNT separation schemes. We find that RZU processing followed by sequential bandgap and diameter sorting via ATPE provides samples of highest DWCNT enrichment, whereas single-step redox sorting of the same raw material through ATPE yields SWCNT/DWCNT mixtures of similar diameter and electronic character. The presented methods offer significant advancement in DWCNT processing and separation while also providing a promising alternative for DWCNT sample analysis.
Introduction
Double-wall carbon nanotubes (DWCNTs) are comprised of two coaxially aligned single-wall carbon nanotubes (SWCNTs) separated by an interwall distance of ≈ 0.34 nm. This unique carbon nanomaterial exists in an intermediate regime between that of SWCNTs and multi-wall carbon nanotubes (MWCNTs), possessing properties that relate to both types of materials.1–2 This makes DWCNTs advantageous for a variety of different electronic applications including transparent conducting thin films,3–4 single nanotube5–7 and thin film field effect transistors (FETs),8–9 and field emission devices.10–12 The presence of a shielding outer wall is especially appealing for chemical and biological sensors, as it allows for chemical modification of the outer shell while maintaining the electrical properties of the inner pristine core.13–15 In a recent report, Huang et al. fabricated thin film transistors using carboxylic acid functionalized DWCNTs, demonstrating high selectivity for amine-containing analytes.16 Additionally, from a fundamental point of view, the electronic coupling between the two walls of a DWCNT make it an interesting model system for investigating many physical and chemical properties of low-dimensional materials.
Despite promising advancements, fundamental study and applications development has largely been hindered by current methods of DWCNT synthesis that produce significant amounts of SWCNTs, MWCNTS, and other carbonaceous contaminants. This has led researchers to direct their efforts towards methods of DWCNT purification, oftentimes leaning on previous approaches that have been successful for the separation of SWCNTs.3–4, 6, 8, 17–19 An example of such a technique is density gradient ultracentrifugation (DGU), which applies a strong centripetal force to drive carbon nanotubes to their isopycnic positions, i.e., where the buoyant density of the nanotube matches that of the surrounding density gradient medium.20–22 The buoyant densities of carbon nanotubes are dependent on a variety of factors including physical structure, electronic character, and surfactant coating. Due to density contributions of additional inner walls, Green and Hersam first showed in 2009 that it was possible to separate sodium cholate (SC) dispersed carbon nanotubes by wall number through isopycnic DGU.3 Subsequent studies by Huh et al. and again by Green and Hersam demonstrated that modified density gradient profiles could be applied to fractionate DWCNTs by length4 and also sort by electronic type.4, 8 Other methods which have been utilized for DWCNT enrichment include gel chromatography,6, 18 diameter-dependent covalent modification,23–24 and selective extraction by chiral diporphyrins.19 Although these methods represent significant advancement in DWCNT separation, further improvement in mass throughput, time efficiency, and sample purity are still necessary. Consequently, the development of alternative DWCNT post-synthesis processing methods is still of considerable interest and importance.
Aqueous two-phase extraction (ATPE) has recently been demonstrated to facilitate the separation of specific SWCNT subpopulations through the robust and spontaneous partitioning of nanotubes between two separated poly(ethylene glycol) (PEG) and dextran (DX) aqueous polymer phases.25 We have previously shown that a co-surfactant system of sodium dodecyl sulfate (SDS) and sodium deoxycholate (DOC) enables the iterative diameter-dependent fractionation of both small (<1 nm) and larger (up to at least 1.7 nm) diameter SWCNT species.26–27 Additionally, by substituting SC for DOC, partitioning by electronic type is observed.25 This behavior can be optimized and readily tuned through redox chemistry to more finely sort SWCNTS according to the magnitude of their electronic band gap.28 Significant advantages of ATPE over previously published nanotube separation techniques include industrial scalability, high resolution for extracting even the lowest abundance species, and the availability of instrumentation such as counter current chromatography (CCC) for automated multistage separation.29
We report here the extension of ATPE for the efficient isolation and high purity separation of DWCNTs. Surfactant dispersed DWCNTs are first isolated from raw material (containing both single- and double-wall species) by sedimentation rate through a simplified rate zonal ultracentrifugation (RZU) process. Next, ATPE is applied to sort the purified DWCNT material - first by electronic structure and then by diameter. These results demonstrate a significant advancement in mass throughput and purity. To better assess the extent of DWCNT enrichment, we introduce analytical ultracentrifugation (AUC) as a quantifiable technique for the characterization of purified samples from two contrasting separation schemes. We find that a single-step ATPE redox separation of the same raw material results in a mixture of SWCNTs and DWCNTs of similar diameter and electronic structure, whereas a combination of RZU, ATPE redox, and ATPE diameter sorting yields samples of high DWCNT purity.
Results and discussion
DWCNT isolation using rate zonal ultracentrifugation
Unlike isopycnic DGU where particles are separated by buoyant density, RZU relies on differences in sedimentation rate. This method has been previously applied as a pre-purification step to remove small nanotube aggregates, isolate empty from water-filled SWCNTs,30 and eliminate morphologically damaged nanotubes containing kinks and other structural defects.31 We demonstrate here that a similar method can be applied to isolate carbon nanotubes by wall number. Raw nanotubes consisting of a mixture of SWCNTs and DWCNTs were individualized in 10 g/L (1 %) DOC using a combination of sonication and centrifugation (Experimental Methods). For RZU processing, the resulting parent material was loaded on top of a single stepped race layer consisting of 25 % (m/v) iodixanol and 1 % DOC. The separation was then run at 5240 rad/s for 3.5 h. Fig. 1a shows a photograph of the setup before and after RZU. Although difficult to discern due to the high concentrations of nanotubes, close inspection by eye reveals distinct sedimentation bands located at different positions down the centrifuge tube. The absorption spectra of the parent material and that of fractions 3, 5 and 6 (F3, F5, and F6 in Fig. 1a) are displayed in Fig. 1b. The upper F3 band exhibits multiple sharp absorption features located in the visible and near infrared regions that can be attributed to semiconducting and metallic SWCNTs with diameters ranging from (0.7 to 1.1) nm. In contrast, F5 shows much broader peaks ranging from (640 to 850) nm and (900 to 1300) nm, indicative of metallic M11 and semiconducting S22 transitions, respectively, for SWCNTs with larger average diameters of ≈ 1.6 nm. Based on the absorption spectra, band F6 appears to consist primarily of DWCNTs and contains large diameter absorption features corresponding to outer-wall electronic transitions. This claim is supported by a sharp inner-wall transition located at ≈ 1190 nm and broad S33 semiconducting outer-wall transitions (in the spectral range of ≈ (470 to 600) nm) that are signature of many DWCNT spectra published in the literature.3–4, 18 The order of banding down the centrifuge tube follows as expected, with the largest density DWCNTs sedimenting the furthest followed by the larger diameter and then smaller diameter SWCNTs. Absorption spectra of fractions collected above F3 and below F6 (Fig. S1) are mostly featureless and contain small carbonaceous impurities and denser nanotube aggregates, respectively. The absorption spectrum of band F4 (Fig. S1) contains a mixture of both sharp and broad features and is therefore thought to be comprised of a combination of small and large diameter SWCNTs. Fig. 1c,d show Raman spectra acquired for the separated DWCNTs using excitation wavelengths of 514 nm and 633 nm. From the radial breathing modes (RBMs), it is possible to obtain an estimation of nanotube diameter using the relation32 , where is the RBM frequency, is nanotube diameter, C1 = (215 cm−1 ± 2) cm−1, and C2 = (18 ± 2). RBMs in the range of 125 cm−1 to 200 cm−1 (blue shaded region in Fig. 1c,d) correspond to larger diameter SWCNTs and/or the outer walls of DWCNTs (≈ 1.2 nm to 2.0 nm) while RBMs ranging from 200 cm−1 to 350 cm−1 arise from smaller diameter SWCNTs and/or the inner walls of DWCNTs (≈ 0.7 nm to 1.2 nm). We note that even after the removal of the majority of smaller diameter SWCNTs through RZU, many RBMs remain in the small diameter region, suggesting that these correspond to the inner walls of DWCNTs.
Fig. 1.
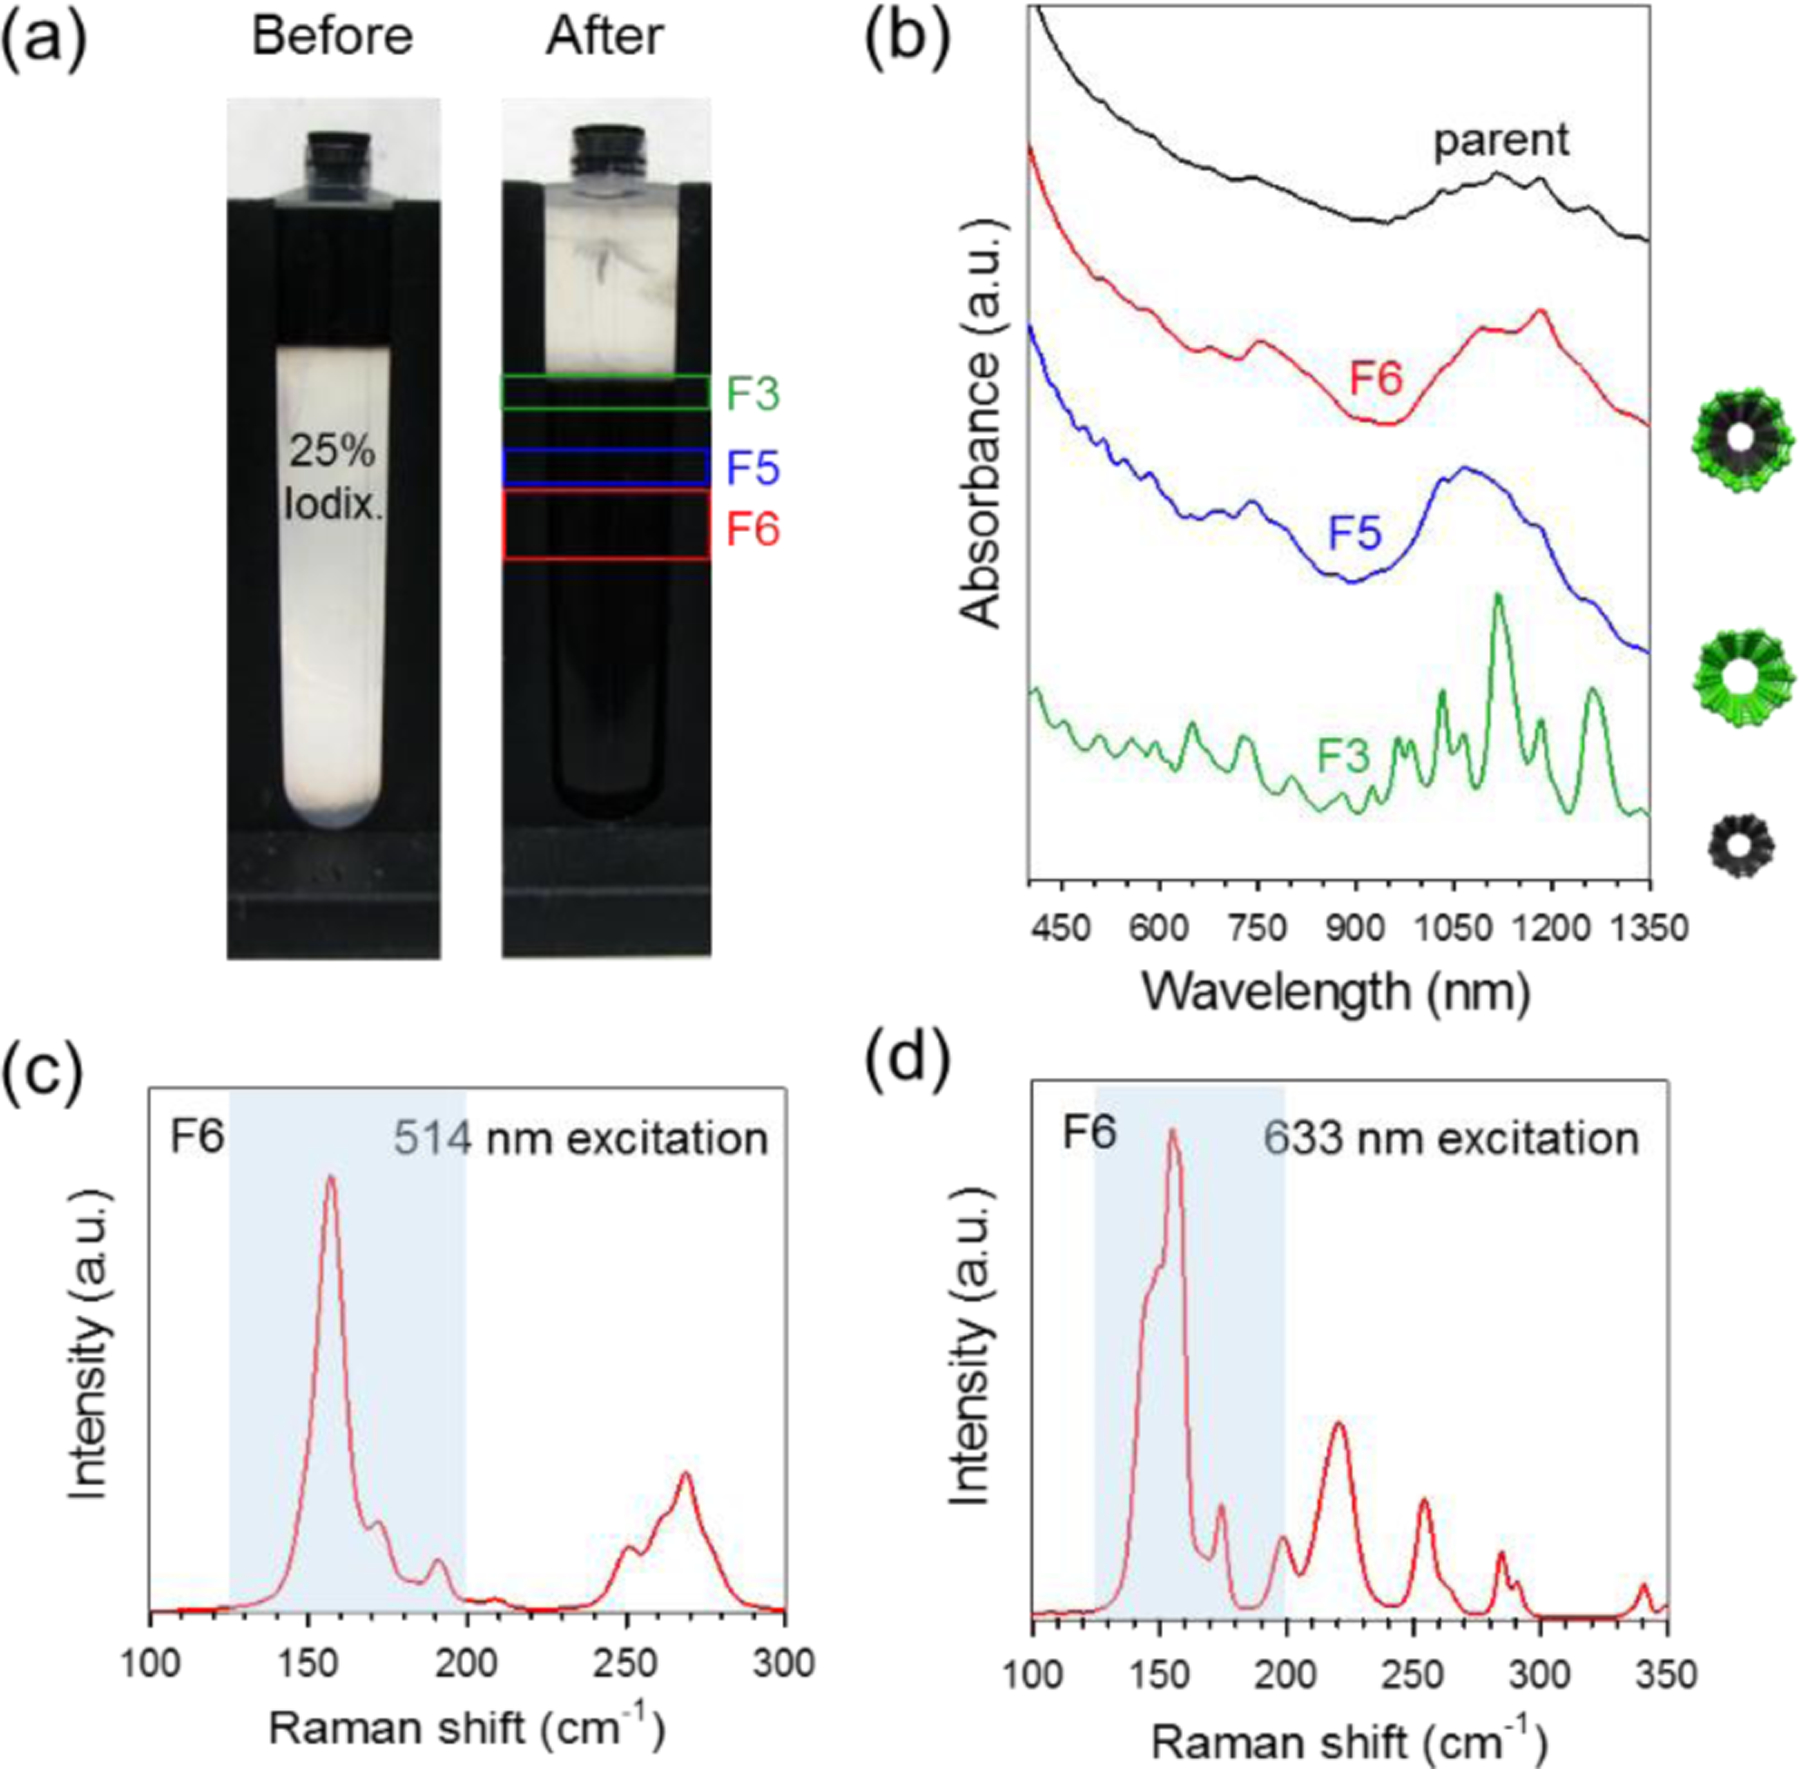
RZU separation of the SWCNT-DWCNT parent mixture. (a) Photograph of the centrifuge tube before and after RZU separation. Fractions F3, F5, and F6 show location and size of sedimentation bands containing small diameter SWCNTs, large diameter SWCNTs, and DWCNTs, respectively. (b) Absorption spectra of parent dispersion and of RZU fractions F3, F5, and F6. Spectra are normalized and offset for easy comparison. (c) Raman spectra of the RBM region for fraction F6 using 514 nm and 633 nm (d) excitation. Light blue shaded regions denote RBM intensities relating to DWCNT outer walls. After removal of SWCNTs through RZU, small diameter inner-wall RBMs are still visible, suggesting the presence of DWCNTs.
Similar to isopycnic DGU, we have shown RZU can successfully separate DWCNTs from SWCNTs but with several distinct advantages. Firstly, only 3.5 h is required for separation as opposed to the typical (12 to 19) h for isopycnic DGU, where longer times are needed for a particle to reach its equilibrium buoyant density. The use of a vertical rotor in our study also helps in this regard because higher centripetal accelerations are achieved. Secondly, the RZU separation is significantly simpler and cheaper in that only a single race layer is applied which utilizes less of the expensive density modifier iodixanol. Finally, the use DOC dispersed nanotubes allows for greater nanotube stability and thus higher mass loading as well as throughput. The latter has enabled the further purification of our DWCNT samples by ATPE for which we now describe.
Sequential Electronic structure and diameter sorting of DWCNTs by ATPE
Carbon nanotube separation using ATPE is based on the preferential affinity of the nanotubes for one of the two aqueous polymer phases. We and others have demonstrated that partitioning behavior is governed by a variety of factors including polymer concentration, salts, temperature, and surfactant composition.25, 33 In the case of sorting by electronic type, we additionally have shown that electron transfer between redox molecules and SWCNTs initiates reorganization of the coating layer composed of surfactants and counterions, leading to strong electronic bandgap-dependent partitioning.28 In the presence of an oxidizing agent and a co-surfactant mixture of SC and SDS, more readily oxidized nanotube structures (smaller bandgap quasi-metals/metals) thermodynamically prefer the bottom, dextran-rich (DX-rich) phase while relatively more reduced nanotubes (larger bandgap semiconductors) reside in the top PEG-rich phase. Using procedures previously reported for SWCNTs,28 DWCNTs were first sorted by electronic character through ATPE utilizing a PEG, DX, SC and SDS system. After the addition of 0.4 mmol/L NaClO, larger bandgap DWCNTs were observed to partition to the top PEG-rich phase while smaller bandgap DWCNTs were found in the lower DX-rich phase. To further improve purity, multiple iterations were applied by adding either mimic bottom or top phase mixtures (created at the same compositions of PEG, DX, SC, SDS, and NaClO) to the DWCNT containing opposite phases. Absorption spectra of the separated fractions are displayed in Fig. 2a and confirm our electronic type assignment. To avoid later confusion, we henceforth identify specific DWCNT electronic transitions as , where specifies electronic character ( for semiconducting and for metallic), ii relates to an exact transition (i.e., 1 ➔ 1 or 2 ➔ 2), and refers to either the inner (i) or outer () wall. DWCNTs found in the top PEG-rich phase show strong absorptions centered at (2000 and 1140) nm corresponding to and electronic transitions, respectively. Most notable is the lack of absorption located in the (600 to 900) nm region. Contrastingly, the absorption spectrum of DWCNTs in the lower DX-rich phase display opposite behavior, with a pronounced peak and greatly suppressed absorption for the and peaks. Reflecting the absorptions of their outer walls, semiconducting outer-wall DWCNTs are observed to be dark purple whereas metallic outer-wall DWCNTs appear a forest green (Fig. 2b). The absorption spectra are in good agreement with those reported for DWCNT electronic-type enrichment by DGU8 and gel chromatography.6 Given that these methods also utilize a co-surfactant system of SDS and SC, we suggest that redox modulation of the surfactant coating is a generalized mechanism inherent in many surfactant-based DWCNT separation schemes. Careful redox control should lead to greater reproducibility and potentially higher resolution when applying these techniques.
Fig. 2.
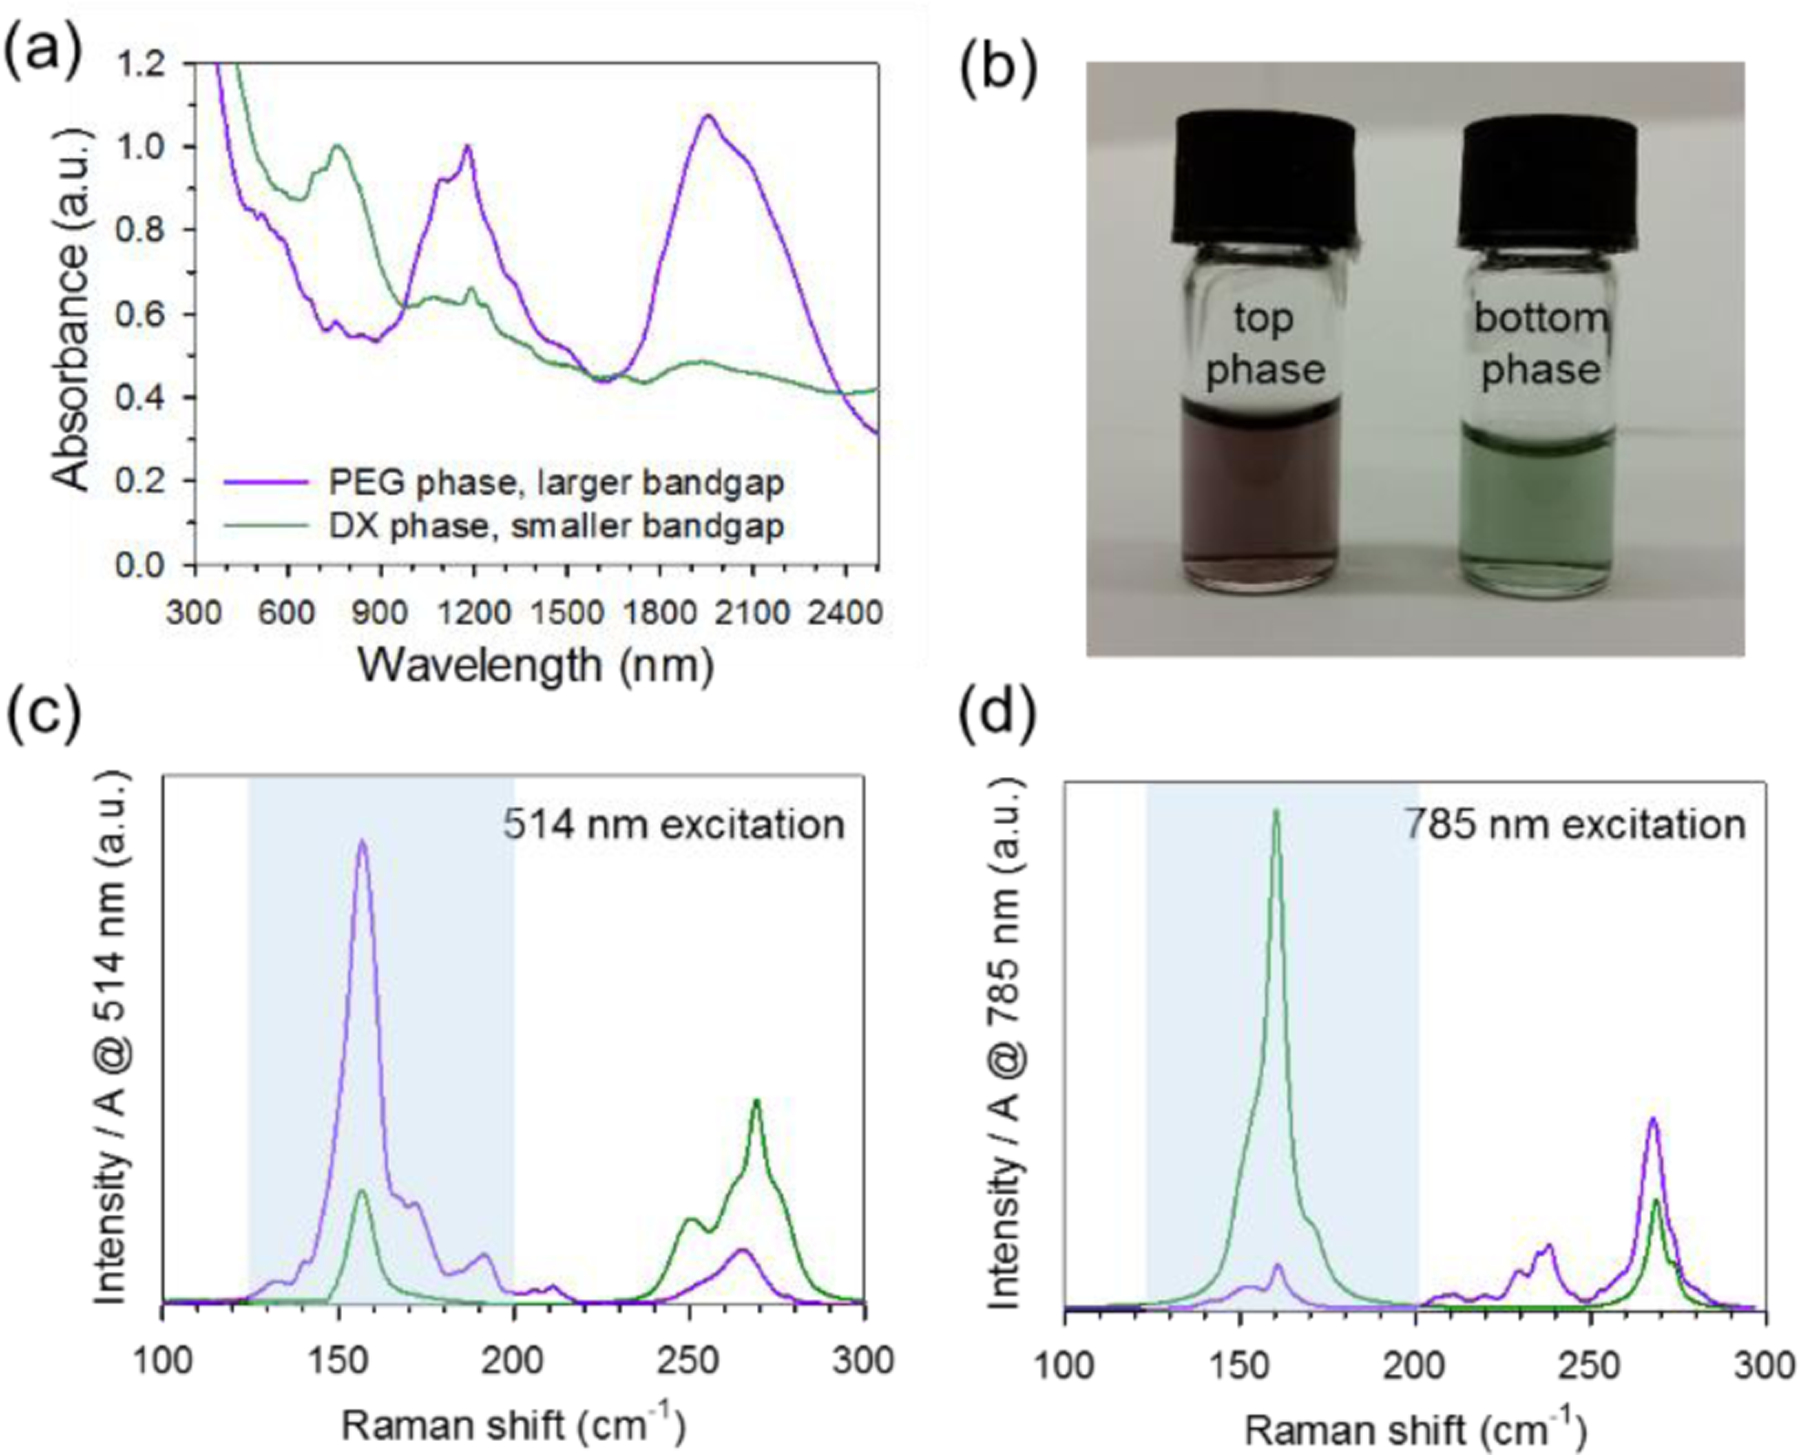
Separation of RZU-isolated DWCNTs by electronic type through ATPE. (a) absorption spectra of larger bandgap (top phase) and smaller bandgap (bottom phase) DWCNTs. Spectra are normalized to 1 at 1600 nm for easy comparison. (b) Photograph of separated fractions shown in (a). Colors highlight the visible electronic transitions of the sorted DWCNT fractions. (c) Raman spectra of the RBM region for larger bandgap (purple trace) and smaller bandgap (green trace) DWCNTs using 514 nm and 785 nm (d) excitation. Light blue shaded regions denote RBM intensities relating to DWCNT outer walls. To better compare the extent of electronic type enrichment, spectra are normalized by the absorption at each excitation wavelength.
Both theoretical and experimental studies have demonstrated that the electronic structure of DWCNTs is complex, being highly dependent on the specific properties of the inner and outer walls as well as the electronic interactions between them. This being the case, it is important that we consider the DWCNT complex as a whole and include all possible inner@outer wall contributions when assessing the effectiveness of the redox-driven separation. Fig. 2c,d show Raman spectra acquired for the two electronic-type-separated DWCNT fractions. An excitation wavelength of 514 nm was chosen to target the and transitions while 785 nm was used to match the and transitions. To better compare relative differences in concentration, Raman spectra were normalized by the absorption of each sample at the applied excitation wavelength. Large differences in RBM intensity are observed for outer-wall semiconducting and metallic transitions, in agreement with features seen in the absorption spectra. When comparing inner-wall RBMs under all sample/excitation conditions, much smaller differences in intensity are observed for each electronic type. While it seems plausible that the separation is based primarily on the electronic character of the outer wall, we caution that the influences of the inner walls are still not well understood, especially for the M@S and M@M structures which are much harder to identify and characterize in ensemble samples. Indeed, studies on SWCNTs have shown that excitonic binding energies are strongly affected by perturbations in dielectric environment due to nanotube aggregation34–35 or interactions with various solvents (both endohedral36 and exohedral37–39). In addition to the dielectric effect, recent work by Liu et al.40 has suggested direct orbital hybridization between the two inner and outer walls. Therefore, it is possible that the presence of a highly polarizable inner metallic structure may have adverse effects on the optical properties of the DWCNT outer-walls, making optical interpretation of DWCNT samples more challenging due to potential shifting, broadening, and/or quenching of the electronic transitions. While it is difficult to speculate on the exact influences of the inner- and outer-walls at this time, we anticipate that the presented electronic-type separation will help facilitate future investigations into the rich and complex electronic structure of DWCNTs.
The versatility of the ATPE method additionally allows for the facile separation of DWCNTs by diameter. Following procedures previously applied for the sorting of large diameter SWCNTs (up to ≈ 1.7 nm),27 a co-surfactant system comprised of a constant DOC concentration and a varying SDS concentration was utilized for the iterative diameter-dependent separation of both DWCNT fractions previously sorted by electronic type (see Experimental Methods for additional details). Fig. 3a,b show absorption spectra of the ATPE separated fractions in order of low (top most spectra) to high (bottom most spectra) SDS concentration applied for extraction. In general, optical transitions move to longer wavelengths for DWCNTs extracted at lower SDS concentrations, indicating a shift to larger diameters. Although far from monochiral, peak positions for the and optical transitions shift approximately 400 nm and 250 nm, respectively, indicative of a change of ≈ 0.4 nm in average diameter.41–42 Smaller DWCNT subpopulations additionally allow for easier interpretation of their optical spectra. The magnified area in Fig. 3a highlights sharp absorption features in the 600 nm to 950 nm wavelength range which we assign as electronic transitions. These, as well as the transitions seen in the metallic outer-wall fractions (Fig. 3b) are also observed to shift to longer wavelengths with increasing outer-wall diameter. Raman measurements for six of the diameter-sorted fractions (Fig. S3, labeled fractions in Fig. 3a,b) are found to broadly corroborate the diameter trends seen in absorption spectra. We note that diameter resolution in this study is somewhat limited by low sample concentrations and by performing the separation manually. Higher volume processing coupled with automated separation in the form of CCC is expected to increase sample purity significantly.
Fig. 3.
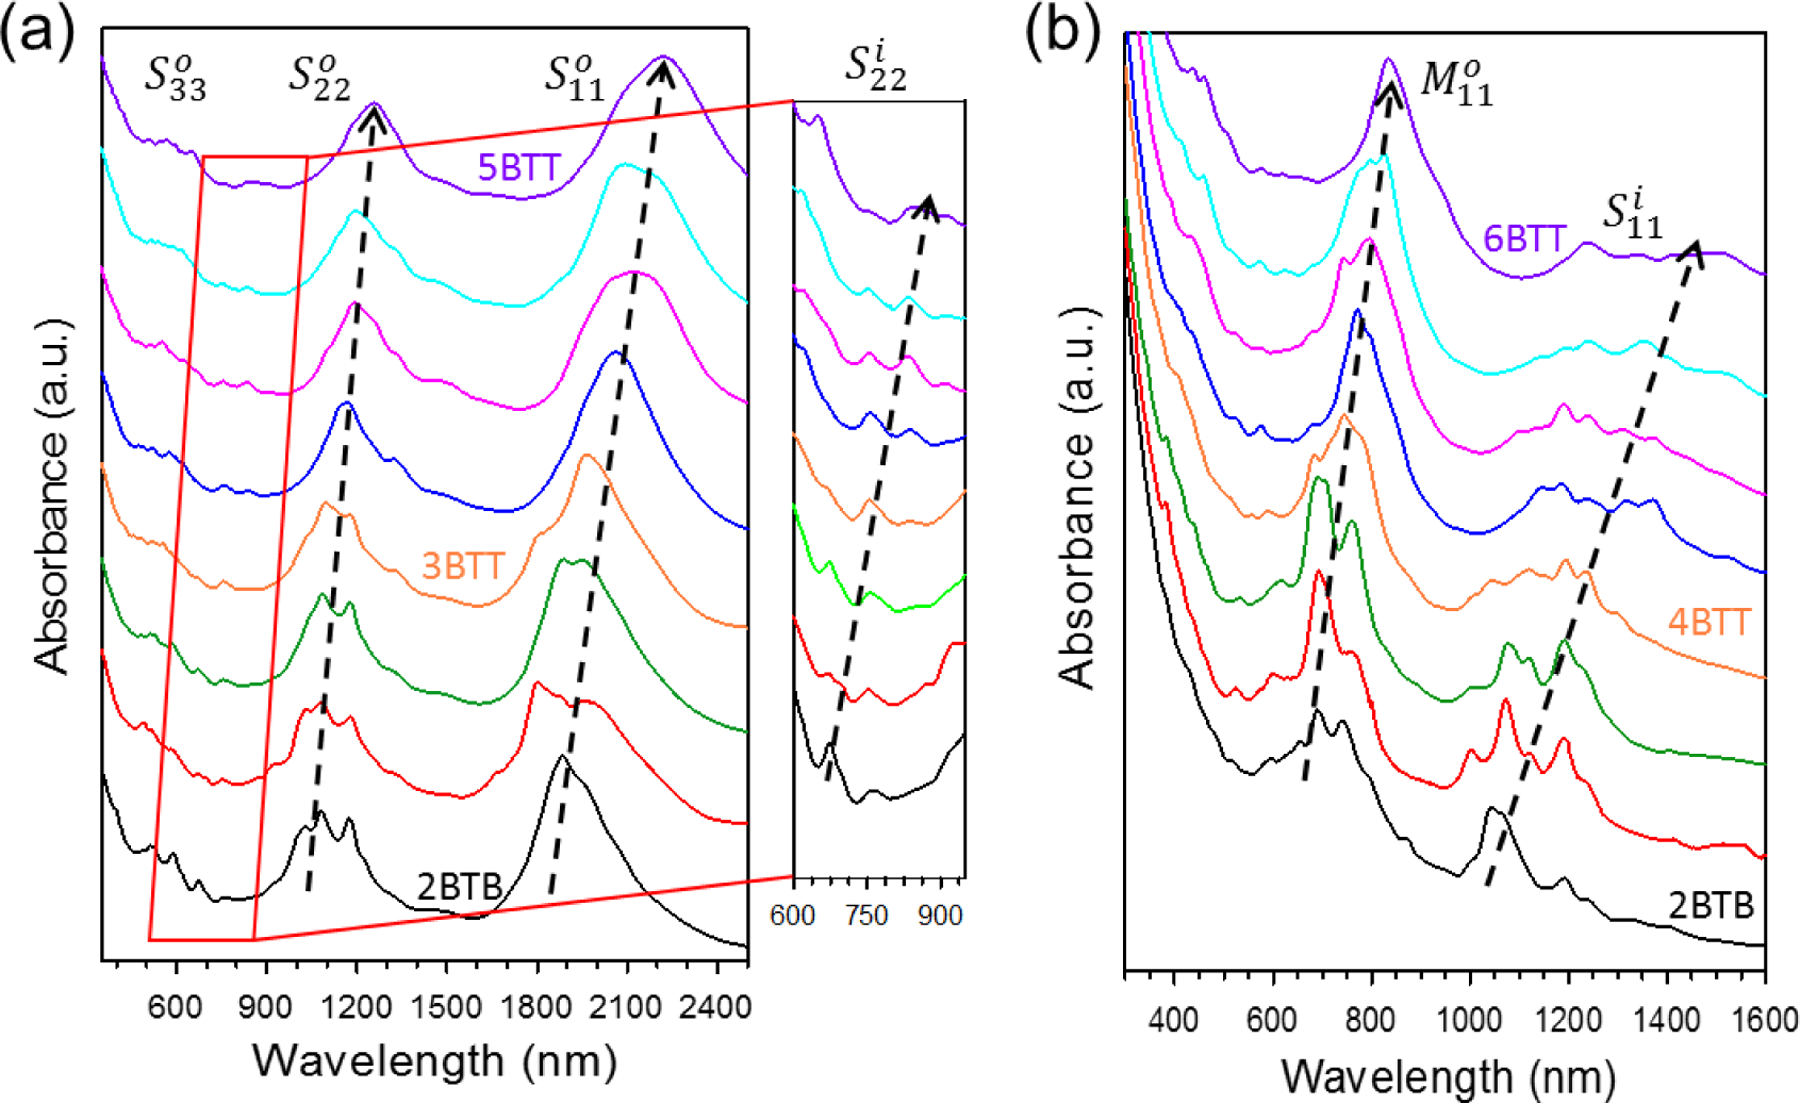
Absorption spectra of diameter-sorted larger bandgap (a) and smaller bandgap (b) DWCNTs. Spectra are plotted in order (from top to bottom) of low to high SDS concentration needed to extract the DWCNTs from the bottom to the top phase. Significant variation in nanotube diameter is indicated by the increasing shift of optical absorption to longer wavelengths. Black arrows specify direction of peak shifts. Magnified region in (a) highlight electronic S22 transitions of DWCNT inner walls. Spectra are normalized and offset for easy comparison. Raman measurements acquired for labeled spectra in (a) and (b) can be found in Fig. S3.
Single-step ATPE sorting by electronic structure
Many electronic device applications require nanotubes of a certain electronic type, as is the case with FETs where semiconducting material is highly desirable. While most studies have focused on the use of SWCNTs, several groups have also demonstrated that larger bandgap DWCNTs can be incorporated into thin film FETs that exhibit conductivity values and switching ratios (>103) sufficient for many electronic devices such as sensors.8–9 We show here that a simple redox separation in an SC/SDS aqueous two-phase system (with no previous RZU processing) can be applied to extract useful SWCNT and DWCNT semiconducting material from a bulk SWCNT-DWCNT parent mixture. Taking advantage of the mild reducing properties of PEG, a sequential fractionation procedure is designed where oxidized nanotubes (achieved by adding 1 mmol/L NaClO) initially found in the DX-rich phase are selectively reduced and then extracted into the PEG-rich phase simply by repeated mixing of the ATPE system.28 Upon removal of the top PEG-rich phase containing nanotubes, a blank top phase is added and the procedure is repeated until the fractionation is complete. Extraction order follows nanotube bandgap, with larger bandgap semiconductors extracted first, followed by smaller bandgap semiconductors, and then quasi-metals/metals. Fig. 4 shows the results of a redox separation for the parent SWCNT-DWCNT mixture. As expected, the first fraction to be extracted consists primarily of small diameter/larger bandgap semiconductor SWCNTs. Subsequent top phase extractions contain large diameter/smaller bandgap semiconducting nanotubes while the last fraction (Fig. S6) contains a mixture of small and large diameter metallic species. While large variations in diameter are observed, the separation is believed to be driven by differences in electronic structure. This is supported by the observation that small diameter metallic SWCNTs are extracted last as opposed to semiconducting SWCNTs of similar diameter which are extracted first.
Fig. 4.

Absorption spectra of successive top phase extractions obtained through a redox separation of the parent SWCNT-DWCNT dispersion. Extraction order follows nanotube band gap. The absorbance spectra for the last fraction, which contain a mixture of SWCNT and DWCNT metallic structures can be found in Fig. S6. Spectra are normalized and offset for easy comparison.
While the sample has been successfully fractionated by electronic type, the relative composition of SWCNTs and DWCNTs in the large diameter fractions is still unknown. Such characterization is difficult to obtain through optical methods such as absorption or Raman spectroscopy unless chemical or electrochemical doping is applied.3, 18, 43 Likely the most trusted method of DWCNT sample analysis, transmission electron microscopy, allows for unambiguous DWCNT identification and quantitative determination of both the inner- and outer- wall diameters, although uniform sample preparation and accurate statistical sampling are often times of concern. We show here for the first time that AUC can be used to determine the DWCNT/SWCNT composition in separated nanotube samples.
DWCNT characterization through analytical ultracentrifugation
To better assess the composition of the redox separated samples, fraction 3BT (labeled fraction in Fig. 4 and hereafter referred to as REDOX-3BT) was analyzed using AUC. In order to compare separation methods, additional AUC measurements were performed on fraction 3BTT (labeled in Fig. 3a and hereafter referred to as RZU-3BTT), which was first sorted by RZU and then further separated sequentially by electronic structure and diameter through ATPE. Absorption spectra of the two samples are found to be quite similar (Fig. S7) and indicate that both fractions possess an average diameter of approximately 1.6 nm.
Density contrast measurements were performed to determine the anhydrous () and buoyant () densities of the separated samples. For anhydrous density (density of the nanotube-surfactant complex without contribution from any associated water) measurements, the density of the bulk medium was varied by changing the ratio of H2O to D2O in the sample. Fig. 5a,b shows sedimentation coefficient distributions (s-distributions) measured for the RZU-3BTT and REDOX-3BT samples in solutions of varying H2O to D2O content (see ESI for further details describing how s-distributions are generated). For each distribution, a weighted average sedimentation coefficient is determined by thresholding the average of the distribution at 40 % of the peak value. To then find the anhydrous density of the surfactant-nanotube complex, solution viscosity-corrected average sedimentation coefficients () are plotted against solution density and extrapolated to find the density at which (Fig. 5c). In a similar fashion, buoyant densities (hydrated density including water from filled endohedral volumes) are determined by varying the concentration of water and iodixanol, a nonionic molecule which is thought to be excluded from the nanotube-surfactant complex by the associated solvation shell. For greater detail on the determination of anhydrous and buoyant densities of nanotube-surfactant complexes through AUC, readers are encouraged to refer to previous articles from our group and others.44–47 From our measurements, and are found to be () and () kg/m3 (where is defined as 1 standard deviation), respectively, for the RZU-3BTT sample. By estimating the average density of the bare DWCNTs in the sample and knowing the density of the DOC molecule itself, the linear packing density of DOC can be calculated from the experimentally measured anhydrous density value (see ESI). For the RZU-3BTT sample, we calculate a linear packing density of 6.2 DOC/nm. This value is somewhat lower than expected when compared to previous measurements performed on SWCNTs of smaller diameter.44–46 The data suggests that for nanotubes of larger diameter, surface coverage may be incomplete at bulk DOC concentrations of 10 g/L or lower. Thus, for future solution phase processing of large diameter DWCNTs and SWCNTs, higher DOC concentrations may be more suitable and provide greater colloidal stability. Measured anhydrous and buoyant densities for the REDOX-3BT sample were found to be () and () kg/m3, respectively. These values are noticeably lower than the RZU-3BTT sample. While it is possible that the smaller than expected density results from the adsorption of more DOC on each individual DWCNT in the sample, it is much more likely that the low density value arises from the contamination of large diameter SWCNTs not removed in the redox separation.
Fig. 5.
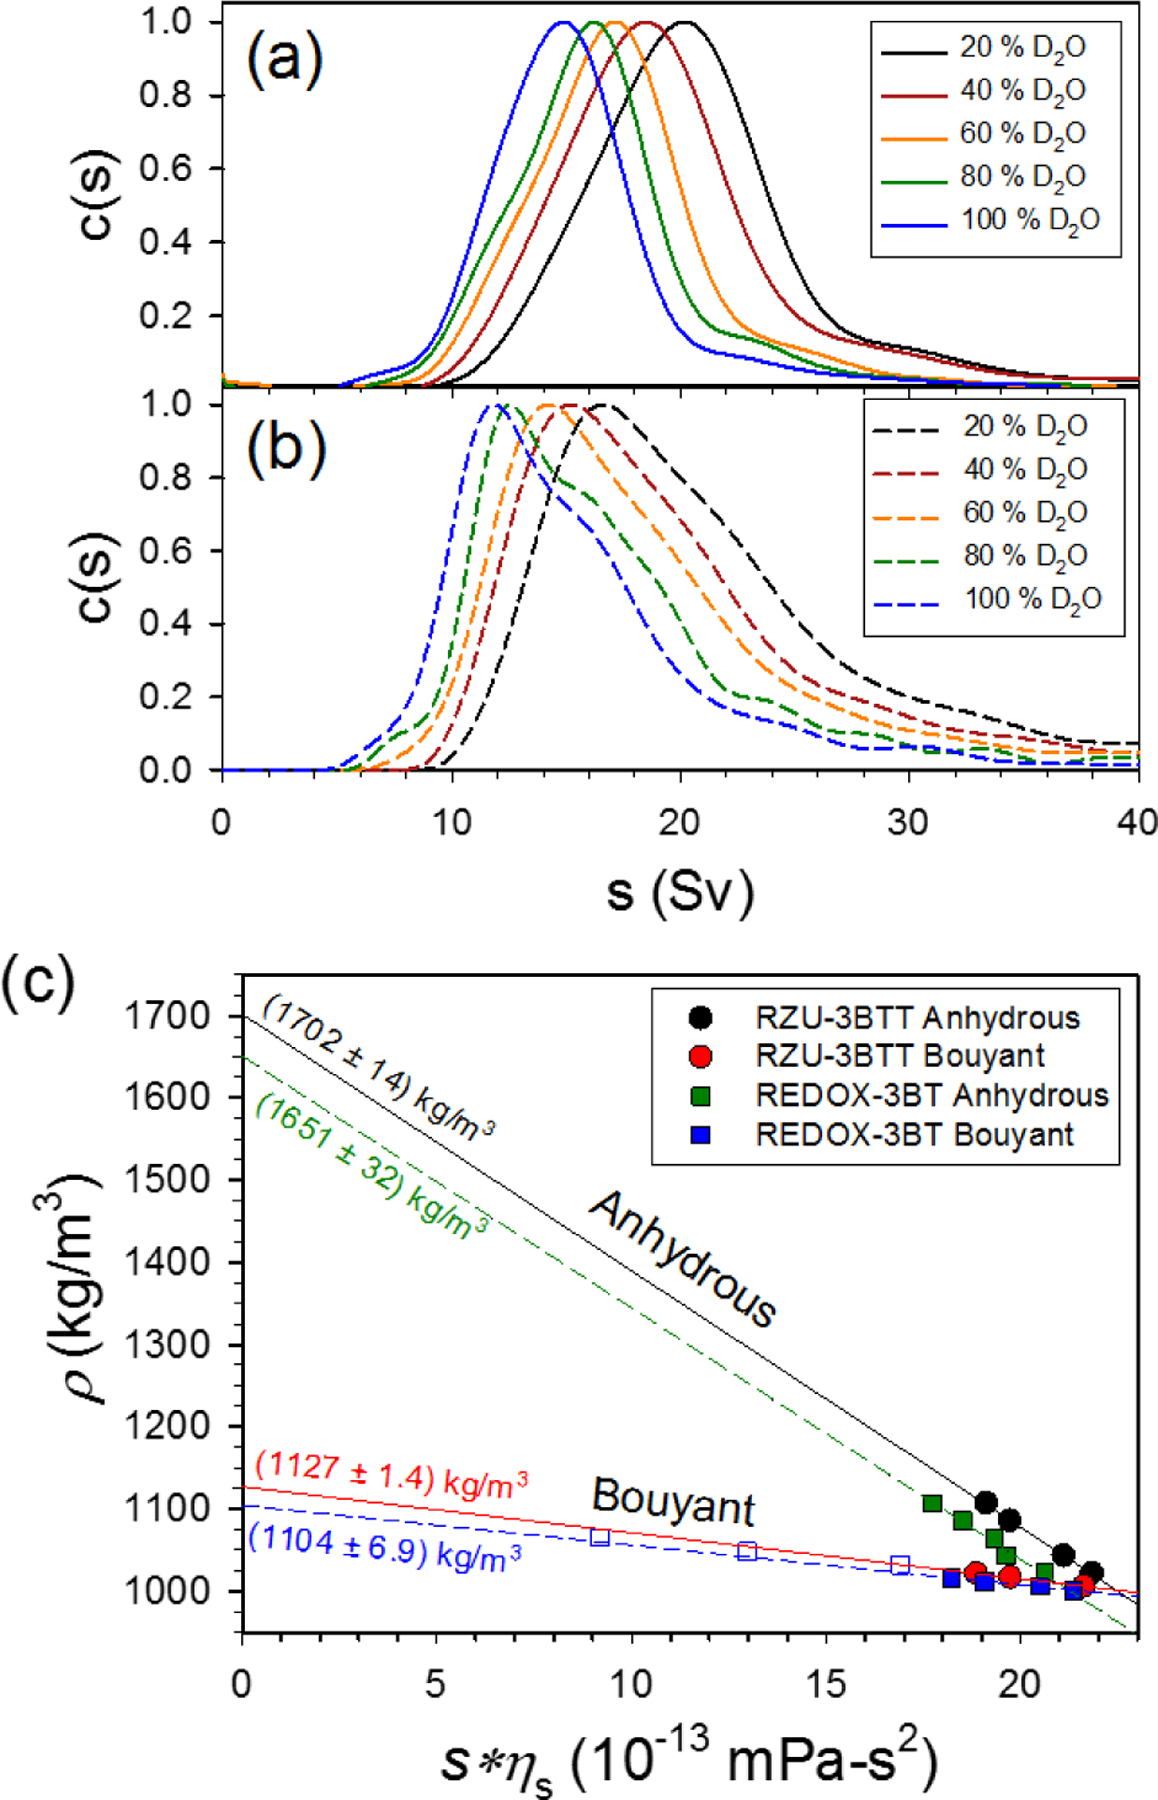
s-distributions for the RZU-3BTT (a) and REDOX-3BT (b) DWCNT samples in varying H2O/D2O content (10 g/L). (c) Plot of viscosity-corrected sedimentation coefficient versus solution density. Solid and dashed lines denote linear best fits from which anhydrous and buoyant densities are extracted from the y-intercepts at s = 0. Open blue squares come from sedimentation velocity experiments performed at higher concentrations of iodixanol (Fig. 6).
Further support of this conclusion comes from additional AUC experiments performed in the presence of higher concentrations of iodixanol. A higher bulk medium density creates larger differences in sedimentation rate between particles of different density, and is coincidentally the strategy often applied to separate particles using RZU. Fig. 6 shows s-distributions of the REDOX-3BT sample as the concentration of iodixanol is increased from 6 % (m/v) to 12 % (m/v). Most notably, the distributions are observed to split into two distinct subpopulations with increasing iodixanol concentration. At 12 % iodixanol, the left peak centered around s ≈ 4 Sv is thought to correspond to sedimenting SWCNTs while the right peak, centered around s ≈ 7.5 Sv, to sedimenting DWCNTs. For comparison, a similar analysis was performed on the RZU-3BTT DWCNT sample in 12 % iodixanol (dashed blue curve in Fig. 6).
Fig. 6.

Comparison of s-distributions for the RZU-3BTT and REDOX-3BT DWCNT samples in solutions containing higher concentrations of iodixanol (10 g/L DOC). s-distributions for the REDOX-3BT are observed to split into two distinct peaks due to the presence of both SWCNT and DWCNT subpopulations in the sample. Only a single peak is observed in the RZU-3BTT distribution, indicating that the sample is primarily comprised of DWCNTs.
Unlike the REDOX-3BT sample, the RZU-3BTT data shows only a single peak, suggesting the presence of an individual DWCNT population. This peak also highly overlaps with the second peak of the REDOX-3BT sample, supporting our previous assignment of this feature to DWCNTs.
To estimate the fraction of SWCNTs and DWCNTs found in the REDOX-3BT sample, the s-distributions obtained from the measurements (Fig. 5b) were deconvoluted into contributions from both SWCNT and DWCNT sedimentation. DWCNTs (dispersed in 10 g/L DOC) were assumed to have an anhydrous density similar to that of the RZU-3BTT sample () while the anhydrous density of the SWCNTs () was calculated based on a model (15,8) SWCNT (possessing a similar diameter to that of the estimated sample average) and a linear packing density of 6.2 DOC molecules/nm. Assuming a normal distribution of lengths centered at 400 nm and ranging from (200 to 1000) nm (Fig. S4), s-distributions for both SWCNTs and DWCNTs were generated using the following equation:
where is the mass of the sedimenting particle, is partial specific volume of the particle, is solution density, and is the frictional coefficient of the particle. Size exclusion chromatography analysis was additionally applied to confirm that the length distributions of the SWCNTs and DWCNTs in the parent dispersion were similar (Fig. S5). A weighted average of each s-distribution was computed (see ESI for details), and the resulting values were applied to deconvolute the experimentally measured average s value. As an example, the average s value for the REDOX-3BT sample in 100 % H2O was experimentally determined to be 20.05 Sv. We calculate the average s values for each SWCNT and DWCNT population be (16.75 and 22.86) Sv, respectively. Thus through simple linear algebra, the experimental s value can be deconvoluted into a 53.9 % contribution from DWCNTs and a 46.1 % contribution from SWCNTs. This analysis was carried out for each measured H2O/D2O condition (Table S2). Little variation is observed in sample composition for each solution condition, with less than 5 % deviation from the average values of 54 % DWCNTs and 46 % SWCNTs. Alternatively, SWCNT and DWCNT composition can also be estimated by simply comparing the integrated area under each SWCNT and DWCNT peak in the s-distributions measured at higher iodixanol concentrations (Fig. 6). The results of this analysis performed at all three iodixanol concentrations also average to 55 % DWCNTs and 45 % SWCNTs (Table S3), in excellent agreement with values obtained from the densitometry data.
It is evident through AUC analysis that fractions extracted through RZU followed by successive electronic type and diameter sorting in an ATPE system yield material of the highest DWCNT purity. However, we suggest that the simplified single-step redox separation is more practical in certain situations when only semiconducting material is needed for electronic applications. In fact, a SWCNT-DWCNT mixture may be more preferable in many cases as it should lead to FET devices with higher switching ratios than devices fabricated with just semiconducting DWCNTs alone.8
Although not reported here, we note that recent insights into the presence of charge transfer and electronic coupling between the inner and outer walls of DWCNTs suggests that it may indeed be possible to differentiate DWCNTs from SWCNTs of similar outer-wall diameter by electronic structure. Raman spectroelectrochemical measurements were used by Kalbac et al. to observe charge transfer between the inner and outer walls of DWCNTs. It was determined that the potential needed to observe charge transfer between different inner@outer wall electronic combinations increased from M@M < S@M < M@S < S@S.48–49 In a more recent study, Liu et al. applied single nanotube measurements to compare the optical transitions of individual DWCNTs to their constituent SWCNTs. DWCNT electronic transitions consistently showed significant peak shifts (ranging from (−50 to 200) meV) suggesting the presence of both dielectric screening and intrinsic orbital hybridization between the two walls.40 The inter-wall interactions revealed in these studies indicate that differences in electronic character exist between DWCNTs and SWCNTs of similar diameter. This being the case, it then might be possible to separate DWCNTs from SWCNTs through a redox separation in an ATPE system. We suggest, however, that such small differences in electronic structure can only be resolved if the diameter distributions of the DWCNTs and SWCNTs are very similar and narrow. Therefore, an alternative strategy might be to redox sort DWCNT-SWCNT material that is first sorted by diameter. While such diameter resolution is difficult to obtain manually, it is likely more attainable through automated CCC processing. The proposed strategy would also negate the need for separation schemes that rely on ultracentrifugation, which are often times less scalable and convenient. We believe that redox modulation has much to offer in DWCNT separation and will be the subject of future investigations.
Conclusions
In this work, we present a straightforward rate zonal ultracentrifugation method for the efficient isolation of DWCNTs from SWCNTs, demonstrating several advantages over the more traditionally applied isopycnic DGU technique including greater simplicity, higher mass throughput, and superior time efficiency. We additionally show for the first time that isolated DWCNTs can easily be processed using ATPE, allowing for the efficient and highly tunable separation by electronic character and diameter. While demonstrating significant improvement in DWCNT purity and subpopulation resolution, further enhancement is likely achievable through automated processing using available instrumentation such as CCC. Separated DWCNT samples are characterized using AUC, a technique capable of analyzing nanotube mixtures and providing estimates of SWCNT and DWCNT content. Results from AUC analysis indicate that high purity DWCNT material is best obtained through an RZU separation followed by sequential electronic type and diameter sorting using ATPE. Alternatively, a simplified single-step redox separation can be applied to obtain a semiconducting mixture of SWCNTs and DWCNTs of similar large diameter. We anticipate that the newly presented methods of separation and analysis will provide a convenient route for DWCNT sample preparation while also supporting significant advancement in fundamental research and technological advancement.
Experimental Methods
Disclaimer
Certain commercial equipment, instruments, or materials are identified in this paper in order to adequately specify the experimental procedure. Such identification is not intended to imply recommendation or endorsement by the National Institute of Standards and Technology (NIST), nor does it imply that the materials or equipment identified are necessarily the best available for the purpose. Unless noted otherwise, all reagents were obtained from standard sources.
Materials
Combustion chemical vapor deposition (CCVD) SWCNT-DWCNTs (90 % purity) were purchased from Cheap Tubes Inc. Sodium cholate (99 %, Sigma-Aldrich), sodium deoxycholate (BioXtra, > 98 %, Sigma-Aldrich), sodium dodecyl sulfate (Sigma-Aldrich), iodixanol (sold as OptiPrep Density Gradient Media, Sigma-Aldrich), NaClO (Sigma-Aldrich), poly(ethylene glycol) (6 kDa, Alfa Aesar) and dextran 70 (≈ 70 kDa, TCI) were acquired from the manufacturer without modification. Deuterium oxide (D > 99.8 %) was purchased from Cambridge Isotopes.
Dispersion
Raw nanotube powder (≈ 1 mg/mL) was suspended in a 10 g/L DOC solution using 1 h of tip sonication at a power of 1 W/mL. The suspension was centrifuged for an additional 1 h at 1885 rad/s (Beckman J-2 centrifuge, JA-20 rotor) to remove large aggregates and the supernatant was collected for further processing. For the single-step redox separation, a SWCNT-DWCNT suspension in 20 g/L SC was prepared using an identical dispersion procedure.
Rate Zonal Ultracentrifugation (RZU)
Rate-zonal separations of the SWCNT-DWCNT parent dispersion were performed in a Beckman-Coulter L80XP preparative ultracentrifuge using a Beckman-Coulter VTi 50 rotor at 5240 rad/s (50 kRPM) for 3.5 h at 20 °C. A one-step density gradient comprised of a 28 mL race layer containing 25 % (mass/volume) iodixanol and 10 g/L DOC, and a top layer (≈ 8.2 mL) containing the SWCNT-DWCNT dispersion in 10 g/L DOC was constructed in OptiSeal centrifuge tubes (part # 362183) to set the rate-zonal geometry. Post centrifugation, clear translation of the nanotubes through the liquid column is apparent, with visible variation in color and optical density. To form the reported fractions, sequential aliquots of solution were collected via hand pipetting from the top of each centrifuge tube; consistency of the separation across multiple centrifuge tubes was found by visual inspection to be excellent, and fractions corresponding to the same spatial volumes from multiple centrifuge tubes were combined. Aliquot size corresponding to different fractions ranged from 1 mL to 2.5 mL and were chosen based on visual observation of the variation in appearance of the fractions on extraction. After collection and preliminary characterization, each aliquot was concentrated and dialyzed into 10 g/L DOC using a stirred ultrafiltration cell ((100 or 300) kDa MW cutoff membrane) to remove all iodixanol prior to additional characterization and processing.
Aqueous Two-Phase Extraction (ATPE)
Stock solutions of blank top and bottom phases utilized for metal/semi (M/S) sorting were prepared by constructing a two-phase system consisting of 7 % PEG, 7% DX, 0.9 % SC, and, 0.7 % SDS. The top (M/S-top) and bottom (M/S-bottom) phases were removed and stored for later use. To begin the electronic structure ATPE separation of the RZU isolated DWCNT material, 1 part (by volume) DWCNT suspension (10 g/L DOC) was added to 4 parts (by volume) of 8.75 % PEG/8.75 % DX/1.125 % SC. Under these surfactant conditions (0.1 % DOC, 0.9 % SC), all nanotubes partition to the bottom DX-rich phase. To lower the DOC content, the top phase was removed and replaced with a blank M/S-top phase of equal volume. The system was mixed/centrifuged where again the nanotubes remained in the bottom phase. The process was repeated once more until the DOC content was reduced to the point (≈ 0.025 %) where the DWCNTs partition to the top phase. The bottom phase was then replaced with a blank M/S-bottom phase and 0.4 mmol/L NaClO was added to the ATPE system. After mixing/centrifugation, larger bandgap DWCNTs were found in the top phase while smaller bandgap DWCNTs were in the bottom. To improve purity, multiple iterations were applied by adding blank M/S-top phases (M/S-bottom) to the opposite DWCNT containing bottom (top) phase. The final smaller bandgap DWCNT fraction was pushed back up to the top PEG-rich phase by repeated vortexing/mixing the ATPE system.28 The PEG precipitation method was then applied to exchange the samples into a 1 % DOC solution for later diameter separation.50
Diameter separation of the electronic type-sorted DWCNT fractions was achieved utilizing an ATPE system comprised of a constant 0.15 % DOC concentration and a varying SDS concentration. For this study, a higher DOC content was used in order to increase the diameter resolution for larger diameter nanotubes.27 To start, 2 parts (by volume) DWCNT dispersion (1 % DOC) was added to 3 parts (by volume) 11.7 % PEG/11.7 % DX. The system was mixed/centrifuged and all nanotubes partitioned to the bottom phase. To further reduce the DOC concentration to ≈ 0.15 %, the top phase was extracted and replaced with an equal volume mimic top phase mixture of 12 % PEG and 0.016 % DOC, where the nanotubes again remained in the bottom phase after mixing/centrifugation. Diameter separation was then achieved by adding known volumes of top or bottom phase mimic mixtures to the nanotube-containing opposite phases. The top phase mimic consisted of 12 % PEG, 0.15 % DOC, and X % SDS, where values for X were typically 0.2 %, 0.4 % and 0.9 % depending on the desired final SDS concentration. The bottom phase mimic mixture contained 13 to 14 % DX, 1 % PEG, 0.15 % DOC, and 0 % SDS. At a DOC concentration of 0.15 %, DWCNTs were observed to partition between the two phases at SDS concentrations of ≈ 0.25 % to 0.85 %. Final fractions were typically pushed to the top PEG-rich phase for easier extraction. Notation for extracted fractions specifies “T” for top phase and “B” for bottom phase extractions.
The SWCNT-DWCNT dispersion used for the single-step ATPE redox separation was first prepared in 20 g/L SC. No additional RZU processing was applied. To first construct the ATPE system, 1 part (by volume) SWCNT/DWCNT dispersion was added to 3 parts (by volume) 9.3 % PEG/9.3 % DX/5.3 % SC/9.3 % SDS. Upon the addition of 1 mmol/L NaClO to the ATPE system, all nanotubes were pushed to the bottom DX-rich phase. After mixing and centrifugation (where PEG acts to partially reduce the oxidant concentration), larger bandgap nanotubes were found to partition to the top phase. The top phase was extracted and a blank M/S-top phase was added (see above). The mixing, centrifugation, and top phase extraction procedure was then sequentially repeated until all nanotube material had been successfully extracted from the bottom to the top phase.
Optical Characterization
UV-visible-NIR absorption measurements were obtained with a Varian Cary 5000 spectrophotometer over a wavelength range of (200 to 2500) nm. All spectra were acquired using a 1 mm path length quartz cuvette, an integration time of 0.1 s/nm, and a 2 nm slit width. Baseline corrections were applied by subtracting a separately measured spectrum of a blank surfactant solution. Prior to measurements, ATPE samples were exchanged into a 1 % DOC in D2O by PEG precipitation.50 The samples were further concentrated and dialyzed using a stirred ultrafiltration cell to remove remaining PEG and H2O.
Raman spectra were collected in a 180° backscattering geometry through a triple-grating Raman spectrometer coupled to a CCD detector cooled with liquid nitrogen. Spectra were obtained from aqueous solutions in clear glass tubes. Excitation wavelengths of 633 nm, 785 nm, and 514 nm were obtained from helium–neon laser, solid state laser, and Ar+ laser, respectively, with approximately 22 mW of laser power at the sample. Integration times varied between 20 s and 100 s. Each spectrum was collected 2 times.
Analytical Ultracentrifugation (AUC)
Sedimentation velocity (SV) experiments were performed in a Beckman Coulter XL-I analytical ultracentrifuge using an AN-50 8 cell titanium rotor loaded with 12 mm optical path length, 2-sector, Epon-charcoal centerpieces at a centrifugation speed of 1885 rad/s (18,000 rpm, ≈ 25,000 g at the center of the cell). Radial absorbance scans at or (for experiments containing iodixanol) were acquired at an interval of 5 min until sedimentation was complete (≈ 120 scans). Sedimentation coefficient profiles analyzed from 277 nm and 355 nm absorbance scans were found to be equivalent (ESI), with 277 nm providing a greater signal to noise ratio due to a greater optical density (OD) of the sample as well as lamp intensity at that wavelength. All experiments were performed at 20 °C, with a minimum 2 h equilibration time prior to the experiment. Reference solutions were of the same composition as the sample bulk phase (i.e., without nanotubes). Density and viscosity values for each solution were measured independently using an Anton Paar 5000 M densitometer/ Lovis ME viscometer combination instrument (ESI). Control experiments to test for concentration-dependent sedimentation found no effects at sample ODs between 0.2 and 2.4 at (ESI). Primary experiments were conducted with the OD of the samples between 0.2 and 0.4 at to ensure a system of dilute, non-interacting particles.
Supplementary Material
Acknowledgements
J.K.S and S.L. acknowledge support of National Research Council Postdoctoral Fellowships.
References
- 1.Shen C, Brozena AH and Wang Y, Nanoscale 2011. 3, 503. [DOI] [PubMed] [Google Scholar]
- 2.Moore KE, Tune DD and Flavel BS, Adv. Mater 2015. 27, 3105. [DOI] [PubMed] [Google Scholar]
- 3.Green AA and Hersam MC, Nat. Nanotechnol 2009. 4, 64. [DOI] [PubMed] [Google Scholar]
- 4.Huh JY, Walker ARH, Ro HW, Obrzut J, Mansfield E, Geiss R and Fagan JA, J. Phys. Chem. C 2010. 114, 11343. [Google Scholar]
- 5.Liu K, Wang W, Xu Z, Bai X, Wang E, Yao Y, Zhang J and Liu Z, J. Am. Chem. Soc 2008. 131, 62. [DOI] [PubMed] [Google Scholar]
- 6.Moore KE, Pfohl M, Tune DD, Hennrich F, Dehm S, Chakradhanula VSK, bel C, Krupke R and Flavel BS, ACS Nano 2015. 9, 3849. [DOI] [PubMed] [Google Scholar]
- 7.Rotkin SV and Hess K, Appl. Phys. Lett 2004. 84, 3139. [Google Scholar]
- 8.Green AA and Hersam MC, ACS Nano 2011. 5, 1459. [DOI] [PubMed] [Google Scholar]
- 9.Ng AL, Sun Y, Powell L, Sun CF, Chen CF, Lee CS and Wang Y, Small 2015. 11, 96. [DOI] [PMC free article] [PubMed] [Google Scholar]
- 10.Son Y-W, Oh S, Ihm J and Han S, Nanotechnol 2004. 16, 125. [Google Scholar]
- 11.Ha B, Shin DH, Park J and Lee CJ, J. Phys. Chem. C 2008. 112, 430. [Google Scholar]
- 12.Chen G, Shin DH, Iwasaki T, Kawarada H and Lee CJ, Nanotechnol 2008. 19, 415703. [DOI] [PubMed] [Google Scholar]
- 13.Piao Y, Chen C-F, Green AA, Kwon H, Hersam MC, Lee CS, Schatz GC and Wang Y, J. of Phys. Chem. Lett 2011. 2, 1577. [Google Scholar]
- 14.Bouilly D, Cabana J, Meunier F. o., Desjardins-Carriere M, Lapointe F, Gagnon P, Larouche FL, Adam E, Paillet M and Martel R, ACS Nano 2011. 5, 4927. [DOI] [PubMed] [Google Scholar]
- 15.Brozena AH, Moskowitz J, Shao B, Deng S, Liao H, Gaskell KJ and Wang Y, J. Am. Chem. Soc 2010. 132, 3932. [DOI] [PubMed] [Google Scholar]
- 16.Huang J, Ng AL, Piao Y, Chen C-F, Green AA, Sun C-F, Hersam MC, Lee CS and Wang Y, J. Am. Chem. Soc 2013. 135, 2306. [DOI] [PubMed] [Google Scholar]
- 17.Fleurier R, Lauret JS, Flahaut E and Loiseau A, Phys. Status Solidi B 2009. 246, 2675. [Google Scholar]
- 18.Moore KE, Pfohl M, Hennrich F, Chakradhanula VSK, Kuebel C, Kappes MM, Shapter JG, Krupke R and Flavel BS, ACS Nano 2014. 8, 6756. [DOI] [PubMed] [Google Scholar]
- 19.Liu G, Saito Y, Nishio-Hamane D, Bauri AK, Flahaut E, Kimura T and Komatsu N, J. Mater. Chem. A 2014. 2, 19067. [Google Scholar]
- 20.Arnold MS, Green AA, Hulvat JF, Stupp SI and Hersam MC, Nat. Nanotechnol 2006. 1, 60. [DOI] [PubMed] [Google Scholar]
- 21.Arnold MS, Stupp SI and Hersam MC, Nano Lett 2005. 5, 713. [DOI] [PubMed] [Google Scholar]
- 22.Ghosh S, Bachilo SM and Weisman RB, Nat. Nanotechnol 2010. 5, 443. [DOI] [PubMed] [Google Scholar]
- 23.Deng S, Piao Y, Brozena AH and Wang Y, J. Mater. Chem 2011. 21, 18568. [Google Scholar]
- 24.Nie H, Wang H, Cao A, Shi Z, Yang S-T, Yuan Y and Liu Y, Nanoscale 2011. 3, 970. [DOI] [PubMed] [Google Scholar]
- 25.Khripin CY, Fagan JA and Zheng M, J. Am. Chem. Soc 2013. 135, 6822. [DOI] [PubMed] [Google Scholar]
- 26.Fagan JA, Khripin CY, Silvera Batista CA, Simpson JR, Hároz EH, Hight Walker AR and Zheng M, Adv. Mater 2014. 26, 2800. [DOI] [PubMed] [Google Scholar]
- 27.Fagan JA, Hároz EH, Ihly R, Gui H, Blackburn JL, Simpson JR, Lam S, Hight Walker AR, Doorn SK and Zheng M, ACS Nano 2015. 9, 5377. [DOI] [PubMed] [Google Scholar]
- 28.Gui H, Streit JK, Fagan JA, Hight Walker AR, Zhou C and Zheng M, Nano Lett 2015. 15, 1642. [DOI] [PubMed] [Google Scholar]
- 29.Zhang M, Khripin CY, Fagan JA, McPhie P, Ito Y and Zheng M, Anal. Chem 2014. 86, 3980. [DOI] [PMC free article] [PubMed] [Google Scholar]
- 30.Fagan JA, Huh JY, Simpson JR, Blackburn JL, Holt JM, Larsen BA and Walker ARH, ACS Nano 2011. 5, 3943. [DOI] [PubMed] [Google Scholar]
- 31.Khripin CY, Tu X, Heddleston JM, Silvera-Batista C, Hight Walker AR, Fagan J and Zheng M, Anal. Chem 2013. 85, 1382. [DOI] [PubMed] [Google Scholar]
- 32.Maultzsch J, Telg H, Reich S and Thomsen C, Phys, Rev. B 2005. 72, 205438. [DOI] [PubMed] [Google Scholar]
- 33.Subbaiyan NK, Cambré S, Parra-Vasquez ANG, Hároz EH, Doorn SK and Duque JG, ACS Nano 2014. 8, 1619. [DOI] [PubMed] [Google Scholar]
- 34.O’connell MJ, Bachilo SM, Huffman CB, Moore VC, Strano MS, Haroz EH, Rialon KL, Boul PJ, Noon WH and Kittrell C, Science 2002. 297, 593. [DOI] [PubMed] [Google Scholar]
- 35.Schöppler F, Rühl N and Hertel T, Chem. Phys 2013. 413, 112. [Google Scholar]
- 36.Campo J, Piao Y, Lam S, Stafford C, Streit J, Simpson J, Walker AH and Fagan J, Nanoscale Horiz 2016. [DOI] [PubMed] [Google Scholar]
- 37.Choi JH and Strano MS, Appl. Phys. Lett 2007. 90, 3114. [Google Scholar]
- 38.Silvera-Batista CA, Wang RK, Weinberg P and Ziegler KJ, PCCP 2010. 12, 6990. [DOI] [PubMed] [Google Scholar]
- 39.Larsen BA, Deria P, Holt JM, Stanton IN, Heben MJ, Therien MJ and Blackburn JL, J. Am. Chem. Soc 2012. 134, 12485. [DOI] [PubMed] [Google Scholar]
- 40.Liu K, Jin C, Hong X, Kim J, Zettl A, Wang E and Wang F, Nat. Phys 2014. 10, 737. [Google Scholar]
- 41.Weisman RB and Bachilo SM, Nano Lett 2003. 3, 1235. [Google Scholar]
- 42.Liu K, Deslippe J, Xiao F, Capaz RB, Hong X, Aloni S, Zettl A, Wang W, Bai X and Louie SG, Nat. Nanotechnol 2012. 7, 325. [DOI] [PubMed] [Google Scholar]
- 43.Kominkova Z, Vales V, Hersam MC and Kalbac M, Carbon 2014. 78, 366. [Google Scholar]
- 44.Fagan JA, Zheng M, Rastogi V, Simpson JR, Khripin CY, Silvera Batista CA and Hight Walker AR, ACS Nano 2013. 7, 3373. [DOI] [PubMed] [Google Scholar]
- 45.Silvera Batista CA, Zheng M, Khripin CY, Tu X and Fagan JA, Langmuir 2014. 30, 4895. [DOI] [PubMed] [Google Scholar]
- 46.Lam S, Zheng M and Fagan JA, Langmuir 2016. 32, 3926. [DOI] [PubMed] [Google Scholar]
- 47.Arnold MS, Suntivich J, Stupp SI and Hersam MC, ACS Nano 2008. 2, 2291. [DOI] [PubMed] [Google Scholar]
- 48.Kalbac M, Green AA, Hersam MC and Kavan L, ACS Nano 2010. 4, 459. [DOI] [PubMed] [Google Scholar]
- 49.Kalbac M, Green AA, Hersam MC and Kavan L, Chem. Eur. J 2011. 17, 9806. [DOI] [PubMed] [Google Scholar]
- 50.Khripin CY, Arnold-Medabalimi N and Zheng M, ACS Nano 2011. 5, 8258. [DOI] [PubMed] [Google Scholar]
Associated Data
This section collects any data citations, data availability statements, or supplementary materials included in this article.