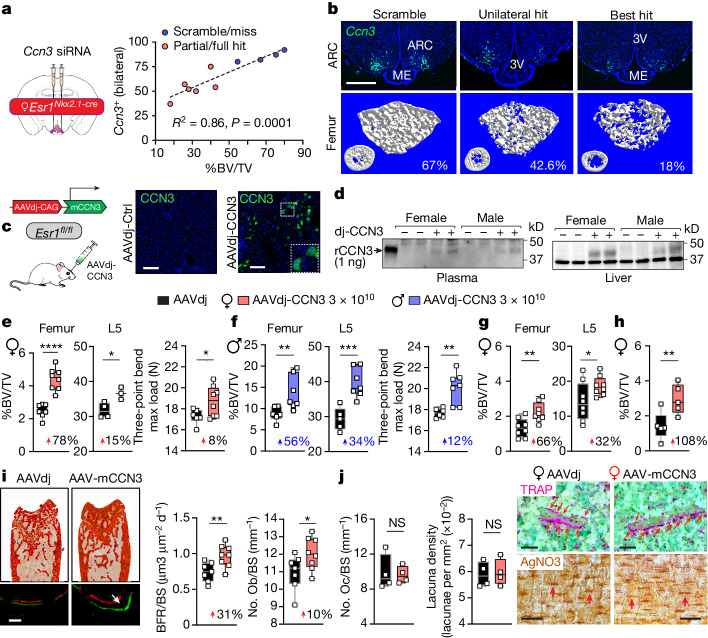
Fig. 5. Exogenous CCN3 drives higher mass, strength and formation of bone in vivo.
a, Left, schematic of experiment to induce loss-of-function of CCN3 (Ccn3 knockdown) in the ARC in mice. Right, Ccn3-positive neurons in female Esr1Nkx2.1-cre ARC versus %BV/TV after Ccn3 siRNA injections. b, Ccn3 expression in control, unilateral and bilateral hit with corresponding µCT scans of distal femurs. Scale bar, 500 µm (N = 6, 4). c, Left, schematic of experiment to induce gain-of-function CCN3 in the liver. Right, ectopic mCCN3 expression in Esr1fl/fl female hepatocytes following retro-orbital injection of AAVdj-CAG-CCN3 (AAVdj-CCN3) or control (AAVdj-Ctrl) vectors. Inset shows double nuclei. Scale bar, 100 µm. d, mCCN3 immunoblot of heparin–agarose-purified plasma (left) and liver extracts (right, 10 µg total protein) from mice 5 weeks after injection with AAVdj-Ctrl (–) or AAVdj-mCCN3 (+). Recombinant mCCN3 (rCCN3) shown in far left lane. e, %BV/TV (left) of femurs and L5 and mechanical strength (right) of femurs from 3-4-month-old Esr1fl/fl female mice 5 weeks after injection (N = 7, 8 femurs and N = 4, 3 L5). f, %BV/TV (left) of femurs and L5 and mechanical strength (right) of femurs from 3–4-month-old Esr1fl/fl males 5-weeks after injection (N = 6, 7 femurs and N = 5, 7 L5). g, %BV/TV of femurs and L5 in 5-month-old OVX Esr1fl/fl females 9 weeks after injection (N = 8, 8 femurs and N = 8, 8 L5). h, %BV/TV of 20–23-month-old Esr1fl/fl female femurs 9 weeks after injection (N = 5, 5). i, Bone formation rate and bone surface (BFR/BS), and number of osteoblasts per bone surface (No. Ob/BS) determined by histomorphometry (N = 7, 8). Scale bar, 50 µm. j, Number of osteoclasts per bone surface (No. Oc/BS) and lacunar density per bone area as determined by static histomorphometry (N = 4, 4). Representative images of TRAP (top) and silver nitrate (AgNO3, bottom) staining for femoral osteoclasts and lacunae, respectively. Scale bar, 50 µm. Simple linear regression for a. Unpaired Student’s t-test, one-tailed or two-tailed for e–g, i and j as indicated in Supplementary Table 3. Mann–Whitney test, one-tailed for h. *P < 0.05, **P < 0.01, ***P < 0.001, ****P < 0.0001. Error bars ± s.e.m. Graphic in c was adapted from BioRender (https://www.biorender.com).

