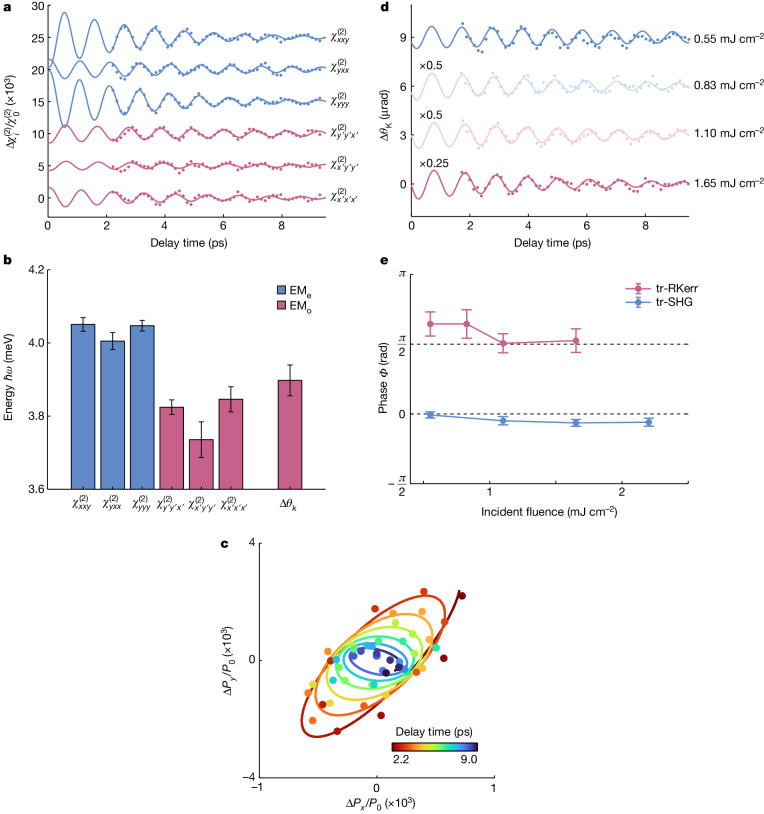
Fig. 3. Electric polarization and magnetization dynamics.
a, The second-order nonlinear optical susceptibilities (dots), extracted from Fig. 2d,f, are shown as a function of time along with fits (lines) to a damped oscillator model. The curves have been vertically offset for clarity. b, Oscillator energies obtained from the fits indicate separate electromagnon modulations of the C2-even-like (blue) and C2-odd-like (red) tensor elements. The frequency obtained from the tr-RKerr signal Δθk (see d) at the same pump fluence is also shown. c, Temporal evolution of the electric polarization components ΔPx and ΔPy induced by the oscillations of both electromagnon modes compared with the static polarization P0. Data points (dots) are shown alongside fits of the temporal dynamics (lines). d, tr-RKerr signals for several incident pump fluences at 2.4 K. Experimental data (dots) are shown alongside fits to a damped oscillator model (lines). The curves have been vertically offset for clarity. e, The initial oscillatory phases, Φ, obtained from the fits of the tr-SHG and tr-RKerr signals are shown as a function of incident pump fluence (Supplementary Note 5). All error bars show the 95% confidence intervals obtained from the fits.

