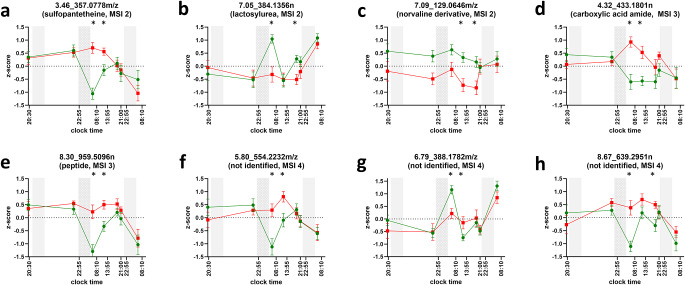
Fig. 5.
Normalized profiles of untargeted metabolic features with significant changes in two time points. Three gray bars signal biological nighttime (23:30 − 07:30). The second night accentuates that participants in the sleep-deprivation condition were kept awake. Green circles (control condition) and red squares (sleep deprivation condition) indicate mean values of z-scores; whiskers indicate respective standard errors of the mean. Asterisks highlight sampling time points with significant differences between the control and the sleep deprivation condition (i.e., p-value of paired t-test < 0.01). Metabolic features are labeled as retention time, underscore, and mass, the latter being either neutral (n) or m/z. Tentative identifications with MSI levels 2 (a-c), 3 (d,e), 4 (f-h) in brackets underneath, if applicable

