

Abstract
Pancreatic ductal adenocarcinoma (PDAC) is a devastating disease with a limited number of known driver mutations but considerable cancer cell heterogeneity. Phosphoproteomics provides a direct read‐out of aberrant signaling and the resultant clinically relevant phenotype. Mass spectrometry (MS)‐based proteomics and phosphoproteomics were applied to 42 PDAC tumors. Data encompassed over 19 936 phosphoserine or phosphothreonine (pS/T; in 5412 phosphoproteins) and 1208 phosphotyrosine (pY; in 501 phosphoproteins) sites and a total of 3756 proteins. Proteome data identified three distinct subtypes with tumor intrinsic and stromal features. Subsequently, three phospho‐subtypes were apparent: two tumor intrinsic (Phos1/2) and one stromal (Phos3), resembling known PDAC molecular subtypes. Kinase activity was analyzed by the Integrative iNferred Kinase Activity (INKA) scoring. Phospho‐subtypes displayed differential phosphorylation signals and kinase activity, such as FGR and GSK3 activation in Phos1, SRC kinase family and EPHA2 in Phos2, and EGFR, INSR, MET, ABL1, HIPK1, JAK, and PRKCD in Phos3. Kinase activity analysis of an external PDAC cohort supported our findings and underscored the importance of PI3K/AKT and ERK pathways, among others. Interestingly, unfavorable patient prognosis correlated with higher RTK, PAK2, STK10, and CDK7 activity and high proliferation, whereas long survival was associated with MYLK and PTK6 activity, which was previously unknown. Subtype‐associated activity profiles can guide therapeutic combination approaches in tumor and stroma‐enriched tissues, and emphasize the critical role of parallel signaling pathways. In addition, kinase activity profiling identifies potential disease markers with prognostic significance.
Keywords: kinase activity, pancreatic ductal adenocarcinoma, personalized medicine, phosphoproteome
Despite the treatment advancements in pancreatic ductal adenocarcinoma, 5‐year survival rates are still below 10%. Analyzing the phosphoproteome of 42 tumors, three subtypes with intrinsic and stromal features were revealed, each displaying kinase activity patterns with potential treatment options. Kinase activities associated with specific mutations, and correlated with clinical prognosis. This study provides insights for tailored and combination strategies.

Abbreviations
- CAF
cancer‐associated fibroblast
- EMT
epithelial‐to‐mesenchymal transition
- GSEA
gene set enrichment analysis
- IMAC
immobilized metal affinity chromatography
- INKA
integrative iNferred kinase activity
- LC–MS/MS
liquid chromatography‐mass spectrometry
- LFQ
label free quantitation
- OCT
optimal cutting temperature
- OS
overall survival
- PDAC
pancreatic ductal adenocarcinoma
- pST
phosphoserine/phosphothreonine
- PTM‐SEA
post‐translational modification signature enrichment analysis
- pY IP
phosphotyrosine immunoprecipitation
- pY
phosphotyrosine
- WT
wildtype
1. Introduction
Due to a late diagnosis, disease heterogeneity, and a lack of effective treatments, pancreatic cancer 5‐year survival rates are still low, typically below 10% [1]. Also, its climbing incidence has led to the prediction that by 2030 pancreatic cancer will be a top‐3 ranking cause of cancer death together with lung and liver cancers [2]. Survival of patients with surgically resectable tumors has improved over the last decade. However, pancreatic ductal adenocarcinoma (PDAC) tumors still remain difficult to treat, particularly in the locally advanced and metastatic setting [3, 4].
Transcriptomics has revealed relevant PDAC molecular subtypes [5], but has yet to predict effective treatments. The complementary information provided by the combination of genomic and proteomic analyses, the latest integrating genetic and epigenetic changes, is believed to have a major role in drug target discovery [6]. However, genetic profiling has revealed a very limited set of actionable mutations in PDAC, including the relative efficacy of oxaliplatin against germline‐mutated BRCA1/2 tumors. Recent studies have also tried to establish a correlation between genetic aberrations and clinical survival, with limited success [7, 8, 9]. This is partially due to the substantial genetic variation between PDAC tumors at other omics levels [10] and cell populations [11], as well as the low tumor cellularity and the complex relationship with the tumor microenvironment [12].
Pancreatic ductal adenocarcinoma exhibits a high prevalence of activated KRAS, a key player in signal transduction that was considered undruggable until recently [13]. Despite the development of KRAS inhibitors, resistance may remain a challenge [14]. This makes phosphoproteomics a useful approach to measure the associated hyperactive pathways that could help to unravel effective drug combination strategies. Several multi‐omic studies have unraveled drug vulnerabilities by exploring proteomics and phosphoproteomics in patients with colorectal [15], lung [16], esophageal [17], gastric [18], breast [19], and leukemic [20, 21] tumors, and also very recently in PDAC [22, 23, 24, 25]. A MS‐based approach allows to identify and quantify phosphorylation sites in proteins that are involved in oncogenic cellular processes. By quantifying the relative abundance of these proteins and the kinase–substrate relationships, associated biology and drug targets can be revealed. Here, we charted the phosphoproteome of 42 PDAC tumors to reveal signaling pathways that may be involved in PDAC development and progression, as well as to validate kinase targets recently identified in preclinical studies [26, 27] that could be exploited for therapeutic intervention.
2. Materials and methods
2.1. Clinical samples
Tumor patient samples from pancreaticoduodenectomies, which were part of a previously collected PDAC cohort for RNA‐sequencing [28], were evaluated for phosphoproteome profiling. Tumor tissue specimens, snap‐frozen in liquid nitrogen and stored at −80 °C, were retrospectively collected from the tissue archive of the Department of Pathology (approved by the Committee Review Biobanks, CTB.2015‐081), with the understanding and written consent of each subject, for the purpose of phosphoproteomic research. Retrospective collection was conducted at the Academic Medical Center location of Amsterdam UMC in accordance with ethical guidelines of Amsterdam UMC Research Code, based on the “Code of conduct Health Research” (Dutch Committee on Regulation of Health Research) between September 2019 and August 2020. The study methodologies were in accordance with the guidelines established by the Declaration of Helsinki. Clinicopathological data were obtained through the department of Pathology (Table S1).
2.2. Protein isolation from clinical samples
Feasibility of performing a phosphoproteome profiling of the remaining tissue was evaluated by assessing tumor volume and estimating protein input to achieve at least 2 mg of protein. This was equivalent to 20 slices of 10 μm thickness from a 1‐cm2 area tissue block, which will give a tissue wet weight of 20 mg. Based on this criterion, a total of 42 tissues were selected. Tumor tissues were optimal cutting temperature (OCT)‐embedded, which interferes with the mass spectrometer [29]. Therefore, an OCT removal prior to MS‐based proteomics was performed as previously described [29, 30]. First, big OCT pieces were carefully removed with a razorblade inside the cryotome at −20 °C. Per tumor sample, fifty to sixty 20 μm cryo‐slices were collected in a previously weighted 2‐mL vial and tissue wet weight was estimated. Samples were washed by vortexing and centrifuging through a series of 75% ethanol, H2O and 100% ethanol. Then, tumor slices were lysed for phospho‐protein extraction by adding 2 mL urea lysis buffer followed by three cycles of sonication (20 s on, 20 s off at maximum amplitude). Samples were then centrifuged (16 000 g , 10 min, 10 °C) and supernatant was collected. Protein concentration was determined with a Pierce BCA Protein Assay Kit (Thermo Scientific, Breda, The Netherlands), and all samples were stored at −80 °C until further use.
2.3. Western blotting
Sample processing and evaluation of phosphotyrosine was performed as previously described [26]. Phosphotyrosine levels were evaluated prior to sample processing by western blotting. Protein samples were denatured in sample running buffer (65% MiliQ, 25% NuPAGE™ LDS Sample Buffer (4×), 10% dithiothreitol (DTT) 1 m) and heated 3 min at 95 °C and immediately loaded in 4–12% polyacrylamide gels (Invitrogen™ NuPAGE™, Thermo Scientific) which were run at 150 V for 90 min. Proteins were then transferred to a nitrocellulose membrane using 100 V for 2 h. To ascertain equal protein loading, Ponceau staining was used at this step. Membranes were then incubated in blocking solution (5% bovine serum albumin in PBS‐0.1% Tween20 (cat #003005; Thermo Fisher, Bremen, Germany) (PBS‐T)) for 1 h. After blocking, nitrocellulose membranes were incubated with the primary antibody anti‐P‐Tyr‐1000 (cat #8954; Cell Signaling Technology, Leiden, The Netherlands) overnight at 4 °C. Then, membranes were washed five times in PBS‐T for 5 min and incubated for 1 h at room temperature with secondary antibody anti‐rabbit IgG, HRP‐linked Antibody (cat #7074; Cell Signaling Technology). Membranes were again washed five times in PBS‐T for 5 min. Blots were then incubated for 5 min in chemiluminescence substrate (SuperSignal™ West Pico PLUS cat #34580, Thermo Scientific) and finally developed using the UVITEC imaging system (Cambridge, UK).
2.4. Sample preparation for phosphotyrosine enrichment
Sample processing and evaluation of phosphotyrosine was performed as previously described [26]. For PDAC analyses, a total of 42 PDAC tissues were analyzed. To boost identifications, we included two replicates of equiproportional pooled lysates of five PDAC cell lines (PANC‐1, Suit‐2, CFPAC‐1, HPAC, Mia PaCa‐2). A control lysate of HCT116 (colon carcinoma cell line) was used as workflow control. We also included two PDAC tissues in duplicate (samples #16, #53 collected in 2 vials cryocutting). To assess tumor heterogeneity, we included two different tumor pieces from the same patient (Samples #1 and #9).
For phosphotyrosine immunoprecipitation (pY‐IP) 2.2–5 mg protein was used. Cryostat sections of 20 μm were lysed in 9 m ureabuffer (9 m urea/20 mm HEPES (pH 8) lysis buffer containing 1 mm sodium orthovanadate, 2.5 mm sodium pyrophosphate, and 1 mm β‐glycerophosphate). Upon lysis, proteins were reduced with DTT (dithiothreitol, 5 mm) and alkylated with IAA (iodoacetamide, 10 mm) followed, by dilution to 2 m urea. Samples were digested with trypsin (Promega, Leiden, The Netherlands) overnight (1 : 100 ratio) and thereafter acidified by addition of TFA (1% end concentration). The digests were desalted using Oasis HLB columns (500 mg capacity; Waters, Milford, MA, USA), eluted in 60% ACN/0.1% TFA and lyophilized for 48 h in a freeze dryer (Christ alfa 2–4 LSC).
Lyophilized phosphopeptides were dissolved in IAP buffer (50 mm MOPS/NaOH pH 7.2, 10 mm Na2HPO4, 50 mm NaCl) and incubated with PTMScan pY antibody‐conjugated beads (p‐Tyr‐1000) (Cell Signaling Technology) at a ratio of 4 μL slurry per mg protein at 4 °C for 2 h, as previously described [31]. Then, after washing with cold IAP buffer and Milli‐Q water, peptides were eluted from the beads in two steps with 0.15% TFA. Phosphopeptides were desalted using a 200‐μL STAGE tip fitted with a 1 mm‐needle punch of SDB‐XC SPE material at the narrow end. The SDB‐XC bed was activated with 20 μL of 80% ACN/0.1% TFA and equilibrated with 20 μL of 0.1% TFA. Phosphopeptides were loaded and centrifuged for 3 min at 1000 g . SDB‐XC beds were then washed with 20 μL of 0.1% TFA, and desalted phosphopeptides were eluted with 20 μL of 80% ACN/0.1% TFA. Phosphopeptides were dried in a vacuum centrifuge and dissolved in 20 μL of 4% ACN/0.5% TFA prior to injection and stored at 4 °C until LC–MS/MS measurement on the same day.
2.5. Sample preparation for global phosphoproteomics (pS/pT) enrichment
Phosphoproteomic enrichment was performed as previously described [26]. In brief, non‐bound fractions of the pY IP‐samples were used for global phosphoproteomics using (Fe(III)‐NTA cartridges) on the BRAVO platform (Agilent, Amstelveen, The Netherlands) using Phospho Enrichment v2.0 protocol as previously described [32]. A total of 200 μg peptides of the non‐bound fraction for each sample were desalted using a 10 mg OASIS HLB cartridge and eluted in 80% ACN/0.1% TFA solution. The cartridges were primed with 100% ACN/0.1% TFA, equilibrated with 80% ACN/0.1% TFA, whereafter the samples were loaded and washed with 80% ACN/0.1% TFA. The phosphopeptides were eluted in 25 μL of 5% NH4OH/30% ACN and then transferred to glass‐lined autosampler vials and dried in a vacuum centrifuge at 45 °C. Finally, phosphopeptides were dissolved in 20 μL of 4% ACN/0.5% TFA prior to injection in the LC–MS.
2.6. Data acquisition by LC–MS/MS
Data acquisition was performed as previously described [26]. Peptides were separated on an Ultimate 3000 nanoLC–MS/MS system (Dionex LC‐Packings, Amsterdam, the Netherlands) equipped with a 50‐cm 75 μm ID C18 Acclaim pepmap column (Thermo Scientific). After injection, peptides were trapped at 3 μL·min−1 on a 10‐mm, 75‐μm ID Acclaim Pepmap trap column (Thermo Scientific) in buffer A (buffer A: 0.1% formic acid, buffer B: 80% ACN/0.1% formic acid), and separated at 300 mL·min−1 with a 10–40% buffer B gradient in 90 min (120 min inject‐to‐inject). Eluting peptides were ionized at a potential of +2 kV and introduced into a Q Exactive HF mass spectrometer (Thermo Fisher). Intact masses were measured in the orbitrap with a resolution of 120 000 (at m/z 200) using an automatic gain control (AGC) target value of 3 × 10⁶ charges. Peptides with the top 15 highest signals (charge states 2+ and higher) were submitted to MS/MS in the higher‐energy collision cell (1.6‐Da isolation width, 25% normalized collision energy). MS/MS spectra were acquired in the Orbitrap with a resolution of 15k (at m/z 200) using an AGC target value of 1 × 10⁶ charges and an under fill ratio of 0.1%. Dynamic exclusion was applied with a repeat count of 1 and an exclusion time of 30 s.
2.7. Phosphopeptide and ‐site identification and quantification by LC–MS/MS
As previously described [26], MS/MS spectra of immobilized metal affinity chromatography (IMAC) and phosphotyrosine immunoprecipitation (pY IP) phosphopeptide enrichment experiments were searched separately against the Swissprot human FASTA file (downloaded January 2021, canonical and isoforms; 42 383 entries) using maxquant 1.6.10.43 [33]. Enzyme specificity was set to trypsin, and up to two missed cleavages were allowed. Cysteine carboxamidomethylation (+57.021464 Da) was treated as fixed modification and serine, threonine, and tyrosine phosphorylation (+79.966330 Da), methionine oxidation (+15.994915 Da), and N‐terminal acetylation (+42.010565 Da) as variable modifications. Peptide precursor ions were searched with a maximum mass deviation of 4.5 p.p.m. and fragment ions with a maximum mass deviation of 20 p.p.m. Peptide and protein identifications were filtered at a false discovery rate of 1% using a decoy database strategy. The minimal peptide length was set at 7 amino acids, the minimum Andromeda score for modified peptides was 40, and the corresponding minimum delta score was 6. Proteins that could not be differentiated based on MS/MS spectra alone were clustered into protein groups (all default maxquant settings). Phosphopeptide identifications were propagated across samples using the “match between runs” option checked.
2.8. Label‐free phosphopeptide quantification
Phosphopeptide quantification was performed as previously described [26]. For phosphopeptide data, we used data from the maxquant “modificationSpecificPeptides” table. For phosphosite (psite) data, we used data from the maxquant “Phospho (STY) Sites” table. Phosphopeptides and phosphosites were quantified from the area under the curve of the MS1 signal of each eluting peptide (“Intensity” in maxquant). For calculation of kinase INKA scores, phosphopeptide MS/MS spectral counts were calculated from the maxquant evidence file using R. IMAC normalization was performed to the median site intensity and pY IP normalization was performed to the total lysate spectral count. Missing value imputation was not performed. Contaminants and all‐zero intensity rows were excluded. Then, data were further analyzed by custom scripts using R (version 4.2.1) [34]. Only phosphosites with a localization probability ≥ 0.75 (class 1) were used for further analysis.
2.9. Statistical analyses: data filtering and analysis
Filtering of 10% and 100% data presence (DP) was applied to perform sample‐sample and class I phosphosite‐phosphosite correlation analyses, respectively. Sample‐sample and phosphosite‐phosphosite correlation analyses were based on Pearson correlation and plotted with gplots R package [35]. Pearson correlation of the HCT116 samples was performed between phosphosites identified in all replicates. Phosphosite identifications and tumor cellularity were correlated by Spearman correlation. For consensus clustering analysis we used the consensusclusterplus R package [36]. Analysis was performed on the proteome and phosphoproteome datasets after applying a 10% DP filtering and calculating the median absolute deviation (MAD) to idenfity top 10 most variable identifications. Phosphosite and protein resulting data‐sets were plotted using the complexheatmap R package [37]. Differentially expressed proteins and phosphorylated sites between subtypes, overall survival and mutation status, were identified using limma statistics with ion R package (“https://tvpham.github.io/ion”). Datasets were first processed with a 10% DP filtering. Benjamini–Hochberg adjusted P value threshold was set to 0.05 and fold change ≥ 2 or ≤ −2. Single sample gene set enrichment analysis (GSEA) [38] was performed with a pre‐ranked list after multiplying the negative log10 P‐values derived from limma with the sign of the fold change. We used the gsva R package [39] with a minimum size of 5 genes and a maximum of 1000. Gene signatures were retrieved from Molecular Signatures Database (Human MSigDB v2022.1.Hs) [40]. Enrichment scores were then averaged per protein cluster. Post‐translational modification signature enrichment analysis (PTM‐SEA) [41] was performed using the normalized site intensities. In case of duplicated phosphosite amino acid windows, the most abundant (row sum intensities) entry was used. PTM‐SEA was performed using the GenePattern platform [42]. Kinase activity was inferred from phosphoproteomic data using Integrative iNferred Kinase Activity (INKA) analysis as previously described [31]. INKA pipeline is available at https://inkascore.org/.
3. Results
3.1. Protein and phosphoprotein landscapes of PDAC tumor tissue
A comprehensive phosphoproteomic analysis was conducted on a set of 42 resected PDAC samples. These samples were derived from a larger study in which transcriptomic data were obtained (Fig. S1a) [28]. Tumor samples were selected based on tissue quantity to achieve at least 2 mg of protein required for pY phosphopeptide enrichment in addition to global phosphopeptide enrichment. The clinical and pathological features of these samples are summarized in Table S1. By using a two‐step phosphopeptide enrichment with phosphotyrosine immunoprecipitation (pY IP) and immobilized metal affinity chromatography (IMAC, global), followed by label‐free MS analysis, we generated a comprehensive dataset of 19 936 pS/T sites, 1208 pY sites and a total of 3756 proteins after data pre‐processing (see Section 2; Figs S1–S4). Underscoring the integrity of our dataset, the five to six workflow replicates of HCT116 cell line external reference samples clustered together in an unsupervised analysis (Fig. S1b–d). Moreover, these reference samples showed robust and consistent class I phosphosite identifications in global and pY (Spearman's correlation coefficient > 0.938 and 0.864, respectively). To ensure pY quality prior to phosphopeptide capture, pY levels were evaluated by western blotting, which showed variance among PDAC samples (Fig. S3h) indicating differences in signaling state. PDAC pS/T site identifications positively correlated with tumor cellularity (10–70%, median 40%), assessed by a pathologist (Fig. S2f), although no significant correlation was found for pY sites and proteins (Figs S3f and S4f, respectively). This suggests that the abundance of stroma may reduce the number and/or type of pS/T sites, in accordance with the elevated and aberrant signaling typically associated with the proliferative tumor cell population.
3.2. Proteomic characterization of PDAC tumors unravels distinct tumor biology
A large number of transcriptomic studies have interrogated PDAC heterogeneity and identified distinct subtypes [5, 28, 43, 44, 45]. To investigate the potential association between RNA and protein‐based subtypes, we studied the proteomic features of a subset (42/90) of the tissue cohort from Dijk et al. [28], in which four transcriptomic subtypes were identified. We then grouped tumors by consensus clustering into three main protein subtypes (Prot1‐3) using the top 10% most variable proteins (Fig. 1, Fig. S5a) [36]. Using the physically separated tumor and stromal proteomics profiles obtained in a recent laser microdissection effort [46] and by ESTIMATE analysis, Prot1 and Prot3 patient clusters were found to be tumor‐cell associated, whereas Prot2 cluster was enriched for stroma (Fig. 1B–D) [47]. This was further supported by the Prot2 enrichment of the activated stroma signature established by Moffit et al. [43] (Fig. 1F).
Fig. 1.
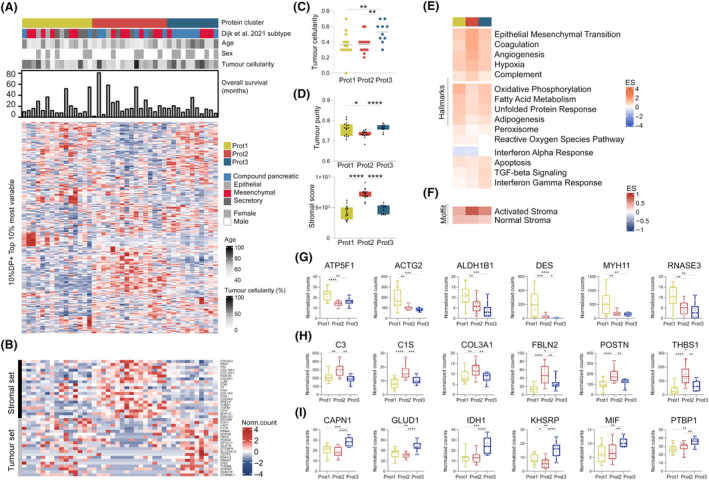
Proteome subtyping of PDAC tumor tissues. (A) Proteome subtypes generated by consensus clustering (see Fig. S5). Hierarchical clustering was built with the normalized protein counts after a 10% DP and top 10% most variable by median absolute deviation (MAD) filtering. Corresponding age, sex, tumor cellularity, overall survival in months, mRNA [28] and protein subtypes were annotated. (B) Enriched stromal and tumor markers from microdissected pancreatic ductal adenocarcinoma (PDAC) proteome by Le Large et al. [46]. (C) Tumor cellularity assessed by a pathologist per protein cluster, significantly different by Kruskal–Wallis test, P = 0.0072. Two group comparisons tested by Mann–Whitney t‐test. (D) ESTIMATE‐based tumor purity per protein cluster, significantly different by Kruskal–Wallis test, P = 0.0257, and ESTIMATE‐based stromal content per protein cluster, significantly different by Kruskal–Wallis test, P < 0.0001. Two group comparisons tested by Mann–Whitney test. (E, F) Single‐sample gene set enrichment analysis (ssGSEA) averaged enrichment score (ES) of signatures Hallmarks and Moffit activated and normal stroma [43]. (G–I) Example of proteins differentially expressed with P ≤ 0.05 in Prot1 cluster, Prot2 cluster, and Prot3 cluster. Significance was performed using non‐parametric Kruskal–Wallis test (three group comparison) and Mann–Whitney test (two group comparison). See also Figs S4 and S5, and Table S2. *P < 0.05, **P < 0.01, ***P < 0.001, ****P < 0.0001.
These protein‐based subtypes were characterized by distinct biology (Fig. 1E). The stroma‐associated Prot2 cluster was significantly enriched for EMT, coagulation, angiogenesis, and hypoxia signatures. In addition, most of the tumors classified as basal‐like on mRNA were grouped in the Prot2 cluster, indicating that tumor cell‐intrinsic mesenchymal signatures also exist in this subgroup [43]. Moreover, Prot2 showed a mixed profile of mesenchymal, compound and secretory tumors using the Dijk et al.'s classification. Interestingly, differentially expressed proteins (DEPs) were complement cascade C3, C4B and C1S proteins, potentially indicating signs of inflammation (Fig. 1H, Table S2). Prot2 also associates with FBLN2, known to disrupt the basement membrane to promote metastasis in PDAC by the interaction with MUC4 [48]. Likewise, we identified fibrillar collagen COL3A1, one of the EMT‐promoting proteins in PDAC [49], as well as POSTN, a potential myofibroblastic CAF marker found in dense PDAC stroma and particularly linked to ECM‐receptor interaction and PI3K/AKT signaling [50], and matricellular protein THBS1, increased during PDAC progression [51]. In line with their stromal content, Prot2 tumors were particularly enriched for both iCAF and myCAF markers (Fig. S6c).
Both Prot1 and Prot3 were characterized by high tumor cellularity (Fig. 1A–D), but featured distinct biological profiles. Prot1 showed a lipogenic‐like profile with mitochondrial respiration (OXPHOS), fatty acid metabolism and adipogenesis, and with elevated oxidative stress levels compared to Prot2 and Prot3. For instance, we found an increased expression in Prot1 of electron transport chain member ATP5F1 and mitochondrial enzyme ALDH1B1 (Fig. 1G). This lipogenic‐like profile is known to be associated with the epithelial subtype, typically slow proliferative and responsive to chemotherapeutics [52, 53]. Contractile proteins MYH11, ACTG2 and DES were all enriched in Prot1. Interestingly, DES is a marker for pancreatic stellate cells and MYH11 is a marker for a type of CAF similar to stellate cells [54], which could be a stromal signal in this subtype. RNASE3, a homolog of a released toxic granule protein by active eosinophils, was also increased in Prot1. Indeed, some tumors in this subtype were most enriched for the eosinophil signature compared to the other protein groups (Fig. S6c). In relation to Dijk subtypes [28], most of the epithelial (3/4) and half of the secretory (4/8) tumors were gathered in Prot1 group, suggesting this subtype may represent highly‐epithelial/classical PDAC tumors.
Prot3 was particularly inflammatory‐like, enriched for apoptosis, TGFβ signaling, IFN‐gamma response and to a lower extent IFN‐alpha response. TGFβ is known to promote PDAC progression by EMT, invasion and treatment resistance [55]. Depending on SMAD4 mutation status, TGFβ can signal to active SMAD proteins and promote cell cycle arrest, or drive tumorigenesis when SMADs are inactive [56]. Protein quantification of SMAD4 was however insufficient to find any correlation with SMAD4 mutation status in the proteomic groups. TGFβ can also contribute to CAF heterogeneity, shifting CAF phenotypes from inflammatory CAFs (iCAF) to myCAFs to, for instance, synthesize ECM proteins and promote EMT. Besides hallmark signatures, we observed differential expression of MIF in Prot3, which could potentially be related to IFN‐gamma and tumor‐associated macrophage activation, leading to an immune‐suppressive environment. Prot3 was enriched for Dijk et al. compound and mesenchymal tumors. Overall, we identified two tumor‐intrinsic subtypes (Prot1 and Prot3), one with epithelial‐like and other with mesenchymal‐like features, and a more stromal and mesenchymal‐like Prot2 subtype. Of note, enriched biology of these protein subtypes strongly aligned with the enriched signatures of three PDAC groups found in a 217 tumor cohort characterized by proteomics [22]. Besides, we observed a reduced survival for the Prot3 patient group (Fig. S7b), possibly due to the immune‐suppressive environment.
3.3. Kinase activity profiles challenge single‐hit dependence in PDAC: implications for combination therapies
We then examined the global phosphoproteome of all 42 resected PDAC tumors and explored whether PDAC phosphoproteome subtypes uncover novel information not captured at the proteome level. Applying a 10% DP filter to remove noise, we used the top 10% most variable phosphorylations (1496 pS/T sites) as input for consensus clustering. Recent studies have described different phosphoproteomic features in clinical subgroups, which were based on proteomics or multiple omics [22, 23]. This analysis identified three main phosphoproteomics‐based subgroups (Phos1‐3; Fig. 2A, Fig. S5b), the same optimal number as for the proteomic subtypes. Interestingly, by annotating the three protein subtypes, Phos1‐2 showed to be highly tumor‐cell intrinsic, while Phos3 showed to be mostly stroma‐enriched (Fig. 2A). Additionally, by interrogating the most variable pS/T kinome, differential kinase phosphorylation was found in an unsupervised manner between the phospho‐groups (Fig. 2B). Some of the differentially enriched kinases included RPS6KA1 in Phos1, PRKAA1, PRKACA, PRKCA, AKT1, PTK2 and EPHA in Phos2, and PRKD1, PRKG1, MAPK1 and MAPK3 in Phos3. Most variable pY kinome exhibited higher variability among samples (Fig. S6b) with no particular association per subtype.
Fig. 2.
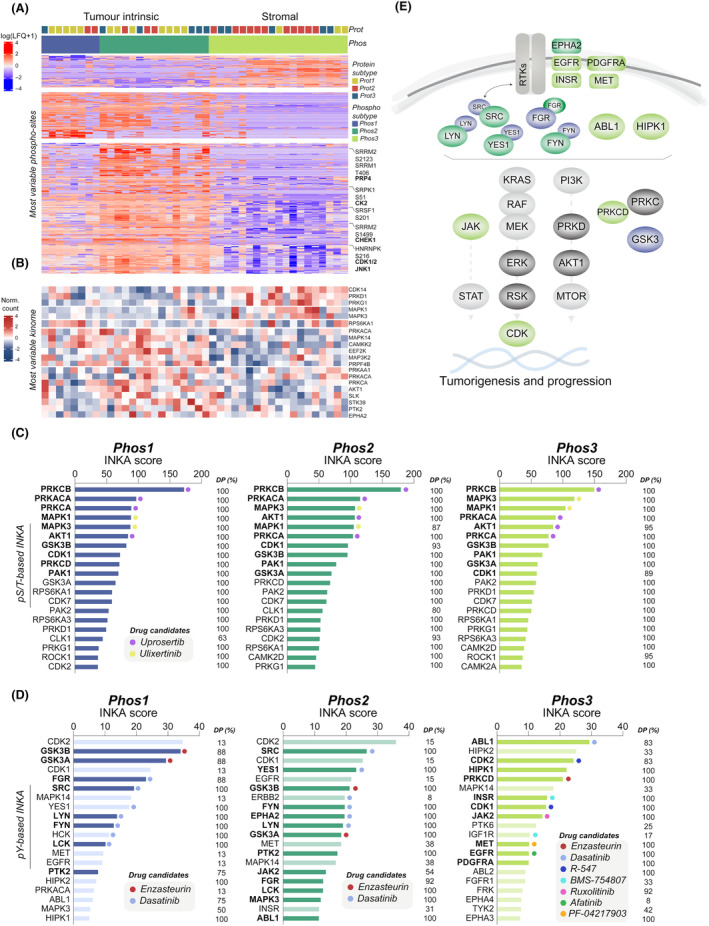
Phosphoproteome analysis of PDAC tumor tissues. (A) Hierarchical clustering of label free quantitation (LFQ) intensities of differentially phosphorylated serine and threonine (pS/T) sites between phosphoproteome subtypes (three group comparison, n = 973, FDR ≤ 0.05, Table S3), obtained by consensus clustering (see Fig. S5). (B) Phospho‐kinase abundance of most variable kinome subset (top 20%) based on pS/T phosphoproteomics. (C, D) Kinase activity profiles based on Integrative iNferred Kinase Activity (INKA) scores in Phos1‐3 at (C) pS/T level (Table S4) and (D) phosphotyrosine (pY) level (Table S5). Significantly different pY‐kinase activities between subtypes (using Mann–Whitney test, see Fig. S8 for P values) are annotated by a darker color and a bold font. DP across tumor samples is annotated in percentage. Drug candidates were selected based on drug‐kinase relationships and target inhibition efficacy [118]. (E) Mapped kinase signaling from pS/T and pY INKA profiles enriched in Phos1‐3 pancreatic ductal adenocarcinoma (PDAC) subtypes (only significant from Fig. S8 were annotated).
Subsequently, we investigated differences at the phosphosite level among the phospho‐subtypes and found splicing to be differentially regulated. By group comparison, we identified a total of 973 differentially phosphorylated S/T sites between the three phospho‐groups (Table S3). Protein–protein interaction networks showed high connectivity between phosphorylated proteins per group as expected (Fig. S6a). Phos3 was enriched for 175 phosphorylations occurring in proteins involved in RNA splicing and transcription, the actin cytoskeleton, and cell adhesion (phosphorylation cluster C1). Phos1 and partly Phos2 had significantly more phosphorylations occurring in proteins involved in RNA splicing and axonogenesis (C2). Intriguingly, RNA splicing was enriched in all three phospho‐groups, however differences in phosphorylation events were identified (Table S3b). Phos2 exhibited the highest number of phosphosites associated with splicing (157/196). Notably, there was an enrichment of phosphosites attributed to PRP4, a critical regulator of RNA splicing [57, 58]. Furthermore, in Phos2, we observed an enrichment of HNRNPK, a major pre‐mRNA‐binding protein previously linked to increased tumor growth in KRAS and TP53‐mutated PDAC tumors [59]. HNRNPK was found to be phosphorylated by CDK1/2 and/or JNK1. These upstream kinases, along with TBK1 and ATM, were uniquely identified in Phos2 tumors. Additionally, the splicing regulator SRPK1, whose activation occurs through increased phosphorylation by CK2 kinase, was enriched in these tumors. Interestingly, its expression has been linked to poor outcomes in other cancer types [60]. Remarkably, phosphorylation of the splicing factor and proto‐oncogene SRSF1, known for its association with significant alterations in alternative splicing patterns [61], was uniquely enriched in Phos2. Overall, these findings, coupled with the abundance of phosphosites in splicing‐related proteins, suggest that Phos2 tumors exhibit a highly active cell cycle and RNA splicing machinery. Conversely, Phos3 appeared to have lower levels of splicing, with no enrichment of serine/arginine‐rich splicing factor (SRSF) proteins, compared to Phos1‐2 where multiple SRSFs were identified. Two of these were found to be phosphorylated by AKT1. Interestingly, phosphoprotein abundance of AKT1 was also found to be lower in Phos3 compared to Phos1‐2 (Fig. 2B).
Kinase activity profiling is a valuable tool for exploring therapeutic approaches. To identity hyperactive protein kinases that may differ between phospho‐subtypes, we used the Integrative iNferred Kinase Activity (INKA) pipeline [31] (Tables S4 and S5). Interestingly, kinase activity was particularly high in Phos2 and Phos3 (Fig. S8). By inferring kinase activity, and contrary to the pY kinome, pY‐based INKA profiles did show substantial differences between subtypes. This underscores why integrating both kinase‐ and substrate‐centric information is key to define kinase activity [31, 62]. Compared to Phos2 and Phos3, pY‐based kinase profiles of Phos1 patients showed significantly higher kinase activities of GSK3α and GSK3β, known to be involved in PDAC pathogenesis and progression [63], and FGR (group based INKA profiles, Fig. 2C,D). Based on the global phosphoproteome profiles, Phos2 patients also showed elevated activity of AKT kinases, BRAF, CAMK2, CDKs, MTOR, PRK kinases, RAF1, and SRC (Fig. 2C, Fig. S8b), although kinase ranking remained consistent for all subtypes. Compared to pS/T, pY‐based kinase profiles exhibited greater differences among the three subgroups. Phos2 patient pY profiles displayed higher activity of EPHA2, FYN, LCK, LYN, MAPK3, PTK2, SRC, and YES1 (Fig. 2D, Fig. S8b). Interestingly, stroma‐enriched Phos3 patient profiles displayed significantly higher activity of pY‐based kinases such as EGFR, INSR, MET, PDGFRA, ABL1, ABL2, CDK1, CDK2, HIPK1, JAK2, MAPK1, and PRKCD (Fig. 2D, Fig. S8c). In terms of therapeutic options, pS/T INKA profiles suggest PI3K/AKT and/or MAPK signaling as two main downstream pathways to be targeted regardless subtype. Based on pY INKA profiles, a limited number of drugs should suffice for Phos1 and Phos2 subtypes, i.e., enzasteurin and/or dasatinib for the majority of patients, whereas for stromal Phos3 subtype, drug targets were more diverse and may be selected in an individual profile‐guided manner. In line with this, kinase activities such as CDK1/2, EGFR, ERBB2, or HIPK2 were found high in a small group of patients (DP 8–33%), which underscores the importance of a personalized treatment strategy. Significant kinase activities were then mapped (Fig. 2E), further displaying main signaling differences per subtype.
In our analysis, the INKA top 20 ranking of tumor group‐based kinase activities not only confirmed known roles in tumor progression (Fig. 3A,D) but also revealed additional insights through the examination of external datasets and our own preclinical study. By using the INKA pipeline on an external PDAC global phosphoproteomics dataset [23], not only we confirmed 4/5 described kinases in the PDAC phosphoproteomics dataset of Cao et al. (Top 20: CDK7, PAK1, PAK2; hyperactive: SRC), but also revealed additional pS/T activities overlapping with our cohort (Fig. 3A,B), as well as with our own recent preclinical PDAC study [26] (pS/T level in Fig. 3C,F; pY level in Fig. 3G). Notably, the only kinase that was not found in the INKA ranking of the CPTAC cohort was AKT1, that was lost in the required TMT batch‐to‐batch normalization. Overall, these overlaps reinforce our approach and validate our preclinical findings. It is noteworthy that stromal Phos3 tumors exhibited a higher abundance of top 20 tumor‐unique INKA kinases, and is explained by the lack of stroma in cell culture profiles. Despite this, matching epithelial and mesenchymal subtype kinase activities were found between tumor and cell profiles, e.g. mesenchymal cells displayed significantly higher ABL1 kinase activity, in line with the stromal Phos3 profiles (Fig. 3D,E, Fig. S8c). The same was observed for EPHA2 kinase activity, found to be significantly increased both in epithelial cells and tumor‐intrinsic Phos2 subtypes (Fig. 3D,E, Fig. S8b).
Fig. 3.
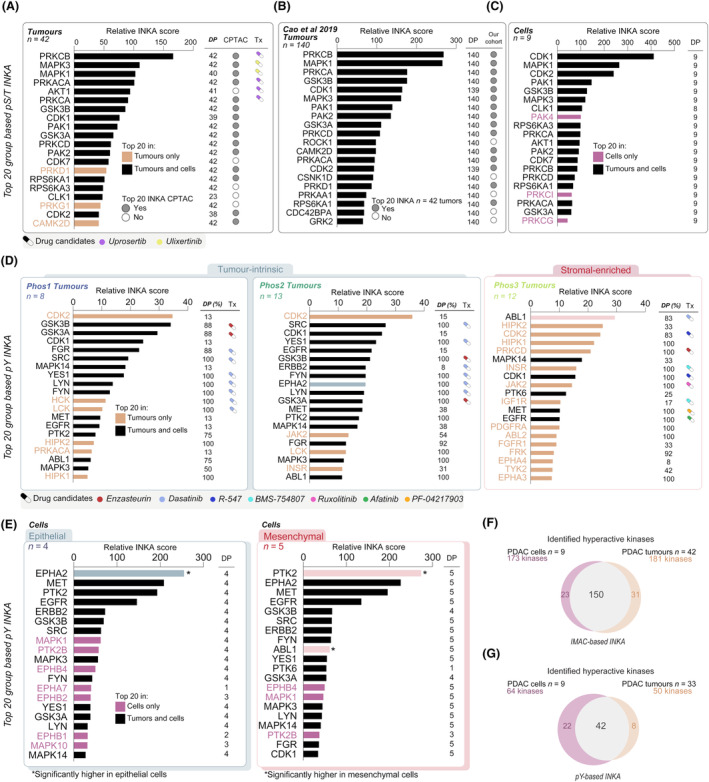
Overlapping kinase activity profiling in SPACIOUS and CPTAC tumor cohorts and PDAC cell lines. (A) Phosphorylated serine and threonine (pS/T) Integrative iNferred Kinase Activity (INKA) group‐based profiles of pancreatic ductal adenocarcinoma (PDAC) tumors of SPACIOUS cohort (n = 42), (B) of CPTAC cohort [23] (n = 140) and (C) of a PDAC cell panel (n = 9) [26]. Top 20 INKA kinase presence in tumors and cells is annotated by orange and magenta colors, respectively. Drug candidates are annotated in relation to Fig. 2. (D) Phosphotyrosine (pY) INKA group‐based profiles of PDAC tumors of Phos1, Phos2 and Phos3 from the SPACIOUS cohort (n = 33). Target candidates vary per Phos subtype related to Fig. 2 and Fig. S8. (E) pY INKA group‐based profiles of a PDAC cell panel (n = 9), containing four epithelial cell lines and five mesenchymal cell lines. Significance of differential kinase activities (EPHA2 P = 0.0124, PTK2 P = 0.049) by Mann–Whitney test was annotated with an asterisk (*) from previous study [26]. Kinases EPHA2 and ABL1, associated to tumor intrinsic and to stromal subtypes, were annotated in green and salmon shade, respectively. (F, G) Overlapping INKA kinases between PDAC cell lines and tumors at (F) pS/T level and (G) pY level.
Overall, the use of pY‐based profiles provided an additional and actionable layer of information that can be used not only to complement the existing characterization of the PDAC phosphoproteome but to underscore the need for personalized treatment strategies. Furthermore, these kinase activity profiles indicate the need for combination strategies in PDAC.
3.4. Comprehensive profiling of mutated genes and phosphoproteomic signatures in PDAC
We sequenced a panel of 31 commonly mutated genes such as KRAS (frequency of mutated samples, 95.2%), TP53 (73.8%), SMAD4 (21.4%), CDKN2A (7.1%), and others (Table S6). Multiple KRAS variants were identified at the anticipated frequencies such as G12V (40%), G12D (35%), G12R (10%), G12R/G12V (2.5%), G13D (2.5%), and Q61H (2.5%) [22, 64]. Wildtype KRAS was identified in two out of the 42 human tumors, and for three tumors, the allele variant was not available.
The mutation status within phosphoproteome subtypes revealed distinct patterns, particularly in relation to KRAS and TP53 mutations and associated signaling pathways (Fig. 4A). KRAS G12D mutations were mainly observed in Phos2 (7/14 of G12D‐mutated) compared to Phos3 (5/14), whereas G12V mutations were mainly found in Phos3 (9/17 of G12V‐mutated) compared to Phos2 and Phos1 (both 4/17). KRAS G12R mutations presented in Phos1 and Phos3, but not in Phos2. Here, KRAS dosage at mRNA was slightly higher in Phos2 than in Phos3 (Fig. S6e, P = 0.0123). In addition, we identified significantly enriched phosphoproteome signatures associated with the G12D, G12V and G12R KRAS alleles (Fig. S9). The G12D allele was associated with the unique enrichment of cell cycle regulators CK2A1 and AMPKA1 kinases, and G12V with the enrichment of CDK1 and SRC kinases, and GLP1 and IL11 pathways. However, cell gene‐dependency data of these proteins did not confirm any unambiguous dependency in G12D or G12V mutated contexts (DepMap data not shown). Overall, these observations confirm the lack of single‐hit dependencies in PDAC, as described in our recent preclinical study [26]. Interestingly, intensity of two phosphosites in MAPK targets (MAPK14‐Y182 and MEF2A‐T108) was enriched in G12D mutated tumors. These results are in line with a recently reported enrichment of Ras/Raf/Mek/Erk cascade [22] and cell cycle [65] in G12D tumors. Differential phosphosites related to this were identified (Fig. S9d and Table S7). It is known that G12D‐mutated tumor cells can signal oncogenic stimuli to stromal cells, the later promoting IGF1R, AXL and AKT signaling and providing a high level of complexity [66]. Overall, our findings support G12D tumors are strongly enriched to cell cycle and RAS signaling and may capture the tumor‐intrinsic compartment, which can be involved in reciprocal signaling with the stromal compartment (Fig. 4B).
Fig. 4.
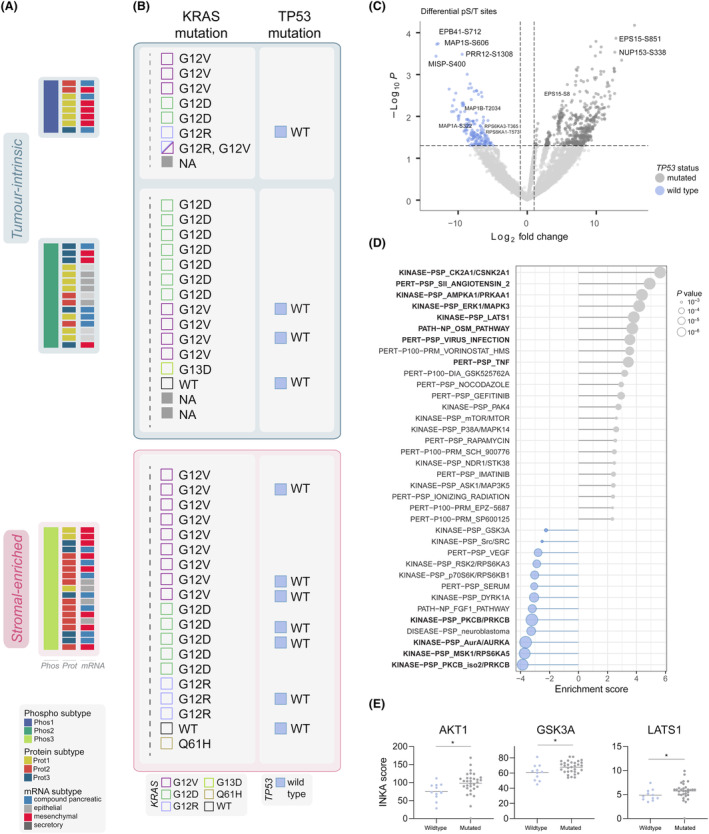
Association of KRAS and TP53 gene mutations with phosphoproteome signatures. (A) Phosphoproteome and proteome subtypes annotated with transcriptomics Dijk et al. subtypes [28]. (B) KRAS mutation status and allele variants and TP53 mutation status (see Table S6). (C) Differentially phosphorylated serine and threonine (pS/T) sites (n = 710) in TP53 mutated (n = 31) and TP53 wild type (n = 11) tumors with a fold change cut off of two and P ≤ 0.05. Two‐group comparison was performed using unpaired t‐test in limma statistics. Differential sites were involved in EGFR internalization (i.e., ANKRD13D‐T556, REPS1‐S174, EPS15‐S851), microtubule dynamics and mitotic regulators (i.e., MAP1B‐T2034, MISP‐S400, EPB41‐S712, MAP1S‐S606), cytoskeleton and EMT (FLNA‐S968, VCAN‐T2115) and downstream ERK signaling (RPS6KA3‐T365, RPS6KA1‐T573, NUP153‐S338). See also Table S9. (D) Global post‐translational modification signature enrichment (PTM‐SEA) analysis between TP53 mutated and TP53 wild type samples. In bold, significant signatures by adjusted P ≤ 0.05. (E) Integrative iNferred Kinase Activity (INKA) of phosphorylated serine and threonine (pS/T) kinases significantly enriched in TP53 mutated tumors. Significance, annotated with an asterisk, was performed using Mann–Whitney test.
In TP53‐WT tumors, the TP53 onco‐suppressive function must be overcome in order to maintain tumor growth. Interestingly, the majority of TP53 wildtype tumors were classified as Phos3 stromal‐subtype (7/11 of WT TP53 tumors, Fig. 4B). Notably, mutational status was unaffected by tumor cellularity (Fig. S10e, unpaired t test P = 0.3292). Thus, we further investigated the phosphoproteomic background of TP53 mutation status in this PDAC cohort (Fig. 4C–E, Fig. S10, Tables S8 and S9). We identified phosphorylations enriched in wildtype tumors involved in EGFR internalization and EGFR signaling/activation, microtubule dynamics and mitotic regulators, cytoskeleton and EMT, and downstream ERK signaling (Fig. 4C, Fig. S10a). Additionally, Y259 phosphorylation of RASSF1, which regulates TP53 activation [67, 68], was enriched in wildtype tumors (Fig. S10a). By PTM‐SEA analysis, wildtype tumors were found to have significantly higher levels (FDR < 0.05) of PKCB, MSK1/RPS6KA5 and AURKA kinases (Fig. 4D, Fig. S10b). Interestingly, we identified a neuroblastoma signature enriched in TP53‐WT tumors (Fig. 4D), which is known to be characterized by non‐mutated TP53, further supporting our findings.
In TP53 mutant tumors, we observed a significant enrichment (FDR < 0.05) of CK2, known to inhibit TP53 tumor suppressor function [69], AMPKA1, known to inhibit autophagy in PDAC and breast cancer [70], ERK1, LATS1, AKT1, and GSK3A kinase signaling and activity (Fig. 4D,E). In addition, we found proteins involved in apoptosis and G2/M arrest enriched in TP53 mutants (Fig. S10d). By interrogating their function, we observed that in these PDAC tumors, the regulation of apoptosis can serve as a tolerance mechanism towards stress like DNA damage or oxidative stress when TP53 is mutated [71]. This is suggested by the noticeable increase in the expression of SFN (or 14‐3‐3σ) observed in TP53‐mutated tumors in both our cohort and the CPTAC cohort (Fig. S10g). The Oncostatin M (OSM) pathway was also enhanced in TP53 mutated tumors (Fig. 4D); OSM can involve pathways such as ERK1/ERK2, JNK‐p38, and PI3K‐AKT [72], which were also fully or partially enhanced and eventually may regulate TP53 activity. This ERK‐TP53 association also highlights the crosstalk between the two mutated KRAS and TP53 genes.
3.5. Distinct phosphoprotein activities associate with patient outcomes
It has been suggested that KRAS dosage rather than allele variants drive tumorigenesis and metastasis [10]. Here, we observed that treatment naïve individuals with an overall survival (OS) lower than 12 months had elevated KRAS mRNA levels (Fig. S11c, P = 0.0776). KRAS protein levels were too low abundant to confidently verify this change at the protein level (Fig. S11d).
The association between overall survival and the multiple omics (mRNA, protein and phospho) patient groups was investigated by Kaplan–Meier analysis. Due to a small sample size and poor survival in the majority of patients, no significant associations were found among the three omic types. Nonetheless, it was observed that patients classified as Phos1 had the shortest average OS of 13 months (excluding one patient with a survival of 81 months), followed by Phos3 and Phos2 with mean OS durations of 20 and 19 months, respectively (Fig. S7a). Given that a large number of patients received adjuvant chemotherapy and/or palliative treatment (Table S1), which might influence prognosis, we focused on treatment naïve patients (no neo/‐adjuvant and/or palliative treatments received) with low and high survival times (> 29.9 months, based on a bimodal cut‐off, see Fig. S7e,f). Although the number of patients with long (n = 3) and short survival (n = 20) were not equally distributed, we identified increased signaling of cell cycle kinases CHEK1 and PLK1, PRK, AKT1, and enriched GLP1, NOTCH and KIT receptor pathways in the short survival group (PTM‐SEA, Fig. S11a). Of note, in the long survival group, the enrichment of cell cycle arrest mediator CDC7 was identified.
By using the single‐sample integrative inferred kinase activity (INKA) scoring, we explored hyperactive kinases associated with survival per tumor in the pY phosphoproteome and global (pS/T) phosphoproteome (Fig. 5 and Fig. S11). Kinase activity differed substantially between long and short survival groups despite the small number of treatment naïve long survival patients in our cohort (Fig. S11a,b). Moreover, we identified by spearman correlation several kinases significantly associated with poor overall survival such as receptor tyrosine kinases MET and EGFR (Fig. 5B,C). Other kinases slightly elevated in the poor outcome group from our cohort include: (a) CDC42BPB, a kinase involved in cytoskeleton reorganization and migration; (b) PAK2 kinase, a poor prognostic marker in PDAC [73] and found to be activated by TGFβ secretion mediated by fibroblasts [74] and involved in cytoskeleton reorganization, and (c) cell cycle regulators STK10 and CDK7, both involved in tumor progression [75]. Interestingly, CDK7 inhibition has been recently combined in vivo with gemcitabine and nab‐paclitaxel to overcome chemoresistance in PDAC with strong synergistic results [76], and a phase I clinical trial is now on going (clinicaltrials.gov, NCT04247126). Although MAPK1/3 were not significant (Fig. 5B,C), by reanalyzing Cao et al. [23] data on a subset of tumors for which overall survival data was available (n = 67), we identified MAPK1 activity to slightly correlate with poor overall survival (ρ = −0.251, P = 0.041), together with SRPK2 (ρ = −0.25, P = 0.041) and ULK1 (ρ = −0.285, P = 0.019) kinases. By correlating the expression of these poor outcome associated kinases to the expression of proliferation marker MKI67 in the larger cohort of Cao et al., we could confirm MET (ρ = 0.22, P = 0.007), CDK1 (ρ = 0.63, P = 9.12E‐17) and CDK2 (ρ = 0.27, P = 5.7E‐6). Overall, these findings confirm that poor outcome PDAC patients exhibit aggressive cancer behavior, marked by robust proliferative signals.
Fig. 5.
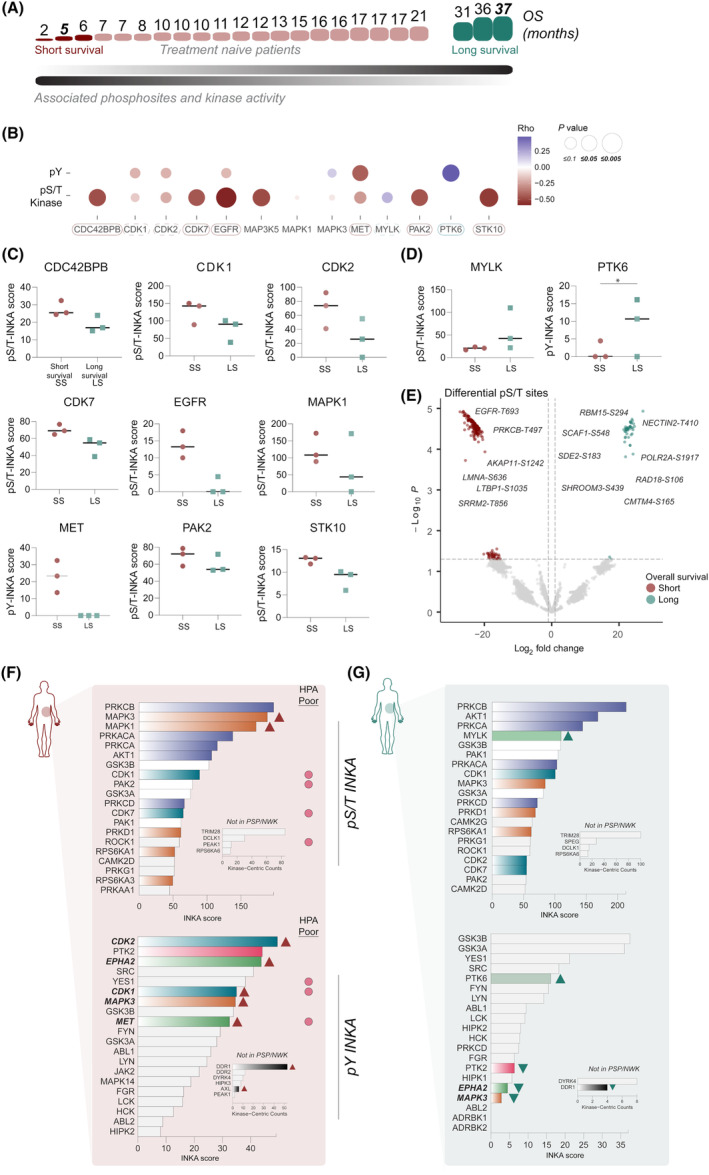
Kinase activity in short and long survival (treatment naïve) patients. (A) Spearman correlation of phosphorylated serine and threonine (pS/T)‐based Integrative iNferred Kinase Activity (INKA) kinases. (B) Overview of Spearman correlation coefficients and P values between INKA kinases at phosphotyrosine (pY) and pS/T level and overall survival in treatment naïve patient subset. Boxes suggest kinase relevance in prognosis outcomes. (C) Elevated INKA scores of pS/T and pY‐based kinases in short survival (SS) patients. Short and long survival groups were defined with patients with opposing outcomes. (D) Elevated INKA scores of pS/T and pY‐based kinases in long survival (LS) patients. *P = 0.0406, significance performed using Mann–Whitney test. (E) Volcano plot representing differential pS/T sites between poor and better survival patients (3 vs 3) with fold change two and P ≤ 0.05. Two‐group comparison was performed using unpaired t‐test in limma statistics. See also Table S10. (F) pS/T and pY‐based INKA profile of poor survival patient (overall survival, OS = 5 months). Significant poor prognostic markers by Human Protein Atlas (HPA) were annotated. (G) pS/T and pY‐based INKA profile of long survival patient (OS = 37 months). For both patients, kinase‐centric counts of kinases with no kinase‐substrate relations in PSP/NWK are also displayed. INKA kinases were colored to pinpoint common members of signaling pathways and to highlight the differences between patients.
We additionally found PTK6 activity to significantly correlate with higher overall survival rates (Fig. 5D). Additionally, we observed differential phosphorylations at pS/T level and at pY level (Fig. 5E, Fig. S11b, Tables S10 and S11) in the short survival patients (n = 3), such as EGFR‐T693, PRKCB‐T497, LMNA‐S636, and LTBP1‐S1035; and RBM15‐S294, NECTIN2‐T410 and SCAF1‐S548 in the long survival group (n = 3).
By comparing the (top 20) individual INKA profiles of two patients with opposing survival outcomes (5 vs 37 months), we observed strongly elevated MAPK signaling at pS/T and pY level in the short survival patient (Fig. 5E) as was evident from both the high INKA score and rank, while PI3K‐AKT signaling was high in both profiles. Interestingly, at the pY level, not only CDK1 and CDK2 but also EPHA2, MET, and DDR1 receptor tyrosine kinases were hyperactive in the poor survival patient profile and absent in the long survival profile. Of note, several of these kinases have been defined by Human Protein Atlas (HPA) database as poor prognostic markers for PDAC patients, and others, such as the DDR1 receptor have also been suggested to predict poor outcomes [77, 78, 79]. Interestingly, the long survival patient showed a 5‐fold increased MYLK kinase hyperactivity compared to the poor survival patient. This difference in MYLK activity was also observed between the extreme outcome groups (Fig. 5D). This kinase is commonly expressed in epithelial cells and its downregulation has been associated with an increase in motility and invasiveness in several cancer types [80, 81, 82]. Interestingly, MYLK expression significantly and inversely correlated with increased expression of cycle kinases CDK1 and CDK2 and proliferative marker MKI67 in the larger PDAC cohort of Cao et al. (Fig. S11e). Likewise, in this external cohort, MYLK expression was found to be increased in patients with improved outcomes (Fig. S11f,g), which further supports the significance of this kinase as a potential indicator for better prognosis. Besides, its loss has been associated with elevated EGFR and ERK signaling, which was observed in the short survival group with an additional increase of CDK signaling (Fig. 5B).
Our focus on patients with extreme outcomes allowed us to identify specific kinases that likely play a direct role in tumor progression. These kinases hold potential as valuable prognostic markers for PDAC.
4. Discussion
Quantitative profiling of tumors following a phosphoproteomic approach has shown to generate a precise and comprehensive data set with thousands of phosphosites and proteins. It has led to the discovery of clinically relevant markers, for diagnosis and prognostic purposes, and has unraveled druggable targets in multiple cancer types [16, 20, 32, 83, 84, 85]. So far, only proteogenomic efforts, especially those including phosphoproteomics, have been able to come up with therapeutic strategies in multiple cancer types [16, 19, 22, 86, 87, 88].
In this study, we report a comprehensive phosphoproteome and proteome of PDAC tissues from which three main subtypes were derived. Despite using a subset (42/90) of Dijk et al. [28] cohort tumors, different RNA subgroups aligned with the three Phos subtypes. In line with this, all the epithelial RNA classified tumors were captured in the Phos2 subtype, Phos1 subtype consisted only of mesenchymal and compound tumors, and stroma‐enriched Phos3 showed a mixed profile of mesenchymal, compound and secretory tumors.
The tumor and stromal cell enrichment was largely reflected in the proteome‐based subtypes. We identified two tumor‐intrinsic subtypes, Prot1, and Prot3, the latter one potentially being an intermediate state to a more stromal and basal‐like subtype, which was captured by the Prot2 subtype. Most of the enriched TME signatures were myCAF and iCAF, mostly in Prot1 and Prot2 clusters. The MAPK and JAK–STAT pathways are critically involved in the activation of these cells, playing a role in promoting tumorigenesis and cancer invasion [89]. Furthermore, TGFβ secretion is known to be also mediated by CAFs, stimulating PDAC growth and promoting EMT [89, 90, 91]. Interestingly, TGFβ signaling was the highest in the Prot3 cluster, suggesting Prot3 may recapitulate this interplay tumor‐TME cells to activate different oncogenic pathways [92]. Despite not including normal adjacent tissues, we identified the PDAC biology found in tumor vs normal adjacent tissue comparisons performed in two recent studies, such as extracellular matrix organization, actin filament organization, complement and coagulation, focal adhesion, fatty acid metabolism and platelet activation [22, 23]. In Cao et al., two main subtypes capturing classical and basal‐like features were identified by integrating multiple omic layers and leaving out low cellularity samples [23], and in Tong et al., protein expression clustering divided the cohort into three main proteomic subtypes, with differences in survival, enriched biology and kinase activity, mainly based on phosphosubstrate abundance. Something similar was inferred from the PDAC proteogenomic study by Hyeon et al. [24], whereby a first‐step clustering tumors were classified into three main subtypes by using RNA, protein or phosphoprotein data. To the best of our knowledge, none of these cohorts were classified into subtypes by using phosphoproteomic features alone. Unfortunately, the dataset by Tong et al. as well as the article and dataset by Hyeon et al., were not accessible for download. This underscores the pivotal importance of data accessibility to enable the reuse of data in accordance with FAIR principles for biomedical research [93].
Kinases play a key role in regulating alternative splicing events [60], which hold significant physiological importance in conferring functional diversity within tumors, including PDAC [59, 61]. In fact, this complex mechanism is known to regulate the post‐transcriptional gene expression during, for example, tumor progression and treatment resistance in PDAC [94, 95]. At the phosphoproteomic level, we identified members of RNA splicing and spliceosome such as SRRM1/2, TRA2A/B or SRSF proteins, which were different across the Phos subtypes. Interestingly, a recent re‐analysis of a cohort of n = 177 PDAC tumors also found three patient subtypes based on alternative splicing data [96]. These differences in splicing‐related phosphorylation events provide valuable insights into comprehending the diversity within these distinct phosphoproteomic PDAC groups.
Pancreatic ductal adenocarcinoma is characterized by the lack of druggable drivers, e.g. KRAS, although emerging studies are showing promising results by more selective KRAS inhibitors [97]. Our study aimed to identify drug‐therapeutic strategies for PDAC tumors, which may be used as well to prevent signaling feedback loops in future KRAS targeting approaches. Accordingly, INKA analysis nominated kinase activities differentially enriched in the three subtypes that may be relevant at the prognostic level and may be considered as druggable targets in PDAC. We observed that kinase activity profiles varied between tumor intrinsic subtypes, with a highly hyperactive Phos2 (hyperactivity of PI3K/AKT and mTOR signaling members, PTK2, SRC, EPHA2 kinases) and a less active Phos1 subtype. Furthermore, the activation of AKT2 and PRKACB kinases in Prot3 subtype (distributed in Phos1 and Phos2) was found in the previously identified S‐III subtype by Tong et al. [22]. The stromal‐like subtype, Phos3, displayed significantly higher levels of HIPK, EGFR, MET, PDGFRa, INSR, JAK2, ABL1/2, and PRKCD. Recently, PRKCD and HIPK2 have also been identified high in PDAC vs NATs, with PRKCD as a poor prognosis marker by Tong et al. [22], however we did not observe an association with survival. Moreover, activated INSR/IGF1R and JAK kinases in Phos3 could be associated with EMT and cancer stemness [98], as well as the immunosuppression [99]. HIPK1 in this subtype could be involved in CAF differentiation and invasion [100, 101]. Altogether, Phos3 recapitulated kinase activities that may play a role in the interaction with the tumor microenvironment and may serve to design better therapeutic regimes and tackle the stromal barrier. Patient group profiles underscored not only the need for combination treatments but also for personalized treatment strategies. PI3K/AKT and MAPK pathways showed the highest hyperactivity in the pS/T‐based INKA ranking regardless subtype. This supports recent preclinical findings of a combination screening study and of our phosphoproteomic guided study, where low‐dose drug combinations containing PI3K/AKT and MAPK inhibitors showed higher effectivity and synergism [26, 102]. Heterogeneity in signaling was found at the pY‐based INKA level between patients uncovering different drivers in subsets of patient samples, especially among the stroma‐enriched Phos3 group, which underscores the heterogeneity of the stroma and highlights the need for a more sophisticated and personalized approach.
Interestingly, EPHA2, the expression of which has been associated with the immunosuppressive environment in PDAC [103], turned out to be the most active receptor tyrosine kinase. Others, such as MET, INSR, EGFR and FGFR1 were found to be particularly high in tumors enriched in stroma, underscoring the importance of individual profiles in guiding therapy selection. Of note, we previously reported EPHA2 and EGFR to be elevated in the tumor cell compartment of PDAC tissues [46]. Our reanalysis and inspection of the phosphoproteomics data of two recent proteogenomic studies with larger PDAC cohorts that also included normal tissues [22, 23] underscores the importance of the kinase activities in our cohort and their cancer‐association. This supports the clinical utility and relevance of our kinase activity profiling in the absence of normal adjacent tissues.
Differences in KRAS allele dosing were further investigated in this cohort. Enrichment of cell cycle regulators and MAPK targets was found in G12D mutated tumors, in line with Tong et al. [22]. The most commonly mutated gene in human tumors is TP53 [104]. Its transcriptional activity is mainly regulated by acetylation and phosphorylation [105]. Interestingly, N‐terminal TP53 phosphorylation activity (by CK1 and ERK), was found to be enriched in TP53‐mutant PDAC tumors, whereas most of the C‐terminal phosphorylations (by AURKA, PKC) were enriched in TP53‐WT PDAC tumors. We additionally observed elevated PKCB kinase activity in TP53‐WT tumors, which could be attributed to the role of PKC in regulating the tumor suppressor activity of TP53 by stabilizing the wildtype protein [106, 107]. On the other hand, mutated‐TP53 tumors exhibited higher AMPK and LATS1 activities, and a higher glycolytic and proliferative profile, shown here by higher TCA and cell cycle. AMPK kinase is known to upregulate glycolysis, inhibit mTOR [108], and to regulate autophagy and lysosomal scavenging in PDAC, which can promote immune‐evasion [109]. Interestingly, hyperactive KRAS signaling is able to promote LATS1/MDM2/TP53 apoptotic signaling [110, 111, 112] which again supports the crosstalk between KRAS and TP53 gene functions to promote PDAC invasion and growth. Despite not identifying the previously reported phosphorylation sites affected by TP53 mutated status [23] in this cohort, other residues upon same proteins were identified, with different mutated and wildtype associations (Fig. S10f).
Potential prognostic markers were elucidated in the kinase profiles of extreme outcome patients. The majority of our cohort was classified as short survival tumors, and were treated with different regimes, which added complexity to the analysis. Short survival tumors displayed higher kinase activity of MET, EGFR, STK10, CDC42BPB, CDK7, and PAK2, versus PTK6 and MYLK, which were higher in long survival tumors. Interestingly, in PDAC, elevated PTK6 levels are shown to attenuate tumor growth in vivo after gemcitabine treatment in vivo [113]. Notably, MYLK association with better outcomes was also observed in a larger PDAC cohort, further supporting our approach.
5. Conclusions
Despite the rapid development of phosphoproteomics as a valuable functional platform for the discovery of new treatments, its integration into routine clinical practice is still pending [20, 26, 114, 115]. Our INKA analysis approach, which can rank kinase activities in individual tumors, is optimally suited to specifically prioritize actionable kinases with targeting purposes [20, 21, 116]. This phosphoproteomic study contributes to better define PDAC tumors by dissecting their biology with functionally relevant data and analysis tools and suggests potential therapeutic options for the different phosphoproteomic subtypes to eventually improve patient outcomes in the near future.
Conflict of interest
MFB has received research funding from Celgene, Frame Therapeutics, and Lead Pharma. He has acted as a consultant to Servier. None of these were involved in the design of the study or the drafting of this manuscript.
Author contributions
AV‐M collected tumor samples, designed, analyzed the data, performed bioinformatic analyses, and wrote the manuscript. FD and HH contributed to sample collection. JV assessed pathology and tumor cellularity. RRG‐H performed the phosphoproteomic sample‐processing. SRP performed the mass spectrometry measurements and analyzed the data. TVP, SRP, JCK, AAH, and AV‐M performed the bioinformatic analyses. MFB, CRJ, and EG designed and supervised the study and wrote the manuscript.
Peer review
The peer review history for this article is available at https://www.webofscience.com/api/gateway/wos/peer‐review/10.1002/1878‐0261.13625.
Supporting information
Fig. S1. Large‐scale proteomic and phosphoproteomic analysis of pancreatic ductal adenocarcinoma.
Fig. S2. Data overview of the pS/T phosphoproteome of pancreatic ductal adenocarcinoma.
Fig. S3. Data overview of the pY phosphoproteome of pancreatic ductal adenocarcinoma.
Fig. S4. Data overview of the proteome of pancreatic ductal adenocarcinoma.
Fig. S5. Consensus clustering analyses of proteome and phosphoproteome.
Fig. S6. Comprehensive analysis of PDAC (phospho)proteome subtypes.
Fig. S7. Overall survival analysis of subtypes based on mRNA, proteome and phosphoproteome.
Fig. S8. Differential kinase activities among the identified PDAC phosphoproteome subtypes.
Fig. S9. Phosphoproteomic signatures among KRAS alleles G12D, G12V and G12R.
Fig. S10. Association of TP53 gene mutations with pY phosphoproteome.
Fig. S11. Phosphoproteome differences in short and long survival (treatment naïve) patients.
Table S1. Clinicopathological characteristics of the subset (42/90) of SPACIOUS cohort tumors.
Table S2. Differential proteins between the proteome subtypes.
Table S3. Differential pS/T phosphosites between the phosphoproteome subtypes.
Table S4. pS/T‐based INKA profiling of 42 PDAC tumors.
Table S5. pY‐based INKA profiling of 33 PDAC tumors.
Table S6. Mutation sequencing panel of frequently mutated genes in 42 PDAC tumors.
Table S7. Differential analysis of pS/T sites between KRAS G12D mutated and the rest of tumors (G12V, G12R).
Table S8. Differential analysis of pS/T sites between TP53 mutated and wildtype tumors.
Table S9. Differential analysis of pY sites between TP53 mutated and wildtype tumors.
Table S10. Differential analysis of pS/T sites between long (n = 3) and short survival (n = 3) patients.
Table S11. Differential analysis of pY sites between long (n = 3) and short survival (n = 3) patients.
Acknowledgements
This project was supported by the Dutch Cancer Society (KWF Kankerbestrijding, grant KWF2016‐1/10212 to CRJ, MFB and EG). Cancer Center Amsterdam and Netherlands Organisation for Scientific Research (NWO‐Middelgroot project number 91116017) are acknowledged for support of the mass spectrometry infrastructure and Surfsara for computing infrastructure (reference e‐infra180166).
Connie R. Jiménez and Maarten F. Bijlsma share senior authorship
Contributor Information
Elisa Giovannetti, Email: e.giovannetti@amsterdamumc.nl.
Connie R. Jiménez, Email: c.jimenez@amsterdamumc.nl.
Maarten F. Bijlsma, Email: m.f.bijlsma@amsterdamumc.nl.
Data accessibility
The mass spectrometry proteomics data have been deposited to the ProteomeXchange Consortium via the PRIDE [117] partner repository with the dataset identifier PXD043111. Human Swiss‐Prot database used for raw data search was acquired from the UniProt database (https://www.uniprot.org/).
References
- 1. Mizrahi JD, Surana R, Valle JW, Shroff RT. Pancreatic cancer. Lancet. 2020;395:2008–2020. [DOI] [PubMed] [Google Scholar]
- 2. Rahib L, Smith BD, Aizenberg R, Rosenzweig AB, Fleshman JM, Matrisian LM. Projecting cancer incidence and deaths to 2030: the unexpected burden of thyroid, liver, and pancreas cancers in the United States. Cancer Res. 2014;74(11):2913–2921. [DOI] [PubMed] [Google Scholar]
- 3. Strobel O, Lorenz P, Hinz U, Gaida M, König AK, Hank T, et al. Actual five‐year survival after upfront resection for pancreatic ductal adenocarcinoma: who beats the odds? Ann Surg. 2022;275(5):962–971. [DOI] [PubMed] [Google Scholar]
- 4. Springfeld C, Ferrone CR, Katz MHG, Philip PA, Hong TS, Hackert T, et al. Neoadjuvant therapy for pancreatic cancer. Nat Rev Clin Oncol. 2023;20(5):318–337. [DOI] [PubMed] [Google Scholar]
- 5. Collisson EA, Bailey P, Chang DK, Biankin AV. Molecular subtypes of pancreatic cancer. Nat Rev Gastroenterol Hepatol. 2019;16(4):207–220. [DOI] [PubMed] [Google Scholar]
- 6. Zhang Y, Chen F, Chandrashekar DS, Varambally S, Creighton CJ. Proteogenomic characterization of 2002 human cancers reveals pan‐cancer molecular subtypes and associated pathways. Nat Commun. 2022;13(1):1–19. [DOI] [PMC free article] [PubMed] [Google Scholar]
- 7. Diehl AC, Hannan LM, Zhen DB, Coveler AL, King G, Cohen SA, et al. KRAS mutation variants and co‐occurring PI3K pathway alterations impact survival for patients with pancreatic ductal adenocarcinomas. Oncologist. 2022;27(12):1025–1033. [DOI] [PMC free article] [PubMed] [Google Scholar]
- 8. Hendifar AE, Blais EM, Ng C, Thach D, Gong J, Sohal D, et al. Comprehensive analysis of KRAS variants in patients (pts) with pancreatic cancer (PDAC): clinical/molecular correlations and real‐world outcomes across standard therapies. J Clin Oncol. 2020;38(15_Suppl):4641. 10.1200/JCO20203815_suppl4641 [DOI] [Google Scholar]
- 9. Shen H, Lundy J, Strickland AH, Harris M, Swan M, Desmond C, et al. KRAS G12D mutation subtype in pancreatic ductal adenocarcinoma: does it influence prognosis or stage of disease at presentation? Cells. 2022;11(19):3175. [DOI] [PMC free article] [PubMed] [Google Scholar]
- 10. Mueller S, Engleitner T, Maresch R, Zukowska M, Lange S, Kaltenbacher T, et al. Evolutionary routes and KRAS dosage define pancreatic cancer phenotypes. Nature. 2018;554(7690):62–68. [DOI] [PMC free article] [PubMed] [Google Scholar]
- 11. Raphael BJ, Hruban RH, Aguirre AJ, Moffitt RA, Yeh JJ, Stewart C, et al. Integrated genomic characterization of pancreatic ductal adenocarcinoma. Cancer Cell. 2017;32(2):185–203.e13. [DOI] [PMC free article] [PubMed] [Google Scholar]
- 12. Werba G, Weissinger D, Kawaler EA, Zhao E, Kalfakakou D, Dhara S, et al. Single‐cell RNA sequencing reveals the effects of chemotherapy on human pancreatic adenocarcinoma and its tumor microenvironment. Nat Commun. 2023;14(1):1–16. [DOI] [PMC free article] [PubMed] [Google Scholar]
- 13. Huang L, Guo Z, Wang F, Fu L. KRAS mutation: from undruggable to druggable in cancer. Signal Transduct Target Ther. 2021;6(1):386. [DOI] [PMC free article] [PubMed] [Google Scholar]
- 14. Zhu C, Guan X, Zhang X, Luan X, Song Z, Cheng X, et al. Targeting KRAS mutant cancers: from druggable therapy to drug resistance. Mol Cancer. 2022;21(1):1–19. [DOI] [PMC free article] [PubMed] [Google Scholar]
- 15. Vasaikar S, Huang C, Wang X, Petyuk VA, Savage SR, Wen B, et al. Proteogenomic analysis of human colon cancer reveals new therapeutic opportunities. Cell. 2019;177(4):1035–1049.e19. [DOI] [PMC free article] [PubMed] [Google Scholar]
- 16. Gillette MA, Satpathy S, Cao S, Dhanasekaran SM, Vasaikar SV, Krug K, et al. Proteogenomic characterization reveals therapeutic vulnerabilities in lung adenocarcinoma. Cell. 2020;182(1):200–225.e35. [DOI] [PMC free article] [PubMed] [Google Scholar]
- 17. Li Y, Yang B, Ma Y, Peng X, Wang Z, Sheng B, et al. Phosphoproteomics reveals therapeutic targets of esophageal squamous cell carcinoma. Signal Transduct Target Ther. 2021;6(1):381. [DOI] [PMC free article] [PubMed] [Google Scholar]
- 18. Hirano H, Abe Y, Nojima Y, Aoki M, Shoji H, Isoyama J, et al. Temporal dynamics from phosphoproteomics using endoscopic biopsy specimens provides new therapeutic targets in stage IV gastric cancer. Sci Rep. 2022;12(1):1–13. [DOI] [PMC free article] [PubMed] [Google Scholar]
- 19. Krug K, Jaehnig EJ, Satpathy S, Blumenberg L, Karpova A, Anurag M, et al. Proteogenomic landscape of breast cancer tumorigenesis and targeted therapy. Cell. 2020;183(5):1436–1456.e31. [DOI] [PMC free article] [PubMed] [Google Scholar]
- 20. Cordo' V, Meijer MT, Hagelaar R, de Goeij‐de Haas RR, Poort VM, Henneman AA, et al. Phosphoproteomic profiling of T cell acute lymphoblastic leukemia reveals targetable kinases and combination treatment strategies. Nat Commun. 2022;13(1):1–13. [DOI] [PMC free article] [PubMed] [Google Scholar]
- 21. van Alphen C, Cloos J, Beekhof R, Cucchi DGJ, Piersma SR, Knol JC, et al. Phosphotyrosine‐based phosphoproteomics for target identification and drug response prediction in AML cell lines. Mol Cell Proteomics. 2020;19(5):884–899. [DOI] [PMC free article] [PubMed] [Google Scholar]
- 22. Tong Y, Sun M, Chen L, Wang Y, Li Y, Li L, et al. Proteogenomic insights into the biology and treatment of pancreatic ductal adenocarcinoma. J Hematol Oncol. 2022;15(1):168. [DOI] [PMC free article] [PubMed] [Google Scholar]
- 23. Cao L, Huang C, Cui Zhou D, Hu Y, Lih TM, Savage SR, et al. Proteogenomic characterization of pancreatic ductal adenocarcinoma. Cell. 2021;184(19):5031–5052.e26. [DOI] [PMC free article] [PubMed] [Google Scholar]
- 24. Hyeon DY, Nam D, Han Y, Kim DK, Kim G, Kim D, et al. Proteogenomic landscape of human pancreatic ductal adenocarcinoma in an Asian population reveals tumor cell‐enriched and immune‐rich subtypes. Nat Cancer. 2023;4(2):290–307. [DOI] [PubMed] [Google Scholar]
- 25. Cui Zhou D, Jayasinghe RG, Chen S, Herndon JM, Iglesia MD, Navale P, et al. Spatially restricted drivers and transitional cell populations cooperate with the microenvironment in untreated and chemo‐resistant pancreatic cancer. Nat Genet. 2022;54(9):1390–1405. [DOI] [PMC free article] [PubMed] [Google Scholar]
- 26. Vallés‐Martí A, Mantini G, Manoukian P, Waasdorp C, Sarasqueta AF, de Goeij‐de Haas RR, et al. Phosphoproteomics guides effective low‐dose drug combinations against pancreatic ductal adenocarcinoma. Cell Rep. 2023;42(6):112581. [DOI] [PubMed] [Google Scholar]
- 27. Le Large TYS, Bijlsma MF, El Hassouni B, Mantini G, Lagerweij T, Henneman AA, et al. Focal adhesion kinase inhibition synergizes with nab‐paclitaxel to target pancreatic ductal adenocarcinoma. J Exp Clin Cancer Res. 2021;40(1):1–12. [DOI] [PMC free article] [PubMed] [Google Scholar]
- 28. Dijk F, Veenstra VL, Soer EC, Dings MPG, Zhao L, Halfwerk JB, et al. Unsupervised class discovery in pancreatic ductal adenocarcinoma reveals cell‐intrinsic mesenchymal features and high concordance between existing classification systems. Sci Rep. 2020;10(1):1–12. [DOI] [PMC free article] [PubMed] [Google Scholar]
- 29. Zhang W, Sakashita S, Taylor P, Tsao MS, Moran MF. Comprehensive proteome analysis of fresh frozen and optimal cutting temperature (OCT) embedded primary non‐small cell lung carcinoma by LC‐MS/MS. Methods. 2015;81:50–55. [DOI] [PubMed] [Google Scholar]
- 30. Satpathy S, Jaehnig EJ, Krug K, Kim BJ, Saltzman AB, Chan DW, et al. Microscaled proteogenomic methods for precision oncology. Nat Commun. 2020;11(1):1–16. [DOI] [PMC free article] [PubMed] [Google Scholar]
- 31. Beekhof R, van Alphen C, Henneman AA, Knol JC, Pham TV, Rolfs F, et al. INKA, an integrative data analysis pipeline for phosphoproteomic inference of active kinases. Mol Syst Biol. 2019;15(4):e8250. [DOI] [PMC free article] [PubMed] [Google Scholar]
- 32. Cucchi DGJ, Van Alphen C, Zweegman S, Van Kuijk B, Kwidama ZJ, Al Hinai A, et al. Phosphoproteomic characterization of primary AML samples and relevance for response toward FLT3‐inhibitors. Hemasphere. 2021;5(7):e606. [DOI] [PMC free article] [PubMed] [Google Scholar]
- 33. Cox J, Mann M. MaxQuant enables high peptide identification rates, individualized p.p.b.‐range mass accuracies and proteome‐wide protein quantification. Nat Biotechnol. 2008;26(12):1367–1372. [DOI] [PubMed] [Google Scholar]
- 34. Team RC . R: a language and environment for statistical computing. Vienna: R Foundation for Statistical Computing; 2022. [Google Scholar]
- 35. gplots: various R programming tools for plotting data – ScienceOpen [Internet] [cited 2022 Dec 13]. Available from: https://www.scienceopen.com/document?vid=0e5d8e31‐1fe4‐492f‐a3d8‐8cd71b2b8ad9
- 36. Wilkerson MD, Hayes DN. ConsensusClusterPlus: a class discovery tool with confidence assessments and item tracking. Bioinformatics. 2010;26(12):1572–1573. [DOI] [PMC free article] [PubMed] [Google Scholar]
- 37. Gu Z, Eils R, Schlesner M. Complex heatmaps reveal patterns and correlations in multidimensional genomic data. Bioinformatics. 2016;32(18):2847–2849. [DOI] [PubMed] [Google Scholar]
- 38. Subramanian A, Tamayo P, Mootha VK, Mukherjee S, Ebert BL, Gillette MA, et al. Gene set enrichment analysis: a knowledge‐based approach for interpreting genome‐wide expression profiles. Proc Natl Acad Sci USA. 2005;102(43):15545–15550. [DOI] [PMC free article] [PubMed] [Google Scholar]
- 39. Hänzelmann S, Castelo R, Guinney J. GSVA: gene set variation analysis for microarray and RNA‐Seq data. BMC Bioinformatics. 2013;14:7. [DOI] [PMC free article] [PubMed] [Google Scholar]
- 40. Liberzon A, Subramanian A, Pinchback R, Thorvaldsdóttir H, Tamayo P, Mesirov JP. Molecular signatures database (MSigDB) 3.0. Bioinformatics. 2011;27(12):1739–1740. [DOI] [PMC free article] [PubMed] [Google Scholar]
- 41. Krug K, Mertins P, Zhang B, Hornbeck P, Raju R, Ahmad R, et al. A curated resource for phosphosite‐specific signature analysis. Mol Cell Proteomics. 2019;18(3):576–593. [DOI] [PMC free article] [PubMed] [Google Scholar]
- 42. Chapman SJ, Khor CC, Vannberg FO, Maskell NA, Davies CW, Hedley EL, et al. GenePattern 2.0. Nat Genet. 2006;38(5):500–501. [DOI] [PubMed] [Google Scholar]
- 43. Moffitt RA, Marayati R, Flate EL, Volmar KE, Loeza SGH, Hoadley KA, et al. Virtual microdissection identifies distinct tumor‐ and stroma‐specific subtypes of pancreatic ductal adenocarcinoma. Nat Genet. 2015;47(10):1168–1178. [DOI] [PMC free article] [PubMed] [Google Scholar]
- 44. Collisson EA, Sadanandam A, Olson P, Gibb WJ, Truitt M, Gu S, et al. Subtypes of pancreatic ductal adenocarcinoma and their differing responses to therapy. Nat Med. 2011;17(4):500–503. [DOI] [PMC free article] [PubMed] [Google Scholar]
- 45. Bailey P, Chang DK, Nones K, Johns AL, Patch AM, Gingras MC, et al. Genomic analyses identify molecular subtypes of pancreatic cancer. Nature. 2016;531(7592):47–52. [DOI] [PubMed] [Google Scholar]
- 46. Le Large TYS, Mantini G, Meijer LL, Pham TV, Funel N, van Grieken NCT, et al. Microdissected pancreatic cancer proteomes reveal tumor heterogeneity and therapeutic targets. JCI Insight. 2020;5(15):e138290. [DOI] [PMC free article] [PubMed] [Google Scholar]
- 47. Yoshihara K, Shahmoradgoli M, Martínez E, Vegesna R, Kim H, Torres‐Garcia W, et al. Inferring tumour purity and stromal and immune cell admixture from expression data. Nat Commun. 2013;4(1):1–11. [DOI] [PMC free article] [PubMed] [Google Scholar]
- 48. Senapati S, Gnanapragassam VS, Moniaux N, Momi N, Batra SK. Role of MUC4–NIDO domain in the MUC4‐mediated metastasis of pancreatic cancer cells. Oncogene. 2012;31(28):3346–3356. [DOI] [PMC free article] [PubMed] [Google Scholar]
- 49. Li N, Zhao X, You S. Identification of key regulators of pancreatic ductal adenocarcinoma using bioinformatics analysis of microarray data. Medicine (Baltimore). 2019;98(2):e14074. [DOI] [PMC free article] [PubMed] [Google Scholar]
- 50. Wang Y, Liang Y, Xu H, Zhang X, Mao T, Cui J, et al. Single‐cell analysis of pancreatic ductal adenocarcinoma identifies a novel fibroblast subtype associated with poor prognosis but better immunotherapy response. Cell Discov. 2021;7(1):1–17. [DOI] [PMC free article] [PubMed] [Google Scholar]
- 51. Barrett AS, Maller O, Pickup MW, Weaver VM, Hansen KC. Compartment resolved proteomics reveals a dynamic matrisome in a biomechanically driven model of pancreatic ductal adenocarcinoma. J Immunol Regen Med. 2018;1:67–75. [DOI] [PMC free article] [PubMed] [Google Scholar]
- 52. Daemen A, Peterson D, Sahu N, McCord R, Du X, Liu B, et al. Metabolite profiling stratifies pancreatic ductal adenocarcinomas into subtypes with distinct sensitivities to metabolic inhibitors. Proc Natl Acad Sci USA. 2015;112(32):E4410–E4417. [DOI] [PMC free article] [PubMed] [Google Scholar]
- 53. Singh S, Arcaroli JJ, Orlicky DJ, Chen Y, Messersmith WA, Bagby S, et al. ALDH1B1 as a modulator of pancreatic adenocarcinoma. Pancreas. 2016;45(1):117–122. [DOI] [PMC free article] [PubMed] [Google Scholar]
- 54. Neuzillet C, Tijeras‐Raballand A, Ragulan C, Cros J, Patil Y, Martinet M, et al. Inter‐ and intra‐tumoural heterogeneity in cancer‐associated fibroblasts of human pancreatic ductal adenocarcinoma. J Pathol. 2019;248(1):51–65. [DOI] [PMC free article] [PubMed] [Google Scholar]
- 55. Principe DR, Timbers KE, Atia LG, Koch RM, Rana A. TGFβ signaling in the pancreatic tumor microenvironment. Cancers (Basel). 2021;13(20):5086. [DOI] [PMC free article] [PubMed] [Google Scholar]
- 56. David CJ, Huang YH, Chen M, Su J, Zou Y, Bardeesy N, et al. TGF‐β tumor suppression through a lethal EMT. Cell. 2016;164(5):1015–1030. [DOI] [PMC free article] [PubMed] [Google Scholar]
- 57. Schneider M, Hsiao HH, Will CL, Giet R, Urlaub H, Lührmann R. Human PRP4 kinase is required for stable tri‐snRNP association during spliceosomal B complex formation. Nat Struct Mol Biol. 2010;17(2):216–221. [DOI] [PubMed] [Google Scholar]
- 58. Eckert D, Andrée N, Razanau A, Zock‐Emmenthal S, Lützelberger M, Plath S, et al. Prp4 kinase grants the license to splice: control of weak splice sites during spliceosome activation. PLoS Genet. 2016;12(1):e1005768. [DOI] [PMC free article] [PubMed] [Google Scholar]
- 59. Escobar‐Hoyos LF, Penson A, Kannan R, Cho H, Pan CH, Singh RK, et al. Altered RNA splicing by mutant p53 activates oncogenic RAS signaling in pancreatic cancer. Cancer Cell. 2020;38(2):198–211.e8. [DOI] [PMC free article] [PubMed] [Google Scholar]
- 60. Naro C, Bielli P, Sette C. Oncogenic dysregulation of pre‐mRNA processing by protein kinases: challenges and therapeutic opportunities. FEBS J. 2021;288(21):6250–6272. [DOI] [PMC free article] [PubMed] [Google Scholar]
- 61. Marasco LE, Kornblihtt AR. The physiology of alternative splicing. Nat Rev Mol Cell Biol. 2022;24(4):242–254. [DOI] [PubMed] [Google Scholar]
- 62. Arshad OA, Danna V, Petyuk VA, Piehowski PD, Liu T, Rodland KD, et al. An integrative analysis of tumor proteomic and phosphoproteomic profiles to examine the relationships between kinase activity and phosphorylation. Mol Cell Proteomics. 2019;18(8):S26–S36. [DOI] [PMC free article] [PubMed] [Google Scholar]
- 63. Pecoraro C, Faggion B, Balboni B, Carbone D, Peters GJ, Diana P, et al. GSK3β as a novel promising target to overcome chemoresistance in pancreatic cancer. Drug Resist Updat. 2021;58:100779. [DOI] [PubMed] [Google Scholar]
- 64. Cook JH, Melloni GEM, Gulhan DC, Park PJ, Haigis KM. The origins and genetic interactions of KRAS mutations are allele‐ and tissue‐specific. Nat Commun. 2021;12(1):1–14. [DOI] [PMC free article] [PubMed] [Google Scholar]
- 65. Brubaker DK, Paulo JA, Sheth S, Poulin EJ, Popow O, Joughin BA, et al. Proteogenomic network analysis of context‐specific KRAS signaling in mouse‐to‐human cross‐species translation. Cell Syst. 2019;9(3):258–270.e6. [DOI] [PMC free article] [PubMed] [Google Scholar]
- 66. Tape CJ, Ling S, Dimitriadi M, McMahon KM, Worboys JD, Leong HS, et al. Oncogenic KRAS regulates tumor cell signaling via stromal reciprocation. Cell. 2016;165(4):910–920. [DOI] [PMC free article] [PubMed] [Google Scholar]
- 67. Zhang H, He J, Li J, Tian D, Gu L, Zhou M. Methylation of RASSF1A gene promoter is regulated by p53 and DAXX. FASEB J. 2013;27(1):232–242. [DOI] [PMC free article] [PubMed] [Google Scholar]
- 68. Song MS, Song SJ, Kim SY, Oh HJ, Lim DS. The tumour suppressor RASSF1A promotes MDM2 self‐ubiquitination by disrupting the MDM2‐DAXX‐HAUSP complex. EMBO J. 2008;27(13):1863–1874. [DOI] [PMC free article] [PubMed] [Google Scholar]
- 69. Borgo C, D'Amore C, Sarno S, Salvi M, Ruzzene M. Protein kinase CK2: a potential therapeutic target for diverse human diseases. Signal Transduct Target Ther. 2021;6(1):1–20. [DOI] [PMC free article] [PubMed] [Google Scholar]
- 70. Cordani M, Oppici E, Dando I, Butturini E, Dalla Pozza E, Nadal‐Serrano M, et al. Mutant p53 proteins counteract autophagic mechanism sensitizing cancer cells to mTOR inhibition. Mol Oncol. 2016;10(7):1008–1029. [DOI] [PMC free article] [PubMed] [Google Scholar]
- 71. Li Z, Liu JY, Zhang JT. 14‐3‐3σ, the double‐edged sword of human cancers. Am J Transl Res. 2009;1(4):326–340. [PMC free article] [PubMed] [Google Scholar]
- 72. Masjedi A, Hajizadeh F, Beigi Dargani F, Beyzai B, Aksoun M, Hojjat‐Farsangi M, et al. Oncostatin M: a mysterious cytokine in cancers. Int Immunopharmacol. 2021;90:107158. [DOI] [PubMed] [Google Scholar]
- 73. Yao GW, Bai JR, Zhang DP. P21 activated kinase 2 promotes pancreatic cancer growth and metastasis. Oncol Lett. 2019;17(4):3709–3718. [DOI] [PMC free article] [PubMed] [Google Scholar] [Retracted]
- 74. Wilkes MC, Murphy SJ, Garamszegi N, Leof EB. Cell‐type‐specific activation of PAK2 by transforming growth factor β independent of Smad2 and Smad3. Mol Cell Biol. 2003;23(23):8878–8889. [DOI] [PMC free article] [PubMed] [Google Scholar]
- 75. Annunziata MC, Parisi M, Esposito G, Fabbrocini G, Ammendola R, Cattaneo F. Phosphorylation sites in protein kinases and phosphatases regulated by formyl peptide receptor 2 signaling. Int J Mol Sci. 2020;21(11):3818. [DOI] [PMC free article] [PubMed] [Google Scholar]
- 76. Zeng S, Lan B, Ren X, Zhang S, Schreyer D, Eckstein M, et al. CDK7 inhibition augments response to multidrug chemotherapy in pancreatic cancer. J Exp Clin Cancer Res. 2022;41(1):1–18. [DOI] [PMC free article] [PubMed] [Google Scholar]
- 77. Huo Y, Yang M, Liu W, Yang J, Fu X, Liu D, et al. High expression of DDR1 is associated with the poor prognosis in Chinese patients with pancreatic ductal adenocarcinoma. J Exp Clin Cancer Res. 2015;34(1):1–7. [DOI] [PMC free article] [PubMed] [Google Scholar]
- 78. Su H, Yang F, Fu R, Trinh B, Sun N, Liu J, et al. Collagenolysis‐dependent DDR1 signalling dictates pancreatic cancer outcome. Nature. 2022;610(7931):366–372. [DOI] [PMC free article] [PubMed] [Google Scholar]
- 79. Deng J, Kang Y, Cheng CC, Li X, Dai B, Katz MH, et al. DDR1‐induced neutrophil extracellular traps drive pancreatic cancer metastasis. JCI Insight. 2021;6(17):e146133. [DOI] [PMC free article] [PubMed] [Google Scholar]
- 80. Wong SY, Ulrich TA, Deleyrolle LP, MacKay JL, Lin JMG, Martuscello RT, et al. Constitutive activation of myosin‐dependent contractility sensitizes glioma tumor‐initiating cells to mechanical inputs and reduces tissue invasion. Cancer Res. 2015;75(6):1113–1122. [DOI] [PMC free article] [PubMed] [Google Scholar]
- 81. Kim DY, Helfman DM. Loss of MLCK leads to disruption of cell–cell adhesion and invasive behavior of breast epithelial cells via increased expression of EGFR and ERK/JNK signaling. Oncogene. 2016;35(34):4495–4508. [DOI] [PubMed] [Google Scholar]
- 82. Cao F, Zhu L, Zhang J, Pongkorpsakol P, Kuo WT, Turner JR, et al. Myosin light chain kinase is a potential target for hypopharyngeal cancer treatment. Biomed Pharmacother. 2020;131:110665. [DOI] [PMC free article] [PubMed] [Google Scholar]
- 83. Casado P, Cutillas PR. Proteomic characterization of acute myeloid leukemia for precision medicine. Mol Cell Proteomics. 2023;22(4):100517. [DOI] [PMC free article] [PubMed] [Google Scholar]
- 84. Mantini G, Pham TV, Piersma SR, Jimenez CR. Computational analysis of phosphoproteomics data in multi‐omics cancer studies. Proteomics. 2021;21(3–4):1900312. [DOI] [PubMed] [Google Scholar]
- 85. Lih TM, Cho KC, Schnaubelt M, Hu Y, Zhang H. Integrated glycoproteomic characterization of clear cell renal cell carcinoma. Cell Rep. 2023;42(5):112409. [DOI] [PMC free article] [PubMed] [Google Scholar]
- 86. Rikova K, Guo A, Zeng Q, Possemato A, Yu J, Haack H, et al. Global survey of phosphotyrosine signaling identifies oncogenic kinases in lung cancer. Cell. 2007;131(6):1190–1203. [DOI] [PubMed] [Google Scholar]
- 87. Tong M, Yu C, Zhan D, Zhang M, Zhen B, Zhu W, et al. Molecular subtyping of cancer and nomination of kinase candidates for inhibition with phosphoproteomics: reanalysis of CPTAC ovarian cancer. EBioMedicine. 2019;40:305–317. [DOI] [PMC free article] [PubMed] [Google Scholar]
- 88. Clark DJ, Dhanasekaran SM, Petralia F, Pan J, Song X, Hu Y, et al. Integrated proteogenomic characterization of clear cell renal cell carcinoma. Cell. 2019;179(4):964–983.e31. [DOI] [PMC free article] [PubMed] [Google Scholar]
- 89. Ligorio M, Sil S, Malagon‐Lopez J, Nieman LT, Misale S, Di Pilato M, et al. Stromal microenvironment shapes the intratumoral architecture of pancreatic cancer. Cell. 2019;178(1):160–175.e27. [DOI] [PMC free article] [PubMed] [Google Scholar]
- 90. Principe DR, DeCant B, Mascariñas E, Wayne EA, Diaz AM, Akagi N, et al. TGFβ signaling in the pancreatic tumor microenvironment promotes fibrosis and immune evasion to facilitate tumorigenesis. Cancer Res. 2016;76(9):2525–2539. [DOI] [PMC free article] [PubMed] [Google Scholar]
- 91. Connor AA, Gallinger S. Pancreatic cancer evolution and heterogeneity: integrating omics and clinical data. Nat Rev Cancer. 2021;22(3):131–142. [DOI] [PubMed] [Google Scholar]
- 92. Bulle A, Lim KH. Beyond just a tight fortress: contribution of stroma to epithelial‐mesenchymal transition in pancreatic cancer. Signal Transduct Target Ther. 2020;5(1):1–12. [DOI] [PMC free article] [PubMed] [Google Scholar]
- 93. Wilkinson MD, Dumontier M, Aalbersberg IJ, Appleton G, Axton M, Baak A, et al. The FAIR guiding principles for scientific data management and stewardship. Sci Data. 2016;3(1):1–9. [DOI] [PMC free article] [PubMed] [Google Scholar]
- 94. Yang C, Wu Q, Huang K, Wang X, Yu T, Liao X, et al. Genome‐wide profiling reveals the landscape of prognostic alternative splicing signatures in pancreatic ductal adenocarcinoma. Front Oncol. 2019;9:511. [DOI] [PMC free article] [PubMed] [Google Scholar]
- 95. Supadmanaba IGP, Mantini G, Randazzo O, Capula M, Muller IB, Cascioferro S, et al. Interrelationship between miRNA and splicing factors in pancreatic ductal adenocarcinoma. Epigenetics. 2022;17(4):381–404. [DOI] [PMC free article] [PubMed] [Google Scholar]
- 96. Lu J, Wei S, Lou J, Yin S, Zhou L, Zhang W, et al. Systematic analysis of alternative splicing landscape in pancreatic adenocarcinoma reveals regulatory network associated with tumorigenesis and immune response. Med Sci Monit. 2020;26:e925733. [DOI] [PMC free article] [PubMed] [Google Scholar]
- 97. Kim D, Herdeis L, Rudolph D, Zhao Y, Böttcher J, Vides A, et al. Pan‐KRAS inhibitor disables oncogenic signalling and tumour growth. Nature. 2023;619:160–166. [DOI] [PMC free article] [PubMed] [Google Scholar]
- 98. Hua H, Kong Q, Yin J, Zhang J, Jiang Y. Insulin‐like growth factor receptor signaling in tumorigenesis and drug resistance: a challenge for cancer therapy. J Hematol Oncol. 2020;13(1):1–17. [DOI] [PMC free article] [PubMed] [Google Scholar]
- 99. Doi T, Ishikawa T, Okayama T, Oka K, Mizushima K, Yasuda T, et al. The JAK/STAT pathway is involved in the upregulation of PD‐L1 expression in pancreatic cancer cell lines. Oncol Rep. 2017;37(3):1545–1554. [DOI] [PubMed] [Google Scholar]
- 100. Villegas‐Pineda JC, Ramírez‐de‐Arellano A, Bueno‐Urquiza LJ, Lizarazo‐Taborda MR, Pereira‐Suárez AL. Cancer‐associated fibroblasts in gynecological malignancies: are they really allies of the enemy? Front Oncol. 2023;13:1455. [DOI] [PMC free article] [PubMed] [Google Scholar]
- 101. Blaquiere JA, Lam Wong KK, Kinsey SD, Wu J, Verheyen EM. Homeodomain‐interacting protein kinase promotes tumorigenesis and metastatic cell behavior. Dis Model Mech. 2018;11(1):dmm031146. [DOI] [PMC free article] [PubMed] [Google Scholar]
- 102. Jaaks P, Coker EA, Vis DJ, Edwards O, Carpenter EF, Leto SM, et al. Effective drug combinations in breast, colon and pancreatic cancer cells. Nature. 2022;603(7899):166–173. [DOI] [PMC free article] [PubMed] [Google Scholar]
- 103. Markosyan N, Li J, Sun YH, Richman LP, Lin JH, Yan F, et al. Tumor cell–intrinsic EPHA2 suppresses antitumor immunity by regulating PTGS2 (COX‐2). J Clin Invest. 2019;129(9):3594–3609. [DOI] [PMC free article] [PubMed] [Google Scholar]
- 104. Mantovani F, Collavin L, Del Sal G. Mutant p53 as a guardian of the cancer cell. Cell Death Differ. 2018;26(2):199–212. [DOI] [PMC free article] [PubMed] [Google Scholar]
- 105. Bode AM, Dong Z. Post‐translational modification of p53 in tumorigenesis. Nat Rev Cancer. 2004;4(10):793–805. [DOI] [PubMed] [Google Scholar]
- 106. Coutinho I, Pereira G, Leão M, Gonçalves J, Côrte‐Real M, Saraiva L. Differential regulation of p53 function by protein kinase C isoforms revealed by a yeast cell system. FEBS Lett. 2009;583(22):3582–3588. [DOI] [PubMed] [Google Scholar]
- 107. Antal CE, Hudson AM, Kang E, Zanca C, Wirth C, Stephenson NL, et al. Cancer‐associated protein kinase C mutations reveal kinase's role as tumor suppressor. Cell. 2015;160(3):489–502. [DOI] [PMC free article] [PubMed] [Google Scholar]
- 108. Luo Z, Zang M, Guo W. AMPK as a metabolic tumor suppressor: control of metabolism and cell growth. Future Oncol. 2010;6(3):457–470. [DOI] [PMC free article] [PubMed] [Google Scholar]
- 109. Encarnación‐Rosado J, Kimmelman AC. Harnessing metabolic dependencies in pancreatic cancers. Nat Rev Gastroenterol Hepatol. 2021;18(7):482–492. [DOI] [PMC free article] [PubMed] [Google Scholar]
- 110. Matallanas D, Romano D, Al‐Mulla F, O'Neill E, Al‐Ali W, Crespo P, et al. Mutant K‐Ras activation of the proapoptotic MST2 pathway is antagonized by wild‐type K‐Ras. Mol Cell. 2011;44(6):893–906. [DOI] [PubMed] [Google Scholar]
- 111. Gillson J, Abd El‐Aziz YS, Leck LYW, Jansson PJ, Pavlakis N, Samra JS, et al. Autophagy: a key player in pancreatic cancer progression and a potential drug target. Cancers (Basel). 2022;14(14):3528. [DOI] [PMC free article] [PubMed] [Google Scholar]
- 112. Furth N, Aylon Y. The LATS1 and LATS2 tumor suppressors: beyond the hippo pathway. Cell Death Differ. 2017;24(9):1488–1501. [DOI] [PMC free article] [PubMed] [Google Scholar]
- 113. Ono H, Basson MD, Ito H. PTK6 potentiates gemcitabine‐induced apoptosis by prolonging S‐phase and enhancing DNA damage in pancreatic cancer. Mol Cancer Res. 2015;13(8):1174–1184. [DOI] [PubMed] [Google Scholar]
- 114. Emdal KB, Palacio‐Escat N, Wigerup C, Eguchi A, Nilsson H, Bekker‐Jensen DB, et al. Phosphoproteomics of primary AML patient samples reveals rationale for AKT combination therapy and p53 context to overcome selinexor resistance. Cell Rep. 2022;40(6):111177. [DOI] [PMC free article] [PubMed] [Google Scholar]
- 115. Casado P, Rio‐Machin A, Miettinen JJ, Bewicke‐Copley F, Rouault‐Pierre K, Krizsan S, et al. Integrative phosphoproteomics defines two biologically distinct groups of KMT2A rearranged acute myeloid leukaemia with different drug response phenotypes. Signal Transduct Target Ther. 2023;8(1):80. [DOI] [PMC free article] [PubMed] [Google Scholar]
- 116. Piersma SR, Valles‐Marti A, Rolfs F, Pham TV, Henneman AA, Jiménez CR. Inferring kinase activity from phosphoproteomic data: tool comparison and recent applications. Mass Spectrom Rev. 2022;e21808. 10.1002/mas.21808 [DOI] [PubMed] [Google Scholar]
- 117. Perez‐Riverol Y, Bai J, Bandla C, García‐Seisdedos D, Hewapathirana S, Kamatchinathan S, et al. The PRIDE database resources in 2022: a hub for mass spectrometry‐based proteomics evidences. Nucleic Acids Res. 2022;50(D1):D543–D552. [DOI] [PMC free article] [PubMed] [Google Scholar]
- 118. Klaeger S, Heinzlmeir S, Wilhelm M, Polzer H, Vick B, Koenig PA, et al. The target landscape of clinical kinase drugs. Science. 2017;358(6367):eaan4368. [DOI] [PMC free article] [PubMed] [Google Scholar]
Associated Data
This section collects any data citations, data availability statements, or supplementary materials included in this article.
Supplementary Materials
Fig. S1. Large‐scale proteomic and phosphoproteomic analysis of pancreatic ductal adenocarcinoma.
Fig. S2. Data overview of the pS/T phosphoproteome of pancreatic ductal adenocarcinoma.
Fig. S3. Data overview of the pY phosphoproteome of pancreatic ductal adenocarcinoma.
Fig. S4. Data overview of the proteome of pancreatic ductal adenocarcinoma.
Fig. S5. Consensus clustering analyses of proteome and phosphoproteome.
Fig. S6. Comprehensive analysis of PDAC (phospho)proteome subtypes.
Fig. S7. Overall survival analysis of subtypes based on mRNA, proteome and phosphoproteome.
Fig. S8. Differential kinase activities among the identified PDAC phosphoproteome subtypes.
Fig. S9. Phosphoproteomic signatures among KRAS alleles G12D, G12V and G12R.
Fig. S10. Association of TP53 gene mutations with pY phosphoproteome.
Fig. S11. Phosphoproteome differences in short and long survival (treatment naïve) patients.
Table S1. Clinicopathological characteristics of the subset (42/90) of SPACIOUS cohort tumors.
Table S2. Differential proteins between the proteome subtypes.
Table S3. Differential pS/T phosphosites between the phosphoproteome subtypes.
Table S4. pS/T‐based INKA profiling of 42 PDAC tumors.
Table S5. pY‐based INKA profiling of 33 PDAC tumors.
Table S6. Mutation sequencing panel of frequently mutated genes in 42 PDAC tumors.
Table S7. Differential analysis of pS/T sites between KRAS G12D mutated and the rest of tumors (G12V, G12R).
Table S8. Differential analysis of pS/T sites between TP53 mutated and wildtype tumors.
Table S9. Differential analysis of pY sites between TP53 mutated and wildtype tumors.
Table S10. Differential analysis of pS/T sites between long (n = 3) and short survival (n = 3) patients.
Table S11. Differential analysis of pY sites between long (n = 3) and short survival (n = 3) patients.
Data Availability Statement
The mass spectrometry proteomics data have been deposited to the ProteomeXchange Consortium via the PRIDE [117] partner repository with the dataset identifier PXD043111. Human Swiss‐Prot database used for raw data search was acquired from the UniProt database (https://www.uniprot.org/).