Abstract
Ubiquitin-like with PHD and RING finger domains 1 (UHRF1) is an epigenetic regulator that plays critical roles in tumours. However, the DNA methylation alteration patterns driven by UHRF1 and the related differentially expressed tumour-related genes remain unclear. In this study, a UHRF1-shRNA MCF-7 cell line was constructed, and whole-genome bisulfite sequencing and RNA sequencing were performed. The DNA methylation alteration landscape was elucidated, and DNA methylation-altered regions (DMRs) were found to be distributed in both gene bodies and adjacent regions. The DMRs were annotated and categorized into 488 hypermethylated/1696 hypomethylated promoters and 1149 hypermethylated/5501 hypomethylated gene bodies. Through an integrated analysis with the RNA sequencing data, 217 methylation-regulated upregulated genes and 288 downregulated genes were identified, and these genes were primarily enriched in nervous system development and cancer signalling pathways. Further analysis revealed 21 downregulated oncogenes and 15 upregulated TSGs. We also showed that UHRF1 silencing inhibited cell proliferation and migration and suppressed tumour growth in vivo. Our study suggested that UHRF1 and the oncogenes or TSGs it regulates might serve as biomarkers and targets for breast cancer treatment.
Subject terms: Biological techniques, Cancer, Cell biology, Genetics, Diseases, Health care
Introduction
DNA methylation is an extensive epigenetic alteration in eukaryotic cells that regulates gene expression without changing DNA sequences and plays important roles in embryonic development1–4, DNA damage repair5, cell cycle regulation6,7, and tumorigenesis8–10. Indeed, many types of cancer cells exhibit aberrant methylation profiles, and undergo global DNA hypomethylation and hypermethylation in some regions8,11–13. Aberrant DNA methylation influences the initiation and progression of tumours and the apoptosis of tumour cells by activating oncogenes or inactivating tumour suppressor genes (TSGs)14,15. Many reports claim that aberrant DNA methylation marks to be ideal biomarkers for several types of cancers16–18.
UHRF1, also known as Np95 or ICBP90, is a multidomain functional protein that is essential for DNA methylation regulation19–24. It is highly expressed in proliferating cells and participates in embryogenesis25,26, chromatin modification23,27,28, and tumorigenesis8. Indeed, UHRF1 is overexpressed in various human cancer cells, including lung cancer29, hepatocellular carcinoma13, colon cancer20, myeloid leukaemia30, renal cell carcinoma31, cervical cancer32, and breast cancer cells33. Aberrant expression of UHRF1 may lead to the increased expression of proto-oncogenes or the silencing of TSGs, such as p16INK4A, hMLH1, BRCA1 and RB1, by cofunctioning with histone deacetylase 1 (HDAC1) and DNA methyltransferase 1 (DNMT1), which are critically involved in cancer initiation, metastasis, and relapse34. High expression of UHRF1 is generally associated with poor prognosis, suggesting that it is a universal biomarker and a promising target for cancer therapy21,35.
Several studies have shown that silencing UHRF1 leads to reduced proliferation and increased apoptosis of cancer cells by altering DNA methylation patterns20,36. However, alterations in the global pattern of DNA methylation driven by UHRF1 silencing have not been reported. In the present study, we established a stable UHRF1-knockdown MCF-7 cell line by using a UHRF1-short hairpin RNA (shRNA) lentivirus and then performed whole-genome bisulfite sequencing (WGBS) to identify the DNA methylation-altered regions. Then, we produced a global map of DNA methylation marks and annotated significantly differentially methylated genes (DMGs). Additionally, RNA sequencing was performed to identify differentially expressed genes (DEGs). A list of critical genes, including oncogenes and TSGs, was revealed via combinatory analysis, and the pathways involved were also identified via functional enrichment analysis. This study increases the overall understanding of the contribution of UHRF1 to DNA methylation alteration patterns and highlights the potential importance of epigenetic changes driven by UHRF1 in breast carcinogenesis.
Results
Overview of DNA methylation pattern alterations driven by UHRF1 silencing
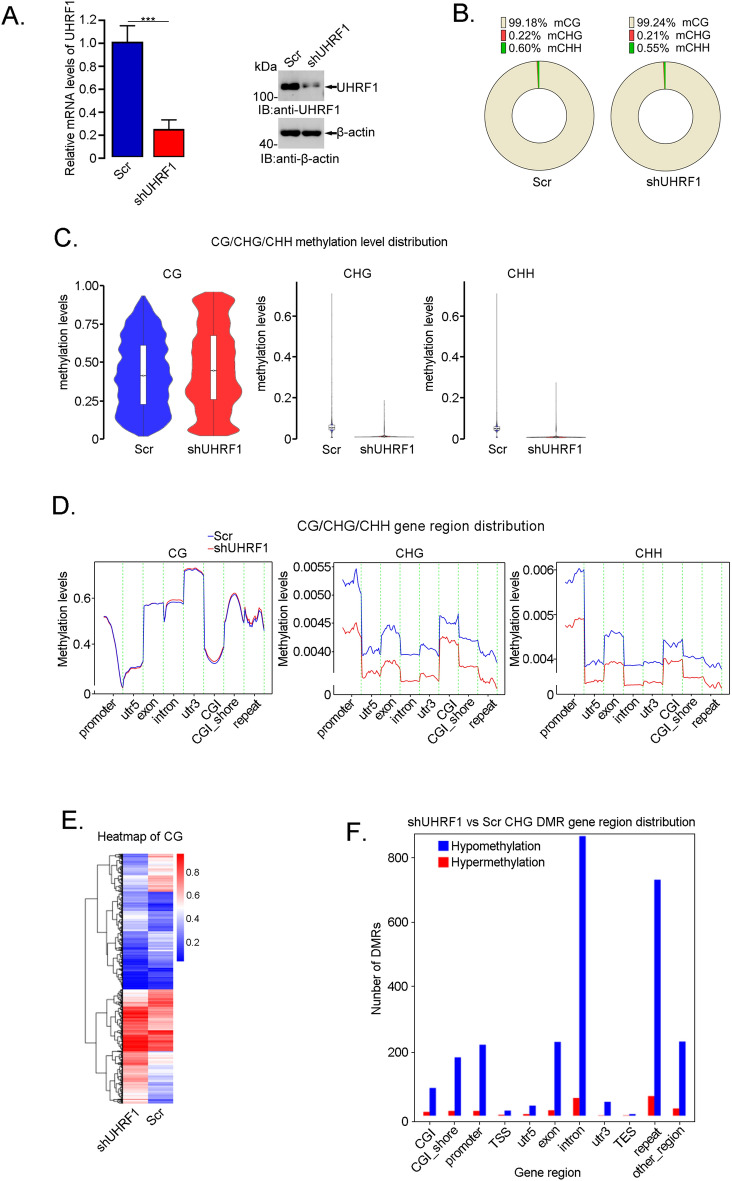
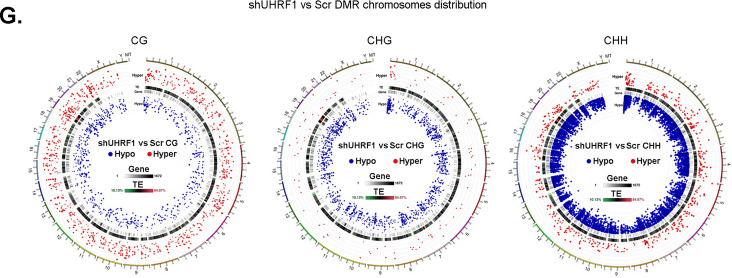
To investigate the global DNA methylation alteration pattern driven by UHRF1 silencing, a stable UHRF1 knockdown MCF-7 cell line was generated via infection with a lenti-shRNA against UHRF1. As shown in Fig. 1A, both the mRNA levels and protein levels were significantly reduced in the UHRF1-shRNA cells compared with scramble control cells, as measured by qRT‒PCR and immunoblotting. Then, the UHRF1-shRNA cell line and scramble cell line were subjected to WGBS analysis. Based on DNA methylation array sequencing data, an average of 1.85% and 1.68% of C (cytosine) residues were methylated in the UHRF1-shRNA cell line and scramble cell line samples, respectively. The vast majority of methylation marks were deposited on CG context, as shown in Fig. 1B. As shown in a comparison of CG context DNA methylation levels between the cell lines, the UHRF1-shRNA cells displayed slightly higher methylation levels, but the CHG context and CHH context in these cells exhibited lower methylation levels than those in the scramble sample (Fig. 1C). The methylation levels and distribution in genes are shown in Fig. 1D and Supplementary Fig. 1A, CG context methylation levels displayed little difference distribution in gene region(Fig. 1D and Supplementary Fig. 1A, left), but the CHG context and CHH context exhibited significant lower in the UHRF1-shRNA sample (Fig. 1D and Supplementary Fig. 1A, middle and right). The cluster heatmaps are shown in Fig. 1E and Supplementary Fig. 1B and C. The DMRs in the gene region distribution are displayed in Fig. 1F and Supplementary Fig. 1D–E, showing that there are markedly more hypomethylation regions in the CHH context in UHRF1-shRNA sample. The DMRs on chromosomes distribution are displayed in Fig. 1G, also showed that UHRF1-shRNA sample exhibited hypomethylation in the CHG context and the CHH context, in comparison to scramble sample. These data suggested that UHRF1 silencing significant lead to DNA hypomethylation, mainly in the CHG context and the CHH context.
Figure 1.
Characteristic analysis and comparison of methylated probes in UHRF1-shRNA and scramble MCF-7 cells. (A) qRT‒PCR analysis of the mRNA levels of UHRF1 in UHRF1-shRNA or scramble MCF-7 cells (left). The expression of UHRF1 was evaluated by immunoblotting with β-actin as the loading control (right). The data are shown as the mean ± SD from three independent experiments. *p < 0.05. (B) The proportion of CG context, CHG context and CHH context in total methylated C sites from UHRF1-shRNA or scramble MCF-7 cells. (C) Violin boxplot showing the methylation levels distribution in UHRF1-shRNA or scramble MCF-7 cells. (D) The CG context, CHG context and CHH context methylation levels in gene region distribution are shown. (E) Cluster heatmap of CG context. (F) The CHG context DMR distribution in the gene region. (G) The DMRs distribution on chromosomes and significantly different are shown. TE, repeat element.
Identification of DMGs driven by UHRF1 silencing
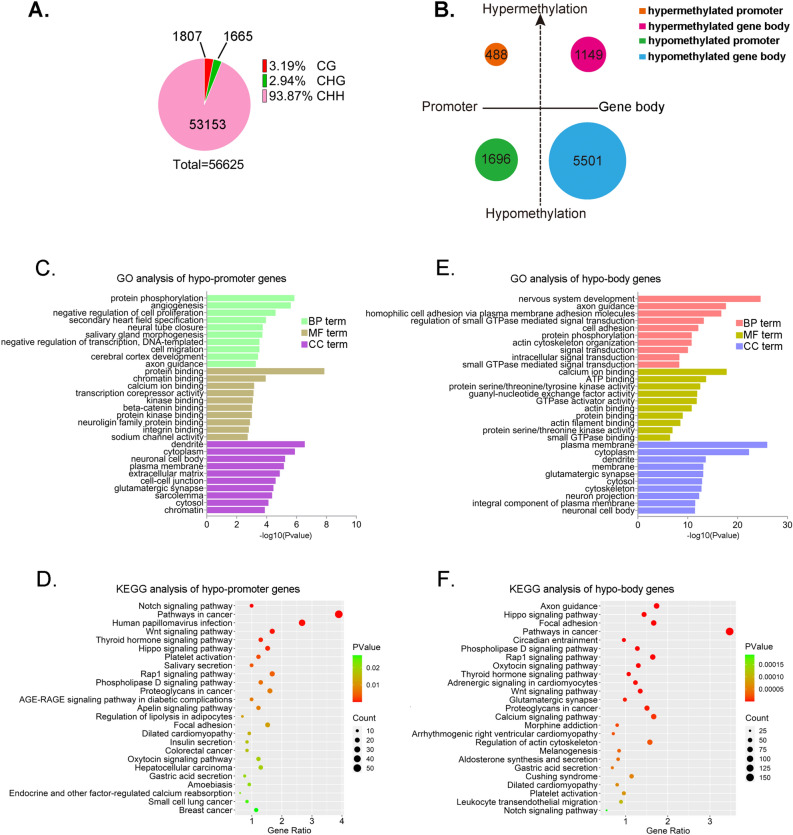
By using DSS software, a total of 56,625 DMRs were obtained after UHRF1 silencing, and these regions included 1807 in the CG context, 1665 in the CHG context and 53153 in the CHH context (Fig. 2A), and then, the DMRs were annotated to identify genome anchors. Considering that too many CHH contexts were included, only the top 10,000 ranked CHH contexts as determined by absolute areaStat value were used for analysis, and all the CG context and CHG context were included. Methylation on promoter or gene body regions may exert opposite effects on gene expression, so the DMRs were annotated and categorized into promoter and gene body regions. As a result, 488 hypermethylated promoters, 1696 hypomethylated promoters, 1149 hypermethylated gene bodies, and 5501 hypomethylated gene bodies were annotated separately (Fig. 2B). To determine the biological processes and pathways enriched with DMGs, Gene Ontology (GO) analysis, including biological process (BP), molecular function (MF), cellular component (CC) categories, and Kyoto Encyclopedia of Genes and Genomes (KEGG) pathway enrichment analysis were performed. The top 10 enriched terms in the BP, MF, CC, categories and the 25 most significantly enriched KEGG pathway terms are shown (Fig. 2C–F, and Supplementary Fig. 2A–D). The results indicated that BP terms were primarily enriched in nervous system development and animal organ development; MF terms were mainly enriched in chromatin binding, protein binding, and specific DNA binding; and CC terms were enriched in extracellular matrix and cytoplasm. The KEGG enrichment results showed that the DMGs were generally enriched in neurological-related diseases and relevant cancer signalling pathways.
Figure 2.
Functional enrichment analysis of the DMGs. (A) Pie chart showing the DMR quantity and proportion of CG context, CHG context and CHH context that were identified. (B) The DMRs were annotated and anchored into promoters and gene bodies, including 488 and 1696 genes that were hypermethylated and hypomethylated in promoters and 1149 and 5501 genes that were hypermethylated and hypomethylated in gene bodies. (C–F) BP, CC, MF, and KEGG pathway enrichment analysis of the hypomethylated promoter or hypomethylated gene bodies. GO: Gene Ontology, BP: biological process, MF: molecular function, CC: cell component, KEGG: Kyoto Encyclopedia of Genes and Genomes. Significantly enriched biological processes were ranked by p value, and the top ten Gene Ontology terms are shown. For KEGG terms, the top twenty-five terms are shown. The size of the dots represents the number of enriched genes. The larger the dot is, the more genes are enriched.
Identification of the DEGs and methylation-regulated differentially expressed genes (MRDEGs) after UHRF1 silencing
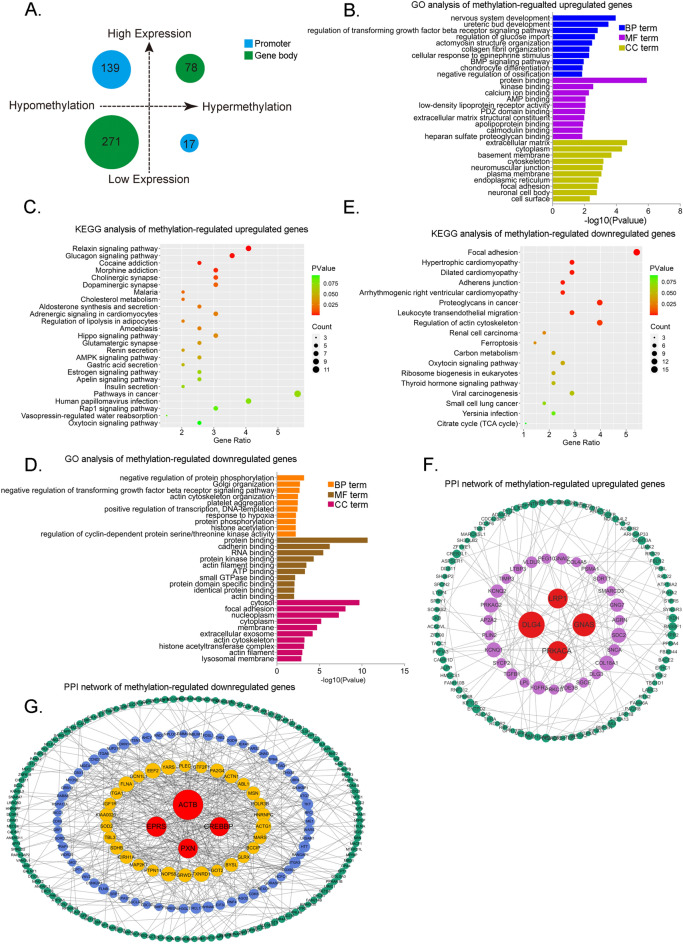
To investigate differentially expressed genes after UHRF1 silencing, RNA sequencing was performed, and 1,473 upregulated genes and 1,453 downregulated genes were identified. Then, we sought to explore the intersection between DEGs and DMGs. Because the hypermethylation of promoters often leads to gene inactivation, and hypermethylation of gene bodies has the opposite effect, we looked for negative correlations between methylation of promoters and gene expression and a positive correlations between methylation of gene bodies and gene expression. To this end, we identified hypomethylated promoters/hypermethylated gene bodies in upregulated genes and the hypermethylated promoter genes/hypomethylated gene bodies in downregulated genes. As a result of this analysis, 139 hypomethylated promoter/upregulated genes, 78 hypermethylated body/upregulated genes, 271 hypomethylated promoter/downregulated genes and 17 hypermethylated body/downregulated genes were identified (Fig. 3A). Next, GO annotation and pathway enrichment analyses of the MRDEGs were performed, and the results are shown in Fig. 3B–E. The methylation-regulated upregulated genes were mainly enriched in nervous system development and structure organization (Fig. 3B), and methylation-regulated downregulated genes were primarily enriched in protein phosphorylation and organelles (Fig. 3D). MF enrichment analysis indicated that methylation-regulated upregulated genes were enriched in protein and proteoglycan binding (Fig. 3B), whereas methylation-regulated downregulated genes were enriched in protein binding, RNA binding, ATP binding and small GTPase binding (Fig. 3D). CC enrichment analysis showed that methylation-regulated upregulated genes were enriched mainly in extracellular matrix, cytoplasm, membrane and focal adhesion (Fig. 3B), while methylation-regulated downregulated genes were enriched in cytosol, nucleoplasm, and membrane (Fig. 3D). KEGG pathway analysis showed that methylation-regulated upregulated genes were significantly enriched in metabolism, neural signalling, drug addiction and cancer signalling pathways (Fig. 3C), whereas methylation-regulated downregulated genes were involved in cardiomyopathy, cell metabolism and cancers (Fig. 3E).
Figure 3.
Functional enrichment and protein–protein interaction network analysis of the methylation-regulated differentially expressed genes. (A) an intersection analysis of DEGs and DMGs revealed 139 hypo-promoter or 78 hypermethylated gene body/upregulated genes, and 271 hypomethylated gene body or 17 hypermethylated promoter/downregulated genes. (B–E) BP, CC, MF, and KEGG pathway enrichment analysis of the methylation-regulated differentially expressed genes. (F) and (G) PPI network analysis of the methylation-regulated upregulated genes (F) and downregulated genes, and the networks were visualized by Cytoscape software. The hub genes are shown in red.
Furthermore, the online protein–protein interaction (PPI) network tool STRING was employed to PPI networks consisting of proteins encoded by MRDEGs. As visualized by Cytoscape software, the network of methylation-regulated upregulated genes contained 118 nodes and 160 edges, and the top four genes, DLG4, GNAS, LRP1 and PRKACA, which had a high degree of connectivity, were selected as hub genes (Fig. 3F). The network of methylation-regulated downregulated genes included 227 nodes and 561 edges, and the hub genes were ACTB, EPRS, CREBBP and PXN (Fig. 3G).
Analysis of the MRDEGs to identify the oncogenes and TSGs
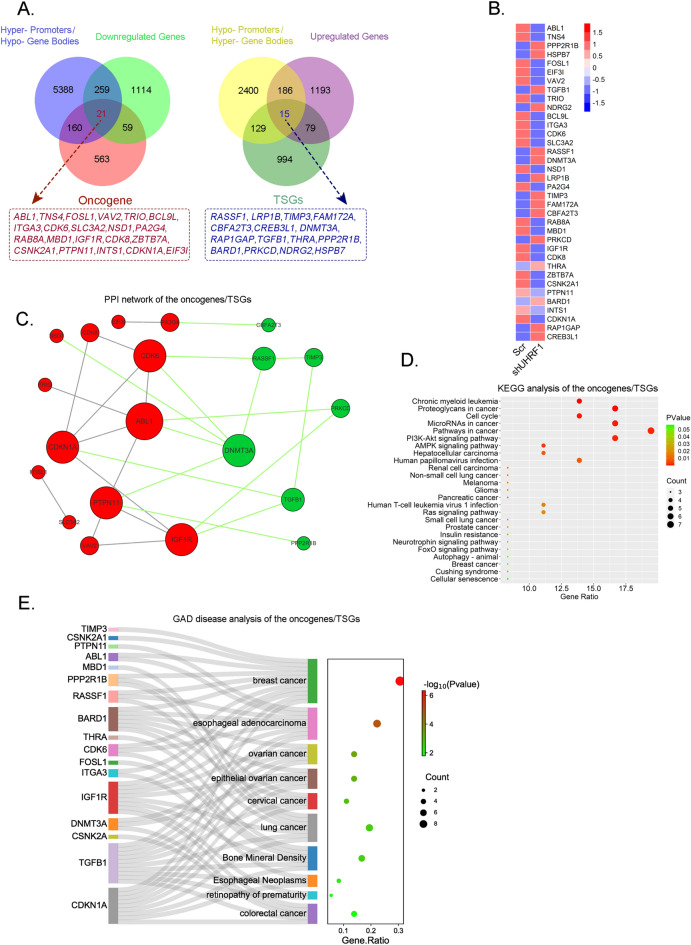
Since UHRF1 is a DNA methylation-regulating protein associated with tumorigenesis and the aforementioned MRDEGs we identified were significantly enriched in cancer signalling pathways, we sought to identify the oncogenes and TSGs involved. The list of methylation-regulated downregulated genes was compared with the list of oncogenes, and 21 downregulated oncogenes, including ABL1, TNS4, FOSL1, VAV2, TRIO,BCL9L,ITGA3,CDK6, SLC3A2,NSD1,PA2G4,RAB8A, MBD1,IGF1R,CDK8,ZBTB7A, CSNK2A1, PTPN11,INTS1,CDKN1A andEIF3I, were found to be on both lists (Fig. 4A, left). Moreover, the list of methylation-regulated upregulated genes was compared with the list of TSGs, and 15 upregulated TSGs were thus identified: RASSF1,LRP1B,TIMP3, FAM172A,CBFA2T3,CREB3L1, DNMT3A,RAP1GAP,TGFB1,THRA,PPP2R1B,BARD1,PRKCD, NDRG2 andHSPB7 (Fig. 4A, right). The heatmaps of these oncogenes and TSGs are shown in Fig. 4B.
Figure 4.
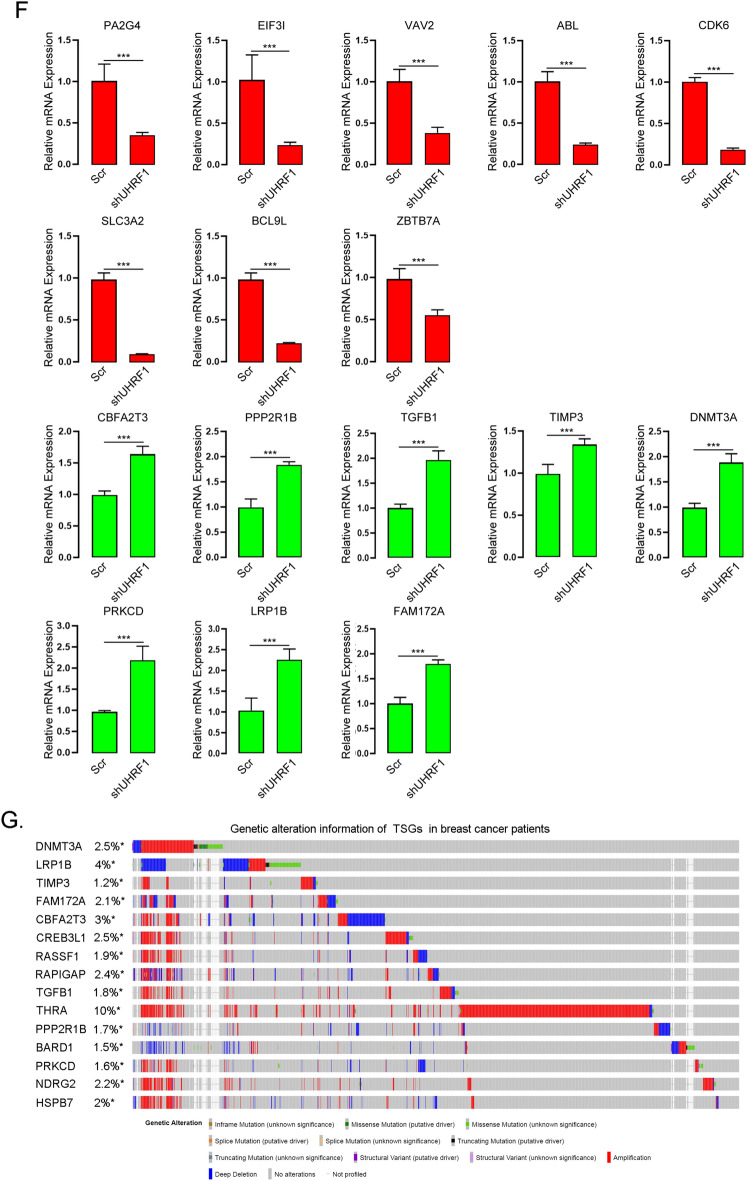
Identification of the oncogenes and TSGs. (A) Twenty-one overlapping genes of the methylation-regulated downregulated genes and oncogenes (left), and fifteen overlapping genes of the methylation-regulated upregulated genes and TSGs (right) are shown. (B) Heatmap showing scaled expression of the oncogenes and TSGs. (C) The PPI network of oncogenes and TSGs. The red spots represent the oncogenes, and the green spots represent the TSGs. (D) and (E) KEGG enrichment analysis (D) and GAD disease analysis (E) of the oncogenes and TSGs. (F) qRT‒PCR validation of the oncogenes and TSGs. Red represents the oncogenes, and green represents the TSGs. (G) A visual summary shows the genetic alteration of the TSGs in breast cancer patients using data from the cBio Cancer Genomics Portal (http://www.cbioportal.org/).
Through the use of the STRING database, a PPI network of the aforementioned oncogenes and TSGs was constructed and visualized (Fig. 4C). There were 20 nodes and 27 edges in the network, and the 6 genes with the highest degree of interaction with other proteins were ABL1 (degree = 6, oncogene), CDK6 (degree = 5, oncogene), PTPN11 (degree = 5, oncogene), CDKN1A (degree = 5, oncogene), IGF1R F (degree = 5, oncogene) and DNMT3A (degree = 5, TSG).
KEGG analysis and GAD disease analysis were performed to explore the pathways and diseases associated with these oncogenes and TSGs. As displayed in Fig. 4D and E, many cancers, including breast cancer and relevant signalling pathways, were enriched; the Gene Associations Database (GAD) disease analysis indicated that these genes significantly contributed to breast cancer and oesophageal neoplasms, etc.
To confirm the expression of the oncogenes and TSGs regulated by UHRF1, the mRNA transcript levels of these genes were verified by qRT‒PCR, as shown in Fig. 4F. The genetic alteration information of the 21 oncogenes and 15 TSGs identified in breast cancer patients is summarized in Fig. 4G and Supplementary Fig. 3A. Besides, knock down of DNMT1 lead to the downregulation of oncogene and upregulation of TSGs, indicating the cross talk between UHRF1 and DNMT1 (Supplementary Fig. 4A and B).
UHRF1 significantly contributed to tumorigenicity
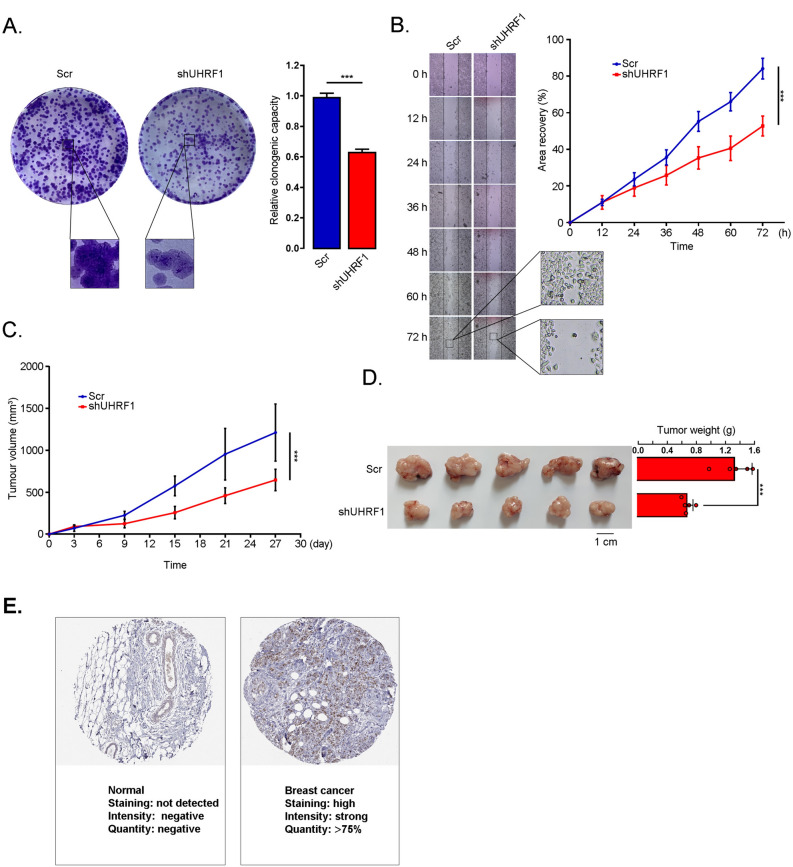
UHRF1 is overexpressed in many cancers and plays an essential role in tumorigenesis. Therefore, we sought to determine the impact of UHRF1 silencing on MCF-7 cell tumorigenesis. As shown in Fig. 5A, in a colony formation assay, an approximately 40% decrease in colony formation was observed, demonstrating a significantly attenuated colony formation capacity of these cells after UHRF1 knockdown. To measure the effect of UHRF1 knockdown on the migration capacity of MCF-7 cells, a wound healing assay was performed, and the results showed that UHRF1 knockdown markedly reduced the motility of cells, as evaluated by the change in wound area (Fig. 5B).
Figure 5.
Knockdown of UHRF1 inhibits the motility and tumorigenic capacity of MCF-7 cells. (A) colony formation assay was performed to determine the colony formation ability of UHRF1-shRNA or scramble MCF-7 cells, and the relative clonogenicity was calculated. The data shown represent the mean ± SD of three independent experiments. ***p < 0.001, ANOVA. (B) A wound healing assay was performed to show the migration capacity of UHRF1-shRNA or scramble MCF-7 cells. Data are shown as the mean ± SD from three independent experiments. ***p < 0.001, ANOVA. (C) Tumour growth curve showing the growth of UHRF1-shRNA or scramble MCF-7 cell xenografts in vivo. (D) Pictures (left) and tumour weights (right) of UHRF1-shRNA or scramble MCF-7 cell xenografts. (E) Validation of the high UHRF1 level in Breast cancer on the Human Protein Atlas database(https://www.proteinatlas.org/). Data are shown as the mean ± SD from three independent experiments. ***p < 0.001, ANOVA.
To further explore the oncogenic function of UHRF1 in MCF-7 cells, UHRF1-shRNA-expressing or scramble cells were subcutaneously implanted into the right flanks of BALB/c nude mice, and tumour growth was measured. As shown in Fig. 5C and D, knockdown of UHRF1 led to a significant reduction in tumour size and weight. Moreover, the high expression of UHRF1 was validated in breast cancer samples from the Human Protein Atlas (Fig. 5E). These data were conclusive in showing that UHRF1 knockdown reduced MCF-7 cell tumorigenesis capacity.
Discussion
DNA methylation alterations have been widely studied and recognized to play essential roles in tumorigenesis by modifying gene expression patterns. As reported in many studies, UHRF1 is a critical regulator of DNA methylation that is highly expressed in various cancers and has been recognized as a diagnostic biomarker. Indeed, overexpression of UHRF1 promotes oncogene expression or silences tumour suppressor genes by altering DNA methylation patterns34, so exploring the methylation alteration pattern and gene expression profile altered by UHRF1, not only helps to clarify the initiation and development of tumours but also may facilitate cancer diagnosis and disease prognosis predication and guide clinical decisions. However, to our knowledge, no study has reported collective information on gene methylation profiling and altered gene expression profiling regulated by UHRF1.
High levels of non-CG methylation within the gene body are associated with highly expressed genes37. Therefore, non-CpG methylation is associated with the expression of tumour suppressor genes and oncogenesis. For example, the tumour suppressor gene p53 has unique features of non-CpG methylation in gene body regions38. In addition, mitochondrial DNA is predominantly methylated in non-CpG regions and is essential for the regulation of mitochondrial replication and transcription39–41. Altered gene expression may play a crucial role in the regulation of metabolic diseases42,43, exploring genome-wide alterations or imbalances in non-CpG methylation could aid in revealing disease progression, including cancer progression. Previous reports revealed that DNA from cancerous specimens was more heavily methylated at non-CpG cytosines than that from noncancerous lung tissue of cancer patients38, which was consistent with the lower CHG and CHH context methylation levels detected after UHRF1 silencing in our study.
In this study, the DNA methylation pattern changes and gene expression alteration in the case of UHRF1 silence were revealed. These genes are mainly involved in the regulation of nervous system development, which are consistent with the knowledge that UHRF1 plays a significant role in embryonic development44. In addition, the KEGG analysis showed that methylation alterations also mainly affect neural developmental signalling pathways, including the Rap1 signalling pathway and Notch signalling pathway; and cancer signalling pathways, including the ErbB signalling pathway, and the Wnt signalling pathway. Together, these results suggest that hypermethylation and hypomethylation of genes regulated by UHRF1 might play critical roles in system development and cancer progression.
Five oncogenes and one TSG with a high degree of connectivity in the PPI network were identified, they were: ABL1, CDK6, CDKN1A, PTPN11, IGF1R, and DNMT3A. ABL1 is a nonreceptor tyrosine kinase that was first identified as an oncogene in chronic myelogenous leukaemia (CML), and recent studies have demonstrated its function in solid tumours such as lung, breast, colon, and renal carcinoma tumours45,46. ABL1 is expressed physiologically in normal cells but is ectopically expressed in tumour cells, and its overexpression promoted cancer cell migration and invasion and resulted in a poor prognosis47–49. CDK6 is a key cell cycle kinase that drives the G1 to S phase transition and plays critical roles in cancer through the regulation of tumor cell proliferation, senescence, and migration and angiogenesis50. It has been determined to be an attractive therapeutic interference target because its inhibitors showed significant efficacy in preclinical or clinical cancer therapies51. CDKN1A, also known as p21, is essential because of its genome stability maintenance and cyclin-dependent kinase-inhibiting function, which leads to cell cycle arrest in response to DNA damage; therefore, CDKN1A has been suggested as a biomarker as well as a target in cancer treatment52,53.
PTPN11, also named Src homology region 2-containing protein tyrosine phosphatase 2 (Shp2), is related to the cancer development process, including tumour cell invasion and metastasis, DNA damage, and apoptosis. It is involved in the MAPK signalling pathway, Ras-Erk signalling pathway, and PI3K-Akt signalling pathway54,55. The transmembrane tyrosine kinase IGF1R is frequently overexpressed in cancer cells and affects the invasion or metastasis propensity of tumour cells. By regulating cell motility and adhesion, Shp2 has been demonstrated to be an attractive therapeutic target56,57. DNMT3A is a DNA methyltransferase that is responsible for the establishment of de novo genomic DNA methylation patterns, both in normal tissue and disease58. Although several studies have reported that DNMT3A is highly expressed in tumours and might be linked to poor prognosis, many studies have determined that its expression was not different between cancer and normal tissues59. Moreover, recent evidence has revealed that DNMT3A is mutated and its activity is lost in cancer cells, suggesting that its roles in cancer development may be more complex than previously believed and that it may function as a tumour suppressor60. A GAD disease analysis of these oncogenes and TSGs showed that the disease most enriched was breast cancer, which was consistent with this study, which was performed with breast cancer cells.
UHRF1 exhibits oncogenic function by promoting the proliferation and migration of various cell lines, including renal cell carcinoma cells, gallbladder cancer cells, and cervical squamous cell carcinoma cells, and promoting the growth of tumours derived from these cell lines. Here, we showed that downregulation of UHRF1 by shRNA in MCF-7 cells resulted in significantly attenuated colony formation capacity, impeded cell migration, obviously suppressed tumour growth and decreased xenograft tumour size, indicating that UHRF1 is essential for the growth and migration of MCF-7 cells. In our study, we found that twenty one oncogenes were downregulated and fifteen TSGs were upregulated, indicating that aberrant methylation might lead to the alteration of their expression, resulting in attenuated breast cancer tumorigenesis. Our study may be helpful for explaining the protumorigenic mechanism underlying UHRF1 action in breast cancer, providing more evidence that UHRF1 is a therapeutic target for breast cancer treatment.
Materials and methods
Cell line construction and cultures
The human breast adenocarcinoma cell line MCF-7 was obtained from ATCC (https://www.atcc.org/) and verified using short tandem repeat (STR) profiling. The UHRF1-shRNA cell line was constructed by infection (MOI of 20) with a lentivirus bearing a short-hairpin RNA (shRNA) sequence against UHRF1, and stable UHRF1 knockdown cells were obtained after selection with puromycin (0.5 μg/ml) for 10 days. The shRNA sequence was 5′-AGACGGAAUUGGGGCUGUATT-3′. The control scramble cell line was constructed in a similar way with the shRNA sequence 5′-TTCTCCGAACGTGTCACGT-3′. Both cell lines were cultured in DMEM containing 10% foetal bovine serum, 2 mM l-glutamine, 100 IU/ml penicillin and 100 µg/ml streptomycin. The cells were free of mycoplasma contamination based on the results of the Mycoplasma Stain Assay Kit (Beyotime).
WGBS and RNA sequencing
Genomic DNA extracted from the two cell lines was assessed for concentration and integrity, and after treatment with bisulfite using an EZ DNA Methylation-GoldTM Kit (Zymo Research), genome-wide methylation analysis was performed on an Illumina NovaSeq platform. The DNA methylation level was calculated and analysed with Bismark (Version 0.16.3) and DSS software (DSS_2.12.0).
For RNA sequencing, total RNA was extracted from the two cell lines, the quality and quantity of RNA were determined using a NanoPhotometer spectrophotometer, and the integrity of RNA was evaluated using an Agilent 2100 Bioanalyzer. More than 800 ng of total RNA was used to construct libraries by using a NEBNext® Ultra™ RNA Library Prep Kit for Illumina® (NEB, USA, Catalogue #: E7530L). Sequencing was performed on an Illumina platform, and clean reads were obtained after raw data filtering, sequencing error rate checking, and GC content distribution checking.
Identification of DMGs and DEGs
All the CG context, CHG context, and the rank of 10,000 according the absolute areaStat value of CHH context were included for DMR analysis; these genes were anchored to genes promoter, exon, intron, Cancer Genome Interpreter (CGI), CGI shore, repeat, transcription start site (TSS), and TES regions, by using Dispersion Shrinkage for Sequencing data software (DSS_2.12.0). A DEG analysis was performed using the DESeq R package (version 1.20.0) with a p value < 0.05 the selection criterion. The oncogene list was downloaded from the database (http://ongene.bioinfo-minzhao.org/), and the TSG list was obtained from the database (https://bioinfo.uth.edu/TSGene/index.html). The list of methylation-regulated downregulated genes was compared with the list of oncogenes to identified the oncogenes among the methylation-regulated downregulated genes, and the list of methylation-regulated upregulated genes was compared with the list of TSGs list to identify TSGs among the methylation-regulated downregulated genes.
Functional and pathway enrichment analysis
GO analysis, KEGG pathway analysis and GAD pathway enrichment analysis were conducted with the DAVID database (https://david.ncifcrf.gov/), and the GAD disease diagram was generated using an online tool (http://www.bioinformatics.com.cn). The enrichment results were evaluated on the basis of p value, with a p value < 0.05 indicating statistical significance. The top ten most enriched pathways in the CC, MF, and BF categories, the top twenty five KEGG significant pathways and all the GAD pathways are shown.
PPI network construction and analysis
The Search Tool for the Retrieval of Interacting Genes (STRING) database (https://string-db.org/cgi/input.pl) was used to evaluate the PPI information, and Cytoscape software (version 3.6.1) was employed to construct the PPI networks in this study.
qRT‒PCR analysis
Total RNA was extracted from the cells using an RNeasy Mini Kit (QIAGEN). qRT‒PCR was performed using SYBR Green qPCR Super Mix, and the primer sequences are shown in Supplementary Table 1. The samples were denatured at 95 °C for 2 min, followed by 40 cycles of amplification (15 s at 94 °C for denaturation, 60 s at 60 °C for annealing and extension), GAPDH level was the basis by which the expression of other genes was standardized.
Western blotting
Total lysates were extracted from cells using lysis buffer (150 mM NaCl, 0.5 mM EDTA, 50 mM Tris–HCl (pH 8.0), 1% Nonidet P-40, 10 µg/ml leupeptin) and subjected to SDS‒PAGE. The gel was transferred to a membrane (Millipore), and then immunoblotted with anti-UHRF1 primary antibodies (Santa Cruz, Cat# SC-373750), anti-DNMT1 primary antibodies (Cell Signaling Technology, Cat# 5032) and anti-β-actin (Santa Cruz, Cat# SC-1616). The signals were detected by chemiluminescence (PerkinElmer Life Sciences).
In vitro colony formation assay
A total of 1,000 UHRF1-shRNA or scramble control MCF-7 cells were seeded in six-well plates and cultured in growth medium at 37 °C to form colonies for 10 days. Then, the cells were fixed with 4% paraformaldehyde and stained with crystal violet.
Migration assay
A total of 5 × 10⁵ cells per well of UHRF1-shRNA or scramble control MCF-7 cells were seeded in a six-well plate. A scratch was made using a 200-μl pipette tip 24 h after the cells were seeded, and the cells were cultured with serum-free medium. Images were captured at 0 h, the cells were returned to an incubator, and images were taken again at 12 h, 24 h, 36 h, 48 h, 60 h and 72 h.
Tumour xenograft experiment
Twenty-eight-day-old female BALB/c null mice were randomly divided into two groups (5 mice per group) and injected subcutaneously in the right flanks with 2 × 10⁶ cells. Tumour volumes were measured every 3 days for 27 days, tumour pictures were taken, and tumour weights were determined after dissection. All animal protocols were approved and the experiments were performed in accordance with the approved guidelines by the Institutional Ethics Committee of Military Medical Science.
For the animal experiments, mice were purchased from Beijing Vital River Laboratory Animal Technology Co., Ltd. All animals were numbered, and experiments were performed in a blinded fashion.
Mice were maintained in a pathogen-free environment with 4 per cage, a 12 h light/dark cycle, temperature maintained at 21–23 °C, relative humidity of 50–60%, and free access to food and water. All animal studies were completed in the experimental animal centre of the Academy of Military Medical Sciences, China, and were performed in accordance with the approved guidelines of the Institutional Ethics Committee of Military Medical Science. No data were excluded from the analyses unless otherwise indicated.
Statistical analysis
All experiments were performed in triplicate, and statistical analysis was carried out using GraphPad Prism 7. The numerical data are expressed as the means ± SDs. The data obtained from comparisons between two different groups were analysed by Student’s t test or two-way ANOVA, and differences were considered significant when p < 0.05.
Ethical statement
All experiments were performed in accordance with the approved guidelines by the Institutional Ethics Committee of Military Medical Science (ID: IACUC-DWZX-2023-p558). The study was carried out in compliance with the ARRIVE guidelines.
Supplementary Information
Acknowledgements
This work was supported by the National Key Research and Development Program of China.
Author contributions
C.C. and X.L. designed the study. Q.D., C.G., Y.L., T.Z., C.S., T.W., R.J., C.W., Q.J., and D.S. performed the experiments. Q.D., Y.H., D.W., H.L., T.G. and C.C. analysed the data. , Z.A., J.Z., Y.L., Y.L., J.F., M.L., J.Z. and P.L. developed protocols and provided reagents. Q.D. and X.L. wrote the manuscript.
Data availability
The WGBS and RNA-Seq data are available in the Gene Expression Omnibus (GEO) database (GEO accession: GSE248620 to GSE248622). All relevant data are available from the corresponding author upon reasonable request.
Competing interests
The authors declare no competing interests.
Footnotes
Publisher's note
Springer Nature remains neutral with regard to jurisdictional claims in published maps and institutional affiliations.
These authors contributed equally: Qincai Dong, Chunxue Gong and Qian Jiang.
Contributor Information
Cheng Cao, Email: caoc@nic.bmi.ac.cn.
Xuan Liu, Email: liuxuan@nic.bmi.ac.cn.
Supplementary Information
The online version contains supplementary material available at 10.1038/s41598-024-69110-2.
References
- 1.Zeng, Y. & Chen, T. DNA methylation reprogramming during mammalian development. Genes (Basel)10(4), 257 (2019). 10.3390/genes10040257 [DOI] [PMC free article] [PubMed] [Google Scholar]
- 2.Smith, Z. D. & Meissner, A. DNA methylation: Roles in mammalian development. Nat. Rev. Genet.14(3), 204–220 (2013). 10.1038/nrg3354 [DOI] [PubMed] [Google Scholar]
- 3.Reik, W., Dean, W. & Walter, J. Epigenetic reprogramming in mammalian development. Science293(5532), 1089–1093 (2001). 10.1126/science.1063443 [DOI] [PubMed] [Google Scholar]
- 4.Yang, H. et al. Allele-specific H3K9me3 and DNA methylation co-marked CpG-rich regions serve as potential imprinting control regions in pre-implantation embryo. Nat. Cell Biol.24(5), 783–792 (2022). 10.1038/s41556-022-00900-4 [DOI] [PubMed] [Google Scholar]
- 5.Sutton, L. P. & Jeffreys, S. A. DNA methylation changes following DNA damage in prostate cancer cells. Epigenetics14(10), 989–1002 (2019). 10.1080/15592294.2019.1629231 [DOI] [PMC free article] [PubMed] [Google Scholar]
- 6.Li, Q. et al. DNA methylation mediated downregulation of miR-449c controls osteosarcoma cell cycle progression by directly targeting oncogene c-Myc. Int. J. Biol. Sci.13(8), 1038–1050 (2017). 10.7150/ijbs.19476 [DOI] [PMC free article] [PubMed] [Google Scholar]
- 7.Mazor, T. et al. DNA methylation and somatic mutations converge on the cell cycle and define similar evolutionary histories in brain tumors. Cancer Cell28(3), 307–317 (2015). 10.1016/j.ccell.2015.07.012 [DOI] [PMC free article] [PubMed] [Google Scholar]
- 8.Jones, P. A. & Baylin, S. B. The epigenomics of cancer. Cell128(4), 683–692 (2007). 10.1016/j.cell.2007.01.029 [DOI] [PMC free article] [PubMed] [Google Scholar]
- 9.Saghafinia, S. et al. Pan-cancer landscape of aberrant DNA methylation across human tumors. Cell Rep.25(4), 1066-1080.e8 (2018). 10.1016/j.celrep.2018.09.082 [DOI] [PubMed] [Google Scholar]
- 10.Yang, X., Gao, L. & Zhang, S. Comparative pan-cancer DNA methylation analysis reveals cancer common and specific patterns. Brief. Bioinform.18(5), 761–773 (2017). [DOI] [PubMed] [Google Scholar]
- 11.Shen, H. & Laird, P. W. Interplay between the cancer genome and epigenome. Cell153(1), 38–55 (2013). 10.1016/j.cell.2013.03.008 [DOI] [PMC free article] [PubMed] [Google Scholar]
- 12.Kulis, M. & Esteller, M. DNA methylation and cancer. Adv. Genet.70, 27–56 (2010). 10.1016/B978-0-12-380866-0.60002-2 [DOI] [PubMed] [Google Scholar]
- 13.Mudbhary, R. et al. UHRF1 overexpression drives DNA hypomethylation and hepatocellular carcinoma. Cancer Cell25(2), 196–209 (2014). 10.1016/j.ccr.2014.01.003 [DOI] [PMC free article] [PubMed] [Google Scholar]
- 14.Le, X. et al. DNA methylation downregulated ZDHHC1 suppresses tumor growth by altering cellular metabolism and inducing oxidative/ER stress-mediated apoptosis and pyroptosis. Theranostics10(21), 9495–9511 (2020). 10.7150/thno.45631 [DOI] [PMC free article] [PubMed] [Google Scholar]
- 15.Sun, D. et al. DNA hypermethylation modification promotes the development of hepatocellular carcinoma by depressing the tumor suppressor gene ZNF334. Cell Death Dis.13(5), 446 (2022). 10.1038/s41419-022-04895-6 [DOI] [PMC free article] [PubMed] [Google Scholar]
- 16.Nakaoka, T., Saito, Y. & Saito, H. Aberrant DNA methylation as a biomarker and a therapeutic target of cholangiocarcinoma. Int. J. Mol. Sci.18(6), 1111 (2017). 10.3390/ijms18061111 [DOI] [PMC free article] [PubMed] [Google Scholar]
- 17.Yang, X., Wong, M. P. M. & Ng, R. K. Aberrant DNA methylation in acute myeloid leukemia and its clinical implications. Int. J. Mol. Sci.20(18), 4576 (2019). 10.3390/ijms20184576 [DOI] [PMC free article] [PubMed] [Google Scholar]
- 18.Xu, R. H. et al. Circulating tumour DNA methylation markers for diagnosis and prognosis of hepatocellular carcinoma. Nat. Mater.16(11), 1155–1161 (2017). 10.1038/nmat4997 [DOI] [PubMed] [Google Scholar]
- 19.Mancini, M. et al. The multi-functionality of UHRF1: Epigenome maintenance and preservation of genome integrity. Nucleic Acids Res.49(11), 6053–6068 (2021). 10.1093/nar/gkab293 [DOI] [PMC free article] [PubMed] [Google Scholar]
- 20.Kong, X. et al. Defining UHRF1 domains that support maintenance of human colon cancer DNA methylation and oncogenic properties. Cancer Cell35(4), 633-648.e7 (2019). 10.1016/j.ccell.2019.03.003 [DOI] [PMC free article] [PubMed] [Google Scholar]
- 21.Patnaik, D., Estève, P. O. & Pradhan, S. Targeting the SET and RING-associated (SRA) domain of ubiquitin-like, PHD and ring finger-containing 1 (UHRF1) for anti-cancer drug development. Oncotarget9(40), 26243–26258 (2018). 10.18632/oncotarget.25425 [DOI] [PMC free article] [PubMed] [Google Scholar]
- 22.Hahm, J. Y. et al. Acetylation of UHRF1 regulates hemi-methylated DNA binding and maintenance of genome-wide DNA methylation. Cell Rep.32(4), 107958 (2020). 10.1016/j.celrep.2020.107958 [DOI] [PubMed] [Google Scholar]
- 23.Nishiyama, A. et al. Uhrf1-dependent H3K23 ubiquitylation couples maintenance DNA methylation and replication. Nature502(7470), 249–253 (2013). 10.1038/nature12488 [DOI] [PubMed] [Google Scholar]
- 24.Liu, X. et al. UHRF1 targets DNMT1 for DNA methylation through cooperative binding of hemi-methylated DNA and methylated H3K9. Nat. Commun.4, 1563 (2013). 10.1038/ncomms2562 [DOI] [PubMed] [Google Scholar]
- 25.Kim, K. Y. et al. Uhrf1 regulates active transcriptional marks at bivalent domains in pluripotent stem cells through Setd1a. Nat. Commun.9(1), 2583 (2018). 10.1038/s41467-018-04818-0 [DOI] [PMC free article] [PubMed] [Google Scholar]
- 26.Yan, R. & Cheng, X. Dynamics of DNA hydroxymethylation and methylation during mouse embryonic and germline development. Nat. Genet.55(1), 130–143 (2023). 10.1038/s41588-022-01258-x [DOI] [PubMed] [Google Scholar]
- 27.Dong, J. et al. UHRF1 suppresses retrotransposons and cooperates with PRMT5 and PIWI proteins in male germ cells. Nat. Commun.10(1), 4705 (2019). 10.1038/s41467-019-12455-4 [DOI] [PMC free article] [PubMed] [Google Scholar]
- 28.Fang, J. et al. Hemi-methylated DNA opens a closed conformation of UHRF1 to facilitate its histone recognition. Nat. Commun.7, 11197 (2016). 10.1038/ncomms11197 [DOI] [PMC free article] [PubMed] [Google Scholar]
- 29.Hou, J. et al. UHRF1 plays an oncogenic role in small cell lung cancer. Mol. Carcinog.62(3), 385–397 (2023). 10.1002/mc.23493 [DOI] [PubMed] [Google Scholar]
- 30.Hu, C. L. et al. Targeting UHRF1-SAP30-MXD4 axis for leukemia initiating cell eradication in myeloid leukemia. Cell Res.32(12), 1105–1123 (2022). 10.1038/s41422-022-00735-6 [DOI] [PMC free article] [PubMed] [Google Scholar]
- 31.Ma, J. et al. Ubiquitin E3 ligase UHRF1 regulates p53 ubiquitination and p53-dependent cell apoptosis in clear cell Renal Cell Carcinoma. Biochem. Biophys. Res. Commun.464(1), 147–153 (2015). 10.1016/j.bbrc.2015.06.104 [DOI] [PubMed] [Google Scholar]
- 32.Ge, T. T. et al. UHRF1 gene silencing inhibits cell proliferation and promotes cell apoptosis in human cervical squamous cell carcinoma CaSki cells. J. Ovarian Res.9(1), 42 (2016). 10.1186/s13048-016-0253-8 [DOI] [PMC free article] [PubMed] [Google Scholar]
- 33.Unoki, M., Nishidate, T. & Nakamura, Y. ICBP90, an E2F–1 target, recruits HDAC1 and binds to methyl-CpG through its SRA domain. Oncogene23(46), 7601–7610 (2004). 10.1038/sj.onc.1208053 [DOI] [PubMed] [Google Scholar]
- 34.Alhosin, M. et al. Signalling pathways in UHRF1-dependent regulation of tumor suppressor genes in cancer. J. Exp. Clin. Cancer Res.35(1), 174 (2016). 10.1186/s13046-016-0453-5 [DOI] [PMC free article] [PubMed] [Google Scholar]
- 35.Ashraf, W. et al. The epigenetic integrator UHRF1: On the road to become a universal biomarker for cancer. Oncotarget8(31), 51946–51962 (2017). 10.18632/oncotarget.17393 [DOI] [PMC free article] [PubMed] [Google Scholar]
- 36.Jiao, D. et al. UHRF1 promotes renal cell carcinoma progression through epigenetic regulation of TXNIP. Oncogene38(28), 5686–5699 (2019). 10.1038/s41388-019-0822-6 [DOI] [PubMed] [Google Scholar]
- 37.Lister, R. et al. Human DNA methylomes at base resolution show widespread epigenomic differences. Nature462(7271), 315–322 (2009). 10.1038/nature08514 [DOI] [PMC free article] [PubMed] [Google Scholar]
- 38.Kouidou, S. et al. Non-CpG cytosine methylation of p53 exon 5 in non-small cell lung carcinoma. Lung Cancer50(3), 299–307 (2005). 10.1016/j.lungcan.2005.06.012 [DOI] [PubMed] [Google Scholar]
- 39.Bellizzi, D. et al. The control region of mitochondrial DNA shows an unusual CpG and non-CpG methylation pattern. DNA Res.20(6), 537–547 (2013). 10.1093/dnares/dst029 [DOI] [PMC free article] [PubMed] [Google Scholar]
- 40.Liu, B. et al. CpG methylation patterns of human mitochondrial DNA. Sci. Rep.6, 23421 (2016). 10.1038/srep23421 [DOI] [PMC free article] [PubMed] [Google Scholar]
- 41.Patil, V. et al. Human mitochondrial DNA is extensively methylated in a non-CpG context. Nucleic Acids Res.47(19), 10072–10085 (2019). 10.1093/nar/gkz762 [DOI] [PMC free article] [PubMed] [Google Scholar]
- 42.Barrès, R. et al. Non-CpG methylation of the PGC-1alpha promoter through DNMT3B controls mitochondrial density. Cell Metab.10(3), 189–198 (2009). 10.1016/j.cmet.2009.07.011 [DOI] [PubMed] [Google Scholar]
- 43.van der Wijst, M. G., van Tilburg, A. Y. & Ruiters, M. H. Experimental mitochondria-targeted DNA methylation identifies GpC methylation, not CpG methylation, as potential regulator of mitochondrial gene expression. Sci. Rep.7(1), 177 (2017). 10.1038/s41598-017-00263-z [DOI] [PMC free article] [PubMed] [Google Scholar]
- 44.Ren, Y. Regulatory mechanism and biological function of UHRF1-DNMT1-mediated DNA methylation. Funct. Integr. Genom.22(6), 1113–1126 (2022). 10.1007/s10142-022-00918-9 [DOI] [PubMed] [Google Scholar]
- 45.Greuber, E. K. et al. Role of ABL family kinases in cancer: From leukaemia to solid tumours. Nat. Rev. Cancer13(8), 559–571 (2013). 10.1038/nrc3563 [DOI] [PMC free article] [PubMed] [Google Scholar]
- 46.Ganguly, S. S. et al. c-Abl and Arg are activated in human primary melanomas, promote melanoma cell invasion via distinct pathways, and drive metastatic progression. Oncogene31(14), 1804–1816 (2012). 10.1038/onc.2011.361 [DOI] [PMC free article] [PubMed] [Google Scholar]
- 47.Fiore, L. S. et al. c-Abl and Arg induce cathepsin-mediated lysosomal degradation of the NM23-H1 metastasis suppressor in invasive cancer. Oncogene33(36), 4508–4520 (2014). 10.1038/onc.2013.399 [DOI] [PMC free article] [PubMed] [Google Scholar]
- 48.Chevalier, C. et al. ABL tyrosine kinase inhibition variable effects on the invasive properties of different triple negative breast cancer cell lines. PLoS One10(3), e0118854 (2015). 10.1371/journal.pone.0118854 [DOI] [PMC free article] [PubMed] [Google Scholar]
- 49.Hong, J. et al. Co-overexpression of AXL and c-ABL predicts a poor prognosis in esophageal adenocarcinoma and promotes cancer cell survival. J. Cancer11(20), 5867–5879 (2020). 10.7150/jca.47318 [DOI] [PMC free article] [PubMed] [Google Scholar]
- 50.Nebenfuehr, S., Kollmann, K. & Sexl, V. The role of CDK6 in cancer. Int. J. Cancer147(11), 2988–2995 (2020). 10.1002/ijc.33054 [DOI] [PMC free article] [PubMed] [Google Scholar]
- 51.Goel, S. & Bergholz, J. S. Targeting CDK4 and CDK6 in cancer. Nat. Rev. Cancer22(6), 356–372 (2022). 10.1038/s41568-022-00456-3 [DOI] [PMC free article] [PubMed] [Google Scholar]
- 52.Xiao, B. D. et al. Multifaceted p21 in carcinogenesis, stemness of tumor and tumor therapy. World J. Stem Cells12(6), 481–487 (2020). 10.4252/wjsc.v12.i6.481 [DOI] [PMC free article] [PubMed] [Google Scholar]
- 53.Deng, T. et al. Deubiquitylation and stabilization of p21 by USP11 is critical for cell-cycle progression and DNA damage responses. Proc. Natl. Acad. Sci. U. S. A.115(18), 4678–4683 (2018). 10.1073/pnas.1714938115 [DOI] [PMC free article] [PubMed] [Google Scholar]
- 54.Yuan, Y. et al. SHP2 promotes proliferation of breast cancer cells through regulating Cyclin D1 stability via the PI3K/AKT/GSK3β signaling pathway. Cancer Biol. Med.17(3), 707–725 (2020). 10.20892/j.issn.2095-3941.2020.0056 [DOI] [PMC free article] [PubMed] [Google Scholar]
- 55.Xu, Z. et al. Endothelial deletion of SHP2 suppresses tumor angiogenesis and promotes vascular normalization. Nat. Commun.12(1), 6310 (2021). 10.1038/s41467-021-26697-8 [DOI] [PMC free article] [PubMed] [Google Scholar]
- 56.Zhang, J. et al. Cancer-associated fibroblasts potentiate colorectal cancer progression by crosstalk of the IGF2-IGF1R and Hippo-YAP1 signaling pathways. J. Pathol.259(2), 205–219 (2023). 10.1002/path.6033 [DOI] [PubMed] [Google Scholar]
- 57.Xie, M. et al. Overexpression of BACH1 mediated by IGF2 facilitates hepatocellular carcinoma growth and metastasis via IGF1R and PTK2. Theranostics12(3), 1097–1116 (2022). 10.7150/thno.65775 [DOI] [PMC free article] [PubMed] [Google Scholar]
- 58.Okano, M. et al. DNA methyltransferases Dnmt3a and Dnmt3b are essential for de novo methylation and mammalian development. Cell99(3), 247–257 (1999). 10.1016/S0092-8674(00)81656-6 [DOI] [PubMed] [Google Scholar]
- 59.Tavakolian, S., Goudarzi, H. & Faghihloo, E. E-cadherin, Snail, ZEB-1, DNMT1, DNMT3A and DNMT3B expression in normal and breast cancer tissues. Acta Biochim. Pol.66(4), 409–414 (2019). [DOI] [PubMed] [Google Scholar]
- 60.Chen, B. F. & Chan, W. Y. The de novo DNA methyltransferase DNMT3A in development and cancer. Epigenetics9(5), 669–677 (2014). 10.4161/epi.28324 [DOI] [PMC free article] [PubMed] [Google Scholar]
Associated Data
This section collects any data citations, data availability statements, or supplementary materials included in this article.
Supplementary Materials
Data Availability Statement
The WGBS and RNA-Seq data are available in the Gene Expression Omnibus (GEO) database (GEO accession: GSE248620 to GSE248622). All relevant data are available from the corresponding author upon reasonable request.


