

Abstract
Head and neck squamous cell carcinoma (HNSCC) is a highly prevalent malignancy worldwide, with a significant proportion of patients developing recurrent and/or metastatic (R/M) disease. Despite recent advances in therapy, the prognosis for patients with advanced HNSCC remains poor. Here, we present the case of a patient with recurrent metastatic HNSCC harboring an HRAS G12S mutation who achieved a durable response to treatment with tipifarnib, a selective inhibitor of farnesyltransferase. The patient was a 48-year-old woman who had previously received multiple lines of therapy with no significant clinical response. However, treatment with tipifarnib resulted in a durable partial response that lasted 8 months. Serial genomic and transcriptomic analyses demonstrated upregulation of YAP1 and AXL in metastatic lesions compared with the primary tumor, the evolution of the tumor microenvironment from an immune-enriched to a fibrotic subtype with increased angiogenesis, and activation of the PI3K/AKT/mTOR pathway in tipifarnib treatment. Lastly, in HRAS-mutated PDXs and in the syngeneic HRAS model, we demonstrated that tipifarnib efficacy is limited by activation of the AKT pathway, and dual treatment with tipifarnib and the PI3K inhibitor, BYL719, resulted in enhanced anti-tumor efficacy. Our case study highlights the potential of targeting HRAS mutations with tipifarnib in R/M HNSCC and identifies potential mechanisms of acquired resistance to tipifarnib, along with immuno-, chemo-, and radiation therapy. Preclinical results provide a firm foundation for further investigation of drug combinations of HRAS-and PI3K -targeting therapeutics in R/M HRAS-driven HNSCC.
Keywords: Head and neck squamous cell carcinoma, HRAS mutation, tipifarnib, farnesyltransferase inhibitor, targeted therapy, resistance, PI3K inhibition, durable response
Introduction
Head and neck squamous cell carcinoma (HNSCC) is a complex malignancy that arises from the mucosal lining of the upper aerodigestive tract, with a high recurrence rate and distant metastasis[1]. Despite the development of immune checkpoint inhibitors targeting programmed death 1 (PD-1), survival in recurrent and/or metastatic (R/M) disease remains poor, with a median survival of approximately 12 months[2–4]. Additionally, although the molecular characteristics of HNSCC have been described[5–12], the mechanisms of resistance to targeted therapies are not well understood. The epidermal growth factor receptor (EGFR) inhibitor cetuximab is approved for use; however, its activity remains modest, and no companion diagnostic-dependent biomarker has been implicated to improve its efficacy[13,14]. Approximately 4–8% of HNSCCs harbor activating mutations in HRAS, a member of the RAS family of oncogenes that play a crucial role in the regulation of cell growth and survival[15]. Recently, tipifarnib was developed as a therapy for HNSCC patients with oncogenic HRAS mutations by inhibiting and preventing farnesyl transferase (FT) from prenylating the HRAS protein CAAX tail motif, thereby preventing HRAS from binding to the membrane and rendering it inactive[16]. Tipifarnib has shown encouraging preclinical activity and has recently demonstrated clinical efficacy in a subset of R/M HNSCC with HRAS mutations[17,18]. However, despite this promising early clinical evidence of efficacy, biomarkers and molecular underpinnings of the response and resistance to tipifarnib in the clinical setting are largely unknown. Here, we present an evolutionary clonal analysis using comprehensive molecular profiling of an exceptional responder to tipifarnib in HRAS-mutated HNSCC. Preclinical studies using an HRAS-mutated cell line, patient-derived xenografts (PDXs), and a novel syngeneic HRAS-mutated murine head and neck cancer (HNC) model, we validated the resistance mechanisms and targeted the key HRAS and PI3K-AKT-mTOR feedback loop via the combination of tipifarnib and BYL719 (Alpelisib), a PI3Kα inhibitor. We found that tipifarnib synergizes with BYL719 in HRAS-mutant HNSCCs, leading to marked cytotoxicity in vitro and tumor regression in vivo.
Materials and Methods
Clinical sampling
All tumor samples were obtained in accordance with the clinical standard of care. The patient consented to the analyses described below.
Genomics, Transcriptomics and Microenvironment Analysis
DNA and RNA for tumor whole exome sequencing (WES) and RNA sequencing (RNA-seq) were extracted from FFPE tumor samples using the FFPE ALLPrep DNA/RNA kit (Qiagen). The QIAamp DNA Blood Mini Kit (Qiagen) was used to extract normal DNA from blood. For library preparation from extracted DNA, the Agilent SureSelect XT HS2 DNA kit was used for library construction and the Agilent SureSelect Human All Exon V7 exome was used for hybridization and capture. For library preparation from RNA, the Agilent SureSelect XT HS2 RNA kit was used for library construction and the Agilent SureSelect Human All Exon V7+UTR exome was used for hybridization and capture. WES and RNA-seq were performed on an Illumina NovaSeq 6000 system. Next-generation sequencing quality control analysis was conducted using FastQC v0.11.9, Fast Q Screen v0.14.0, and MultiQC v1.4
A deconvolution algorithm, Kassandra, was used to predict cellular composition[19]. TME subtypes were identified based on a previously described transcriptomic-based TME classification approach[20].
Cell line Maintenance
HRASV12 shp53 EpT cells were used in our study, as previously described[21]. These cells were maintained at 37°C in a humidified atmosphere with 5% CO2 and grown in the appropriate media supplemented with 1% L-glutamine, 100 units/mL of penicillin and streptomycin, and 10% FBS. The presence of mycoplasma was rigorously checked using a Mycoplasma Detection Kit (PCR) from HyLabs (Rehovot, Israel), and no mycoplasma was detected.
Determination of Synergy
Cells were seeded in 96-well plates (3000 cells/well), treated with varying concentrations of the relevant drugs in combination, and allowed to proliferate for 3 days. Cells were then fixed with 0.6 M trichloroacetic acid (TCA) for 1 h at 4 °C, rinsed, and stained with crystal violet (1 g/L) for 10 min at room temperature. Following additional rinsing, the bound crystal violet was dissolved in 10% acetic acid, and absorbance was measured at 570 nm using a BioTek Epoch spectrophotometer (Winooski, Vermont, USA). For the synergy assays, the proliferation of cells in the different treatment groups was determined as the percentage of control (DMSO-treated) cells, and the percentage of growth inhibition was calculated. The ZIP Synergy scores were calculated using the Synergyfinder website.
Western Blotting
Cells were washed with ice-cold PBS, harvested in lysis buffer (50 mM HEPES [pH 7.5], 150 mM NaCl, 1 mM EDTA, 1 mM EGTA, 10% glycerol, 1% Triton X-100, 10 μM MgCl2), supplemented with phosphatase inhibitor cocktails (Biotool, B15001A/B) and protease inhibitor (MilliporeSigma, P2714–1BTL), and placed on ice for 30 min, followed by 3 min of ultrasonic cell disruption. The lysates were cleared by centrifugation (30 min, 20,800 × g, 4 °C). The supernatants were collected and frozen at −80 °C until further use. Protein concentrations were determined using the Bio-Rad protein assay. SDS sample buffer was added and the samples were boiled for 5 min. Whole-cell lysates (20 μg) were separated by 10% SDS–PAGE and blotted onto PVDF membranes (Bio-Rad Trans Blot ® Turbo™ transfer pack #1704157). Membranes were blocked for 1 h in blocking solution [5% BSA (Amresco, 0332-TAM) in Tris-buffered saline with 0.1% Tween] and then incubated with primary antibodies diluted in blocking solution. Mouse and rabbit HRP-conjugated secondary antibodies were diluted in a blocking solution. Protein-antibody complexes were detected by chemiluminescence [Westar Supernova (Cyanagen, XLS3.0100) and Westar Nova 2.0 (Cyanagen, XLS071.0250] ), and images were captured using the Azure C300 Chemiluminescent Western Blot Imaging System (Azure Biosystems).
PDX maintenance
Fresh surgically removed tumor tissues for the PDXs (HN2579 and HN3504) were obtained by Crown Bio (Crown Bioscience SPF facility) from patients diagnosed with HNSCC, with approval from the IRBs of the hospital and informed consent from the patients. The study was conducted in accordance with recognized ethical guidelines, and the protocol and any amendments or procedures involving animal care and use were approved by the Institutional Animal IACUC of CrownBio prior to the start of the study.
Animal studies
C57/BL6 mice were procured from Envigo, while NOD.Cg-Prkdc Il2rg/SzJ (NSG) mice were acquired from Jackson Laboratory. All mice were housed in air-filtered cabinets with a 12-hour light/dark cycle and provided with food and water ad libitum. The mice were maintained and treated according to the institutional guidelines of Ben-Gurion University of the Negev and approved by the Institutional Animal Care and Use Committee (IACUC) (IL.80–12-2015 (E), IL.29–05-2018 (E), IL.43–06-2019 (E), and IL.44–06-2019 (E)). The study was conducted in accordance with the regulations of the Association for Assessment and Accreditation of Laboratory Animal Care, ensuring ethical treatment of the animals involved.
Drug Efficacy Evaluation
Five mice were randomly assigned to each group for in vivo metastasis and drug efficacy studies when their tumors reached 100 mm3. Treatment was administered orally on a daily basis, consisting of a vehicle (0.5% carboxymethylcellulose (9481–1KG, Millipore Sigma, Burlington, MA, USA)), monotherapy with tipifarnib (at a dose of 60 mg/kg, administered twice daily), BYL719 (at a dose of 25 mg/kg, administered daily) [For PDX - BYL719 (at a dose of 40/50 mg/kg, administered daily)], or a combination of drugs as outlined in the study. Tumor size was measured twice a week using a digital caliper, and volumes were calculated using the following formula: length × width2 × (π/6). At the end of the experiment, the mice were euthanized by CO2 inhalation, and tumors, lymph nodes, and lungs were collected for analysis. Tumor volumes were expressed as a percentage of the initial volume and averaged with the standard error of the mean. Tumors, cervical lymph nodes (cLN), and lungs were collected for analysis. Fixed tissue samples were stored in 70% ethanol for future examination, while serial sections of the lungs were stained with hematoxylin and eosin (H&E) to assess metastasis.
Statistical analysis
Data analysis was performed using GraphPad Prism software (version 9), and the results are presented as the mean ± SEM. To compare the differences between the two groups, an unpaired t-test was performed, and p-values were calculated. For experiments with more than two groups, one-way ANOVA was performed, followed by Tukey’s multiple comparison test. Statistical significance was defined as p values of 0.05 (*), 0.01 (**), 0.001 (***), and 0.0001 (****) were considered statistically significant.
Data Availability Statement
The data generated in this study are available within the article. The data that support the findings of this study are available upon request from the corresponding author. The data were not publicly available because of information that could compromise the privacy of the research participants.
Results
Case Presentation
A 48-year-old woman was diagnosed with squamous cell carcinoma (SCC) of the right ear canal and underwent surgery at an outside institution, with pathology demonstrating SCC staged as pT3N0M0, stage III, with a positive margin. She subsequently presented to our institution and ultimately underwent re-resection, demonstrating residual microinvasive SCC with zero out of forty-four lymph nodes in the right neck. The patient was subsequently treated with adjuvant radiotherapy of 60 Gy. Two months later, the patient developed a rapidly enlarging right neck mass, and biopsy confirmed recurrent SCC. She was started on induction chemotherapy with three cycles of carboplatin and paclitaxel with a partial response, followed by definitive chemoradiation with 3-weekly cisplatin and concurrent daily fractionated radiotherapy at 70 Gy. PET/CT scans showed a complete metabolic response 3 months after the completion of chemoradiotherapy. Six months later, the patient underwent surveillance imaging, demonstrating a lung nodule that underwent biopsy confirmation as a solitary lung metastasis. She was treated with Stereotactic Body Radiation Therapy (SBRT) for solitary metastasis. The PD-L1 combined positive score (CPS) was 0, and the patient refused systemic therapy at that time. Six months later, the patient developed numerous thoracic, intra-abdominal, and osseous metastases. She initiated treatment with three cycles of carboplatin, 5-fluorouracil, and pembrolizumab, with re-imaging consistent with progressive disease complicated by progressive dyspnea, pain, and declining performance status. Next-generation sequencing (NGS) using the University of Chicago Clinical Laboratory Improvement Amendments (CLIA)-certified NGS platform revealed the presence of an HRAS G12S mutation with a variant allele frequency (VAF) of 53% along with mutations in TP53, TERT, and CDKN2A. She initially consented to the KO-TIP-007 study (NCT03719690) but was ultimately deemed a screen failure due to decompensation in clinical status. She subsequently started tipifarnib 600 mg BID on days 1–7 and 15–21 of a 28-day cycle under a single-patient Investigational New Drug (IND) protocol approved by the University of Chicago Institutional Review Board (IRB) after obtaining informed consent (IND159316). Following the initiation of therapy, she developed improvement in dyspnea and fatigue. Imaging performed 12 weeks after starting therapy demonstrated a partial response of −33% per Response Evaluation Criteria in Solid Tumors (RECIST) version 1.1, with a response duration of 8 months with excellent tolerability and treatment-related adverse events notable for grade 1 anemia and fatigue. At the time of progressive disease following various therapies, serial tumor samples were obtained, and comprehensive molecular profiling was performed using the BostonGene Tumor Portriat™ test (Figure 1). She ultimately developed progressive disease, started third-line systemic therapy with cetuximab, and ultimately transitioned to hospice care.
Figure 1:
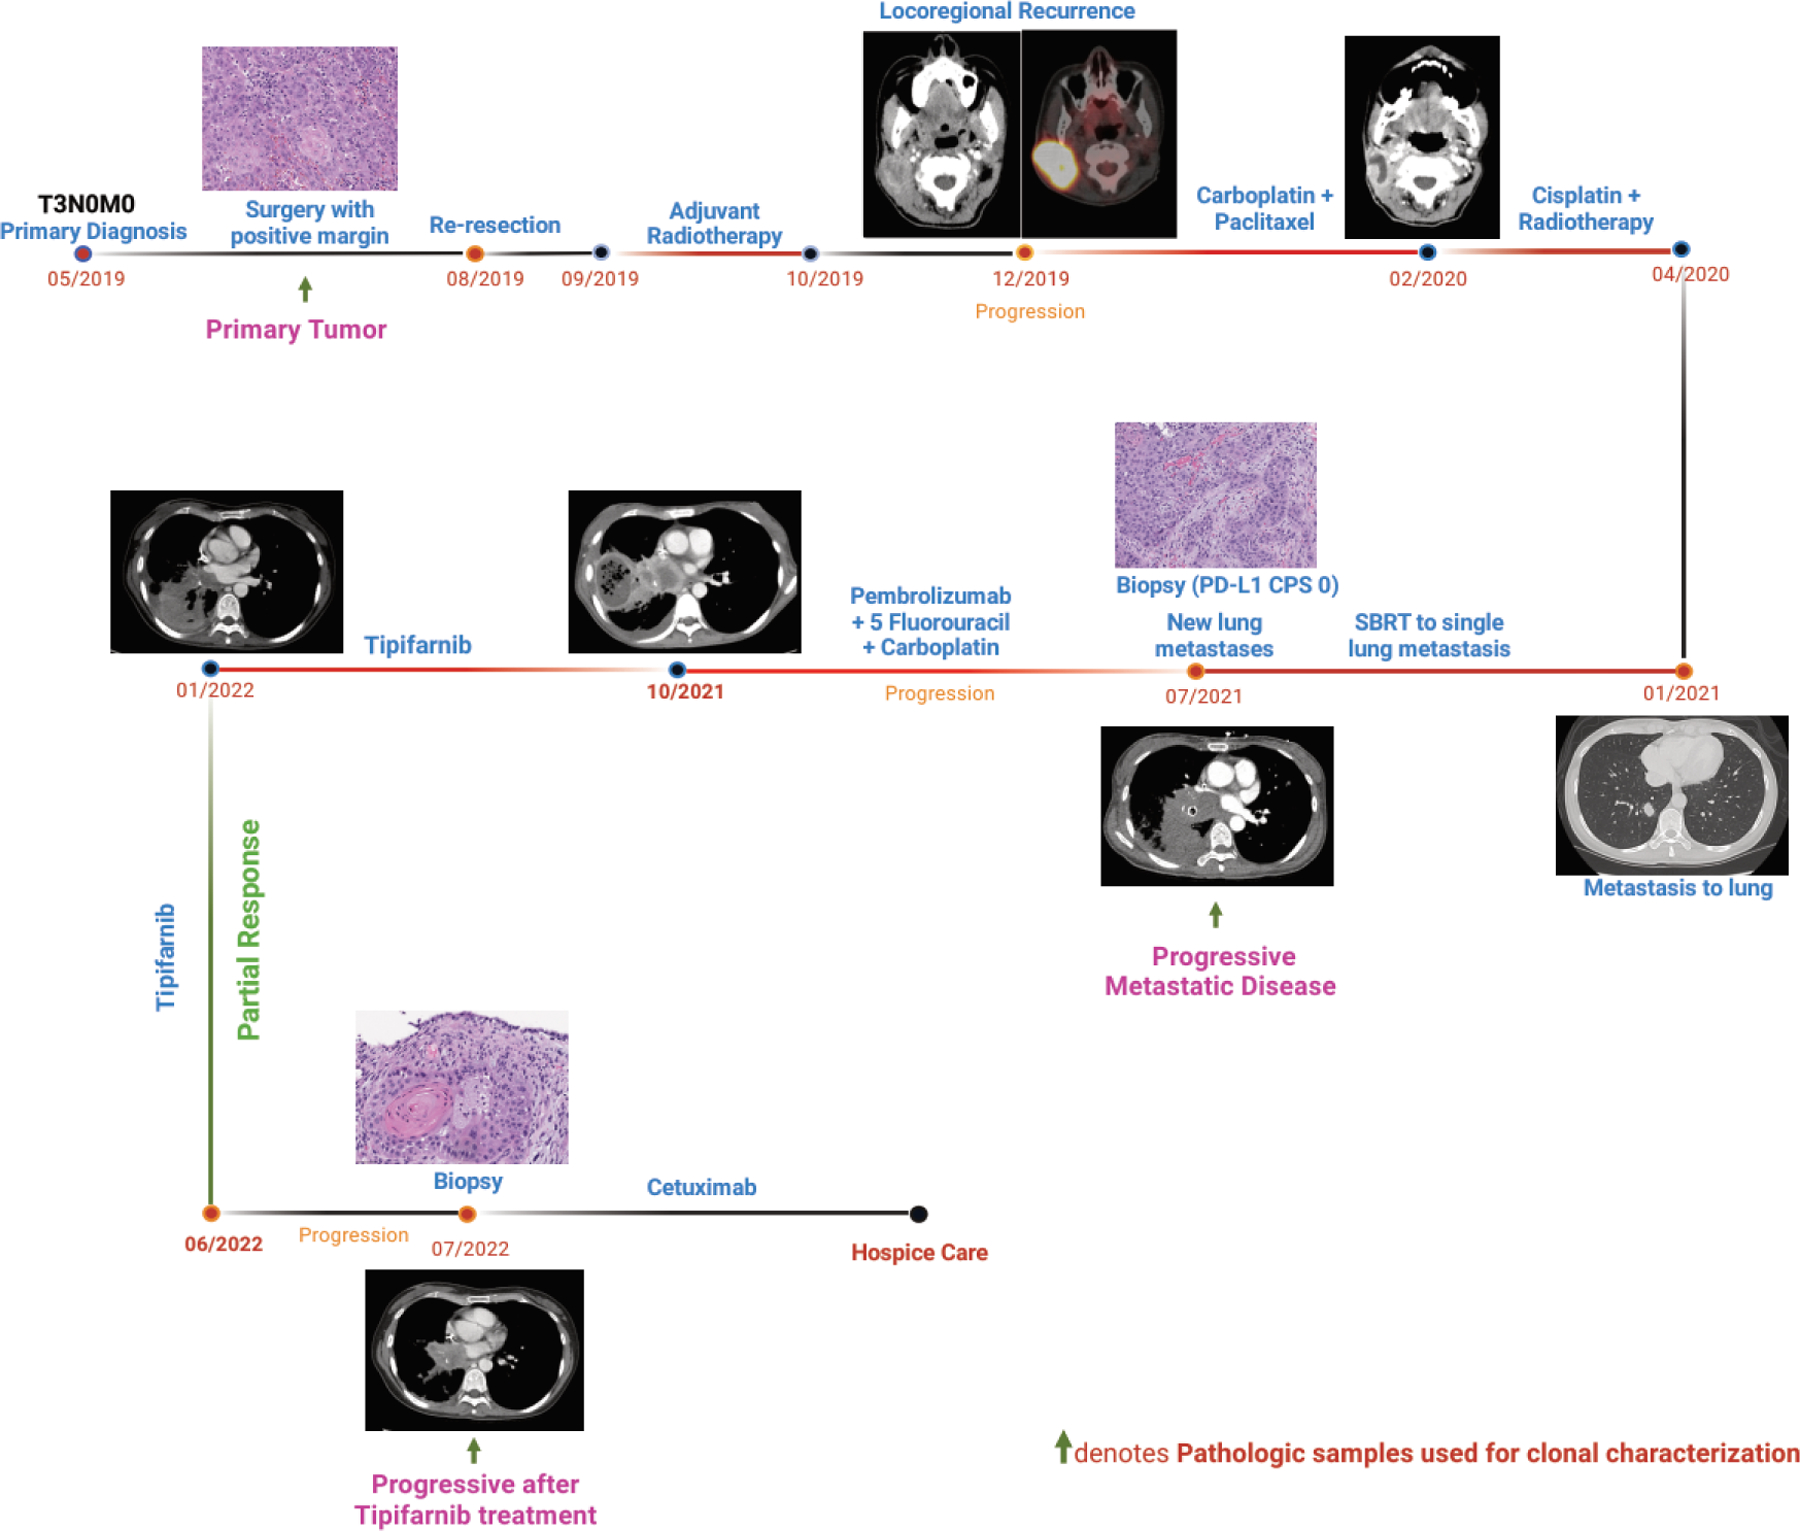
Timeline of clinical course and time points of tumor samples obtained from the patient (this scheme was created with BioRender.com). Representative H&E images of the tissue biopsy and positron emission tomography (PET) / computerized tomography (CT) images of the patient at respective time intervals are provided.
A comprehensive molecular profiling reveals differences between primary and metastatic tumors
Integrated genomic and transcriptomic analyses using whole-exome sequencing (WES) and RNA sequencing (RNA-seq) were performed on longitudinal tumor specimens to understand the mechanisms of disease progression, treatment response, and resistance. As expected, a HRAS G12S mutation with high-level amplification was noted in all primary and metastatic diseases. Furthermore, the tumor mutational burden (TMB) remained low, with 2.3 – 2.58 mutations per megabase, and microsatellite stability was found to be stable in both primary and metastatic tumors (Figure 2A). Interestingly, while PD-L1 expression by immunohistochemistry was negative (CPS of 0), RNA-seq demonstrated high gene expression levels (95% in primary tumors, 94% in progressive metastatic disease, and 91% in progressive disease after tipifarnib treatment, relative to expression levels in patients with a similar diagnosis). The TP53 G245D loss-of-function mutation and loss-of-heterozygosity were shared among all tumor specimens (VAF 35.2%, 35%, and 24%). CDKN2A R58 loss-of-function and loss-of-heterozygosity were observed in all tumor specimens. EGFR expression levels remained intermediate (41%, 54%, and 67%, respectively) (Figure 2A). Interestingly, YAP1 and AXL expression increased from low at baseline to high at the time of rapidly progressive metastatic disease (Supplementary Figure 1). During metastatic progression, upregulation of FGFR1 and MET transcripts was observed (Supplementary Figure 1). In contrast to the primary tumor, the tumor proliferation rate signature was low during the metastatic progression. Additionally, transcriptomic-based tumor microenvironment (TME) analysis revealed a change from an immune-enriched, non-fibrotic TME subtype at baseline (Figure 2B) to a fibrotic TME subtype with intense angiogenesis and the presence of cancer-associated fibroblasts (CAFs) after metastatic progression (Figure 2C and 2D). It was also observed that at the time of rapidly progressive metastatic disease, there were concomitant increases in VEGFR1, VEGFR2, VEGFR3, and VEGFA expression (Supplementary Figure 1). Overall, medium-to-high expression levels of PD-L1, PD-L2, PD-1, TIGIT, CTLA4, HVEM, PDGFRA, PDGFRB, TGFB2, IL10, IDO1, IL6, and TGFB3 were observed across all three specimens (Supplementary Figure 2). The deconvolution algorithm Kassandra[19] was used to calculate cellular composition, which showed an increase in NK cells, CD8+T cells, regulatory T cells, M2 tumor-associated macrophages, neutrophils, endothelial cells, and CAFs (Figure 3A and 3B).
Figure 2:

(A) Key biomarkers of patient samples at baseline, progressive metastatic disease, and tumor progression after tipifarnib treatment. Tumor microenvironment subtypes of patient samples at baseline (B), progressive metastatic disease (C), and tumor progression after tipifarnib treatment (D). This planetary schematic represents the molecular and functional characteristics of a patient’s tumor. Blue represents anti-tumor activity and red represents pro-tumor activity. The size of the dots corresponds to the strength of the gene signatures.
Figure 3:

Tumor microenvironment cellular composition of the tumor derived from the patient (A) Baseline/Primary, (B) Progressive Metastatic Disease and (C) Progressive tumor after tipifarnib treatment. (D) Tumor clonal evolution at the three time points at which the tumor was taken for analysis.
Tipifarnib treatment affects tumor clonality and TME
In this patient with mutated HRAS R/M HNSCC and aggressive biology, tipifarnib treatment resulted in a durable response. To understand the mechanisms underlying this response, we conducted an evolutionary clonal analysis utilizing both genomic and transcriptomic sequencing data on tumor samples collected at the time of rapidly progressive metastatic disease and at the time of progression after immunotherapy-based treatment and tipifarnib (Figure 3D). Our analysis showed that TMB increased after immunotherapy, tipifarnib therapy, and the HRAS G12S mutation with high-level amplification was noted. Post-tipifarnib tumor tissue genomic analysis revealed a new loss-of-function mutation in TP53, along with G245D. We also noted an acquired ATM loss at the time of progression on tipifarnib (Figure 2A). Furthermore, a GNAQ T96S gain-of-function mutation was acquired at the time of progression on immunotherapy but was subsequently lost at the time of progression on tipifarnib (Supplementary Figure 2).
Transcriptomic analysis revealed changes in gene expression, with a reduction in ITGB6 and upregulation of CEACAM6, whereas FGFR1, MET, and ABCB1 levels remained high during tipifarnib treatment (Supplementary Figure 2). The tumor proliferation signature changed from low to moderate during the progression of tipifarnib treatment. The fibrotic TME subtype was observed in both the progressive metastatic diseases (Figure 2C and 2D). However, the decline in T- and B-cell populations during tumor progression with tipifarnib treatment was indicative of an immunosuppressive TME (Figure 3B and 3C). High neutrophil infiltration was noted in the tumor after tipifarnib treatment (Figure 3B and 3C), resulting in a pro-tumorigenic environment with enhanced angiogenesis and fibrosis. Furthermore, the expression of VEGFR1, VEGFR2, VEGFA, PDGFRA, PDGFRB, IL10, IL6, and TGFB2 was high, and MHCI and MHCII molecules were significantly downregulated. The upregulation of major receptor tyrosine kinases such as EGFR, MET, FGFR1, and AXL implicated the potential activation of the PI3K/AKT/mTOR pathway throughout the patient’s disease trajectory, from baseline through advanced disease.
PI3K blockage enhances tipifarnib efficacy
To investigate the PI3K/AKT/mTOR signaling pathway in limiting the efficacy of tipifarnib and enabling tumor cells to survive and proliferate, we utilized syngeneic HRAS-mutant cell models, murine HRASV12 shp53 EpT cells[21]. These cells were exposed to 1 μM tipifarnib for 5 days (~120 h) and the activation status of the PI3K/AKT pathway was monitored. Western blot analysis showed that treatment induced upregulation of the PI3K/AKT pathway, as indicated by the increased pAKT S473 levels (Figure 4A).
Figure 4:

PI3K blockade enhances tipifarnib efficacy in vitro and in vivo. (A) Western blot showing the expression of phosphorylated AKT after tipifarnib treatment for 0 and 120 h in HRASV12 shp53 EpT. (B) The ZIP model synergy test was performed using the HRASV12 shp53 EpT cell line. The cells were cultured with increasing concentrations of tipifarnib (0–1 μM) or BYL719 (0–20 μM). After four days of treatment, cell viability was determined using crystal violet staining. The results are presented as a ZIP synergy score with 3-D surface plots displaying synergy regions. The synergy experiment was repeated three times, and the representative results from one experiment are presented. (C) Western blotting confirming the blocking of pAKT activation by tipifarnib-BYL719 co-treatment in HRASV12 shp53 EpT cells. HRASV12 shp53 EpT cells were injected into the lips of WT (D) or NSG (E) mice. After tumors developed (tumor volume ~ 32 mm3), the mice were randomized into four groups and treated daily with the treatment indicated in the graph. Growth kinetics of tumors, (F & G) number of enlarged lymph nodes, and lung metastasis foci following treatment via oral gavage with vehicle, tipifarnib (60 mg/kg twice daily), BYL719 (25 mg/kg once daily), or a combination of the two drugs. (H) PDX were injected or implanted subcutaneously (s.c.) into NSG mice. After tumors developed (tumor volume ~100 mm3), the mice were randomized into four groups and treated daily with the treatment indicated in the graph. Growth kinetics of two HRAS mutant PDX tumors following treatment via oral gavage with vehicle, tipifarnib (60 mg/kg twice daily), BYL719 (40–50 mg/kg once daily), or a combination of the two drugs. P values of 0.05 (*), 0.01 (**), 0.001 (***), and 0.0001 (****) were considered statistically significant. ns, not significant.
Given that the PI3K/AKT pathway was activated in both patient samples and HRAS-mutant cell lines, we hypothesized that blocking the activated PI3K/AKT signaling using the p110α inhibitor alpelisib (BYL719) would enhance the efficacy of tipifarnib. To test this hypothesis, we quantified the synergy of the combination treatment with BYL719 and tipifarnib in vitro and found that in HRASV12 shp53 EpT cells, the synergistic score was 15 (Figure 4B). Protein analysis of the mono- and co-treatments revealed that combination therapy prevented the activation of AKT induced by tipifarnib, thus inhibiting cell survival and proliferation (Figure 4C).
To validate the in vitro results in preclinical models, we utilized our highly metastatic and tumorigenic HRASV12 shp53 EpT cells[21] to explore the therapeutic combination of tipifarnib and BYL719 in mice. To this end, we injected 5×10⁵ HRASV12 shp53 EpT cells into the lips of the C57BL/6 mice. Once the tumor reached a diameter of 3 mm, treatment was initiated. As illustrated in Figure 4D and 4E, the combination of BYL719 and tipifarnib resulted in a significant enhancement in antitumor activity compared to single-agent treatment. Analysis of mice revealed that tipifarnib reduced cervical lymph node (cLN) and lung metastasis, but supplementation with BYL719 did not show superior activity in preventing metastasis (Figure 4F). As the low spontaneous metastasis rate to the lungs in C57BL/6 mice may not fully represent the extent of the anti-metastatic effect, we further validated the results in an additional experiment using immunodeficient host NSG (NOD.Cg-Prkdc Il2rg/SzJ) mice. The combination of BYL719 and tipifarnib showed superior antitumor activity (Figure 4G), but there was no evidence of a superior antimetastatic effect beyond tipifarnib.
To confirm these findings, we used two HRAS-mutant HNC patient-derived xenograft (PDX) models [HN2579 (G12S) and HN3504 (K117N)] and tested the combination of treatments in immunodeficient mice. As depicted in Figure 4H, the combination of treatments induced a superior antitumor effect in one of the HNC PDX models, whereas in the other model, only statistically insignificant tumor shrinkage was detected in the combination treatment compared to a stable disease on monotherapy.
Discussion
To the best of our knowledge, this is the first evolutionary analysis of HRAS-mutated HNSCC in a patient with prolonged response to tipifarnib. The molecular and genomic characterization of HNSCC has recently been elucidated, largely through the identification of two overlapping phenotypes based on the presence or absence of human papillomavirus (HPV)[15]. While HPV-negative HNSCC is frequently characterized by inactivating mutations in TP53, CDKN2A, NOTCH, and FAT1 and activating mutations in CCND1, HPV-positive HNSCC tends to be driven by HPV E6E7 inhibition of TP53 and RB1. Despite the identification of recurring oncogenic mutations in HNSCC, genomically targeted therapeutics have largely been disappointing. Cetuximab, an EGFR targeted monoclonal antibody, has modest activity either alone or in combination with chemotherapy in an R/M setting or in combination with definitive radiotherapy, and unlike in colorectal cancer, does not have a companion predictive biomarker[14,22,23].
Recently, tipifarnib, a farnesyl transferase inhibitor, has been proven to be a promising therapeutic option for a subset of HNSCC with oncogenic HRAS mutations. Tipifarnib specifically targets HRAS mutations, unlike KRAS or NRAS, in which geranylgeranyl transferase 1 can substitute farnesyl transferase. This appears to not be the case with HRAS, which leads to uninhibited membrane binding and subsequently retained function[24,25]. Following promising preclinical data, a single-arm phase II trial evaluating tipifarnib in R/M HNSCC with HRAS mutations demonstrated a 55% objective response rate among patients with a high VAF (defined as >20%) in a highly pretreated and refractory patient population[17]. However, the molecular mechanisms and dynamic biomarkers of HRAS-driven tumors in deep responders to tipifarnib are still being investigated.
Here, we describe the case of a patient with biologically aggressive HRAS-mutated HNSCC refractory to standard therapies, including immunotherapy, who demonstrated a durable response to tipifarnib. We subsequently performed evolutionary and clonal dynamics analysis on serial samples using a comprehensive molecular profiling assay (BostonGene Tumor Portrait™ test) throughout this patient’s treatment trajectory to identify potential biomarkers of exceptional response and potential resistance mechanisms. Tissue samples were obtained at three time points for comparative analysis: baseline, rapidly progressive metastatic disease after chemoradiation, and disease progression following immunotherapy and tipifarnib.
As expected, the oncogenic HRAS G12S mutation was present at a high VAF at baseline and over the course of this patient’s treatment trajectory, suggesting that it is a clonal, oncogenic driver. Additional oncogenic mutations, including TP53 and CDKN2A, which have been well characterized as recurring mutations in HNSCC[10] were also identified. Interestingly, the YAP1-AXL axis demonstrated comparatively low expression in the primary tumor at baseline, while at the time of rapidly progressive distant metastatic disease, it was highly expressed along with increased levels of proangiogenic factors, such as VEGFR1–3 and VEGFA. This finding is consistent with recent preclinical work suggesting that YAP1 and AXL are crucial factors for mutated HRAS-induced metastasis by switching off the Hippo pathway and stimulating lymphovascular angiogenesis[21]. Targeting the YAP1-AXL and Hippo pathways may inhibit lymphovascular angiogenesis and affect the propensity towards metastatic progression.
While PD-L1 expression by immunohistochemistry was negative in our patient with a CPS of 0, gene expression of the PD-(L)1 axis appeared to be increased, similar to previous reports of PD-L1 expression being more commonly found in HRAS-mutant HNSCC than in HRAS wildtype[26]. The lack of PD-L1 expression during IHC analysis may be due to post-transcriptional or post-translational modifications. It has recently been documented that post-translational modifications such as phosphorylation, N-glycosylation, and ubiquitination of PD-L1 are important regulatory mechanisms that modulate immunosuppression in patients with cancer [27]. Our results also indicate that IHC may underestimate PD-L1 expression in certain cases. Conroy et al., has demonstrated that combined positive PD-L1 result (≥1% IHC tumor propotion score and high PD-L1 expression by RNA-seq) was associated with a 2-to-5-fold higher overall response rate compared to a double negative result among cancer patients[28]. In our case, we observed a lack of response to immunotherapy and chemotherapy despite the high PD-L1 expression (RNA-seq). To ascertain the accuracy and reliability of PD-L1 through RNA-seq, it is imperative that future prospective clinical studies pertaining to immune checkpoint inhibitors be conducted across various histologies. Such studies will serve as a means of validation and will ensure that the aforementioned technique is deemed trustworthy and suitable for widespread clinical use. Furthermore, as the TME in HRAS-mutated HNSCC is poorly understood[29], our dynamic evolutionary analysis also evaluated TME in this setting. Interestingly, the patient’s primary tumor demonstrated an immune-enriched, non-fibrotic TME, which is associated with a favorable immunotherapy response that shifted from rapidly progressive disease to a fibrotic, immune-depleted TME, which is associated with a poorer immunotherapy response[20]. This patient developed primary resistance to chemoimmunotherapy, which is consistent with the lack of an immune-responsive phenotype. This suggests that the early initiation of immunotherapy may be important, as the increased fibrotic TME likely contributes to primary immune resistance in a more advanced disease setting.
Tumor stromal interactions play an important role in disease progression, metastasis, and overall survival. Correlative clinical evidence suggests that neutrophils are an important component of tumor-promoting inflammation and immunosuppression in numerous mouse and human tumors[30]. Increased neutrophil infiltration and high neutrophil-to-lymphocyte ratios have been reported to be associated with poor outcomes in patients with HNSCC[31–33]. High neutrophil infiltration is generally associated with a worse response to chemotherapy[34], immunotherapy[32], and radiotherapy[35]. We observed that high neutrophil infiltration was associated with disease aggressiveness and therapy resistance, demonstrating the need to study the significance of tumor cell-neutrophil interactions in resistance to tipifarnib therapy.
Interestingly, transcriptomic analysis demonstrated upregulation of various receptor tyrosine kinases (RTK)s throughout the patient’s disease trajectory, from baseline through advanced disease. Previous studies have suggested that treatment of HRAS-mutated HNC with tipifarnib leads to compensatory loop activation through the PI3K-AKT pathway[36]. Reports suggest that HRAS and PI3K drive resistance to inhibitors of alternative pathway[37–40]. Recent studies have suggested that, by blocking both HRAS-MAPK and PI3K-AKT-mTOR signaling, tipifarnib can potentially blunt the feedback (re)activation of the two major pathways driving PI3K inhibitor resistance and greatly enhance the efficacy of BYL719 in HNC[41]. In our preclinical evaluation, we showed that by inhibiting the reactivation of PI3K-AKT pathway by tipifarnib using BYL719, enhanced the treatment efficacy of tipifarnib in HRAS-mutant HNSCC. Thus, through preclinical models of HNSCC, we have shown that the combination of tipifarnib and BYL719 is effective, and we have provided a mechanistic justification for the advancement of this combination in clinical trials. Our hypothesis suggests that the effectiveness of tipifarnib could be improved, and the potential of other targeted therapies that are approved or in the process of development could be expanded. This could have a significant positive impact on R/M HNSCC patients.
Conclusion
In conclusion, our evolutionary analysis of an exceptional responder to tipifarnib in HRAS-mutated HNSCC identified YAP1-AXL axis driven angiogenesis and metastatic progression, conversion of the TME from an immune-infiltrated to fibrotic phenotype, and activation of the PI3K/AKT/mTOR pathway. Targeting these pathways may overcome resistance to immunotherapeutic and targeted strategies in HRAS-mutated HNSCC.
Supplementary Material
Highlights of the study.
Tipifarnib is the first biomarker-selected targeted therapy for HNSCC; however, the mechanisms of resistance are poorly understood.
Evolution of the tumor microenvironment from an immune-enriched to a fibrotic phenotype with increased angiogenesis was observed along disease trajectory of HRAS mutated HNSCC treated with tipifarnib therapy.
The efficacy of tipifarnib is limited by activation of the AKT pathway, and dual therapy with tipifarnib and PI3K inhibition leads to enhanced anti-tumor efficacy.
Acknowledgement
We appreciate Jessica H. Brown from BostonGene for her kind review and editing.
Funding
This work was funded by the Israel Science Foundation (ISF, 302/21 and 700/16) (to ME), Israel Cancer Research Foundation (ICRF, 17-1693-RCDA) (to ME), ISF, and NSFC Israel-China project (M. E. #3409/20). At the Memorial Sloan Kettering Cancer Center, support was provided by the NIH/NCI Cancer Center Support Grant P30 CA008748 (ALH); Fellowships: PBC post-doctoral fellowship from the Israel Council for Higher Education to SJ. This work was supported by the University of Chicago Cancer Center Support Grant P30 CA014599 (AJR).
Footnotes
Publisher's Disclaimer: This is a PDF file of an unedited manuscript that has been accepted for publication. As a service to our customers we are providing this early version of the manuscript. The manuscript will undergo copyediting, typesetting, and review of the resulting proof before it is published in its final form. Please note that during the production process errors may be discovered which could affect the content, and all legal disclaimers that apply to the journal pertain.
Conflict of Interest:
ME reported a grant from Kura Oncology.
All BostonGene authors were employees at the time of this study.
All other authors declare no competing financial interests.
Reference
- [1].Mody MD, Rocco JW, Yom SS, Haddad RI, Saba NF. Head and neck cancer. The Lancet 2021;398:2289–99. 10.1016/S0140-6736(21)01550-6. [DOI] [PubMed] [Google Scholar]
- [2].Cohen EEW, Soulières D, Le Tourneau C, Dinis J, Licitra L, Ahn MJ, et al. Pembrolizumab versus methotrexate, docetaxel, or cetuximab for recurrent or metastatic head-and-neck squamous cell carcinoma (KEYNOTE-040): a randomised, open-label, phase 3 study. Lancet 2019;393:156–67. 10.1016/S0140-6736(18)31999-8. [DOI] [PubMed] [Google Scholar]
- [3].Burtness B, Harrington KJ, Greil R, Soulières D, Tahara M, de Castro G, et al. Pembrolizumab alone or with chemotherapy versus cetuximab with chemotherapy for recurrent or metastatic squamous cell carcinoma of the head and neck (KEYNOTE-048): a randomised, open-label, phase 3 study. The Lancet 2019;394:1915–28. 10.1016/S0140-6736(19)32591-7. [DOI] [PubMed] [Google Scholar]
- [4].Ferris RL, Blumenschein G, Fayette J, Guigay J, Colevas AD, Licitra L, et al. Nivolumab for Recurrent Squamous-Cell Carcinoma of the Head and Neck. N Engl J Med 2016;375:1856–67. 10.1056/NEJMOA1602252. [DOI] [PMC free article] [PubMed] [Google Scholar]
- [5].Zhang P, Li S, Zhang T, Cui F, Shi JH, Zhao F, et al. Characterization of Molecular Subtypes in Head and Neck Squamous Cell Carcinoma With Distinct Prognosis and Treatment Responsiveness. Front Cell Dev Biol 2021;9. 10.3389/FCELL.2021.711348/FULL. [DOI] [PMC free article] [PubMed] [Google Scholar]
- [6].Lepikhova T, Karhemo PR, Louhimo R, Yadav B, Murumagi A, Kulesskiy E, et al. Drug-sensitivity screening and genomic characterization of 45 hpV-negative head and neck carcinoma cell lines for novel biomarkers of drug efficacy. Mol Cancer Ther 2018;17:2060–71. 10.1158/1535-7163.MCT-17-0733. [DOI] [PubMed] [Google Scholar]
- [7].Stransky N, Egloff AM, Tward AD, Kostic AD, Cibulskis K, Sivachenko A, et al. The mutational landscape of head and neck squamous cell carcinoma. Science 2011;333:1157–60. 10.1126/SCIENCE.1208130. [DOI] [PMC free article] [PubMed] [Google Scholar]
- [8].Agrawal N, Frederick MJ, Pickering CR, Bettegowda C, Chang K, Li RJ, et al. Exome sequencing of head and neck squamous cell carcinoma reveals inactivating mutations in NOTCH1. Science (1979) 2011;333:1154–7. 10.1126/science.1206923. [DOI] [PMC free article] [PubMed] [Google Scholar]
- [9].Su SC, Lin CW, Liu YF, Fan WL, Chen MK, Yu CP, et al. Exome sequencing of oral squamous cell carcinoma reveals molecular subgroups and novel therapeutic opportunities. Theranostics 2017;7:1088–99. 10.7150/thno.18551. [DOI] [PMC free article] [PubMed] [Google Scholar]
- [10].Lawrence MS, Sougnez C, Lichtenstein L, Cibulskis K, Lander E, Gabriel SB, et al. Comprehensive genomic characterization of head and neck squamous cell carcinomas. Nature 2015;517:576–82. 10.1038/NATURE14129. [DOI] [PMC free article] [PubMed] [Google Scholar]
- [11].Feldman R, Gatalica Z, Knezetic J, Reddy S, Nathan CA, Javadi N, et al. Molecular profiling of head and neck squamous cell carcinoma. Head Neck 2016;38:E1625–38. 10.1002/HED.24290. [DOI] [PMC free article] [PubMed] [Google Scholar]
- [12].De Roest RH, Mes SW, Poell JB, Brink A, Van De Wiel MA, Bloemena E, et al. Molecular characterization of locally relapsed head and neck cancer after concomitant chemoradiotherapy. Clinical Cancer Research 2019;25:7256–65. 10.1158/1078-0432.CCR-19-0628/75307/AM/MOLECULAR-CHARACTERIZATION-OF-LOCALLY-RELAPSED. [DOI] [PubMed] [Google Scholar]
- [13].Malone ER, Oliva M, Sabatini PJB, Stockley TL, Siu LL. Molecular profiling for precision cancer therapies. Genome Med 2020;12. 10.1186/S13073-019-0703-1. [DOI] [PMC free article] [PubMed] [Google Scholar]
- [14].Vermorken JB, Mesia R, Rivera F, Remenar E, Kawecki A, Rottey S, et al. Platinum-based chemotherapy plus cetuximab in head and neck cancer. N Engl J Med 2008;359:1116–27. 10.1056/NEJMOA0802656. [DOI] [PubMed] [Google Scholar]
- [15].Mountzios G, Rampias T, Psyrri A. The mutational spectrum of squamous-cell carcinoma of the head and neck: targetable genetic events and clinical impact. Ann Oncol 2014;25:1889–900. 10.1093/ANNONC/MDU143. [DOI] [PubMed] [Google Scholar]
- [16].Cox AD, Der CJ, Philips MR. Targeting RAS Membrane Association: Back to the Future for Anti-RAS Drug Discovery? Clin Cancer Res 2015;21:1819–27. 10.1158/1078-0432.CCR-14-3214. [DOI] [PMC free article] [PubMed] [Google Scholar]
- [17].Ho AL, Brana I, Haddad R, Bauman J, Bible K, Oosting S, et al. Tipifarnib in head and neck squamous cell carcinoma with HRAS mutations. Journal of Clinical Oncology 2021;39:1856–64. 10.1200/JCO.20.02903. [DOI] [PMC free article] [PubMed] [Google Scholar]
- [18].Gilardi M, Wang Z, Proietto M, Chilla A, Calleja-Valera JL, Goto Y, et al. Tipifarnib as a precision therapy for HRAS-mutant head and neck squamous cell carcinomas. Mol Cancer Ther 2020;19:1784–96. 10.1158/1535-7163.MCT-19-0958. [DOI] [PMC free article] [PubMed] [Google Scholar]
- [19].Zaitsev A, Chelushkin M, Dyikanov D, Cheremushkin I, Shpak B, Nomie K, et al. Precise reconstruction of the TME using bulk RNA-seq and a machine learning algorithm trained on artificial transcriptomes. Cancer Cell 2022;40:879–894.e16. 10.1016/J.CCELL.2022.07.006. [DOI] [PubMed] [Google Scholar]
- [20].Bagaev A, Kotlov N, Nomie K, Svekolkin V, Gafurov A, Isaeva O, et al. Conserved pan-cancer microenvironment subtypes predict response to immunotherapy. Cancer Cell 2021;39:845–865.e7. 10.1016/J.CCELL.2021.04.014. [DOI] [PubMed] [Google Scholar]
- [21].Jagadeeshan S, Prasad M, Badarni M, Ben Lulu T, Belsamma Liju V, Mathukkada S, et al. Mutated HRAS activates YAP1-AXL signaling to drive metastasis of head and neck cancer. Cancer Res 2023. 10.1158/0008-5472.CAN-22-2586. [DOI] [PMC free article] [PubMed] [Google Scholar]
- [22].Bonner JA, Harari PM, Giralt J, Azarnia N, Shin DM, Cohen RB, et al. Radiotherapy plus cetuximab for squamous-cell carcinoma of the head and neck. N Engl J Med 2006;354:567–78. 10.1056/NEJMOA053422. [DOI] [PubMed] [Google Scholar]
- [23].Bonner JA, Harari PM, Giralt J, Cohen RB, Jones CU, Sur RK, et al. Radiotherapy plus cetuximab for locoregionally advanced head and neck cancer: 5-year survival data from a phase 3 randomised trial, and relation between cetuximab-induced rash and survival. Lancet Oncol 2010;11:21–8. 10.1016/S1470-2045(09)70311-0. [DOI] [PubMed] [Google Scholar]
- [24].Whyte DB, Kirschmeier P, Hockenberry TN, Nunez-Oliva I, James L, Catino JJ, et al. K- and NRas are geranylgeranylated in cells treated with farnesyl protein transferase inhibitors. J Biol Chem 1997;272:14459–64. 10.1074/JBC.272.22.14459. [DOI] [PubMed] [Google Scholar]
- [25].Pearson AT, Vokes EE. Is This the Dawn of Precision Oncology in Head and Neck Cancer? J Clin Oncol 2021;39:1839–41. 10.1200/JCO.21.00569. [DOI] [PubMed] [Google Scholar]
- [26].Coleman N, Marcelo KL, Hopkins JF, Khan NI, Du R, Hong L, et al. HRAS Mutations Define a Distinct Subgroup in Head and Neck Squamous Cell Carcinoma. JCO Precis Oncol 2023;7:e2200211. 10.1200/PO.22.00211. [DOI] [PMC free article] [PubMed] [Google Scholar]
- [27].Li SM, Zhou J, Wang Y, Nie RC, Chen JW, Xie D. Recent Findings in the Posttranslational Modifications of PD-L1. J Oncol 2020;2020. 10.1155/2020/5497015. [DOI] [PMC free article] [PubMed] [Google Scholar]
- [28].Conroy JM, Pabla S, Nesline MK, Glenn ST, Papanicolau-Sengos A, Burgher B, et al. Next generation sequencing of PD-L1 for predicting response to immune checkpoint inhibitors. J Immunother Cancer 2019;7. 10.1186/S40425-018-0489-5. [DOI] [PMC free article] [PubMed] [Google Scholar]
- [29].Johnson DE, Burtness B, Leemans CR, Lui VWY, Bauman JE, Grandis JR. Head and neck squamous cell carcinoma. Nat Rev Dis Primers 2020;6:1–22. 10.1038/s41572-020-00224-3. [DOI] [PMC free article] [PubMed] [Google Scholar]
- [30].Jaillon S, Ponzetta A, Di Mitri D, Santoni A, Bonecchi R, Mantovani A. Neutrophil diversity and plasticity in tumour progression and therapy. Nature Reviews Cancer 2020 20:9 2020;20:485–503. 10.1038/s41568-020-0281-y. [DOI] [PubMed] [Google Scholar]
- [31].Watt S, Vasquez L, Walter K, Mann AL, Kundu K, Chen L, et al. Genetic perturbation of PU.1 binding and chromatin looping at neutrophil enhancers associates with autoimmune disease. Nat Commun 2021;12. 10.1038/S41467-021-22548-8. [DOI] [PMC free article] [PubMed] [Google Scholar]
- [32].Li Q, Chen W, Li Q, Mao J, Chen X. A novel neutrophil extracellular trap signature to predict prognosis and immunotherapy response in head and neck squamous cell carcinoma. Front Immunol 2022;13:1019967. 10.3389/FIMMU.2022.1019967/FULL. [DOI] [PMC free article] [PubMed] [Google Scholar]
- [33].Ho WJ, Yarchoan M, Hopkins A, Mehra R, Grossman S, Kang H. Association between pretreatment lymphocyte count and response to PD1 inhibitors in head and neck squamous cell carcinomas. J Immunother Cancer 2018;6. 10.1186/S40425-018-0395-X. [DOI] [PMC free article] [PubMed] [Google Scholar]
- [34].Posabella A, Köhn P, Lalos A, Wilhelm A, Mechera R, Soysal S, et al. High density of CD66b in primary high-grade ovarian cancer independently predicts response to chemotherapy. J Cancer Res Clin Oncol 2020;146:127–36. 10.1007/S00432-019-03108-6. [DOI] [PMC free article] [PubMed] [Google Scholar]
- [35].Matsumoto Y, Mabuchi S, Kozasa K, Kuroda H, Sasano T, Yokoi E, et al. The significance of tumor-associated neutrophil density in uterine cervical cancer treated with definitive radiotherapy. Gynecol Oncol 2017;145:469–75. 10.1016/J.YGYNO.2017.02.009. [DOI] [PubMed] [Google Scholar]
- [36].Javaid S, Schaefer A, Goodwin CM, Nguyen VV, Massey FL, Pierobon M, et al. Concurrent Inhibition of ERK and Farnesyltransferase Suppresses the Growth of HRAS Mutant Head and Neck Squamous Cell Carcinoma. Mol Cancer Ther 2022. 10.1158/1535-7163.MCT-21-0142. [DOI] [PMC free article] [PubMed] [Google Scholar]
- [37].Cuesta C, Arévalo-Alameda C, Castellano E. The Importance of Being PI3K in the RAS Signaling Network. Genes (Basel) 2021;12. 10.3390/GENES12071094. [DOI] [PMC free article] [PubMed] [Google Scholar]
- [38].Ihle NT, Lemos R, Wipf P, Yacoub A, Mitchell C, Siwak D, et al. Mutations in the Phosphatidylinositol-3-Kinase Pathway Predict for Antitumor Activity of the Inhibitor PX-866 whereas Oncogenic Ras Is a Dominant Predictor for Resistance. Cancer Res 2009;69:143–50. 10.1158/0008-5472.CAN-07-6656. [DOI] [PMC free article] [PubMed] [Google Scholar]
- [39].Burrows F, Malik S, Wang Z, Chan S, Gutkind S. Antitumor activity of tipifarnib and PI3K pathway inhibitors in HRAS-associated HNSCC. Https://DoiOrg/101200/JCO20203815_supplE15658 2020;38:e15658–e15658. 10.1200/JCO.2020.38.15_SUPPL.E15658. [DOI] [Google Scholar]
- [40].Smith A, Chan S, McCloskey A, Vora H, Burrows F, Malik S. Antitumor Activity of Tipifarnib and PI3K Pathway Inhibitor in HRAS-associated HNSCC. International Journal of Radiation Oncology*Biology*Physics 2022;112:e48. 10.1016/J.IJROBP.2021.12.110. [DOI] [Google Scholar]
- [41].Smith AE, Chan S, Wang Z, McCloskey A, Reilly Q, Wang JZ, et al. Tipifarnib potentiates the antitumor effects of PI3Kα inhibition in PIK3CA- and HRAS-dysregulated HNSCC via convergent inhibition of mTOR activity. Cancer Res 2023. 10.1158/0008-5472.CAN-23-0282. [DOI] [PMC free article] [PubMed] [Google Scholar]
Associated Data
This section collects any data citations, data availability statements, or supplementary materials included in this article.
Supplementary Materials
Data Availability Statement
The data generated in this study are available within the article. The data that support the findings of this study are available upon request from the corresponding author. The data were not publicly available because of information that could compromise the privacy of the research participants.