Abstract
Sustained responses to transient environmental stimuli are important for survival. The mechanisms underlying long-term adaptations to temporary shifts in abiotic factors remain incompletely understood. Here, we find that transient cold exposure leads to sustained transcriptional and metabolic adaptations in brown adipose tissue, which improve thermogenic responses to secondary cold encounter. Primary thermogenic challenge triggers the delayed induction of a lipid biosynthesis programme even after cessation of the original stimulus, which protects from subsequent exposures. Single-nucleus RNA sequencing and spatial transcriptomics reveal that this response is driven by a lipogenic subpopulation of brown adipocytes localized along the perimeter of Ucp1hi adipocytes. This lipogenic programme is associated with the production of acylcarnitines, and supplementation of acylcarnitines is sufficient to recapitulate improved secondary cold responses. Overall, our data highlight the importance of heterogenous brown adipocyte populations for ‘thermogenic memory’, which may have therapeutic implications for leveraging short-term thermogenesis to counteract obesity.
A fundamental aspect of life is the ability for enhanced responsiveness to transient but repeated environmental challenges. This can be observed in a variety of biological systems important for animal fitness, including the response of the immune system to pathogens in the form of immunological memory1,2, learning and memory in the nervous system3,4, as well as the response of tissue stem cells to repeated transient insults5–7. However, the mechanisms that underlie altered responses to transient shifts in abiotic factors such as temperature remain poorly understood.
For endothermic homeotherms such as mammals, cold temperatures have provided a powerful selective pressure for the evolution of thermoregulatory mechanisms to generate heat in dangerously cold environments. Particularly in rodents, thermogenic brown adipose tissue (BAT) plays an important role in regulating body temperature in response to cold, via an uncoupling protein 1 (UCP1)-dependent mechanism8,9. Moreover, adult humans have functional BAT, and the activity of this tissue is reduced in humans with obesity10–14, raising interest in the potential therapeutic targeting of BAT thermogenesis for reducing metabolic disease.
BAT thermogenesis is typically studied in the setting of either acute or chronic cold exposure. In their natural environment, however, mammals frequently encounter repeated intermittent periods of cold exposure. We therefore propose that studying BAT thermogenesis in the context of consecutive thermogenic responses may more closely resemble the evolutionary context upon which BAT thermoregulatory mechanisms have been selected. In addition, recurrent transient cold exposures may be a possible regimen for obesity therapy in humans15,16. Although white adipose tissue (WAT) has been shown to feature epigenetic memory17, little is known about BAT thermogenic responses to repeated transient cold challenges. In this study, we used repeated transient cold exposure to investigate mechanisms in BAT that underlie a secondary thermogenic response to acute cold.
Results
Primary and secondary thermogenic responses to acute cold
To study cold tolerance in the context of a primary and secondary thermogenic response, we designed an experimental system whereby mice were first acclimatized to thermoneutrality (30 °C) and subsequently exposed to two cycles of transient acute cold (4 °C for 8 h), interleaved with thermoneutral housing for different amounts of time (Fig. 1a). As controls, we used mice that were continuously kept at thermoneutrality (TN group) and mice that were exposed to only a single cycle of cold (1cyc group). We found that body temperature dropped quickly in the primary exposure to transient cold (Fig. 1b,c), which is in accordance with previous reports that thermoneutrality-acclimatized C57BL/6 mice fail to thrive during acute cold exposure18–20. Notably, we found that cold tolerance was substantially improved upon secondary cold challenge 4 d later (2cyc group; Fig. 1b,c). This improved secondary thermogenic response was accompanied by increased whole-body energy expenditure compared to the primary cold challenge (Extended Data Fig. 1a,b).
Fig. 1 |. Enhanced secondary thermogenic response to acute cold.
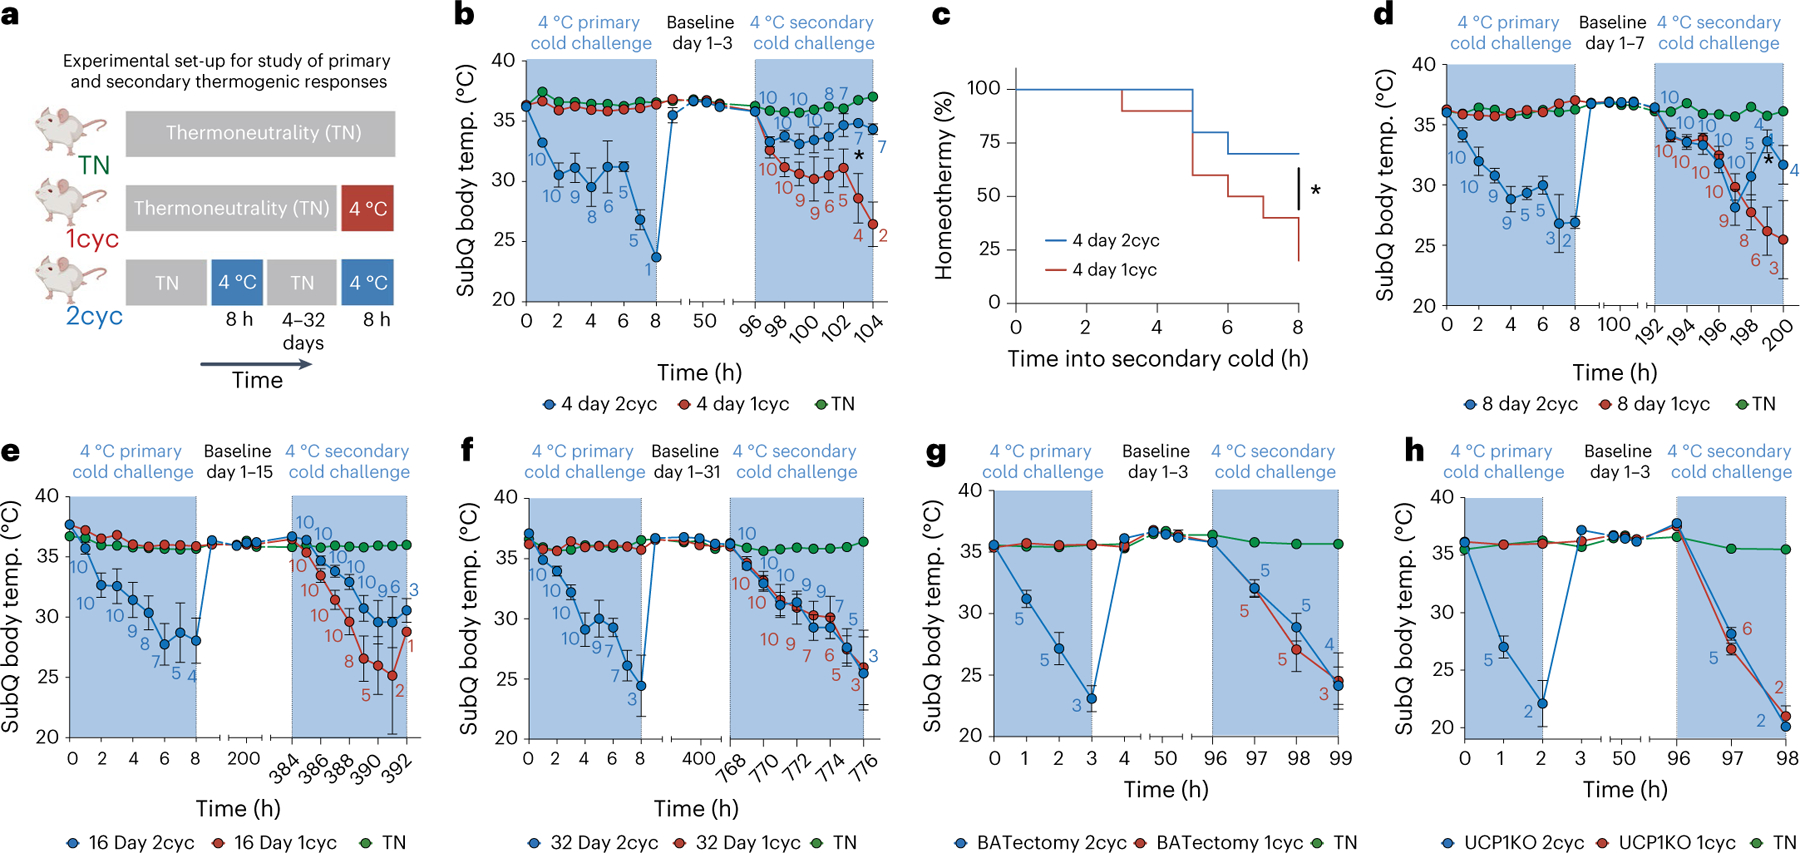
a, Schematic of experimental setup. 2cyc denotes the experimental group undergoing both a primary and secondary cold exposure. 1cyc is a cold-naïve control group for each secondary cold challenge. b–f, Effect of transient acute cold exposure on a secondary thermogenic response to acute cold following thermoneutral housing for 4 d (b and c), 8 d (d), 16 d (e) or 32 d (f) between primary and secondary acute cold exposure (n = 10 independent animals for each condition, except for thermoneutral baseline n = 5). g,h, Effect of BATectomy (g; n = 5 independent animals for each condition) and UCP1 knockout (h; n = 5 independent animals for 2cyc, n = 6 for 1cyc) on the enhanced secondary thermogenic response 4 d following a primary thermogenic response. Data in b and d–h show subcutaneous (SubQ) body temperature during cold exposure. Animals with subcutaneous body temperature below 20 °C were removed from cold. Counts indicate the numbers of animals analysed at each time point. Data in c show the percentage of animals maintaining subcutaneous body temperature above 20 °C in secondary cold challenge based on data in b. Error bars indicate means ± s.e.m. *P < 0.05.
Next, we sought to understand how long after the primary thermogenic response to acute cold we could still observe improved cold tolerance in the secondary response. Thus, we performed the same experiment but waited 8 d (Fig. 1d), 16 d (Fig. 1e) or 32 d (Fig. 1f) between the primary and secondary cold challenge. These experiments showed that a trend towards an improvement in the thermogenic response remained at day 8 and day 16; however, at day 32 following return to thermoneutrality, ‘cold-experienced’ and ‘naïve’ mice had indistinguishable responses to acute cold. We next asked whether this improved secondary thermogenic response was dependent on BAT and UCP1. To this end, we used the same experimental paradigm involving two cycles of transient acute cold 4 d apart with mice that had undergone surgical removal of interscapular BAT (BATectomy) and with UCP1-deficient mice (Fig. 1g,h). Expectedly, both BATectomized mice and UCP1-deficient mice were less cold tolerant in the primary cold challenge compared to wild-type mice8,21. Importantly, we did not find an improvement in the secondary thermogenic response relative to cold-naïve controls in either of these experiments (Fig. 1g,h), demonstrating that the enhanced secondary thermogenic response to acute cold is both BAT and UCP1 dependent. Thus, we henceforth focused on BAT to investigate the molecular, cellular and metabolic events that contribute to improved secondary thermogenic responses after transient initial cold exposure.
Transcriptional responses to primary thermogenic challenge
To explore the transcriptional correlates of post-cold protection from secondary thermogenic challenge, we performed a bulk RNA-sequencing (RNA-seq) time-course analysis of brown fat from mice exposed to acute cold followed by thermoneutral conditions (Fig. 2a). Unbiased clustering indicated a strong transcriptome-wide impact of acute cold, followed by delayed return of the transcriptome to baseline levels (Fig. 2b). This was driven by sets of genes that exhibited distinct temporal patterns: (1) acute induction, (2) acute downregulation, (3) delayed induction following return to thermoneutrality or (4) sustained induction for weeks following transient acute cold exposure (Fig. 2c). Expectedly, among the acutely induced genes, we found genes with a well-described role in thermogenesis, such as Ucp1 and Dio2 (Fig. 2d–f). Surprisingly, most prominently represented among those genes whose expression was induced only after return to thermoneutrality and was sustained even in the absence of cold temperature were genes involved in de novo lipogenesis (DNL), including Acly, Acaca, Fasn, Elovl6 and Scd1 (Fig. 2d–f). These findings indicate that the expression of lipid biosynthesis genes that has previously been observed in response to mild and chronic cold22–25 does not require continuous cold exposure but occurs even after cessation of a transient thermogenic stimulus. Indeed, when comparing differentially expressed genes between thermoneutrality and day 2 after transient cold (Fig. 2g) or day 4 after transient cold (Fig. 2h), we found genes involved in DNL were among the most upregulated genes. The delayed kinetics of Scd1 compared to Fasn may indicate further temporal regulation in lipid biosynthesis and desaturation following transient cold exposure (Fig. 2f). These transcriptional changes were specific to BAT, since we did not observe a similar induction of lipid biosynthesis genes in inguinal WAT, liver or muscle (Extended Data Fig. 2a–c). Protein levels of FASN were likewise increased in cold-experienced compared to cold-naïve mice 4 d after transient cold challenge (Extended Data Fig. 2d,e), while UCP1 protein was not (Extended Data Fig. 2f,g). Histology analysis did not reveal gross differences in BAT tissue architecture between cold-naïve and cold-experienced mice (Extended Data Fig. 2h). Overall, these data demonstrate that a primary transient thermogenic challenge leads to the delayed and tissue-specific induction of a lipid biosynthesis programme in BAT, and the expression kinetics of this programme correlate with the observed duration of the improved secondary thermogenic response (Fig. 1b–f).
Fig. 2 |. A primary thermogenic response leads to delayed induction of a lipid biosynthesis programme in brown adipose tissue independent of sustained cold exposure.
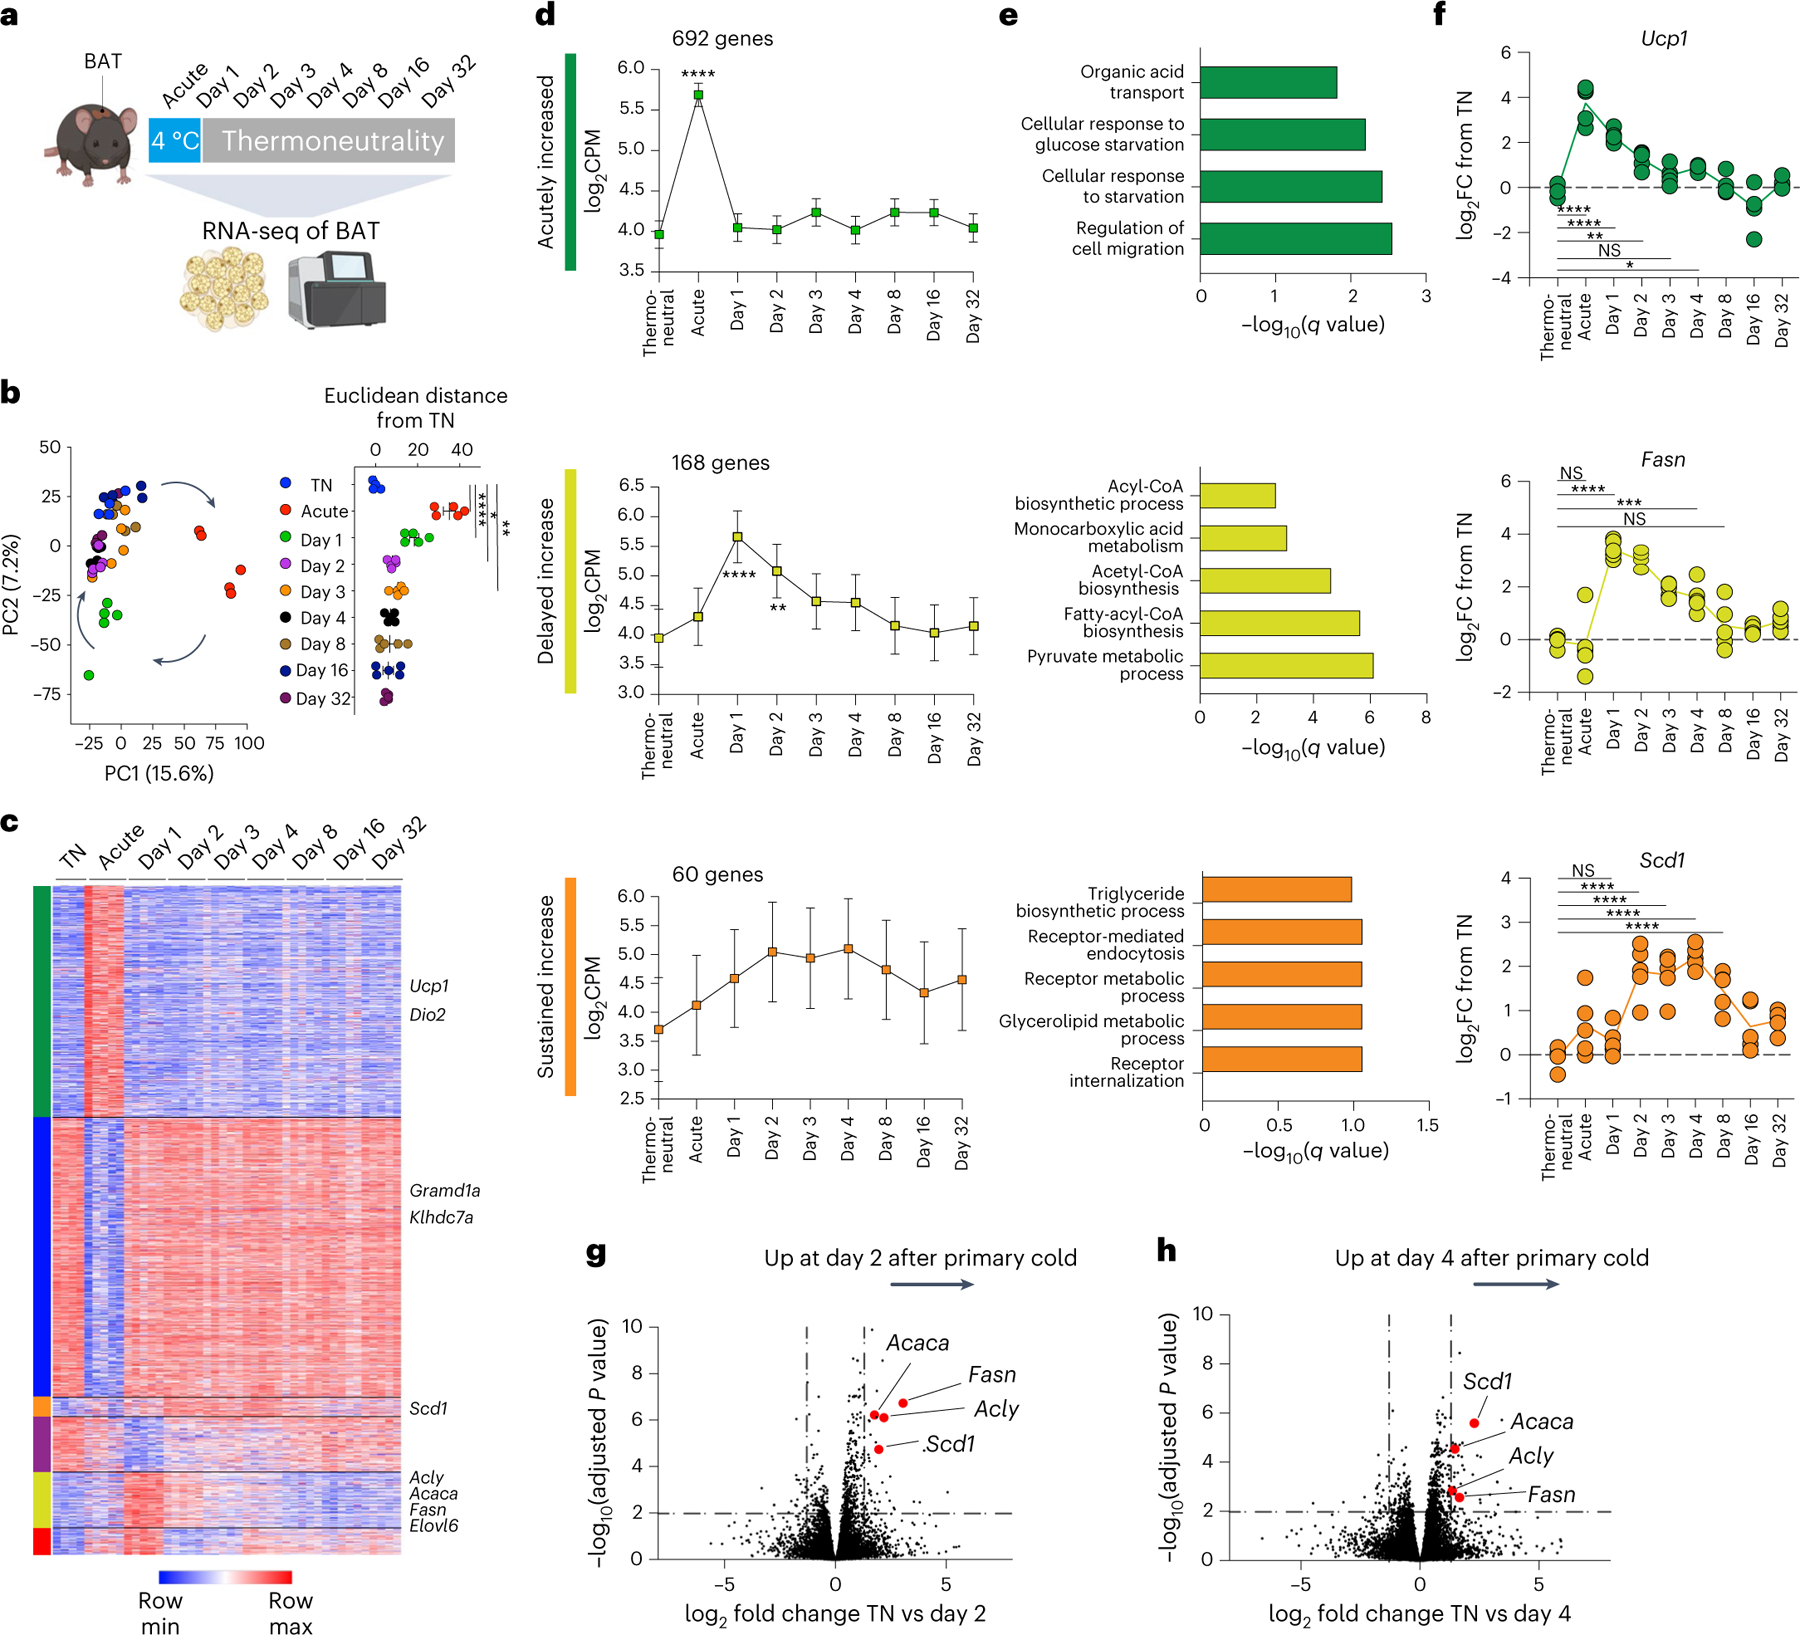
a, Experimental schematic for the transcriptional profiling of BAT in mice exposed to acute cold followed by thermoneutral conditions for different time durations including a thermoneutral baseline comparison (n = 5 independent animals for each condition, except for thermoneutral baseline n = 4). b, Principal component analysis of RNA-seq results (left) and Euclidean distances between the average of thermoneutrality samples and every other sample in unfiltered feature space (right). c,d, Heat map (c) and line graphs (d) show the log-transformed counts per million across different time points. K-means clustering was used to classify the temporal patterns of differentially expressed genes to six clusters, of which (1) acutely increased (green), (2) delayed increase (yellow) and (3) sustained increase (orange) clusters are shown. e, Gene Ontology analysis (Enrichr) for gene sets in each cluster. f, Representative differentially expressed genes from each cluster. g,h, Analysis of differentially expressed genes from specific time points relative to thermoneutrality are shown in volcano plots, with highlighted genes involved in DNL. Error bars indicate means ± s.e.m. NS, not significant; *P < 0.05; **P < 0.01; ***P < 0.001; ****P < 0.0001.
De novo lipogenesis promotes secondary thermogenesis
We next aimed to address the physiological importance of the delayed induction of lipid biosynthesis in the context of a secondary thermogenic response. To ablate lipogenesis specifically in brown adipocytes, we generated mice harbouring an inducible brown adipocyte-specific deletion of Scap (ScapΔUcp1), a key regulator of DNL26,27, which is necessary for chronic cold-induced lipogenic gene expression in BAT23. Loss of Scap in brown adipocytes ablated the transcriptional induction of Fasn and Scd1 4 d after primary cold exposure (Fig. 3a), without altering Ucp1 expression (Fig. 3b). Next, we used our experimental paradigm of secondary thermogenesis (Fig. 1a) to address the functional role of adipocyte lipogenesis. We did not find a significant difference in cold tolerance in the primary response to cold challenge in ScapΔUcp1 mice (Fig. 3c). Notably, however, the improvement in the secondary thermogenic response was dependent on Scap (Fig. 3c,d). To further corroborate the role of BAT DNL in the context of secondary thermogenic responses, we generated mice with tissue-specific ablation of Fasn in BAT (FasnΔUcp1). Again, we did not find a significant difference in cold tolerance in the primary response to cold challenge in FasnΔUcp1, but the improvement in the secondary thermogenic response was dependent on Fasn (Fig. 3e,f).
Fig. 3 |. Lipogenic brown adipocytes promote the improved secondary thermogenic response to acute cold.
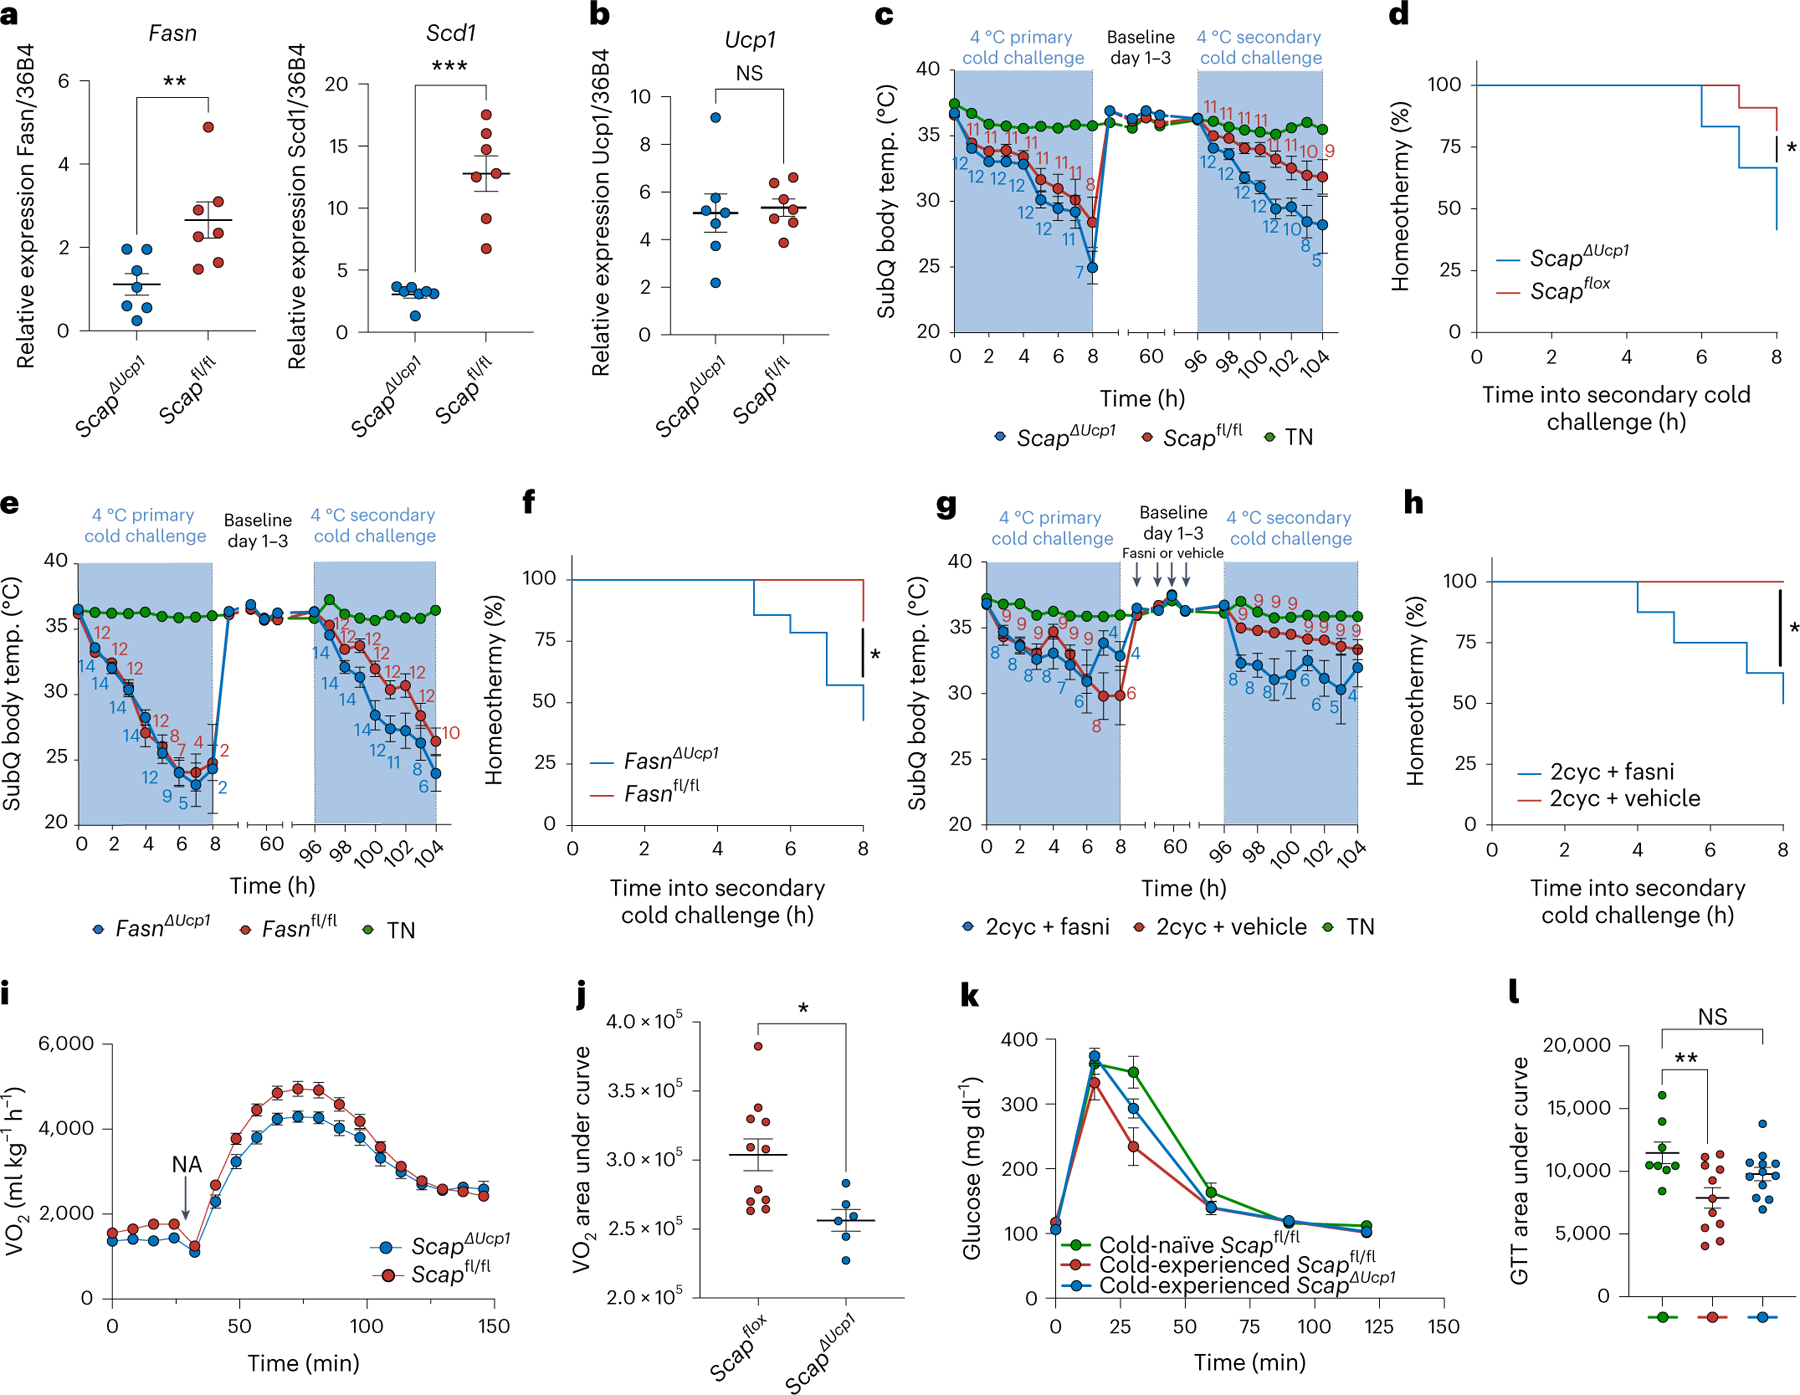
a,b, Relative gene expression of Fasn and Scd1 (a) and Ucp1 (b) in BAT from ScapΔUcp1 and Scapfl/fl mice 4 d after transient primary cold exposure (n = 7 independent animals for each condition). c,d, Effect of Scap ablation in brown adipocytes on a primary and secondary thermogenic response to acute cold interleaved with thermoneutral housing for 4 d between primary and secondary acute cold exposure (n = 12 for ScapΔUcp1, n = 11 for Scapfl/fl, n = 5 for TN). e,f, Effect of Fasn ablation in brown adipocytes on a primary and secondary thermogenic response to acute cold interleaved with thermoneutral housing for 4 d between primary and secondary acute cold exposure (n = 14 for FasnΔUcp1, n = 12 for Fasnfl/fl, n = 5 for TN). g,h, Effect of pharmacological inhibition of Fasn after a primary thermogenic response on a secondary thermogenic response to acute cold interleaved with thermoneutral housing for 4 d between primary and secondary acute cold exposure (n = 8 for 2cyc + Fasn inhibition (Fasni), n = 9 for 2cyc + vehicle, n = 4 for TN). Data in c, e and g show subcutaneous body temperature during cold exposure. Animals with subcutaneous body temperature below 20 °C were removed from cold. Counts indicate the numbers of animals analysed at each time point. Data in d, f and h show the percentage of animals maintaining subcutaneous body temperature above 20 °C in the secondary cold response. i,j, Oxygen consumption rates of anaesthetized ScapΔUcp1 (n = 6) and Scapfl/fl (n = 11) mice after injection of noradrenaline (NA) (i), with calculated area under the curve (j). k,l, Blood glucose during glucose tolerance test (GTT) of ScapΔUcp1 mice (n = 11) and Scapfl/fl mice (n = 10) 4 d after primary thermogenic challenge, including cold-naive mice housed at thermoneutrality (n = 8; k), with calculated area under the curve (l). Error bars indicate means ± s.e.m. *P < 0.05; **P < 0.01; ***P < 0.001.
The genetic deletion of Scap and Fasn did not allow us to disentangle possible differential effects of lipogenesis during the primary and secondary cold response. We therefore used a selective pharmacological inhibitor of FASN activity to block DNL specifically between the primary and secondary exposure. Similarly to the brown adipocyte-specific knockout of Scap and Fasn, we found that FASN inhibition abrogated the improvement in the secondary thermogenic response (Fig. 3g,h).
The dependency of secondary thermogenesis on brown adipocyte lipogenesis enabled us to evaluate its impact on systemic metabolism. First, we tested the contribution of Scap ablation on secondary BAT thermogenic capacity by measuring noradrenaline-induced whole-body oxygen consumption 4 d following a primary thermogenic response in ScapΔUcp1 mice. We found that ScapΔUcp1 mice showed a reduced VO2 response compared to controls (Fig. 3i,j). Moreover, we tested the contribution of Scap ablation in BAT on glucose tolerance 4 d following a primary thermogenic response. While a transient cold experience improved glucose tolerance in control mice, this was not observed in ScapΔUcp1 mice (Fig. 3k,l), highlighting the importance of sustained BAT lipogenesis for the systemic metabolic benefits of transient cold exposure. Overall, these data demonstrate the contribution of brown adipocyte lipogenesis for an improved secondary thermogenic response in mice and highlight its importance for the metabolic benefits of cold exposure even after cessation of the thermogenic stimulus.
Brown adipose tissue cellular responses to primary thermogenic challenge
Our results so far indicate temporal partitioning of thermogenic and lipogenic programming in response to transient cold exposure. To evaluate whether these gene expression patterns reflect changes in cellular composition in BAT, we adapted a single-nucleus (sn)RNA-seq protocol28–30 and profiled cold-experienced and naïve BAT from mice housed at thermoneutrality (Extended Data Fig. 3a–c). We profiled a total of 2,360 nuclei and resolved cell types based on canonical markers (Fig. 4a,b and Extended Data Fig. 4a). After sub-clustering on adipocytes only, we identified five subpopulations: A1, Slc7a10+/Cyp2e1+ adipocytes; A2, intermediate adipocytes; A3, Ucp1lo adipocytes; A4, Ucp1hi adipocytes; and A5, lipogenic brown adipocytes (Fig. 4c). When we studied the top distinguishing genes for each cluster, we found that the A1 subpopulation is the same subpopulation that was recently reported to regulate neighbouring adipocytes through acetate-mediated modulation31, with enriched expression of Slc7a10, Cyp2e1 and Aldh1a1 (Fig. 4d). The A2 subpopulation had features partially shared between the A1 and A3 subpopulations, including elevated expression of Gulp1, Slc27a1 and Negr1 (shared with A1 but not A3) as well as elevated expression of Tusc3, Prkag2 and Gnas (shared with A3 but not A1; Fig. 4d). Thus, we suggest the A2 subpopulation is an intermediate adipocyte cell state between A1 and A3. Further, the A3 and A4 subpopulations were found to be very similar, with the key difference being elevated Ucp1 and Gnas expression in A4 compared to A3 (Fig. 4d). We therefore termed the A3 subpopulation Ucp1lo brown adipocytes, and the A4 population Ucp1hi brown adipocytes. GNAS plays a well-described role in thermogenesis and UCP1 activation by elevating cAMP downstream of β-adrenergic receptor stimulation32, consistent with strong coexpression of Ucp1 and Gnas. Remarkably, the top genes distinguishing the A5 subpopulation from the other adipocyte subpopulations (A1–A4) corresponded to DNL genes Fasn, Scd1, Acaca and Acly (Fig. 4d), suggesting that lipid biosynthesis in BAT is mediated by a subpopulation of brown adipocytes. Indeed, these findings were further supported through additional analyses of differentially expressed genes between the adipocyte subpopulations, which highlighted the specific expression of lipogenesis genes in population A5 (Fig. 4e–g).
Fig. 4 |. A primary thermogenic response induces a subpopulation of lipogenic brown adipocytes.
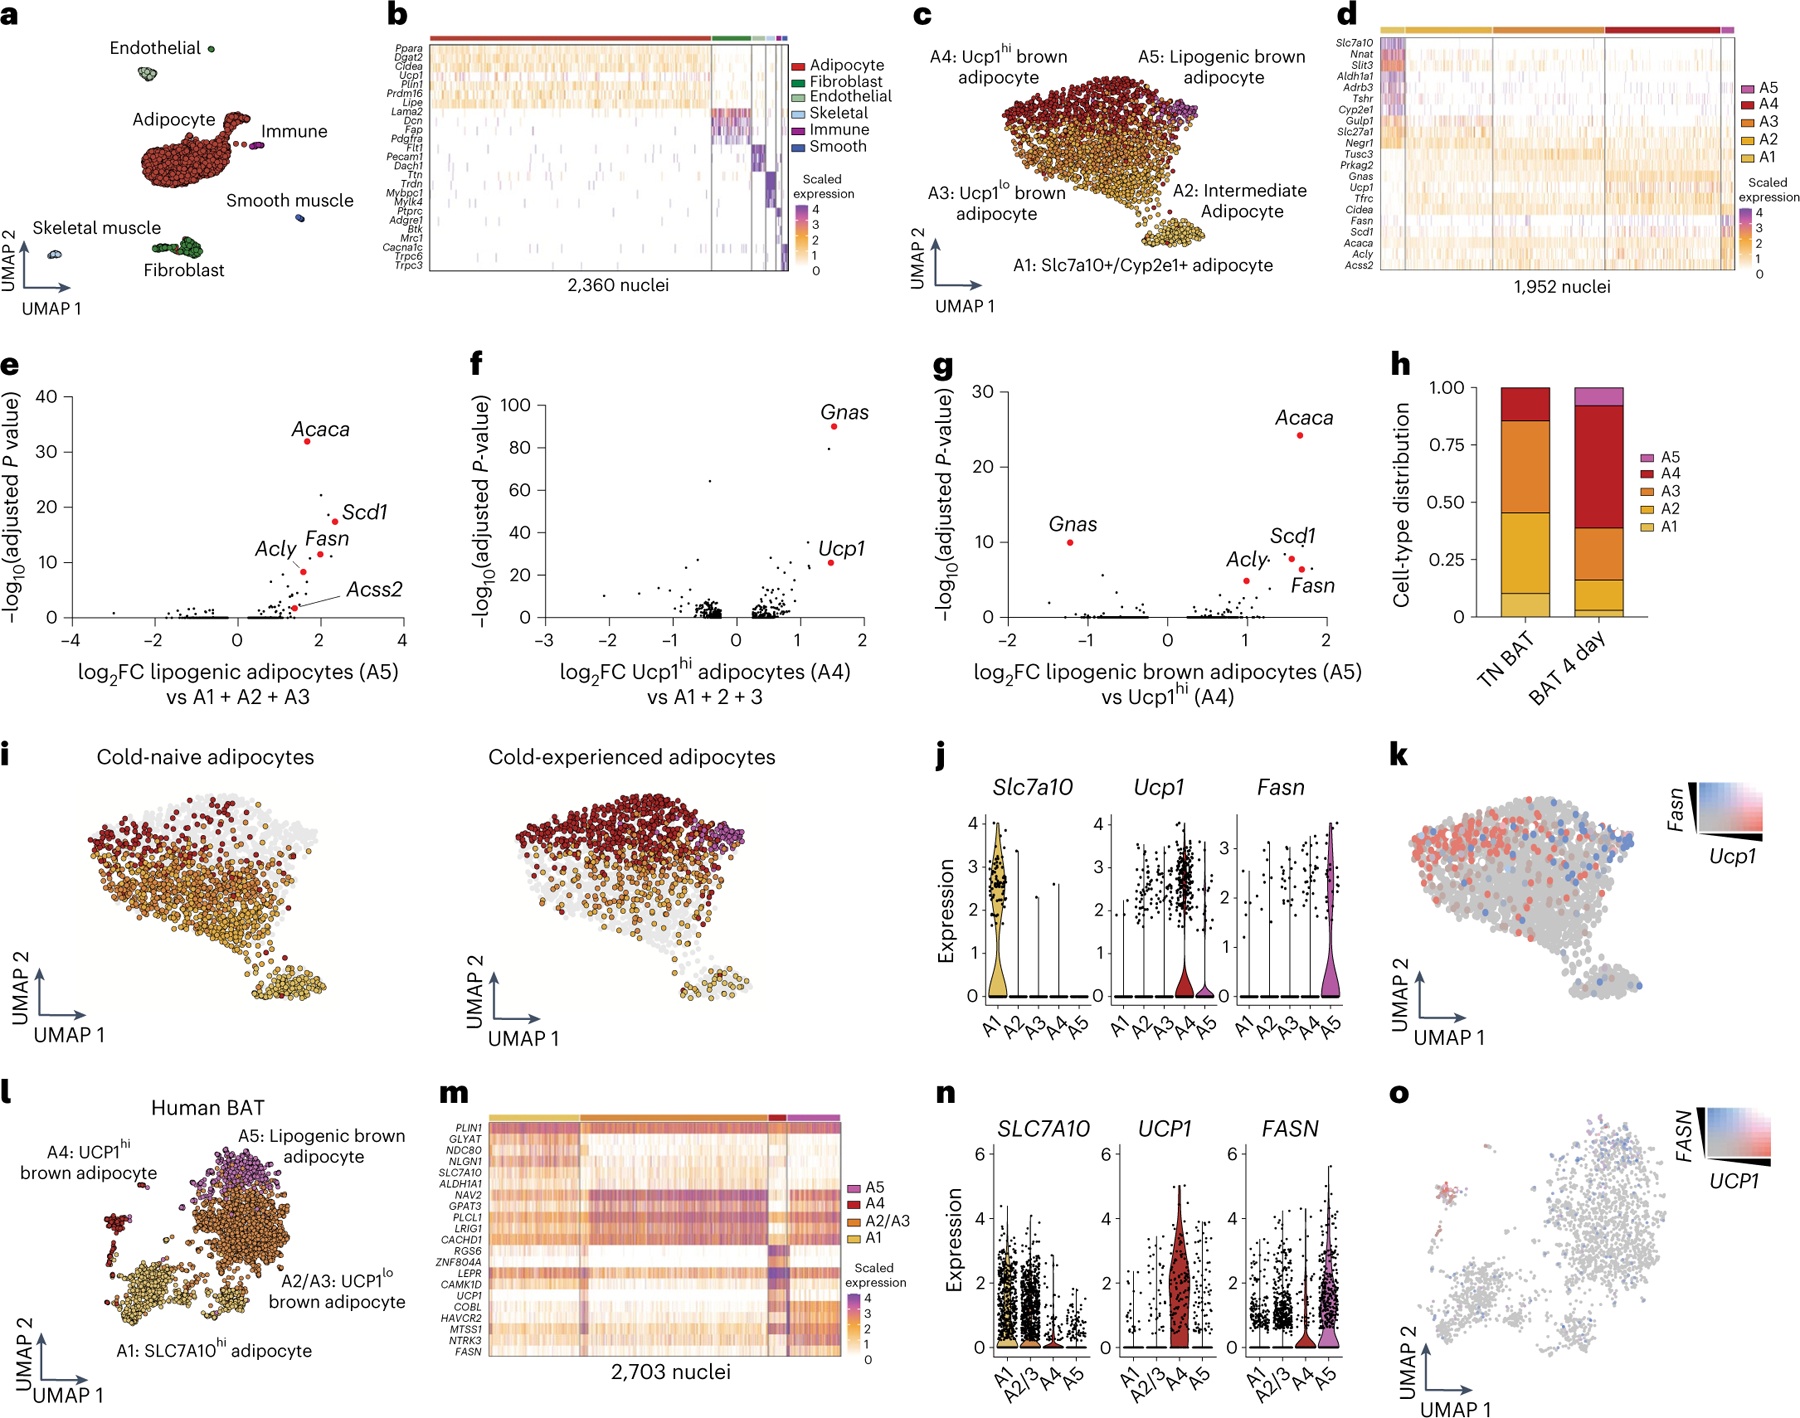
a, Uniform manifold approximation and projection (UMAP) embedding of 2,360 single nuclei isolated from BAT of cold-experienced mice and cold-naïve mice housed at thermoneutrality. Six cell types are labelled based on canonical candidate markers. b, Heat map of top genes expressed in each cell type revealed by snRNA-seq of BAT. c, Unsupervised clustering of only the adipocyte population in BAT yielded five subpopulations (A1, Slc7a10+/Cyp2e1+; A2, intermediate adipocyte; A3, Ucp1lo brown adipocyte; A4, Ucp1hi brown adipocyte; A5, lipogenic brown adipocyte) across both thermoneutral and cold-experienced conditions based on gene expression. d, Heat map of gene expression in each nucleus across the five subpopulations of adipocytes identified in BAT. e–g, Differentially expressed genes represented as volcano plots between: lipogenic brown adipocytes and subpopulations A1–A3 (e), Ucp1hi adipocytes and subpopulations A1–A3 (f) and lipogenic brown adipocytes and Ucp1hi (g). h, Cell-type distributions by adipocyte subpopulation A1–A5 in different conditions. i, UMAP plots of the adipocytes separated by cold-naïve and cold-experienced conditions. j, Violin plots for relative expression of Slc7a10, Ucp1 and Fasn across the identified subpopulations of adipocytes in mouse BAT. k, Feature plot for Fasn and Ucp1 expression within the adipocyte population. l–o, snRNA-seq of human deep-neck BAT. l, UMAP embedding and unsupervised clustering of 2,703 adipocyte nuclei from human BAT. Within the adipocyte subset, four subpopulations were identified that resembled the subpopulations identified in mouse BAT (A1, SLC7A10+; A2/A3, UCP1lo brown adipocyte; A4, UCP1hi brown adipocyte; A5, lipogenic brown adipocyte. m, Heat map with representative gene expression across the four subpopulations of adipocytes in human BAT. n, Violin plots for relative expression of SLC7A10, UCP1 and FASN across the identified subpopulations of adipocytes in human BAT. o, Feature plot for FASN and UCP1 expression within the adipocyte population from human BAT.
We then separated the adipocyte nuclei isolated from each condition (naïve and cold-experienced) (Extended Data Fig. 4b–d). Notably, the distribution of adipocyte subpopulations was dramatically different in cold-experienced BAT (Fig. 4h,i). First, the lipogenic adipocyte population (A5) was virtually absent at thermoneutrality, while being strongly expanded 4 d after transient cold exposure (Fig. 4h,i). Second, we found an expansion of the Ucp1hi adipocyte subpopulation A4 in BAT 4 d after primary thermogenic challenge (Fig. 4h,i). Third, we observed the contraction in adipocyte subpopulation A1, at day 4 after transient acute cold (Fig. 4h,i), which is in line with the previous finding that this population is expanded at thermoneutrality31. A strong inverse correlation between Fasn and Ucp1 expression in A4 and A5 adipocytes could be observed, with the lipogenic brown adipocyte subset expressing high levels of Fasn and low, albeit detectable, levels of Ucp1 (Fig. 4j,k, Extended Data Fig. 4e,f). In contrast, fatty acid oxidation genes, including Cpt2, do not appear to be transcriptionally separated between Ucp1hi and DNL subpopulations (Extended Data Fig. 4e). Taken together, these data further highlight that a primary thermogenic response to transient acute cold induces a sustained transcriptional elevation of a lipid biosynthesis programme, and additionally that this transcriptional induction is primarily mediated by a subpopulation of specialized lipogenic brown adipocytes.
To investigate whether we could identify analogous brown adipocyte subpopulations in human BAT, we turned to a human brown fat transcriptome dataset31. Following integration, adipocyte subsetting and unbiased clustering, we identified a subpopulation of lipogenic brown adipocytes based on FASN expression, largely distinct from the UCP1hi brown adipocyte subpopulation (Fig. 4l–o). These findings further support the notion that there exists a specialized lipogenic brown adipocyte cell state and additionally indicates FASN as a putative marker gene for this subpopulation that is conserved between mice and humans.
Brown adipose tissue spatial patterning after primary thermogenic challenge
Given the strong transcriptional heterogeneity in BAT after a transient cold challenge, we next determined the spatial patterning of different adipocyte subpopulations. To this end, we performed spatial transcriptomics analysis of cold-experienced and cold-naïve BAT sections at thermoneutrality (Fig. 5a, b). We applied SpaDecon33, a cell-type deconvolution method, to integrate our paired snRNA-seq with spatially resolved transcriptomics, allowing us to determine the contribution of different cell types to each capture spot and to calculate differences in cell-type distributions between the BAT tissue sections (Fig. 5a,b). We found that the average proportions of cell types across all spots closely matched the proportions we observed in our snRNA-seq data (Extended Data Fig. 5a,b). These cell-type proportion estimates were then used to calculate the cell-type level spatial correlation, defined by the Pearson correlation between the proportions of each pair of cell types across all spots in the tissue section (heat maps in Fig. 5a,b).
Fig. 5 |. Lipogenic brown adipocytes show distinct spatial tissue patterns in brown adipose tissue following a primary thermogenic response.
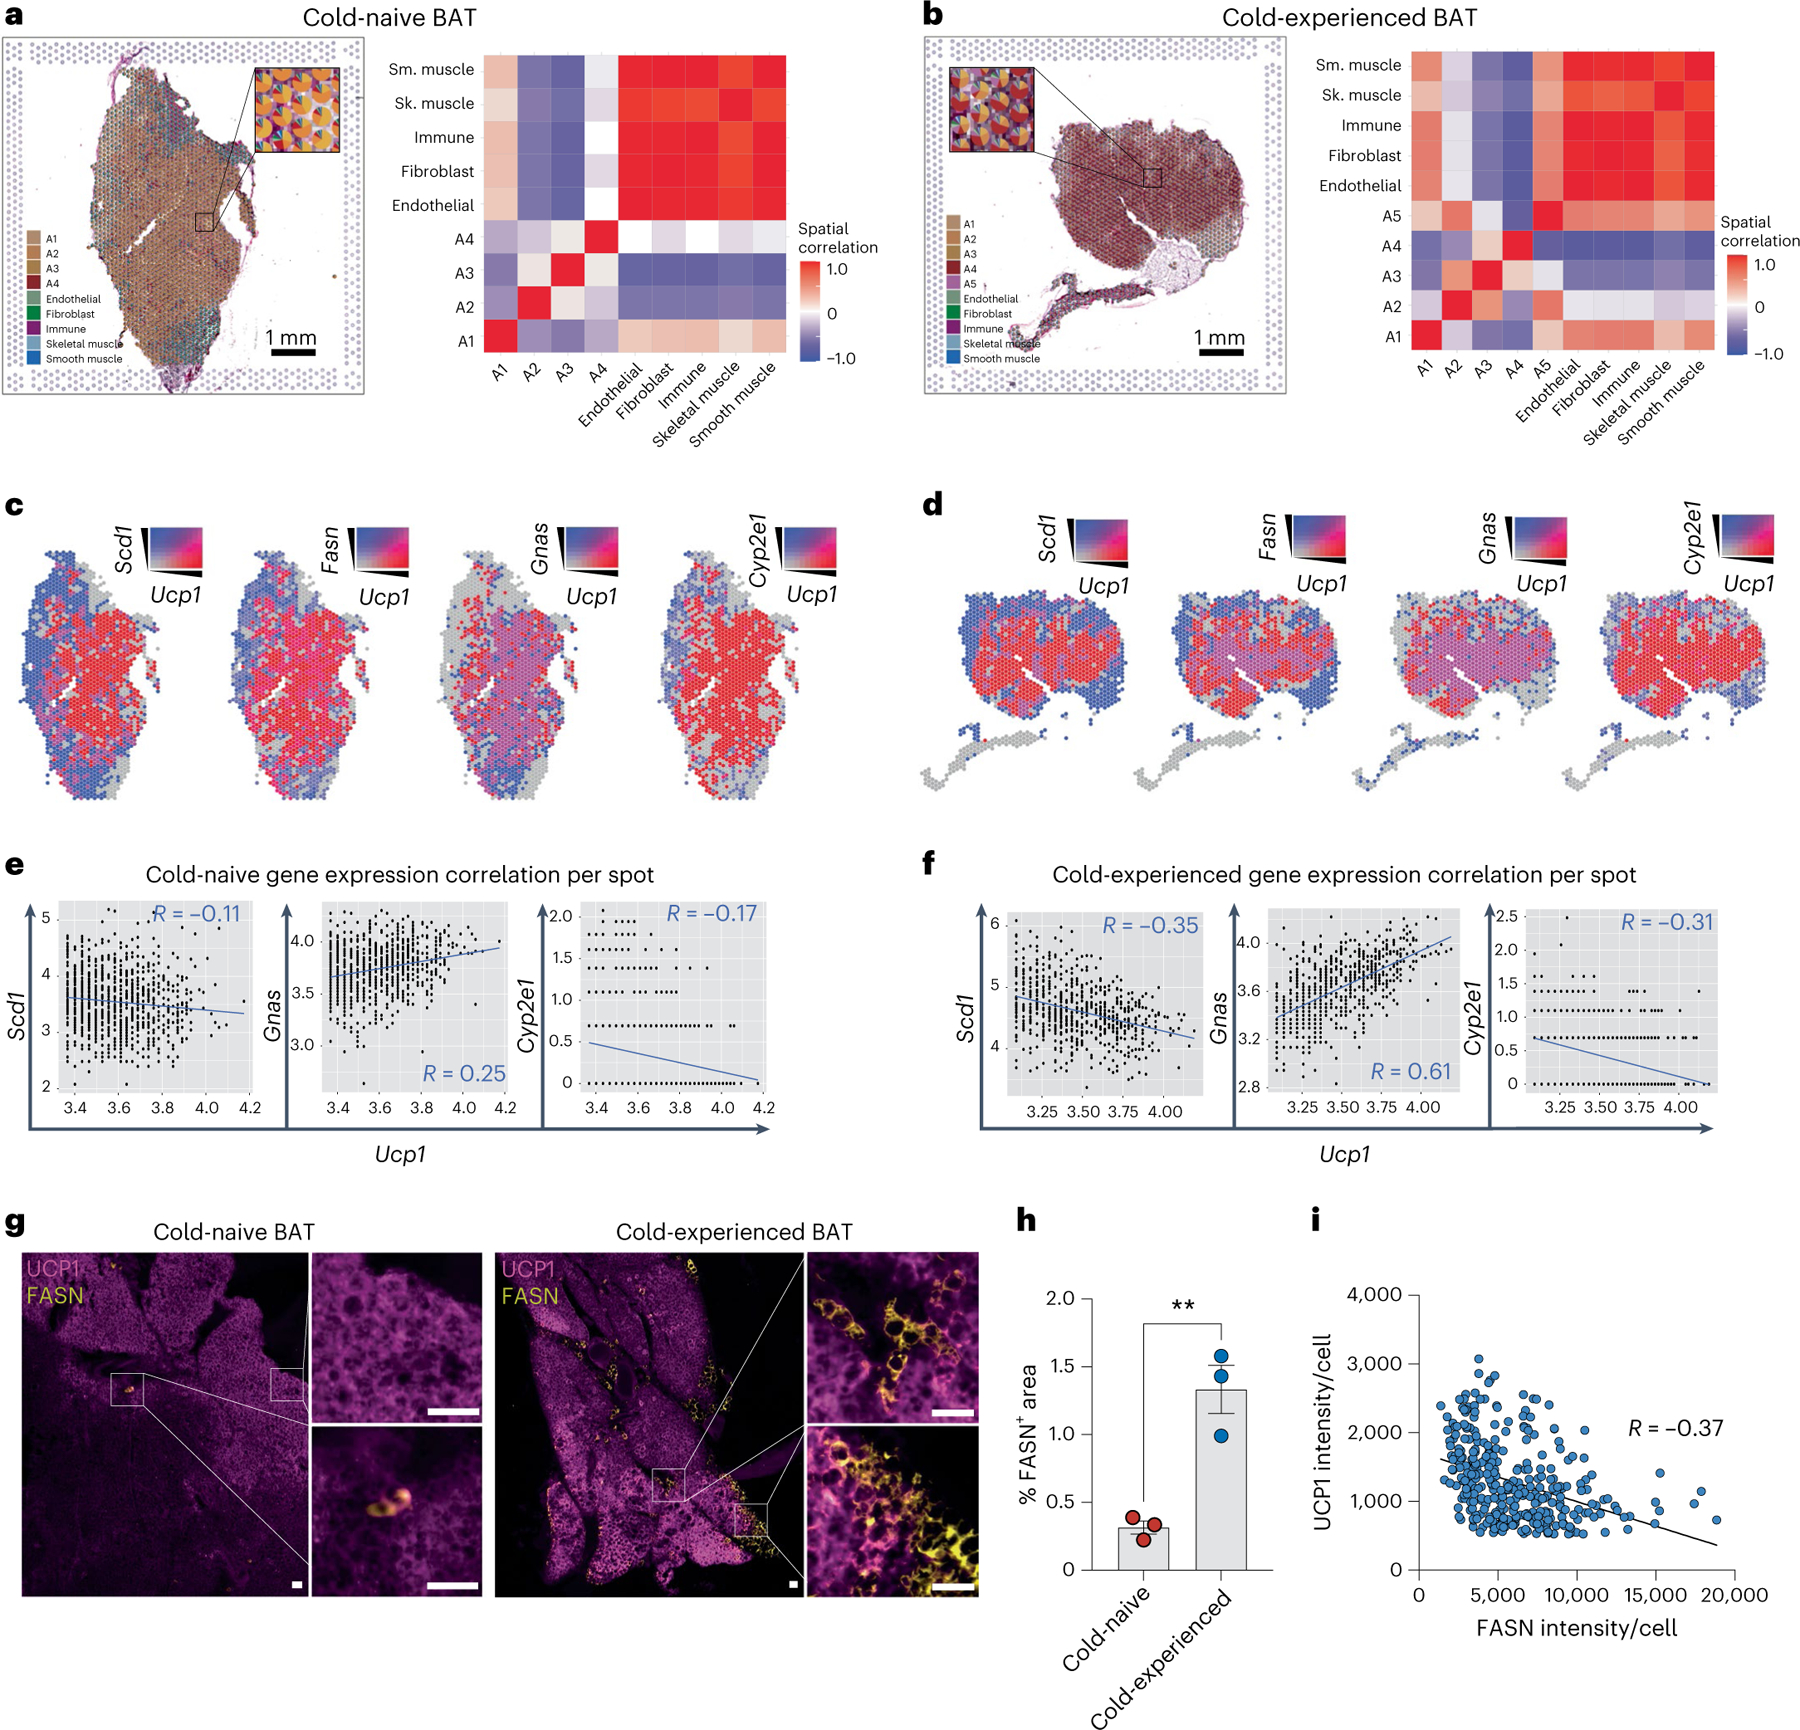
a–g, Spatial transcriptomics of BAT from cold-naïve and cold-experienced mice housed at thermoneutrality. a,b, Scatter pie plot with each spot in the cold-naïve (a) and cold-experienced (b) BAT section coloured according to the cell-type proportions estimated by SpaDecon (left); the cell-type-level spatial correlation heat map was constructed using the SpaDecon estimated cell-type proportions across all spots in the cold-naïve BAT section (right). c, Spatial feature plot of Ucp1 with Scd1, Fasn, Gnas and Cyp2e1 in the cold-naïve BAT section. d, Spatial feature plot of Ucp1 with Scd1, Fasn, Gnas and Cyp2e1 in the cold-experienced BAT section. e, Quantification of gene expression correlation between Scd1, Gnas and Cyp2e1 per spot with Ucp1 expression above the 50th percentile for the cold-naïve BAT section. f, Quantification of gene expression correlation between Scd1, Gnas and Cyp2e1 per spot with Ucp1 expression above the 50th percentile for the cold-experienced BAT section. g–i, Immunofluorescence of Ucp1 and Fasn in BAT sections of cold-naïve and cold-experienced mice. g, Representative images from each condition. Scale bar, 50 μm. h, Quantification of Fasn+ area across the two conditions (n = 3 biological replicates per condition, with 2–3 technical replicates per biological replicate). i, Quantification of UCP1 and FASN intensity in single brown adipocytes from immunofluorescence analysis of cold-experienced BAT. Error bars indicate means ± s.e.m. **P < 0.01. R values were calculated by Pearson’s correlation.
In thermoneutral conditions, we found that the Slc7a10+/Cyp2e1+ A1 adipocyte subpopulation was most strongly colocalized with non-adipocyte cells, including endothelial cells, fibroblasts, immune cells, skeletal muscle cells and smooth muscle cells (heat map in Fig. 5a). In contrast, we found that adipocyte subpopulations A2, A3 and A4 more readily spatially correlated with each other than with non-adipocytes (heat map in Fig. 5a). Additionally, non-adipocyte cells had the highest spatial correlation with each other, suggesting that adipocytes and non-adipocytes are largely separated in tissue space within thermoneutral BAT (heat map Fig. 5a). Four days after transient acute cold challenge, BAT was characterized by the appearance of the lipogenic brown adipocyte subpopulation A5 (Extended Data Fig. 5c), consistent with our snRNA-seq data. Notably, this subpopulation correlated more strongly in space with adipocyte subpopulations A1 and the non-adipocyte cell types (heat map in Fig. 5b), suggesting that the A1 and A5 adipocyte subpopulations are located in specific niches of the brown adipose depot and may be more readily responsive than other adipocyte subpopulations to paracrine or juxtacrine signals emanating from non-adipocyte cells in BAT. To assess the spatial distribution of adipocyte subpopulations A1–A5 in more detail, we turned our attention to the key marker genes Ucp1, Fasn, Scd1, Gnas and Cyp2e1 at both thermoneutrality and at day 4 after transient acute cold exposure, focusing on spots with high expression (top 50th percentile; Fig. 5c,d). Remarkably, elevated expression of Fasn and Scd1 (A5 adipocyte markers) as well as Cyp2e1 (A1 adipocyte marker) was localized in the periphery of the tissue, around a core of elevated Ucp1 and Gnas expression (A4 adipocytes), consistent with a negative gene expression correlation of Scd1 and Cyp2e1 with Ucp1 for spots with Ucp1 expression above the 50th percentile (Fig. 5c–f).
To validate these findings on the protein level, we used immunofluorescence staining of UCP1 and FASN in BAT sections from cold-experienced and cold-naïve mice. The number of FASN+ adipocytes was dramatically increased 4 d after the primary thermogenic response (Fig. 5g, h). Importantly, we confirmed a strong inverse correlation between FASN protein expression and UCP1 protein expression on the level of individual cells and found FASN+ adipocytes encircling UCP1hi adipocytes in tissue space (Fig. 5g–i), similar to what we observed in our spatial transcriptomics data (Fig. 5d). Overall, these data demonstrate the dynamic remodelling of spatial patterns in BAT following a primary thermogenic response and highlight that the lipogenic brown adipocyte cell state emerging after transient cold shows a distinct spatial pattern relative to Ucp1hi adipocytes.
Acylcarnitines contribute to secondary thermogenesis
Finally, we aimed to explore the potential downstream mechanisms of lipogenesis in BAT that contribute to an improved secondary thermogenic response. We hypothesized that the improved secondary thermogenic response could be mediated by sustained reprogramming on the level of lipid metabolites in BAT. We therefore performed untargeted lipidomics of brown fat from mice exposed to acute cold followed by thermoneutral conditions for different amounts of time (mirroring our experimental design in Fig. 2a). We focused on lipid metabolites that were elevated both acutely as well as several days to weeks following the return to thermoneutrality (Fig. 6a–c). Notably, among all lipid species we analysed, long-chain acylcarnitines remained elevated in BAT for several days (Fig. 6a,b) and returned to baseline 32 d following return to thermoneutrality (Fig. 6c). The abundance of acylcarnitines in BAT thus tracked with the ability of the tissue to initiate an improved secondary thermogenic response (Fig. 1). Indeed, on a global level, we could unbiasedly classify differentially abundant metabolites according to temporal patterns following cold exposure, including groups of molecules that were (1) acutely increased, (2) acutely decreased or (3) showed a sustained increase (Fig. 6d). As a group, the temporal behaviour of sustained increase was specific to acylcarnitines (Fig. 6e), since other main lipid metabolites, such as total free fatty acids, glycerolipids, phospholipids or sphingolipids did not show this behaviour in response to transient cold exposure (Extended Data Fig. 6a–c). We further analysed specific long-chain acylcarnitines and how their abundance changed over time in BAT following a primary cold exposure. We found that most of them were elevated acutely (as previously described34), but then remained significantly elevated, as indicated for palmitoylcarnitine (C16), palmitoleoylcarnitine (C16:1), stearoylcarnitine (C18), oleoylcarnitine (C18:1) and others (Fig. 6f).
Fig. 6 |. A primary thermogenic response results in lipogenesis-driven sustained elevation of acylcarnitines in brown adipose tissue.
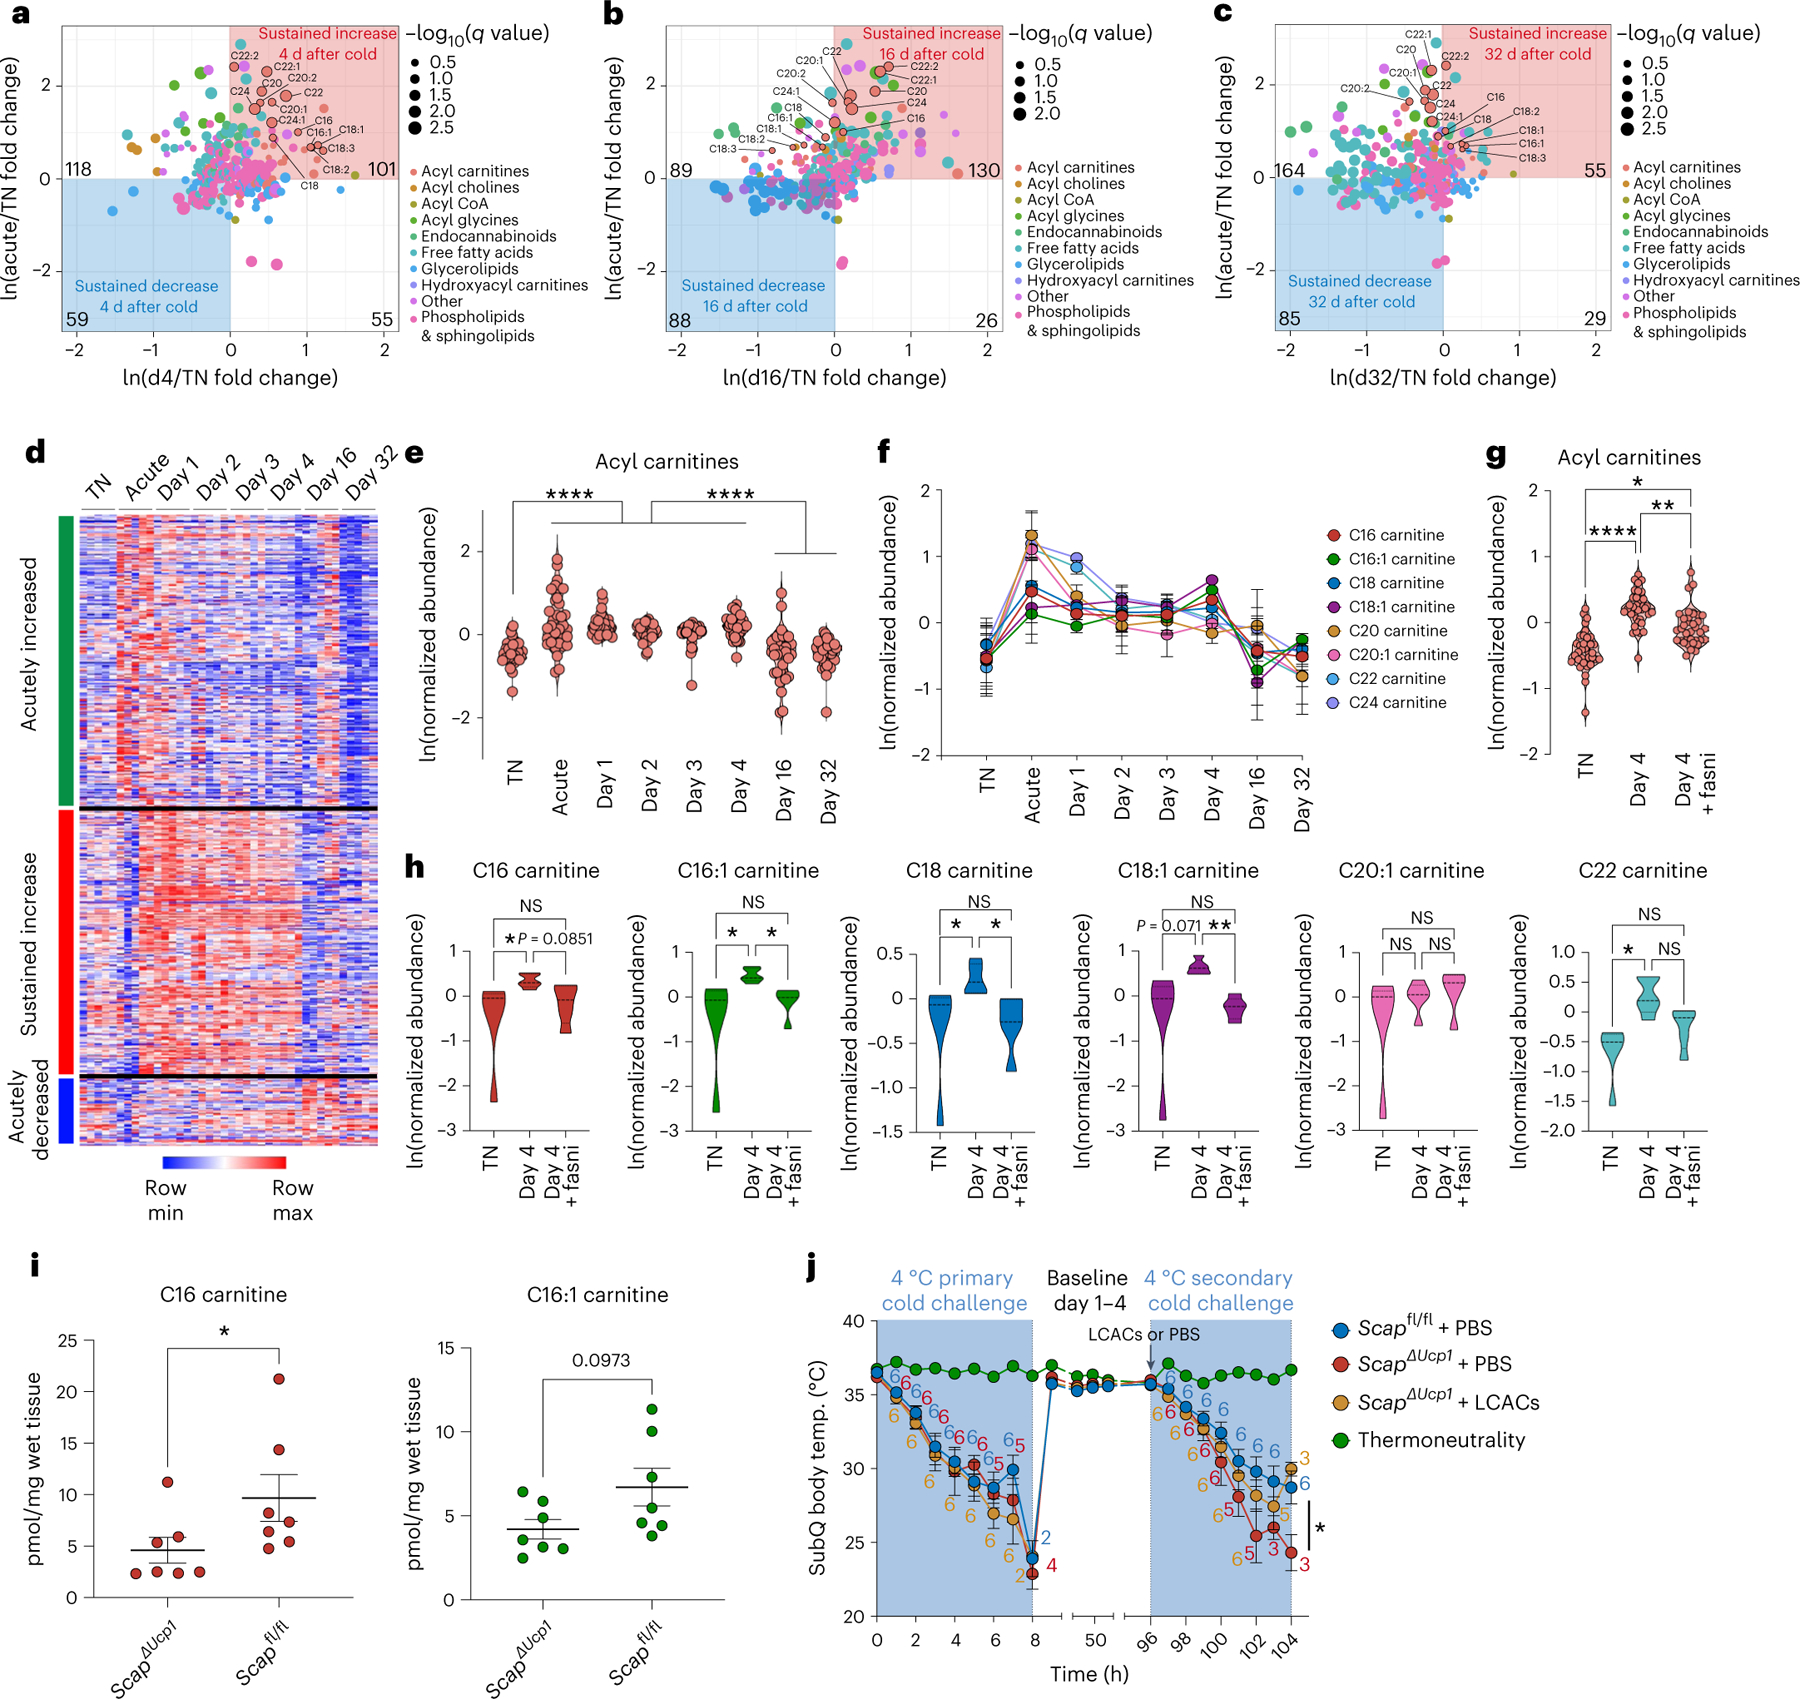
a–h, Analysis of differentially abundant metabolites in BAT by untargeted metabolomics in mice exposed to acute cold followed by thermoneutral conditions for different times, including a thermoneutral (TN) baseline comparison (n = 5 independent animals for each condition in a–h). a, Comparison of relative abundances of lipid metabolites in acutely cold-exposed BAT (acute), day 4 after transient cold BAT (d4) and TN BAT. b, Comparison of relative abundances of lipid metabolites in acute BAT, day 16 after transient cold BAT (d16) and TN BAT. c, Comparison of relative abundances of lipid metabolites in acute BAT, day 32 after transient cold BAT (d32) and TN BAT. For a–c, the dot size reflects the −log10(q value) of the most significant comparison of d4/TN and acute/TN for the given metabolite. Colours of dot reflects type of lipid metabolite. Long-chain acylcarnitines (LCACs) are highlighted. d, Heat map depicting temporal patterns of relative metabolite abundances in BAT following cold challenge. e, Relative abundance of acylcarnitine species in BAT in different experimental conditions. Each data point represents the average value across replicates for each acylcarnitine species. f, Plot of average abundance of indicated LCACs in BAT from different experimental conditions. g, Comparison of total acylcarnitine species in BAT between TN, day 4 and day 4 with Fasni. Each data point represents one species. h, Comparison of indicated LCACs in BAT between TN, day 4 and day 4 with Fasni. i, Absolute measurements of C16 carnitine and C16:1 carnitine in BAT in ScapΔUcp1 mice (n = 7) versus Scapfl/fl mice (n = 7) 4 d following primary thermogenic challenge. j, Subcutaneous body temperature during primary and secondary cold exposure of ScapΔUcp1 mice treated with PBS or LCACs at the start of secondary cold exposure, including Scapfl/fl mice treated with PBS (n = 6 independent animals for each condition). Error bars indicate means ± s.e.m. *P < 0.05; **P < 0.01; ****P < 0.0001.
Given the importance of the DNL pathway in mediating the enhanced thermogenic capacity of cold-experienced mice, we determined whether the post-cold increase in acylcarnitines was dependent on SCAP and FASN. Indeed, pharmacological inhibition of FASN blunted the elevation of acylcarnitines 4 d after primary cold exposure (Fig. 6g,h), while free fatty acids were elevated, and other metabolites remained unaffected (Extended Data Fig. 6d). Given that the systemic administration of a pharmacological FASN inhibitor may affect BAT acylcarnitine levels indirectly, we also measured acylcarnitine levels in ScapΔUcp1 mice, in which only BAT-intrinsic lipogenesis is affected. Indeed, we found a significant decrease in C16 carnitine in ScapΔUcp1 mice 4 d after primary cold challenge, with a similar trend for C16:1 carnitine (Fig. 6i). Of note, we found no difference in the expression of genes involved in acylcarnitine transport or fatty acid oxidation in Scap-deficient BAT 4 d after primary cold exposure, including carnitine-acylcarnitine translocase (Slc25a20/Cact), long-chain acyl-CoA dehydrogenase (Acadl/Lcad) and medium-chain acyl-CoA dehydrogenase (Acadm/Mcad; Extended Data Fig. 7a–c).
Based on these findings, we set out to determine whether acylcarnitines induced by primary cold exposure were sufficient to enhance the secondary thermogenic response. To this end, we supplemented a mixture of C16 carnitine, C16:1 carnitine and C18:1 carnitine to ScapΔUcp1 mice at the start of the secondary cold exposure and determined their level of cold tolerance in the secondary thermogenic response. Notably, while the primary thermogenic response was unaffected, acylcarnitine supplementation partially restored the secondary thermogenic response in ScapΔUcp1 mice (Fig. 6j). Overall, these data demonstrate that BAT-intrinsic lipogenesis promotes the sustained elevation of acylcarnitines following transient cold exposure, which drives a prolonged improvement in secondary responses.
Discussion
In this study, we defined the transcriptional, cellular, metabolomic and spatial tissue dynamics of BAT following a primary thermogenic challenge. We discovered that a lipid biosynthesis transcriptional programme is induced in a subpopulation of brown adipocytes even after cessation of the primary cold stimulus. Further, we revealed the physiological relevance of this subpopulation of lipogenic brown adipocytes in the context of a secondary cold exposure in mice and found that BAT-intrinsic lipogenesis promotes elevated acylcarnitine levels in this tissue, which in turn contributes to improved cold tolerance.
The induction of DNL in BAT by both mild and chronic cold has previously been reported by several groups throughout the years22–25,35–37. Indeed, the regulation of DNL in BAT has been extensively studied and includes AKT2-mediated stimulation of ChREBPβ transcriptional activity22, SCAP-mediated processing of SREBP1 (ref. 23), thyroid hormone38–41, REV-ERBα/β-mediated circadian repression of SREBP1 and DNL23 and potentially lipolysis-derived fatty acids agonizing peroxisome proliferator-activated receptors24. In addition, the contribution of specific enzymes in the DNL pathway to thermogenesis has also been investigated including the study of ELOVL6 (ref. 42), ELOVL3 (ref. 43), FASN44–46 and SCD1 (ref. 47). Overall, these studies support the argument that DNL in BAT is important to maximize thermogenesis22,23,42,47. However, a paradox that has been noted decades ago is how the process of DNL is compatible with the importance of fatty acid oxidation for thermogenesis22–25, given that malonyl-CoA, which is an intermediate in DNL and substrate for FASN, directly inhibits the enzyme CPT1, which is responsible for the generation of acylcarnitines and thus the transport of long-chain fatty acids into mitochondria for beta-oxidation48,49. To illustrate this paradox, we found that BAT-intrinsic lipogenesis promotes a sustained elevation of long-chain acylcarnitines within BAT. A limitation of our study is that we did not include quantification of DNL by isotope tracing to conclusively demonstrate that the fatty acids generated through BAT-intrinsic lipogenesis are converted to long-chain acylcarnitines. However, this argument is supported by a recent isotope tracing study that found cold-adapted BAT rapidly synthesizes fatty acids through DNL for acylcarnitine production50.
Several attempts have been made to reconcile the seemingly counterintuitive simultaneous induction of fatty acid oxidation and DNL in BAT. One hypothesis has been that heterogeneity at the level of mitochondria51,52 in brown adipocytes facilitates parallel lipid anabolism and lipid catabolism in the same cell53. Our study provides several additional possible solutions to this paradox: First, we have documented different kinetics and differential stimulus dependency of acute thermogenesis and lipogenesis in BAT, with a rapid and transient acute thermogenic transcriptional response being followed by a delayed but more durable transcriptional induction of DNL. Second, our findings based on snRNA-seq suggest that a distinct subpopulation of adipocytes is responsible for DNL. Third, using spatial transcriptomics and immunofluorescence, we find that the different subpopulations of adipocytes preferentially occupy different locations in the tissue. Together, these findings highlight the compartmentalization for the processes of acute thermogenesis and lipid biosynthesis in time and space that facilitates division of labour. A limitation of our study is that we were not able to detect Cpt1b, the primary isoform of CPT1 in BAT, in our snRNA-seq experiment. Therefore, we could not interrogate whether Cpt1b and DNL genes are transcriptionally separated into different adipocyte subpopulations in our snRNA-seq data. Cpt2 transcript does not appear to be transcriptionally separated between Ucp1hi and DNL subpopulations (Extended Data Fig. 4e). Because malonyl-CoA directly inhibits CPT1 on the protein level48,49, we hypothesize that fatty acid oxidation may be inhibited in brown adipocytes with very active DNL even without transcriptional downregulation of fatty acid oxidation. Further work will be required to clarify the spatial regulation of DNL, fatty acid oxidation and mitochondrial uncoupling in BAT on the protein level, given the known post-translational regulation of these processes as highlighted for malonyl-CoA inhibiting CPT1, but also UCP1 requiring the presence of long-chain fatty acids for full activation54.
Interestingly, it has recently been reported that a subpopulation of lipogenic adipocytes also exists in epididymal WAT of mice, which is lost in high-fat-diet-induced obesity55. Moreover, heterogeneity of beige adipocytes in inguinal WAT for FASN expression has been described56. Overall, these findings suggest that lipogenesis may denote a specialized adipocyte cell state across several adipose depots. Further work will be required to understand the shared and distinct roles of lipogenic and possibly additional adipocyte subpopulations and their contribution to systemic metabolic homeostasis.
Beyond the question of compartmentalization of adipocyte biology, our findings provide evidence of ‘memory-like’ behaviour in adipose tissue. Recent studies have found examples of memory features outside the immune and nervous system, with diverse cell types, including epithelial cells and stem cells, harbouring information in response to a primary stimulus that enables faster and more effective recall responses5–7. Our findings, along with others17, extend this concept by indicating that adipocytes may have similar capabilities facilitating the anticipation of recurrent environmental conditions, and that these properties play an important role in protecting the body against recurrent episodes of low environmental temperature.
Finally, the findings described in this study may have important implications for the design of thermogenic challenges as therapies. The discovery of BAT in humans has sparked the hope that its stimulation may be useful to counteract the hypercaloric state of obesity and its associated comorbidities10–14. Short-term bouts of thermogenic challenges might be the most practical implementation of this therapeutic strategy15,16. Our study suggests BAT-intrinsic kinetics of DNL will inform the development of optimal cold challenge-based therapies.
Methods
Mice
Animals were obtained from The Jackson Laboratory and housed at the ULAR facility of the University of Pennsylvania. Mice were kept under strict light–dark cycles, with lights on at 7:00 and off at 19:00, and free access to food (LabDiet, 5010) and water. Mice were housed at 22.2 °C and 52.1% humidity. Both male and female mice were used for experiments. All experiments used co-housed littermates to ensure common microbiota and genetic background. Animal numbers refer to biologically independent replicates. For primary and secondary cold exposure experiments, 6- to 8-week-old male C57BL/6J mice (range indicates inter-experimental variability) were allowed to acclimatize to thermoneutrality (30 °C) for 2–3 weeks (range indicates inter-experimental variability) before primary cold exposure at 4 °C for 8 h and subsequently moved to 30 °C for the indicated length of time until secondary cold exposure or tissue collection. During the primary and secondary cold exposures, mice were single housed. Subcutaneous body temperature was measured using subcutaneous temperature implants (IPTT-300, Biomedic Data Systems) inserted at the midline in the interscapular region under anaesthesia, at least 1 week before the start of the experiment to allow mice to recover. Measurements were taken with the non-contact DAS-8007-C Wireless IPT/IPTT Reader.
Scapfl/fl mice were bred to Ucp1-CreER mice on a C57BL/6J background (kindly provided by M. Lazar, University of Pennsylvania23 with generous permission from C. Wolfrum, ETH Zürich57). To induce the activity of the Ucp1-CreER, 6-week-old mice were injected intraperitoneally for 5 d with 1.5 mg per mouse per day of tamoxifen dissolved in corn oil while mice were housed at room temperature (22 °C). Tamoxifen was also injected at the end of the primary cold exposure. Both ScapΔUcp1 and Scapfl/fl mice (control) were injected with tamoxifen. Fasnfl/fl mice were kindly shared with us by C. Semenkovich44–46, and crossed to Ucp1-Cre mice58 (The Jackson Laboratory, B6.FVB-Tg(Ucp1-cre)1Evdr/J, strain 024670). Both FasnΔUcp1 and ScapΔUcp1 mice were bred at room temperature and acclimatized to thermoneutrality for 2–3 weeks before primary cold exposure. Ucp1−/+ mice maintained on a C57BL/6J background (The Jackson Laboratory, B6.129-Ucp1tm1Kz/J, strain 003124) were used to generate Ucp1-knockout mice. For FASN inhibition experiments, Fasnall59 or vehicle was injected at a dose of 15 mg per kg body weight per day starting at the end of the primary cold exposure.
Surgical removal of BAT was applied as previously described60–62 to 10-week-old male mice, housed at thermoneutrality for 3 weeks before surgery. A 1.5-cm incision was made to expose the intrascapular fat pads following intraperitoneal injection of ketamine–xylazine. Two lobes of darkly coloured BAT were completely removed with little bleeding. Heat mats were applied to keep all animals warm during and after surgery until consciousness was fully recovered. Then mice were kept at thermoneutrality for 1 week to recover before testing the improved secondary thermogenic response to acute cold. The absence of BAT was qualitatively confirmed at the end of the experiment.
For long-chain acylcarnitine administration, this was performed similarly as has previously been described34. In brief, 200 μl of a mixture of C16 carnitine (palmitoylcarnitine), C16:1 carnitine (palmitoleoylcarnitine) and C18:1 (oleoylcarnitine) at 100 μM was injected retro-orbitally. Vehicle control was PBS. Immediately following administration of metabolites, mice were exposed to secondary cold exposure.
All experiments were performed in accordance with PennULAR guidelines and approved by the local Institutional Animal Care and Use Committee.
Whole-animal oxygen consumption rate in response to noradrenaline
Oxygen consumption rates of mice were measured using Comprehensive Laboratory Animal Monitoring System (CLAMS, Columbus Instruments) metabolic cages housed within environment-controlled rodent incubators. Following previously described protocols20,63, mice were anaesthetized with ketamine–xylazine injection and placed into CLAMS cages pre-acclimatized to 33 °C to maintain mouse body temperature while under anaesthesia. Before noradrenaline-induced oxygen consumption readings, baseline oxygen consumption measurements were recorded for several cycles until stable readings were recorded. A subcutaneous injection of 1 mg per kg body weight L-(−)-noradrenaline (+)-bitartrate salt monohydrate (Sigma, A9512) dissolved in sterile 0.9% sodium chloride (Sigma, S8776) was given. After injection, individual mice were immediately placed into the CLAMS cages and oxygen consumption rates were recorded.
In vivo metabolic phenotyping
Whole-body energy metabolism was evaluated using a CLAMS, as previously described63. In brief, mice were singly housed and acclimatized in metabolic chambers for 48 h before data collection with temperature set at thermoneutrality (30 °C). Each mouse was continuously monitored for physical activity and food intake (paired analysis). CO2/O2 levels were collected four or five times per hour per mouse over the duration of the experiment. After allowing mice to acclimatize for 48 h at thermoneutrality, the CLAMS was set to 4 °C for 8 h starting at 9:00. After 8-h cold exposure, the CLAMS was set back to thermoneutrality until the secondary cold exposure 4 d later starting at 9:00.
Glucose tolerance test
Glucose tolerance test was performed as previously described64. In brief, mice were fasted for 7–8 h starting at 9:00, and injected intraperitoneally with 10 μl per gram body weight of a 20% wt/vol dextrose solution. Blood glucose levels were measured from the blood collected from the tail at 0, 15, 30, 60, 90 and 120 min after dextrose challenge.
Bulk transcriptional profiling by RNA-seq
Libraries were prepared using the Illumina TruSeq stranded mRNA kit with Illumina TruSeq unique dual indices according to the manufacturer’s instructions. Quality and quantity control of RNA and libraries were performed using an Agilent 4200 TapeStation and Qubit 4, respectively. Libraries were sequenced on an Illumina NextSeq instrument to produce 75-bp single-end reads. Raw reads were mapped to the mouse reference transcriptome (Ensembl; Mus musculus version 79) using Kallisto (version 0.46.2)65. Subsequent analysis was carried out using the statistical computing environment R (version 4.1.1)66 in RStudio (version 1.4.1717) and Bioconductor (version 3.13)67. Briefly, transcript quantification data were summarized to genes using the tximport package68 and normalized using the trimmed mean of M values method in edgeR69. Genes with <1 count per million in n + 1 of the samples, where n is the size of the smallest group of replicates, were filtered out. Normalized filtered data were variance stabilized using the voom function in limma70, and differentially expressed genes were identified with linear modelling using limma (false discovery rate ≤ 0.01; absolute log fold change ≥ 1) after correcting for multiple testing using Benjamini–Hochberg. Gene Ontology analysis was carried out using Enrichr71–73 and biological process terms.
Quantitative real-time PCR
From extracted RNA, cDNA was prepared by using 2,000 ng per 10 μl of RNA input using the High-Capacity cDNA Reverse Transcription kit (Applied Biosystems, 43-688-13). Gene expression was then assessed using the Luna Universal qPCR Master Mix kit (NEB, M3003E) following the manufacturer’s instructions. Primer sequences are listed in Supplementary Table 1.
Protein extraction and western blotting
BAT samples were homogenized in RIPA buffer (Thermo Fisher Scientific) supplemented with protease inhibitor cocktails (Pierce Protease and Phosphatase Inhibitor Mini Tablets, EDTA-Free) using a Tissue-Lyser (Qiagen) for 5 min at a frequency of 30 s−1. The protein samples were validated using BCA assay Kit (Thermo Fisher Scientific), then denatured at 95 °C for 10 min in loading buffer. SDS–PAGE was performed using 50 μg of protein loaded onto a 6% or 15% Tris-glycine gel (6% for FASN; 15% for UCP1; Invitrogen) followed by transfer to a 0.45 μg nitrocellulose membrane (Bio-Rad). The blot was blocked with 5% non-fat dry milk in 1× TBST for 2 h at room temperature. Primary antibodies were incubated overnight at 4 °C and were as follows: UCP1 (1:1,000 dilution, R&D Systems, MAP6158); FASN (1:1,000 dilution, Cell Signaling Technology, 3189); vinculin (1:1,000 dilution, Cell Signaling Technology, 1390) and anti-alpha tubulin (1:1,000 dilution, DSHB, 12G10). The blot was washed and incubated with horseradish peroxidase-conjugated anti-rabbit immunoglobulin G (1:2,000 dilution, Cell Signaling Technology, 7074) or anti-mouse immunoglobulin G (1:2,000 dilution, Cell Signaling Technology, 7076) at room temperature for 1 h. Signals were developed using Amersham ECL Western Blotting Detection Reagent (Cytiva) and bands were analysed with ImageJ software.
Single-nucleus RNA sequencing of brown adipose tissue
BAT was collected from five mice at thermoneutrality and five mice that had undergone transient acute cold exposure 4 d previously. Nuclei isolation was then performed as previously described28–30. Nuclei from the five mice for each condition were pooled. Sorted nuclei were then immediately encapsulated into droplets, libraries prepared using the 10x Genomics platform, and sequencing was performed on the NextSeq 550 instrument using a 150-cycle kit. BCL files were demultiplexed, aligned to mouse mm10 genome, filtered, and unique molecular identifiers were counted using Cell Ranger (10x Genomics), and downstream analysis performed with Seurat (v4)74. Data were filtered to remove cells with high mitochondrial reads (>5%), low gene detection (<200) and high gene detection (>2,000). In total, 2,360 nuclei passed these filtration parameters. Normalization was performed with SCTransform75. Subsequently, cells were clustered using Louvain clustering, and UMAP was used for visualization. Clusters were annotated according to canonical markers. Differential gene expression between clusters was performed using the MAST test76.
For snRNA-seq analysis of human BAT, a recently published publicly available dataset was used31 (E-MTAB-8564). Analysis was performed with Seurat (v4)74. Data were filtered to remove cells with high mitochondrial reads (>5%), low gene detection (<200) and high gene detection (>5,000). Normalization was performed with SCTransform75 and integrated74. Subsequently, cells were clustered using Louvain clustering (resolution of 0.5), and UMAP was used for visualization (assay = ‘SCT’, dims = 1:30). Subsetting was then performed on adipocytes and reclustered (excluding clusters that were PLIN1 positive and high in IL7R and PTPRC expression), resulting in 2,703 nuclei. After normalization and clustering, we used adaptively thresholded low rank approximation77 to impute the RNA count matrix and fill in technical dropouts. Markers identified in adipocyte subpopulations from mouse were subsequently interrogated based on this unbiased clustering and putative analogous cross-species brown adipocyte cell states were identified based on genes such as SLC7A10, UCP1 and FASN.
Spatial transcriptomics of brown adipose tissue
BAT was collected from mice at thermoneutrality and mice that had undergone transient acute cold exposure 4 d previously. Sample preparation, sectioning, staining, imaging, library preparation and sequencing were performed following the Visium protocol (10x Genomics). Subsequently, various data analysis methods on the Visium data were performed to investigate the differences in cell-type and gene expression distributions between the cold-naïve and cold-experienced BAT sections. First, we utilized SpaDecon, a cell-type deconvolution method for spatial transcriptomics data33, to determine the differences in cell-type distributions between the two tissue sections. In brief, SpaDecon is a semi-supervised learning-based method for cell-type deconvolution that can be applied to spatial barcoding-based spatially resolved transcriptomics data33. SpaDecon is freely available for installation at https://pypi.org/project/SpaDecon/. Thus, using the paired snRNA-seq data as a reference, SpaDecon estimated for each spot in a given tissue section the proportion of cells belonging to each cell type. These cell-type proportion estimates were used to calculate the cell-type-level spatial correlation, defined by the Pearson correlation between the proportions of each pair of cell types across all spots in the tissue section. Before constructing the gene expression distribution plots in Fig. 5c–f, the Visium gene expression data for each tissue section were normalized and variance stabilized using the regularized negative binomial regression-based method ‘sctransform’75. These data were subsequently transformed by adding 1 to and taking the natural log of each count. For the blended heat maps in Fig. 5c,d, we only highlight spots with expression above the 50th percentile for at least one of the relevant genes. Spots that are grey have expression of both genes below the 50th percentile. To construct the scatterplots in Fig. 5e,f, we used a subset of the spots that included those with Ucp1 expression above the 50th percentile. For each of the scatterplots in Fig. 5e,f, we calculated the Pearson correlation between the expressions of Ucp1 and the other relevant gene across the subset of spots, represented as ‘R’ in the upper or lower right of each plot.
Cryo-section immunostaining
Tissue was collected immediately after euthanizing mice and fixed with 4% paraformaldehyde overnight. Tissue was then washed with PBS five times for 10 min each, then incubated in 30% sucrose in PBS for 8 h and then frozen in Tissue-Tek optimal cutting temperature compound (Sakura Finetek, 4583) on dry ice and stored at −80 °C until further processing. Immunofluorescence staining was performed on 20-μm sections on a Leica CM1950 cryostat. Sections were briefly rinsed with PBS and blocked with 0.1% Triton X-100, 5% Normal Donkey Serum ( Jackson ImmunoResearch, 153804) in PBS overnight. Sections were then stained with anti-UCP1 (R&D Systems, MAB6158, CCNV0219101, 1:200 dilution) and anti-FASN (Cell Signaling, 3189S, 1:200 dilution) diluted in blocking solution, and incubated overnight at 4 °C. Sections were washed with 0.01% Triton, 5% Donkey Serum in PBS three times for 5 min each at room temperature, and then stained with secondary antibody cocktails containing donkey anti-rabbit (Cy3) and donkey anti-mouse (Cy5; Jackson Immuno Research, 1:250 dilution) diluted in blocking solution overnight at 4 °C. Sections were washed with 0.1% Triton, 5% Donkey Serum in PBS three times for 5 min each, and then mounted in ProLong Diamond Antifade Mountant (Thermo Fisher, P36965). Images were taken on a Nikon Ti2 Eclipse Microscope with a ×20 objective.
Image analysis
For each mouse, at least four sections of adipose tissues were imaged and analysed. Images were analysed using Fiji software. For FASN+ adipocyte area proportion, FASN+ area was selected by IsoData thresholding method and normalized to the total area of the sample as manually demarcated using the selection cool. For quantification of UCP1 and FASN intensity in single brown adipocytes, single adipocytes were manually demarcated, and intensity was quantified in the Fasn and Ucp1 channel, respectively. In each experiment, the function parameters were kept the same between biological replicates.
Non-targeted metabolomics of brown adipose tissue
BAT samples were collected and immediately frozen in liquid nitrogen and stored at −80 °C. Sample preparation and analysis were performed by Metabolon. Samples were prepared using the automated MicroLab STAR system (Hamilton). To remove protein, dissociate small molecules bound to protein or trapped in the precipitated protein matrix and to recover chemically diverse metabolites, proteins were precipitated with methanol.
The resulting extract was divided into five fractions: one for analysis by UPLC-MS/MS with positive ion mode electrospray ionization, one for analysis by UPLC-MS/MS with negative ion mode electrospray ionization, one for LC polar platform, one for analysis by GC–MS and one sample was reserved for backup. Samples were placed briefly on a TurboVap (Zymark) to remove the organic solvent. For LC, the samples were stored overnight under nitrogen before preparation for analysis. For GC, each sample was dried under a vacuum overnight before preparation for analysis.
Data extraction and compound identification.
Data were extracted, and peaks were identified and quality control processed using Metabolon’s hardware and software. Compounds were identified by comparison to library entries of purified standards or recurrent unknown entities.
Metabolite quantification, data normalization and transformation.
Peaks were quantified using the area under the curve. For studies spanning multiple days, a data normalization step was performed to correct variation resulting from instrument inter-day tuning differences. The normalized data were then transformed using the natural log (ln). Metabolomics data typically display a log-normal distribution; therefore, the log-transformed data are used for statistical analyses.
Absolute measurements of acylcarnitines in brown adipose tissue
Whole wet, frozen BATs from mice were homogenized in acetonitrile/0.3% formic acid using a Precellys homogenizer. Aliquots of homogenates were extracted with ice-cold methanol with subsequent derivatization with 1-ethyl-3-(3-dimethylaminopropyl)carbodiimide coupling chemistry with O-benzylhydroxylamine. Derivatized acylcarnitines were quantified using multiple reaction monitoring on an Agilent 1290 Infinity HPLC/6495B triple-quadrupole mass spectrometer. Standard calibration curves were similarly prepared to quantify acylcarnitines in brown adipose using Agilent MassHunter software.
Statistical analysis
Data are presented as means ± s.e.m. unless otherwise indicated. All statistical tests are fully described in the figure legends. Normality was tested using the Shapiro–Wilk test and QQ plot. Homogeneity of variance was tested using Bartlett’s test and residual/homoscedasticity plot. Normal distribution was assessed using analysis of variance followed by adjustment for multiple comparisons. For non-parametric data, Kruskal–Wallis test was followed by Dunn’s multiple-comparison test. Adjusted P values < 0.05 were considered significant. Two-group comparisons were done using Mann–Whitney U test for non-parametric data and with unpaired t-test for parametric data. Survival curve comparisons for P-value assessment were analysed using a log-rank Mantel–Cox test. In figures, asterisks denote statistical significance (*P < 0.05; **P < 0.01; ∗∗∗P < 0.001; ****P < 0.0001). Statistical analysis was performed in GraphPad Prism 9.
Reporting summary
Further information on research design is available in the Nature Portfolio Reporting Summary linked to this article.
Extended Data
Extended Data Fig. 1 |. Whole-body energy expenditure is increased in a secondary cold challenge 4 days after a primary cold challenge.
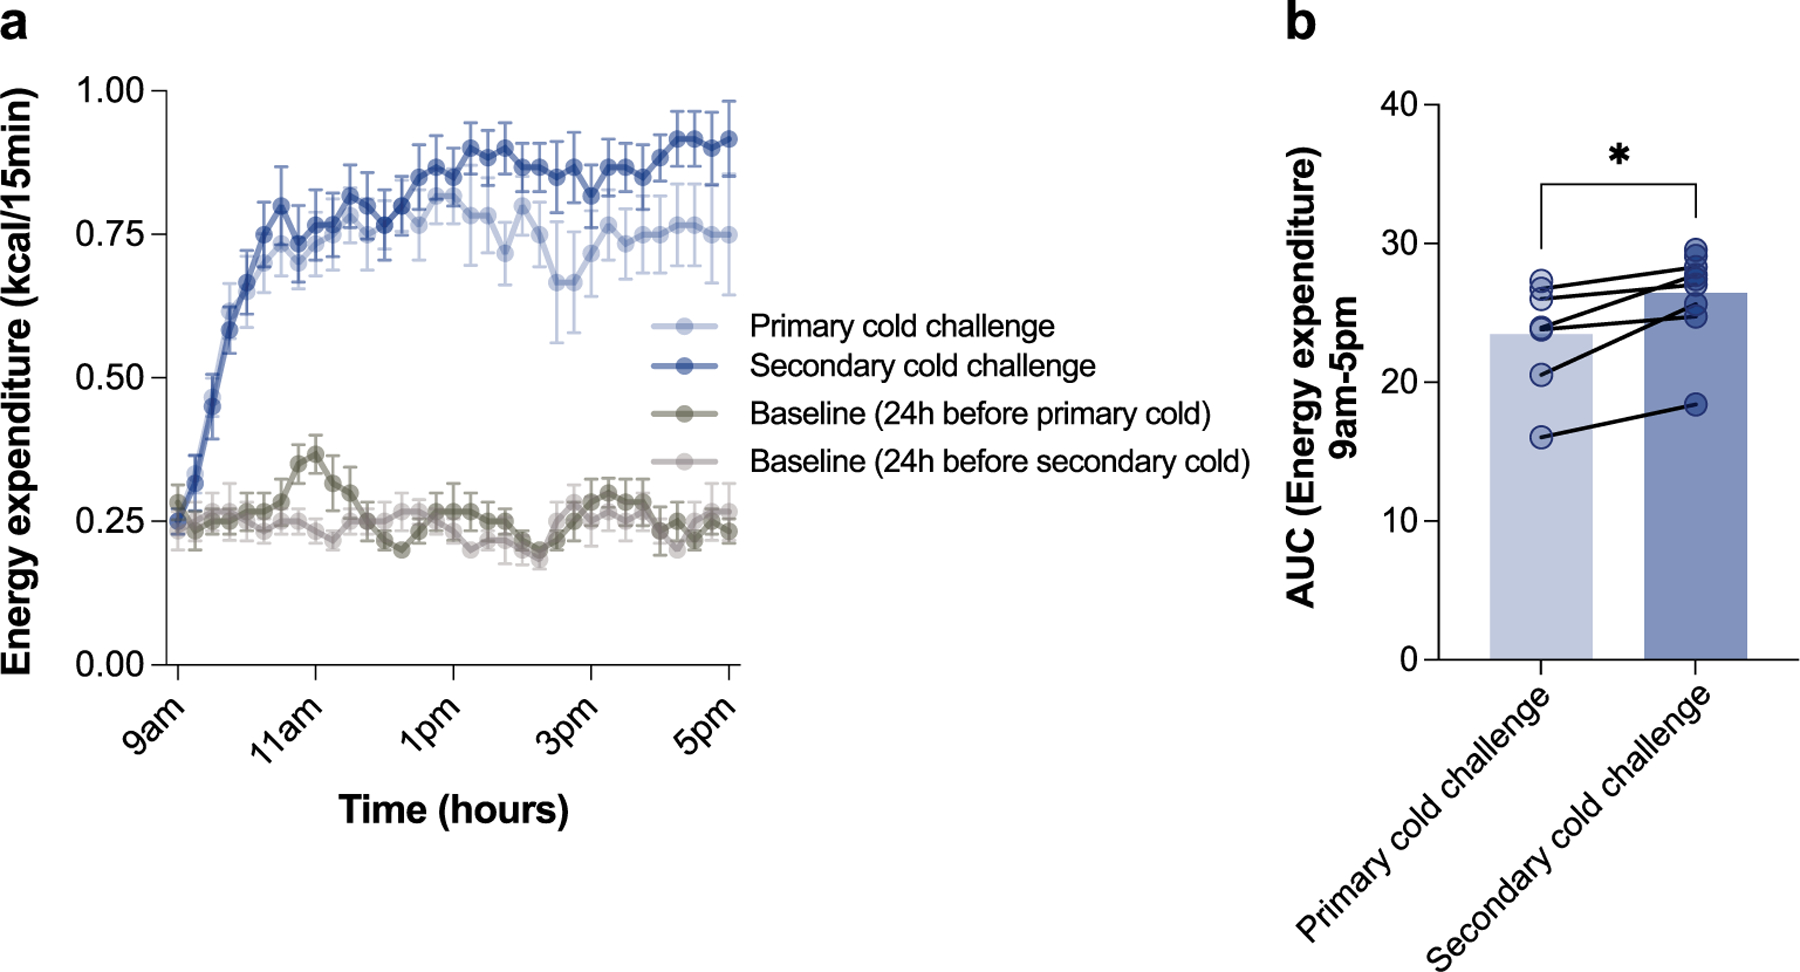
a, Whole-body energy expenditure over time in the primary cold challenge compared to secondary cold challenge of the same mice over time (n = 6 independent animals). b, Area under the curve (AUC) analysis of energy expenditure over time in primary and secondary cold challenge (9am-5pm). Error bars indicate means ± s.e.m. *, P < 0.05. Exact P values are presented in the source data file for Extended Data Fig. 1.
Extended Data Fig. 2 |. The transcriptional induction of lipid biosynthesis following a primary thermogenic response is specific to BAT.
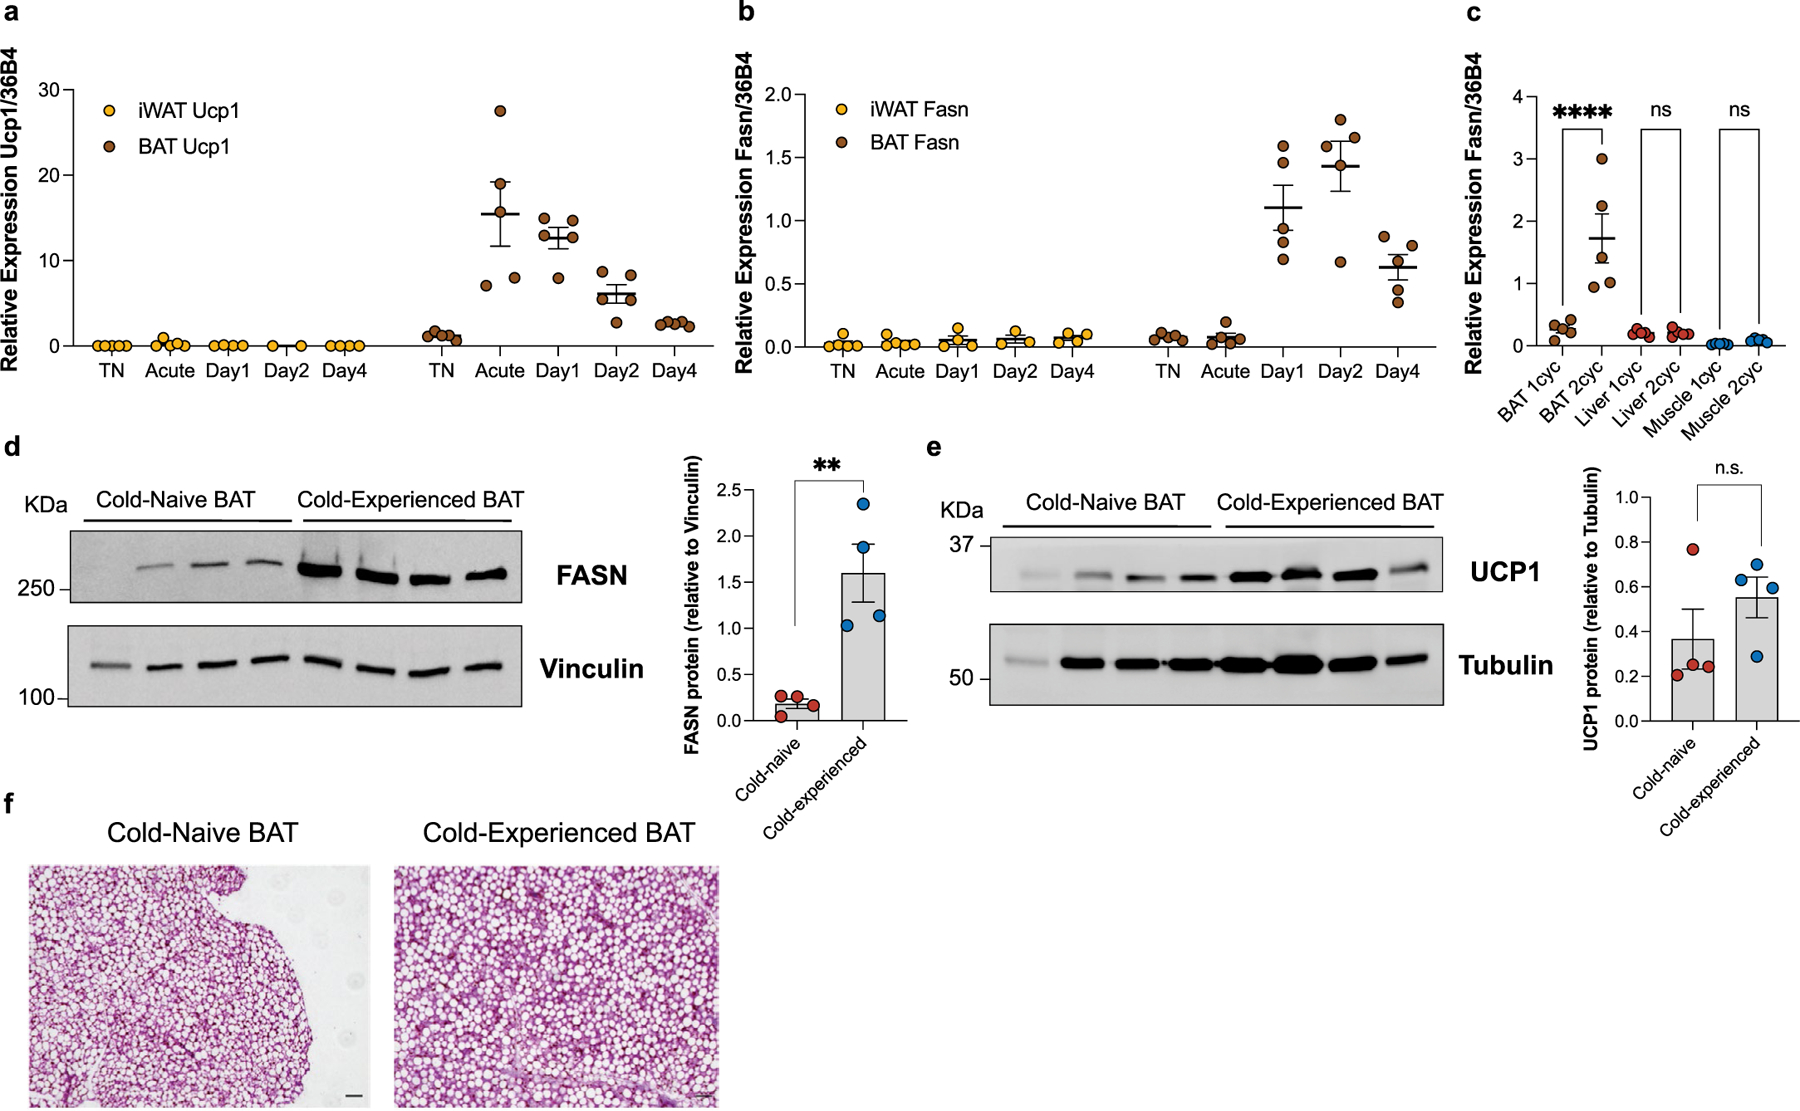
a, Relative gene expression of Ucp1 in iWAT and BAT following transient cold exposure (n = 5 independent animals per condition, except iWAT Day 1 n = 4, iWAT Day 2 n = 2, and iWAT Day 4 n = 4). b, Relative gene expression of Fasn in iWAT and BAT following transient cold exposure (n = 5 independent animals per condition, except iWAT Day 1 n = 4, iWAT Day 2 n = 3, and iWAT Day 4 n = 4). c, Relative gene expression of Fasn in BAT, liver, and muscle from mice in their primary thermogenic response (1cyc) and secondary thermogenic response (2cyc) (n = 5 independent animals per condition). d, Western blot of FASN protein in BAT from cold-naïve mice compared to cold-experienced mice, and relative expression analysis compared to housekeeping gene (Vinculin) (n = 4 independent animals per condition). e, Western blot of UCP1 protein in BAT from cold-naïve mice compared to cold-experienced mice, and relative expression analysis compared to housekeeping gene (Tubulin) (n = 4 independent animals per condition). f, Representative H&E histology images of BAT from cold-naïve mice and cold-experienced mice 4 days after a transient cold exposure (n = 4 independent animals per condition), scale bar = 50μm. Error bars indicate means ± s.e.m. ns, not significant; *, P < 0.05; **, P < 0.01; ***, P < 0.001; ****, P < 0.0001. Exact P values are presented in the source data file for Extended Data Fig. 2.
Extended Data Fig. 3 |. Workflow and validation of nuclei isolation from BAT.
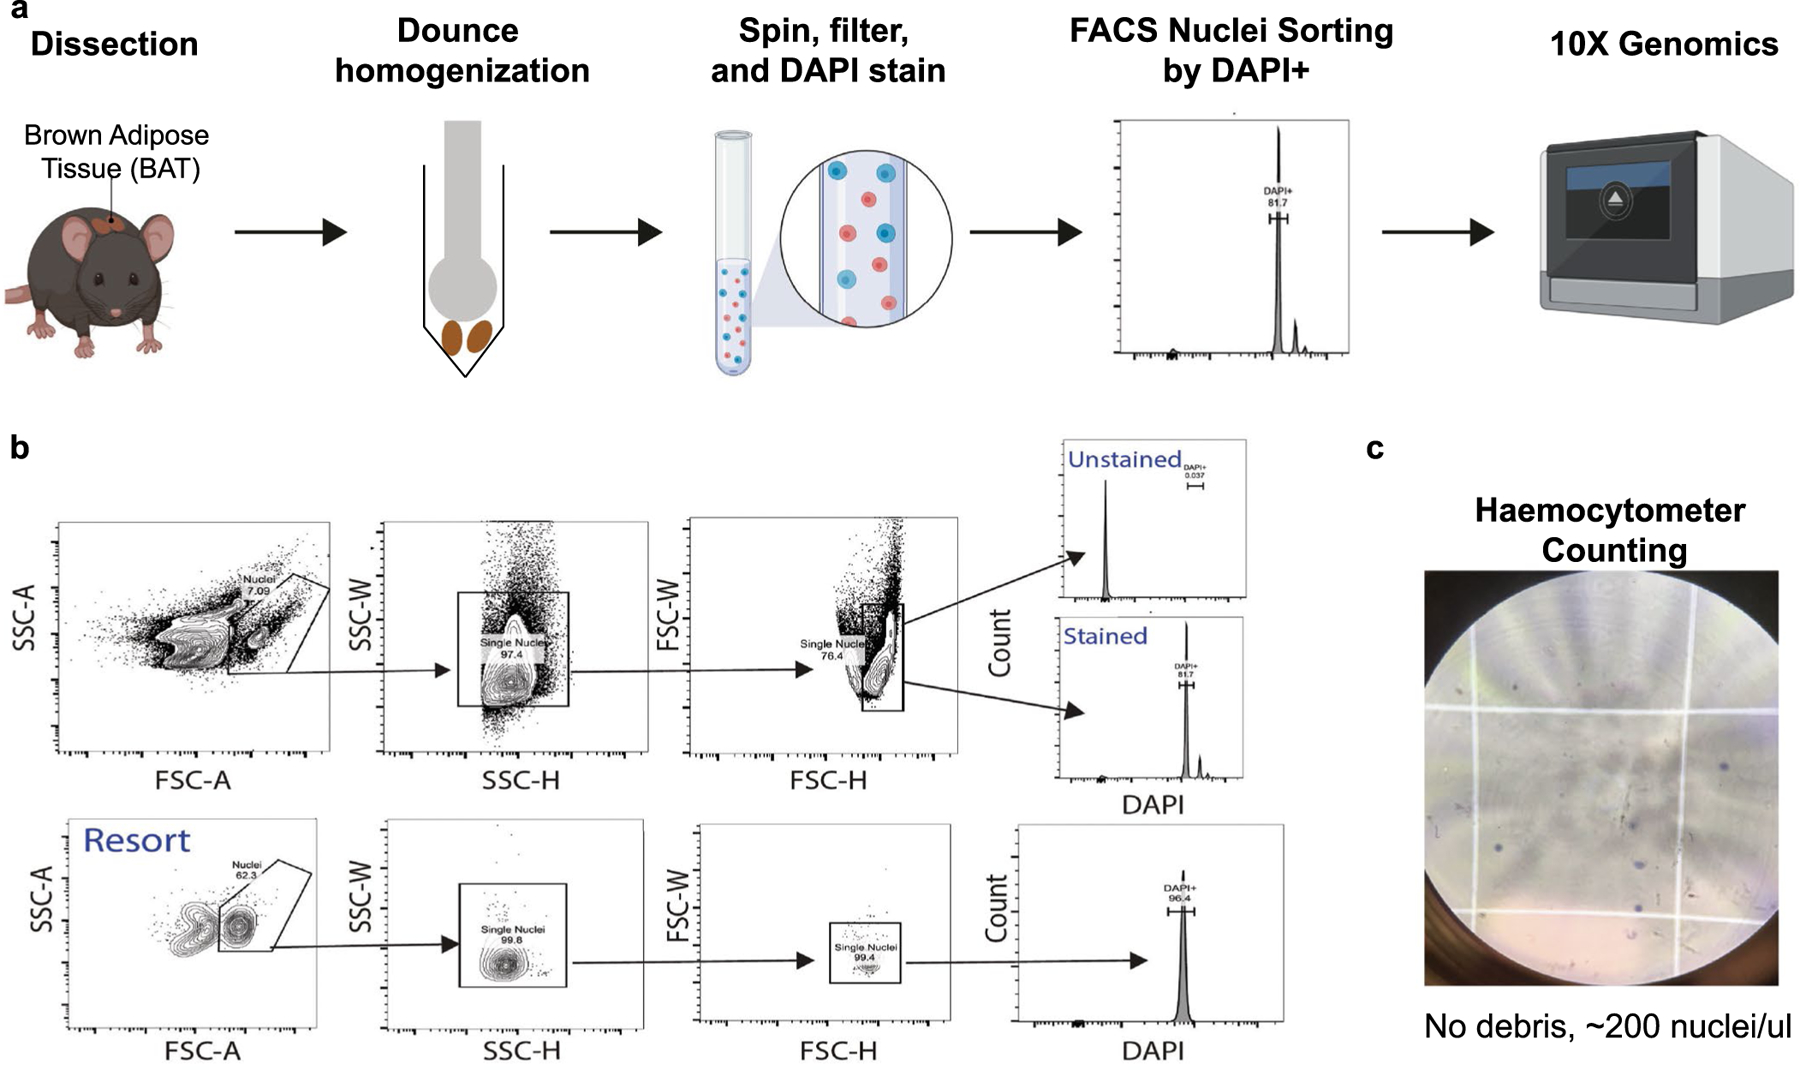
a, Workflow schematic. b, Nuclei sorting strategy using DAPI positivity, including a re-sort validation experiment. c, Inspection and counting of nuclei quality on haemocytometer.
Extended Data Fig. 4 |. Single-nucleus RNA-sequencing of brown adipose tissue resolves cell types and adipocyte subpopulations.
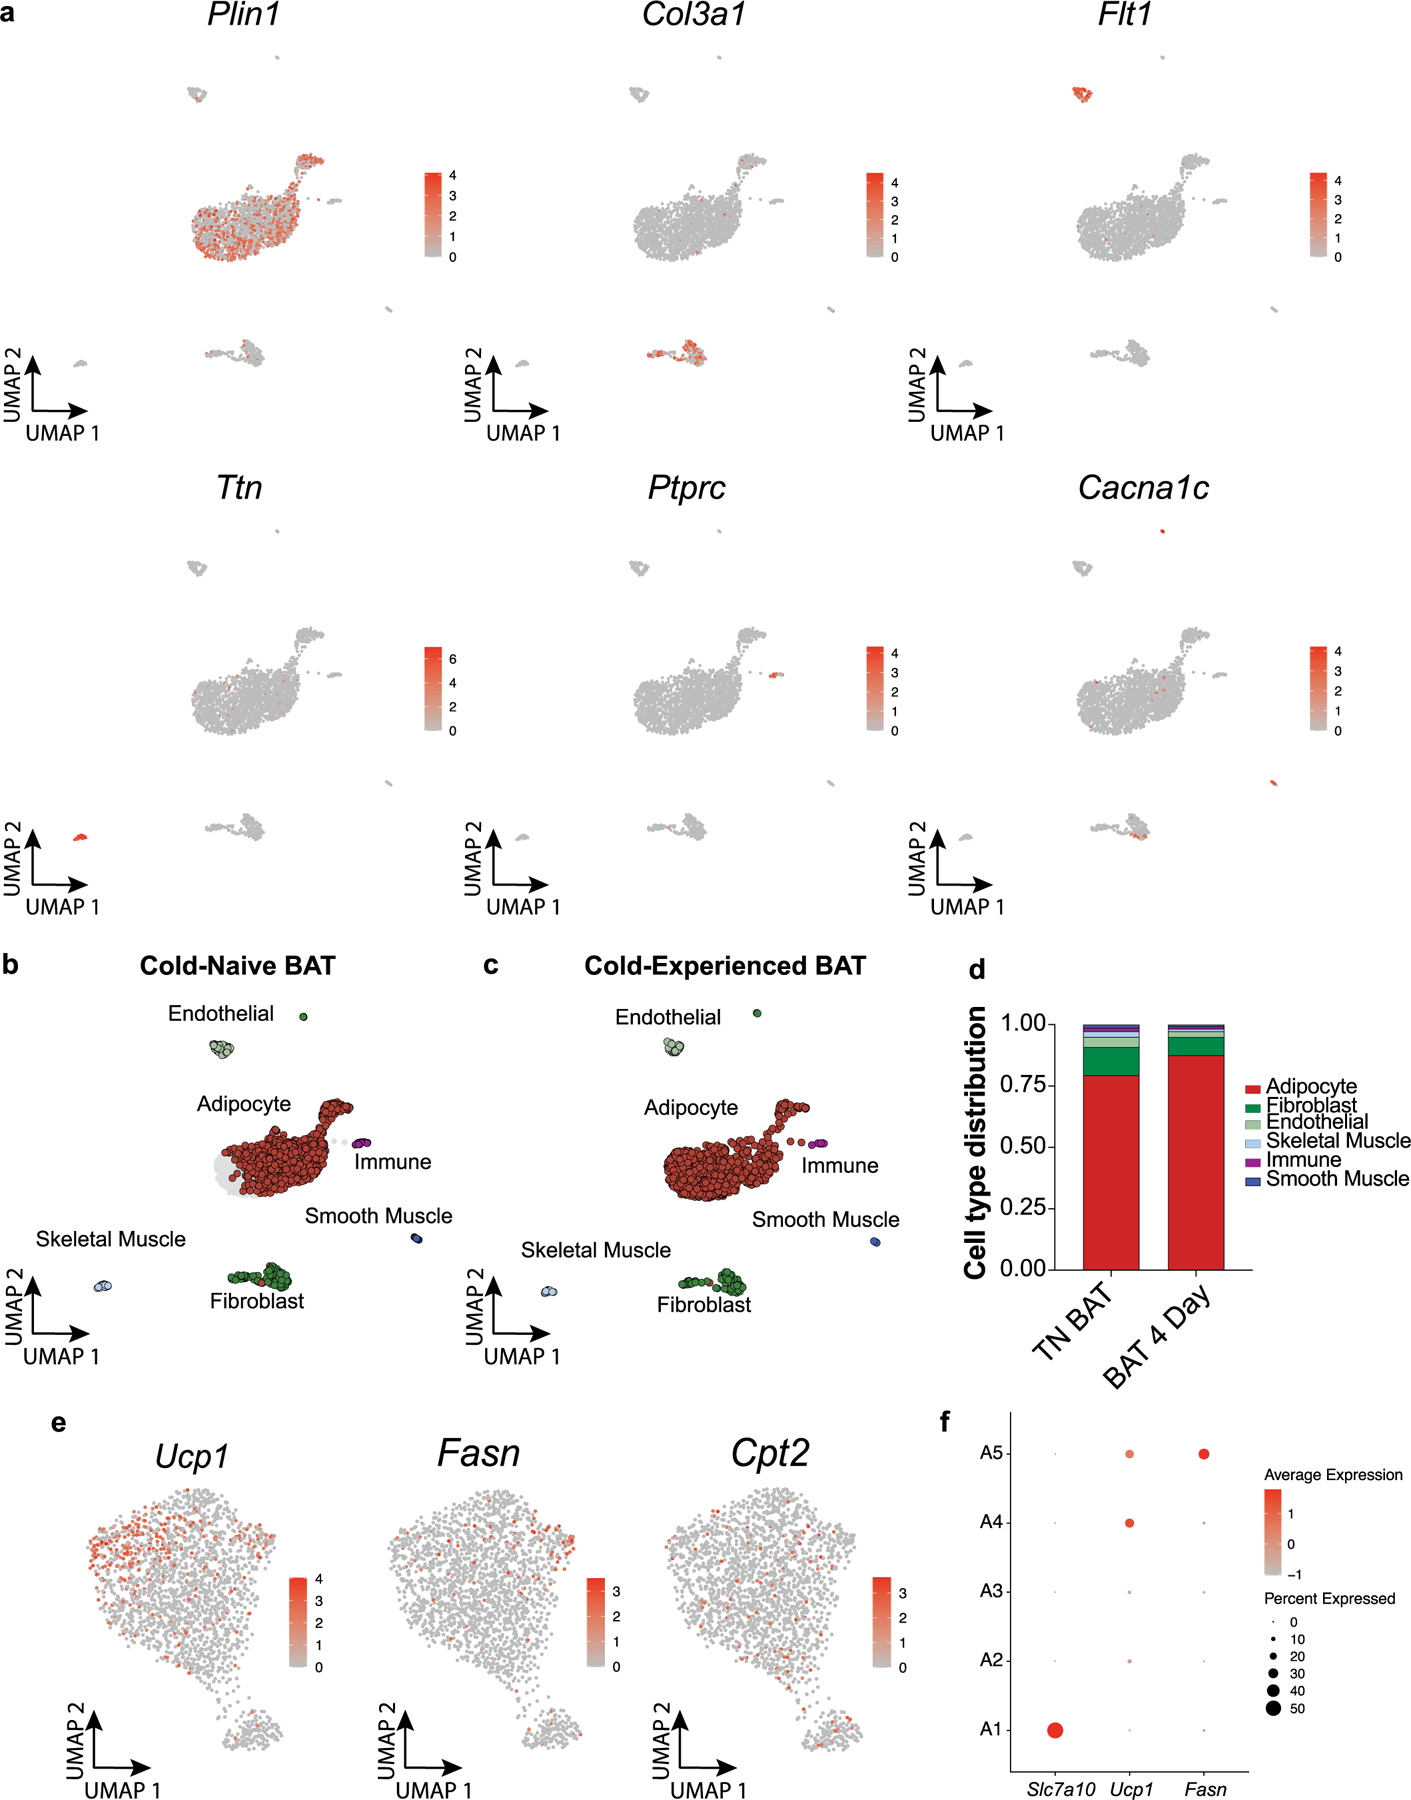
a, Expression of canonical marker genes of cell types identified by BAT snRNAseq. b-c, UMAP plots of cell types separated by cold-naïve BAT (b) and cold-experienced BAT (4 days following transient acute cold) (c). d, Cell type distributions separated by condition. e, Feature plots for Fasn, Ucp1, and Cpt2 expression within the adipocyte population. f, Dot plot for Slc7a10, Ucp1, and Fasn expression across five identified adipocyte subpopulations (A1-A5).
Extended Data Fig. 5 |. Cell type distributions in spatial transcriptomics data and snRNAseq data.
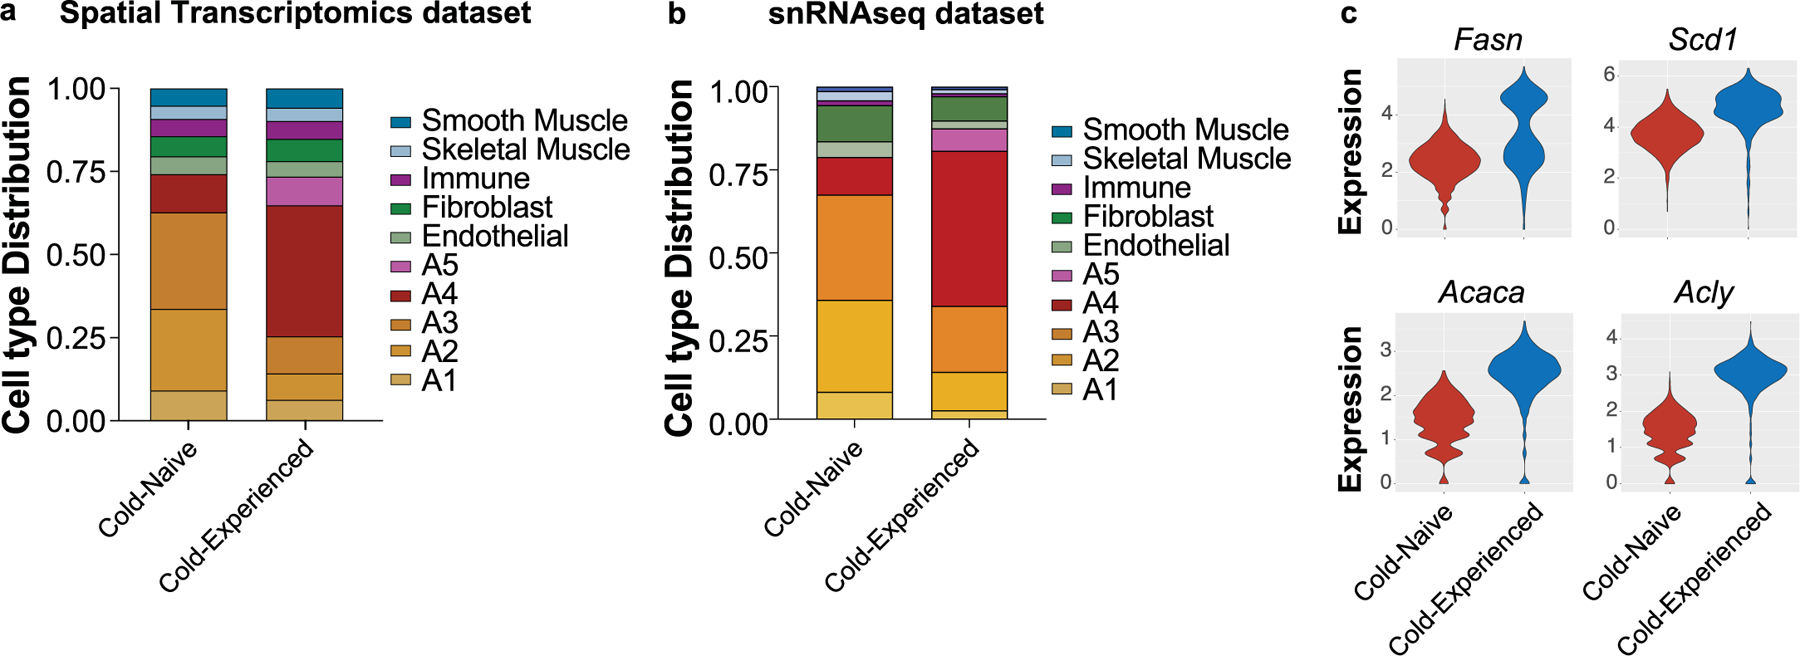
a, b, Cell type distributions quantified in spatial transcriptomics data (a) and snRNAseq data (b). c, Violin plots for the expression of indicated genes across all spots in each condition from BAT spatial transcriptomics data.
Extended Data Fig. 6 |. Total free fatty acids, glycerolipids, or phospholipids & sphingolipids in brown adipose tissue following a primary thermogenic response.
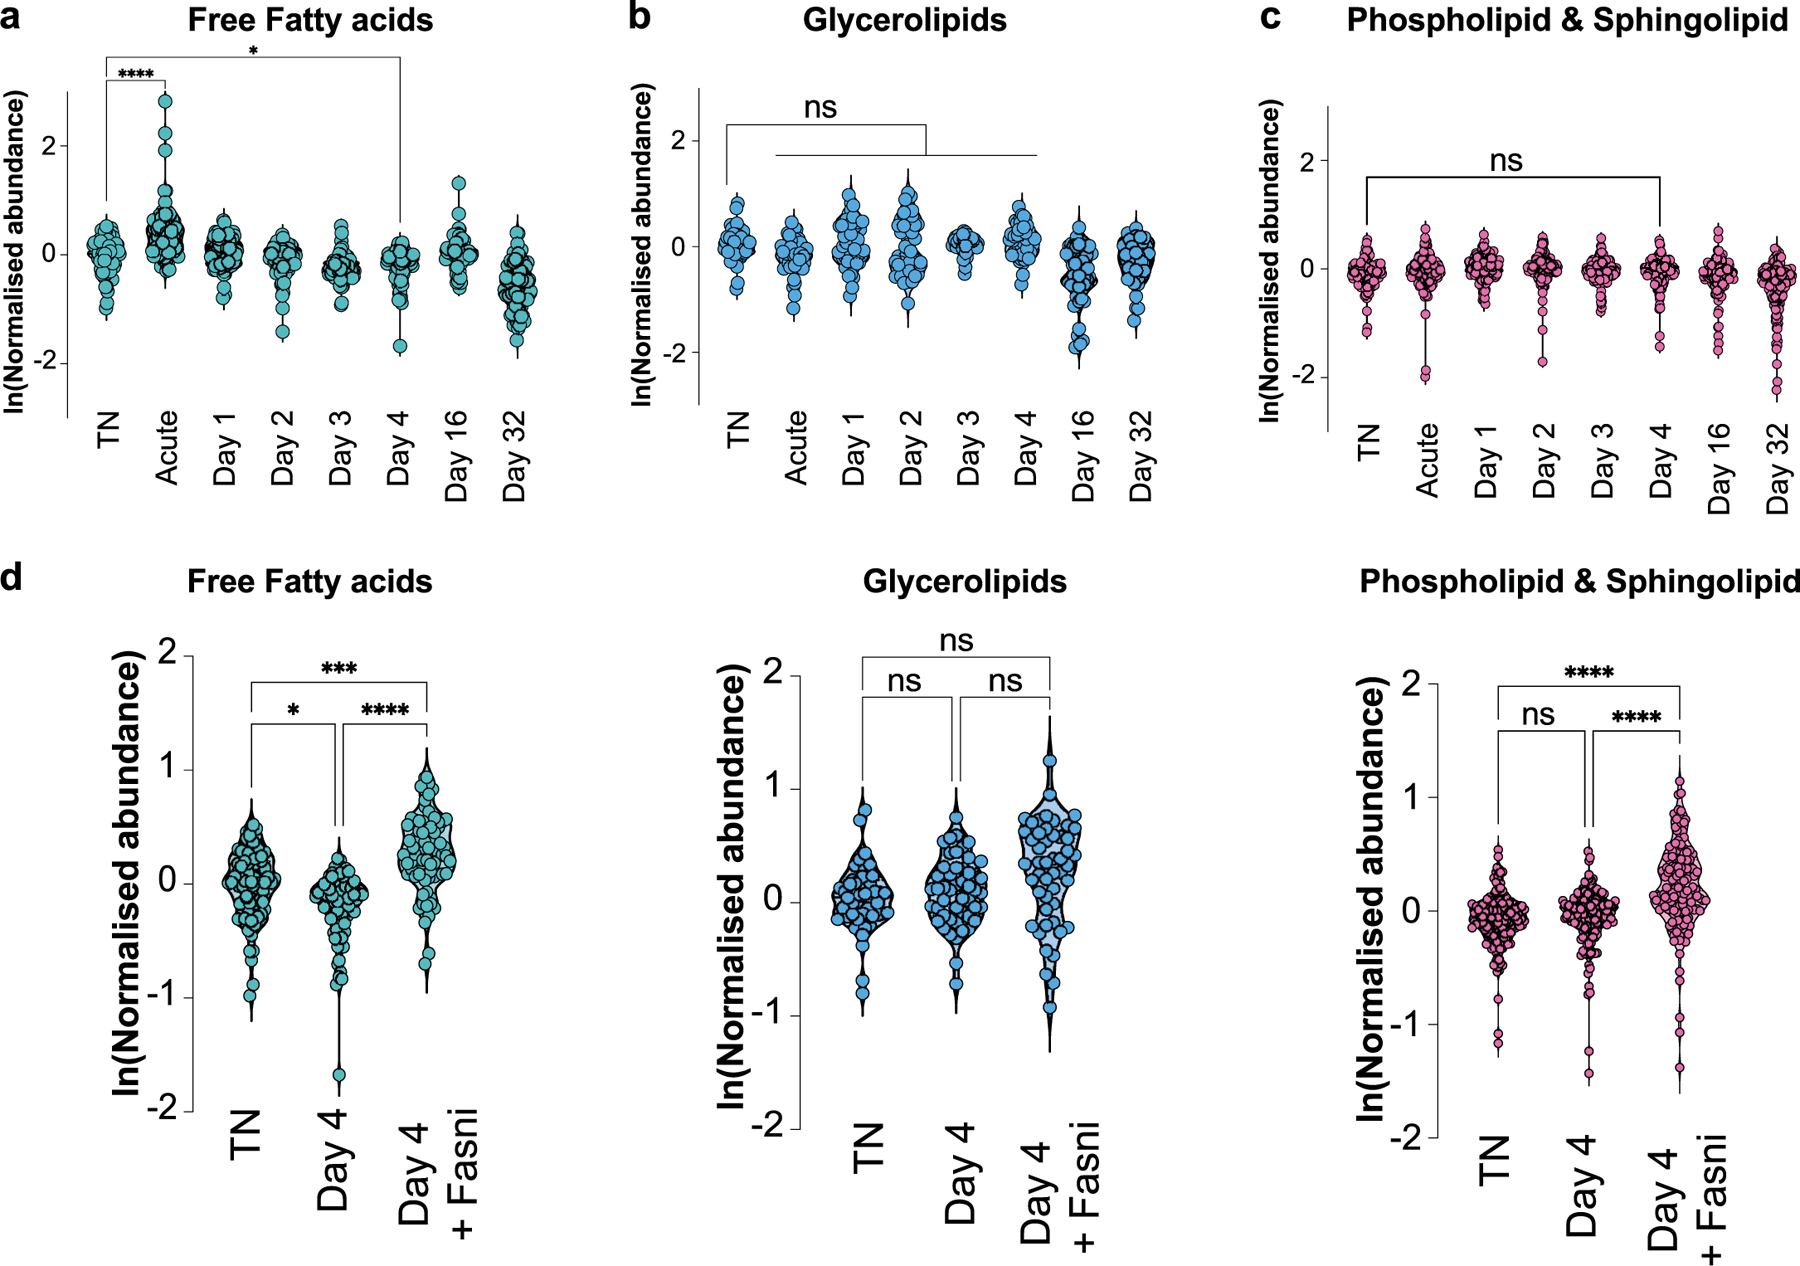
a-d, Relative abundance and distribution of free fatty acids (a), glycerolipids (b), and phospholipid & sphingolipid (c) species in BAT in different experimental conditions. Data presented in panels a-d is based on metabolomics from n = 5 independent animals per condition. Each data point represents the average value across replicates for each species. d, Comparison of indicated lipid metabolite species in BAT between TN, day 4, and day 4 with Fasn inhibition (Fasni). Each data point represents the average value across replicates for each species. Error bars indicate means ± s.e.m. ns, not significant; *, P < 0.05; ***, P < 0.001; ****, P < 0.0001. Exact P values are presented in the source data file for Extended Data Fig. 6.
Extended Data Fig. 7 |. Scap knockout in brown adipocytes does not affect the expression of genes involved in acylcarnitine transport or fatty acid oxidation.
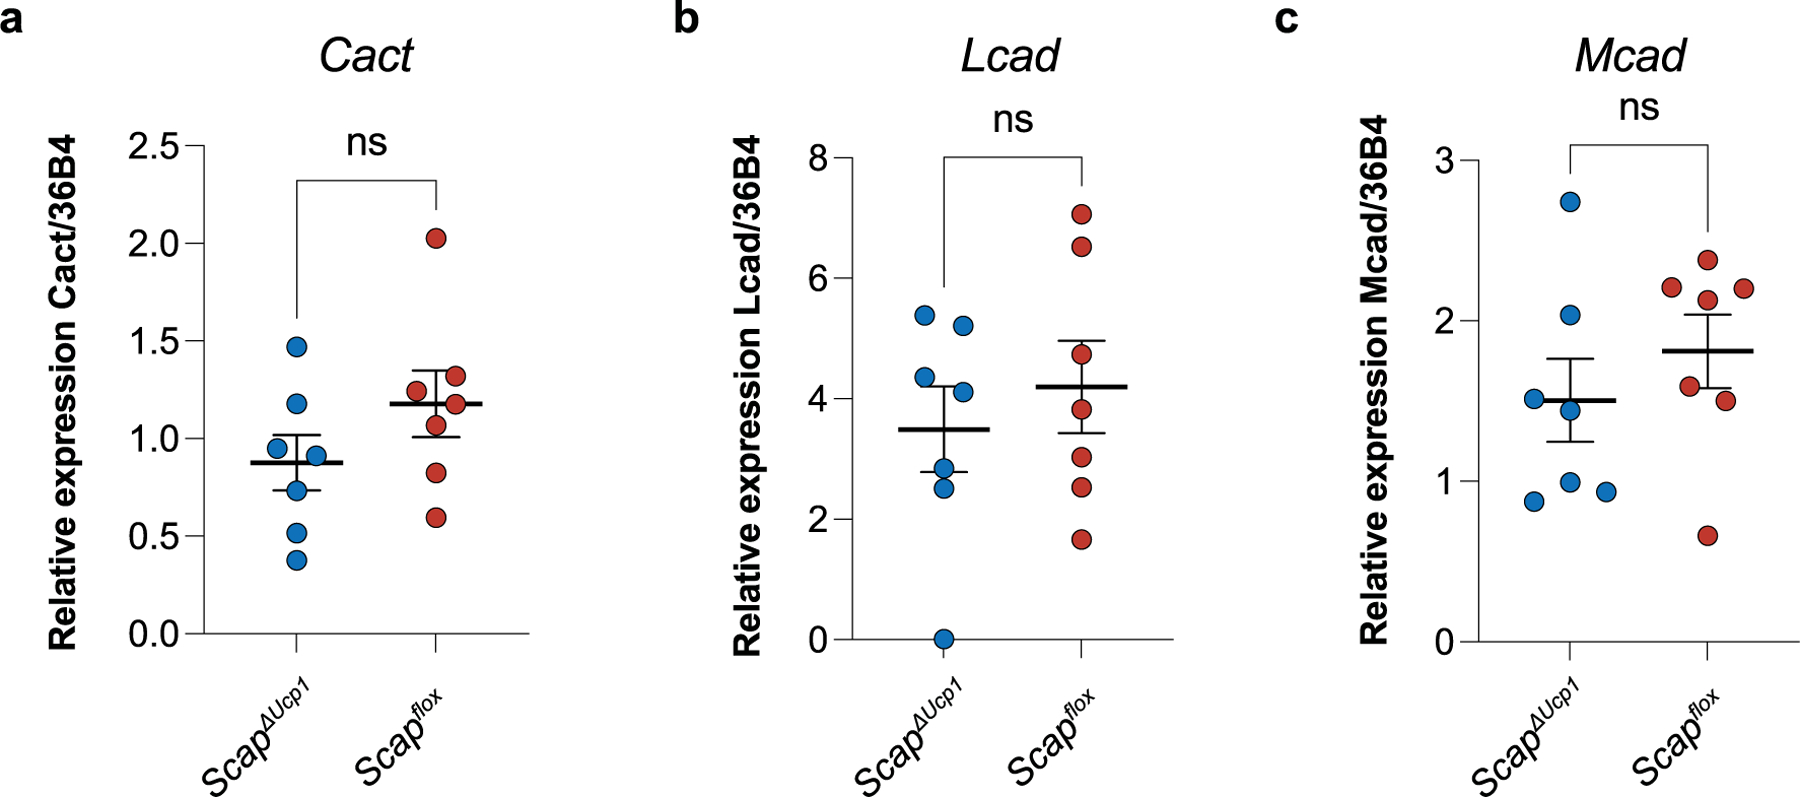
a-c, Relative gene expression of Cact (a), Lcad (b), and Mcad (c) in brown adipose tissue from ScapΔUcp1 (n = 7 independent animals) and Scapflox mice (n = 7 independent animals) 4 days after primary cold exposure. Error bars indicate means ± s.e.m. ns, not significant. Exact P values are presented in the source data file for Extended Data Fig. 7.
Supplementary Material
Acknowledgements
We thank all members of the laboratory of C.A.T. for valuable discussions and input, as well as members of the P.V.S. laboratory (J. Ishibashi and A. Angueira), the J. Wherry laboratory (Z. Chen) and D. Allman laboratory (B. Gaudette) at UPenn for their scientific and technical advice. We thank the Penn Metabolomics Core in the Penn Cardiovascular Institute for LC-MS quantification of acylcarnitines. We acknowledge L. Micha (UPenn) for excellent mouse husbandry. We further thank M. Lazar (UPenn) and C. Wolfrum (ETH Zurich) for Scapfl/fl Ucp1-CreER mice. We thank C. Semenkovich (WashU) for sharing Fasnfl/fl mice. We gratefully acknowledge M. Lazar, J. Henao-Mejia, R. Faryabi and N. Betley (all at UPenn) for scientific advice throughout this study. C.A.T. is a Pew Biomedical Scholar and a Kathryn W. Davis Aging Brain Scholar, and is supported by a National Institutes of Health Director’s New Innovator Award (DP2AG067492), the Edward Mallinckrodt, Jr. Foundation, the Global Probiotics Council, the Mouse Microbiome Metabolic Research Program of the National Mouse Metabolic Phenotyping Centers, and grants by the IDSA Foundation, the Thyssen Foundation, the PennCHOP Microbiome Program, the Penn Institute for Immunology, the Penn Center for Molecular Studies in Digestive and Liver Diseases (P30-DK-050306), the Penn Skin Biology and Diseases Resource-based Center (P30-AR-069589), the Penn Diabetes Research Center (P30-DK-019525) and the Penn Institute on Aging. This work was further supported by a National Institutes of Health Training Grant T32AI141393 (to P.L.), Fellowship Grant F31HL160065 (to P.L.), Medical Scientist Training Program T32 GM07170 (to P.V.S. and L.L.), Training Grant in Computational Biology 5-T32-HG-000046-21 (to L.L.), Boehringer Ingelheim Fonds MD Fellowship (to S.K.), and University of Pennsylvania Center for Undergraduate Research Fellowship (to J.C.). Graphical images in Figs. 1a and Fig. 2a and Extended Data Fig. 3a were created with BioRender.com.
Footnotes
Code availability
Representative code to reproduce the spatial transcriptomics analysis are available at https://github.com/kpcoleman/BAT-SpaDecon/. Any additional information required to analyse the data reported in this paper is available from C.A.T. upon request.
Competing interests
The authors declare no competing interests.
Additional information
Extended data is available for this paper at https://doi.org/10.1038/s42255-023-00893-w.
Supplementary information The online version contains supplementary material available at https://doi.org/10.1038/s42255-023-00893-w.
Peer review information Nature Metabolism thanks the anonymous reviewers for their contribution to the peer review of this work. Primary Handling Editor: Isabella Samuelson, in collaboration with the Nature Metabolism team.
Data availability
All snRNA-seq and spatial transcriptomics data reported in here have been deposited in the Gene Expression Omnibus under accession number GSE218711. RNA-seq data are available at the sequence read archive under BioProject number PRJNA866352. The snRNA-seq data of BAT from human come from a published study31 with accession number E-MTAB-8564 as described in the snRNA-seq section in the methods. Source data are provided with this paper. All other data are available in the main text or the Supplementary Information.
References
- 1.Farber DL, Netea MG, Radbruch A, Rajewsky K & Zinkernagel RM Immunological memory: lessons from the past and a look to the future. Nat. Rev. Immunol 16, 124–128 (2016). [DOI] [PubMed] [Google Scholar]
- 2.Netea MG et al. Defining trained immunity and its role in health and disease. Nat. Rev. Immunol 20, 375–388 (2020). [DOI] [PMC free article] [PubMed] [Google Scholar]
- 3.Josselyn SA, Köhler S & Frankland PW Finding the engram. Nat. Rev. Neurosci 16, 521–534 (2015). [DOI] [PubMed] [Google Scholar]
- 4.Kandel ER, Dudai Y & Mayford MR The molecular and systems biology of memory. Cell 157, 163–186 (2014). [DOI] [PubMed] [Google Scholar]
- 5.Naik S et al. Inflammatory memory sensitizes skin epithelial stem cells to tissue damage. Nature 550, 475–480 (2017). [DOI] [PMC free article] [PubMed] [Google Scholar]
- 6.Ordovas-Montanes J, Beyaz S, Rakoff-Nahoum S & Shalek AK Distribution and storage of inflammatory memory in barrier tissues. Nat. Rev. Immunol 20, 308–320 (2020). [DOI] [PMC free article] [PubMed] [Google Scholar]
- 7.Ordovas-Montanes J et al. Allergic inflammatory memory in human respiratory epithelial progenitor cells. Nature 560, 649–654 (2018). [DOI] [PMC free article] [PubMed] [Google Scholar]
- 8.Cannon B & Nedergaard J Brown adipose tissue: function and physiological significance. Physiol. Rev 84, 277–359 (2004). [DOI] [PubMed] [Google Scholar]
- 9.Chouchani ET, Kazak L & Spiegelman BM New advances in adaptive thermogenesis: UCP1 and beyond. Cell Metab 29, 27–37 (2019). [DOI] [PubMed] [Google Scholar]
- 10.Cypess AM et al. Identification and importance of brown adipose tissue in adult humans. N. Engl. J. Med 360, 1509–1517 (2009). [DOI] [PMC free article] [PubMed] [Google Scholar]
- 11.Van Marken Lichtenbelt WD et al. Cold-activated brown adipose tissue in healthy men. N. Engl. J. Med 360, 1500–1508 (2009). [DOI] [PubMed] [Google Scholar]
- 12.Becher T et al. Brown adipose tissue is associated with cardiometabolic health. Nat. Med 27, 58–65 (2021). [DOI] [PMC free article] [PubMed] [Google Scholar]
- 13.Bartelt A et al. Brown adipose tissue activity controls triglyceride clearance. Nat. Med 17, 200–205 (2011). [DOI] [PubMed] [Google Scholar]
- 14.Stanford KI et al. Brown adipose tissue regulates glucose homeostasis and insulin sensitivity. J. Clin. Invest 123, 215–223 (2013). [DOI] [PMC free article] [PubMed] [Google Scholar]
- 15.Hanssen MJW et al. Short-term cold acclimation improves insulin sensitivity in patients with type 2 diabetes mellitus. Nat. Med 21, 863–865 (2015). [DOI] [PubMed] [Google Scholar]
- 16.Hanssen MJW et al. Short-term cold acclimation recruits brown adipose tissue in obese humans. Diabetes 65, 1179–1189 (2015). [DOI] [PubMed] [Google Scholar]
- 17.Roh HC et al. Warming induces significant reprogramming of beige, but not brown, adipocyte cellular identity. Cell Metab 27, 1121–1137 (2018). [DOI] [PMC free article] [PubMed] [Google Scholar]
- 18.Gerhart-Hines Z et al. The nuclear receptor Rev-erbα controls circadian thermogenic plasticity. Nature 503, 410–413 (2013). [DOI] [PMC free article] [PubMed] [Google Scholar]
- 19.Golozoubova V et al. Only UCP1 can mediate adaptive nonshivering thermogenesis in the cold. FASEB J 15, 2048–2050 (2001). [DOI] [PubMed] [Google Scholar]
- 20.Cannon B & Nedergaard J Nonshivering thermogenesis and its adequate measurement in metabolic studies. J. Exp. Biol 214, 242–253 (2011). [DOI] [PubMed] [Google Scholar]
- 21.Enerbäck S et al. Mice lacking mitochondrial uncoupling protein are cold-sensitive but not obese. Nature 387, 90–94 (1997). [DOI] [PubMed] [Google Scholar]
- 22.Sanchez-Gurmaches J et al. Brown fat AKT2 is a cold-induced kinase that stimulates ChREBP-mediated de novo lipogenesis to optimize fuel storage and thermogenesis. Cell Metab 27, 195–209 (2018). [DOI] [PMC free article] [PubMed] [Google Scholar]
- 23.Adlanmerini M et al. Circadian lipid synthesis in brown fat maintains murine body temperature during chronic cold. Proc. Natl Acad. Sci. USA 116, 18691–18699 (2019). [DOI] [PMC free article] [PubMed] [Google Scholar]
- 24.Mottillo EP et al. Coupling of lipolysis and de novo lipogenesis in brown, beige, and white adipose tissues during chronic β3-adrenergic receptor activation. J. Lipid Res 55, 2276–2286 (2014). [DOI] [PMC free article] [PubMed] [Google Scholar]
- 25.Yu XX, Lewin DA, Forrest W & Adams SH Cold elicits the simultaneous induction of fatty acid synthesis and β-oxidation in murine brown adipose tissue: prediction from differential gene expression and confirmation in vivo. FASEB J 16, 155–168 (2002). [DOI] [PubMed] [Google Scholar]
- 26.Matsuda M et al. SREBP cleavage-activating protein (SCAP) is required for increased lipid synthesis in liver induced by cholesterol deprivation and insulin elevation. Genes Dev 15, 1206–1216 (2001). [DOI] [PMC free article] [PubMed] [Google Scholar]
- 27.Moon Y-A et al. The Scap/SREBP pathway is essential for developing diabetic fatty liver and carbohydrate-induced hypertriglyceridemia in animals. Cell Metab 15, 240–246 (2012). [DOI] [PMC free article] [PubMed] [Google Scholar]
- 28.Habib N et al. Div-Seq: single-nucleus RNA-seq reveals dynamics of rare adult newborn neurons. Science 353, 925–928 (2016). [DOI] [PMC free article] [PubMed] [Google Scholar]
- 29.Habib N et al. Massively parallel single-nucleus RNA-seq with DroNc-seq. Nat. Methods 14, 955–958 (2017). [DOI] [PMC free article] [PubMed] [Google Scholar]
- 30.Lake BB et al. Neuronal subtypes and diversity revealed by single-nucleus RNA sequencing of the human brain. Science 352, 1586–1590 (2016). [DOI] [PMC free article] [PubMed] [Google Scholar]
- 31.Sun W et al. snRNA-seq reveals a subpopulation of adipocytes that regulates thermogenesis. Nature 587, 98–102 (2020). [DOI] [PubMed] [Google Scholar]
- 32.Paulo E et al. Sympathetic inputs regulate adaptive thermogenesis in brown adipose tissue through cAMP-Salt inducible kinase axis. Sci. Rep 8, 11001 (2018). [DOI] [PMC free article] [PubMed] [Google Scholar]
- 33.Coleman K, Hu J, Schroeder A, Lee EB & Li M SpaDecon: cell-type deconvolution in spatial transcriptomics with semi-supervised learning. Commun. Biol 6, 378 (2023). [DOI] [PMC free article] [PubMed] [Google Scholar]
- 34.Simcox J et al. Global analysis of plasma lipids Identifies liver-derived acylcarnitines as a fuel source for brown fat thermogenesis. Cell Metab 26, 509–522 (2017). [DOI] [PMC free article] [PubMed] [Google Scholar]
- 35.McCormack JG & Denton RM Evidence that fatty acid synthesis in the interscapular brown adipose tissue of cold-adapted rats is increased in vivo by insulin by mechanisms involving parallel activation of pyruvate dehydrogenase and acetyl-coenzyme A carboxylase. Biochem. J 166, 627–630 (1977). [DOI] [PMC free article] [PubMed] [Google Scholar]
- 36.Shimazu T & Takahashi A Stimulation of hypothalamic nuclei has differential effects on lipid synthesis in brown and white adipose tissue. Nature 284, 62–63 (1980). [DOI] [PubMed] [Google Scholar]
- 37.Trayhurn P Fatty acid synthesis in vivo in brown adipose tissue, liver and white adipose tissue of the cold-acclimated rat. FEBS Lett 104, 13–16 (1979). [DOI] [PubMed] [Google Scholar]
- 38.Guilherme A et al. Control of adipocyte thermogenesis and lipogenesis through β3-adrenergic and thyroid hormone signal integration. Cell Rep 31, 107598 (2020). [DOI] [PMC free article] [PubMed] [Google Scholar]
- 39.Broeders EPM et al. Thyroid hormone activates brown adipose tissue and increases non-shivering thermogenesis-a cohort study in a group of thyroid carcinoma patients. PLoS ONE 11, e0145049 (2016). [DOI] [PMC free article] [PubMed] [Google Scholar]
- 40.Weiner J et al. Thyroid hormone status defines brown adipose tissue activity and browning of white adipose tissues in mice. Sci. Rep 6, 38124 (2016). [DOI] [PMC free article] [PubMed] [Google Scholar]
- 41.Yeh WJ, Leahy P & Freake HC Regulation of brown adipose tissue lipogenesis by thyroid hormone and the sympathetic nervous system. Am. J. Physiol. Metab 265, E252–E258 (1993). [DOI] [PubMed] [Google Scholar]
- 42.Tan CY et al. Brown adipose tissue thermogenic capacity is regulated by Elovl6. Cell Rep 13, 2039–2047 (2015). [DOI] [PMC free article] [PubMed] [Google Scholar]
- 43.Westerberg R et al. ELOVL3 is an important component for early onset of lipid recruitment in brown adipose tissue. J. Biol. Chem 281, 4958–4968 (2006). [DOI] [PubMed] [Google Scholar]
- 44.Guilherme A et al. Neuronal modulation of brown adipose activity through perturbation of white adipocyte lipogenesis. Mol. Metab 16, 116–125 (2018). [DOI] [PMC free article] [PubMed] [Google Scholar]
- 45.Guilherme A et al. Adipocyte lipid synthesis coupled to neuronal control of thermogenic programming. Mol. Metab 6, 781–796 (2017). [DOI] [PMC free article] [PubMed] [Google Scholar]
- 46.Lodhi IJ et al. Inhibiting adipose tissue lipogenesis reprograms thermogenesis and PPARγ activation to decrease diet-induced obesity. Cell Metab 16, 189–201 (2012). [DOI] [PMC free article] [PubMed] [Google Scholar]
- 47.Lee S-H et al. Lack of stearoyl-CoA desaturase 1 upregulates basal thermogenesis but causes hypothermia in a cold environment. J. Lipid Res 45, 1674–1682 (2004). [DOI] [PubMed] [Google Scholar]
- 48.Foster DW Malonyl-CoA: the regulator of fatty acid synthesis and oxidation. J. Clin. Invest 122, 1958–1959 (2012). [DOI] [PMC free article] [PubMed] [Google Scholar]
- 49.McGarry JD, Leatherman GF & Foster DW Carnitine palmitoyltransferase I. The site of inhibition of hepatic fatty acid oxidation by malonyl-CoA. J. Biol. Chem 253, 4128–4136 (1978). [PubMed] [Google Scholar]
- 50.Jung SM et al. In vivo isotope tracing reveals the versatility of glucose as a brown adipose tissue substrate. Cell Rep 36, 109459 (2021). [DOI] [PMC free article] [PubMed] [Google Scholar]
- 51.Benador IY et al. Mitochondria bound to lipid droplets have unique bioenergetics, composition, and dynamics that support lipid droplet expansion. Cell Metab 27, 869–885 (2018). [DOI] [PMC free article] [PubMed] [Google Scholar]
- 52.Yu J et al. Lipid droplet remodeling and interaction with mitochondria in mouse brown adipose tissue during cold treatment. Biochim. Biophys. Acta 1853, 918–928 (2015). [DOI] [PubMed] [Google Scholar]
- 53.Benador IY, Veliova M, Liesa M & Shirihai OS Mitochondria bound to lipid droplets: where mitochondrial dynamics regulate lipid storage and utilization. Cell Metab 29, 827–835 (2019). [DOI] [PMC free article] [PubMed] [Google Scholar]
- 54.Fedorenko A, Lishko PV & Kirichok Y Mechanism of fatty-acid-dependent UCP1 uncoupling in brown fat mitochondria. Cell 151, 400–413 (2012). [DOI] [PMC free article] [PubMed] [Google Scholar]
- 55.Sárvári AK et al. Plasticity of epididymal adipose tissue in response to diet-induced obesity at single-nucleus resolution. Cell Metab 33, 437–453 (2021). [DOI] [PubMed] [Google Scholar]
- 56.Lee Y -H., Kim, S. -N., Kwon, H. -J. & Granneman, J. G. Metabolic heterogeneity of activated beige/brite adipocytes in inguinal adipose tissue. Sci. Rep 7, 39794 (2017). [DOI] [PMC free article] [PubMed] [Google Scholar]
- 57.Rosenwald M, Perdikari A, Rülicke T & Wolfrum C Bi-directional interconversion of brite and white adipocytes. Nat. Cell Biol 15, 659–667 (2013). [DOI] [PubMed] [Google Scholar]
- 58.Kong X et al. IRF4 is a key thermogenic transcriptional partner of PGC-1α. Cell 158, 69–83 (2014). [DOI] [PMC free article] [PubMed] [Google Scholar]
- 59.Alwarawrah Y et al. Fasnall, a selective FASN inhibitor, shows potent anti-tumor activity in the MMTV-Neu model of HER2+ breast cancer. Cell Chem. Biol 23, 678–688 (2016). [DOI] [PMC free article] [PubMed] [Google Scholar]
- 60.Rothwell NJ & Stock MJ Surgical removal of brown fat results in rapid and complete compensation by other depots. Am. J. Physiol. Integr. Comp. Physiol 257, R253–R258 (1989). [DOI] [PubMed] [Google Scholar]
- 61.Kong X et al. Brown adipose tissue controls skeletal muscle function via the secretion of myostatin. Cell Metab 28, 631–643 (2018). [DOI] [PMC free article] [PubMed] [Google Scholar]
- 62.Qing H et al. Origin and function of stress-induced IL-6 in murine models. Cell 182, 372–387 (2020). [DOI] [PMC free article] [PubMed] [Google Scholar]
- 63.Emmett MJ et al. Histone deacetylase 3 prepares brown adipose tissue for acute thermogenic challenge. Nature 546, 544–548 (2017). [DOI] [PMC free article] [PubMed] [Google Scholar]
- 64.Virtue S & Vidal-Puig A GTTs and ITTs in mice: simple tests, complex answers. Nat. Metab 3, 883–886 (2021). [DOI] [PubMed] [Google Scholar]
- 65.Bray NL, Pimentel H, Melsted P & Pachter L Near-optimal probabilistic RNA-seq quantification. Nat. Biotechnol 34, 525–527 (2016). [DOI] [PubMed] [Google Scholar]
- 66.R Core Team. R: A language and environment for statistical computing. R Foundation for Statistical Computing; http://www.R-project.org/ (2013). [Google Scholar]
- 67.Huber W et al. Orchestrating high-throughput genomic analysis with Bioconductor. Nat. Methods 12, 115–121 (2015). [DOI] [PMC free article] [PubMed] [Google Scholar]
- 68.Soneson C, Love MI & Robinson MD Differential analyses for RNA-seq: transcript-level estimates improve gene-level inferences. F1000Res 4, 1521 (2015). [DOI] [PMC free article] [PubMed] [Google Scholar]
- 69.Robinson MD, McCarthy DJ & Smyth GK edgeR: a Bioconductor package for differential expression analysis of digital gene expression data. Bioinformatics 26, 139–140 (2010). [DOI] [PMC free article] [PubMed] [Google Scholar]
- 70.Ritchie ME et al. limma powers differential expression analyses for RNA-sequencing and microarray studies. Nucleic Acids Res 43, e47 (2015). [DOI] [PMC free article] [PubMed] [Google Scholar]
- 71.Chen EY et al. Enrichr: interactive and collaborative HTML5 gene list enrichment analysis tool. BMC Bioinformatics 14, 128 (2013). [DOI] [PMC free article] [PubMed] [Google Scholar]
- 72.Kuleshov MV et al. Enrichr: a comprehensive gene-set enrichment analysis web server 2016 update. Nucleic Acids Res 44, W90–W97 (2016). [DOI] [PMC free article] [PubMed] [Google Scholar]
- 73.Xie Z et al. Gene set knowledge discovery with Enrichr. Curr. Protoc 1, e90 (2021). [DOI] [PMC free article] [PubMed] [Google Scholar]
- 74.Stuart T et al. Comprehensive integration of single-cell data. Cell 177, 1888–1902 (2019). [DOI] [PMC free article] [PubMed] [Google Scholar]
- 75.Hafemeister C & Satija R Normalization and variance stabilization of single-cell RNA-seq data using regularized negative binomial regression. Genome Biol 20, 296 (2019). [DOI] [PMC free article] [PubMed] [Google Scholar]
- 76.Finak G et al. MAST: a flexible statistical framework for assessing transcriptional changes and characterizing heterogeneity in single-cell RNA sequencing data. Genome Biol 16, 278 (2015). [DOI] [PMC free article] [PubMed] [Google Scholar]
- 77.Linderman GC et al. Zero-preserving imputation of single-cell RNA-seq data. Nat. Commun 13, 192 (2022). [DOI] [PMC free article] [PubMed] [Google Scholar]
Associated Data
This section collects any data citations, data availability statements, or supplementary materials included in this article.
Supplementary Materials
Data Availability Statement
All snRNA-seq and spatial transcriptomics data reported in here have been deposited in the Gene Expression Omnibus under accession number GSE218711. RNA-seq data are available at the sequence read archive under BioProject number PRJNA866352. The snRNA-seq data of BAT from human come from a published study31 with accession number E-MTAB-8564 as described in the snRNA-seq section in the methods. Source data are provided with this paper. All other data are available in the main text or the Supplementary Information.


