

Abstract
Background and Purpose:
Excitotoxicity due to mitochondrial calcium (Ca2+) overloading can trigger neuronal cell death in a variety of pathologies. Inhibiting the mitochondrial calcium uniporter (MCU) has been proposed as a therapeutic avenue to abrogate calcium overloading. Ru265 is a cell-permeable inhibitor of the mitochondrial calcium uniporter (MCU) with nanomolar affinity. Ru265 reduces sensorimotor deficits and neuronal death in models of ischemic stroke. However, the therapeutic use of Ru265 is limited by the induction of seizure-like behaviors.
Experimental Approach:
We examined the effect of Ru265 on synaptic and neuronal function in acute brain slices and hippocampal neuron cultures derived from mice, in control and where MCU expression was genetically abrogated.
Key Results:
Ru265 decreased evoked responses from calyx terminals and induced spontaneous action potential firing of both the terminal and postsynaptic principal cell. Recordings of presynaptic Ca2+ currents suggested that Ru265 blocks the P/Q type channel, confirmed by the inhibition of currents in cells exogenously expressing the P/Q type channel. Measurements of presynaptic K+ currents further revealed that Ru265 blocked a KCNQ current, leading to increased membrane excitability, underlying spontaneous spiking. Ca2+ imaging of hippocampal neurons showed that Ru265 increased synchronized, high-amplitude events, recapitulating seizure-like activity seen in vivo. Importantly, MCU ablation did not suppress Ru265-induced increases in neuronal activity and seizures.
Conclusions & Implications:
Our findings provide a mechanistic explanation for the pro-convulsant effects of Ru265 and suggest counter screening assays based on the measurement of P/Q and KCNQ channel currents to identify safe MCU inhibitors.
INTRODUCTION
Following neuronal depolarization, cytosolic Ca2+ is rapidly buffered by mitochondrial Ca2+ uptake. This Ca2+ sequestration shapes cellular signaling, and short-term plasticity (Billups and Forsythe 2002; Yang et al. 2021), and facilitates energy production (Ashrafi et al. 2020; Díaz-García et al. 2021; Groten and MacVicar 2022). However, excessive mitochondrial Ca2+ uptake causes toxic mitochondrial calcium overloading that opens a mitochondrial permeability transition pore resulting in cell death (Morciano et al. 2021). Neuronal mitochondrial Ca2+ overloading occurs with a variety of insults, including ischemia, neurodegeneration, and seizures (Jadiya et al. 2019; Woods and Wilson 2020). While data are limited, the suppression of neuronal mitochondrial calcium overloading shows promise as a therapeutic strategy to limit excitotoxic death (Britti et al. 2018; Angelova et al. 2019; Jung et al. 2020; Jadiya et al. 2021).
The MCU is a complex of proteins located in the inner mitochondrial membrane composed of a pore-forming subunit and multiple regulatory subunits (Arduino and Perocchi 2018; Alevriadou et al. 2021). Conditional knockout of the MCU protects against cell death due to mitochondrial calcium overloading (Rasmussen et al. 2015; Hamilton et al. 2018; Nichols et al. 2018). Similarly, reducing MCU expression in primary cultures of hippocampal neurons prevents glutamate-induced excitotoxicity (Qiu et al. 2013). Inhibiting expression of MICU3, a positive regulatory subunit expressed at high levels in the brain (Patron et al. 2019), also protects the brain from damage by a hemorrhagic stroke (Wang et al. 2023). Conversely, decreased expression of the negative regulator subunit MICU1 increases susceptibility to mitochondrial calcium overloading and causes perinatal lethality (Antony et al. 2016; Liu et al. 2016). MCUb, also a negative regulator of mitochondrial calcium uptake, is expressed in the brain, but the role of MCUb on mitochondrial calcium accumulation in neurons has yet to be examined (Raffaello et al. 2013; Lambert et al. 2019). Preferential ablation of the MCU in Thy1-expressing neurons at adulthood increases resistance to ischemic brain damage (Nichols et al. 2018). Thus, manipulations that transiently reduce MCU complex sensitivity to Ca2+ uptake are protective against mitochondrial calcium overload.
One translational impediment to reducing mitochondrial calcium overloading by blockade of the MCU complex is a paucity of selective antagonists. Early studies identified lanthanides and the cytological stain ruthenium red as potent inhibitors of the MCU in isolated mitochondria (Carafoli et al. 1974; Reed and Bygrave 1974). However, ruthenium red is nonselective and inhibits multiple classes of ion channels at micromolar concentrations, perhaps by blocking transmembrane channel pores (Pope et al. 2020). Ru360, originally identified as a component of ruthenium red, is more selective for MCU but lacks membrane permeability, limiting its utility in intact cells (Broekemeier et al. 1994; Matlib et al. 1998; Billups and Forsythe 2002). Compounds which bind MICU1 have not yet been tested in neurons (Arduino et al. 2017; Marco et al. 2020).
Ru265, a small bi-nuclear ruthenium compound similar in structure to Ru360, inhibits mitochondrial Ca2+ uptake in intact cells by blocking MCU with nanomolar affinity (Woods et al. 2019). Ru265 is water soluble and transported into cells by a ubiquitous organic cation transporter (Woods et al. 2020). Ru265 decreases mitochondrial Ca2+ overloading and is highly protective against ischemic neuronal cell death when present during the ischemic insult (Novorolsky et al. 2020). Although the injection of Ru265 at a dose of 3 mg/kg reduced ischemic brain injury, this compound induced seizure-like behaviours at a dose of 10 mg/kg and fatal convulsions at a dose of 30 mg/kg thus limiting its therapeutic use (Novorolsky et al. 2020).
To guide future rational design of MCU inhibitors, specifically those based on trivalent metal centers (e.g., La3+, Ru3+), identification of the “off-target” effects of Ru265 on excitable cells is crucial. Here, we characterized two disparate effects of Ru265 on synaptic and network activity: reduced synaptic transmission due to inhibition of P/Q type Ca2+ channels, and aberrant generation of action potentials due to inhibition of KCNQ-type K+ channels. These effects of Ru265 were not due to MCU engagement, as they persisted when the MCU was genetically inactivated. Our findings therefore indicate that MCU inhibition is not responsible for the induction of seizures by Ru265 and suggest that counter screens which detect P/Q-type Ca2+ and KCNQ-type K+ channel activities may be used to identify metal-based MCU inhibitors with a reduced risk of promoting seizures.
MATERIALS AND METHODS
Study Design
In general, studies were designed to generate groups of equal size, with experimental conditions interleaved during data generation. Experimenters were blinded to treatment condition where possible for analysis, and all other quantitative analysis was objectively applied across all data. The study was designed to use initial sample sizes with n>12 replicates for acute brain slice, based on a priori power analysis with alpha = 0.05, beta =0.8, and effect size > 0.75, consistent with our prior work. For in vitro and in vivo experiments, n>6 and n>5 replicates were designed. Experimental replicates in almost all cases were reduced due to attrition during recordings where control recordings and treatment conditions were applied in the same cell. Independent experimental replicates (n) are counted as per animal, per cell, or per biological replicate as described below. Only conditions where n > 5 were used for statistical analysis. Additional experimental replicates were not added due to difficulty of long time-course experiments, and to limit unnecessary use of animals.
Reagents
All salts and compounds were purchased for commercial vendors at high purity. Ru265’ and Ru360’ were synthesized and characterized as previously described (Nathan et al. 2017; Woods et al. 2019).
Animals
To investigate the cause of seizure behaviors observed due to Ru265 (Figure 1), acute brain slices and primary neuronal cultures from mouse were required. All animals were used in accordance with animal welfare protocols approved by the University of Nevada, Reno, or Dalhousie University and according to US standards for animal research to minimize pain and distress (Guide for the Care and Use of Laboratory Animals 2011). Homozygous floxed MCU mice (MCUfl/fl, Kwong et al. 2015, RRID:IMSRJAX:029817) and Thy1-Cre mice (Young et al. 2008) of both sexes were used to allow genetic deletion of MCU and isolate off-target effects. Colonies were maintained locally as homozygous lines and bred as described below. Animals were housed under 12/12 hr light/day cycle, provided ad libitum access to water and maintained on standard mouse chow in a specific pathogen-free facility.
Figure 1. Ru265 increases the frequency of seizure-like behaviors.

Ru265 causes minor seizures within 60 min, and severe seizures after 90 min in both WT and MCU-KO mice. Seizures were measured by visual observation and reported as number of events per 30 min interval. Shown are exploratory data (mean ± SD) for six mice per group. Mild seizure incidence both genotypes are significant at all timepoints after 30 minutes. Severe seizures were significant for both genotypes after 90 minutes.
Measurements of seizure-like behaviors
Mice expressing a Thy1-cre/ERT2-eYFP construct were crossed with C57/Bl6 MCUfl/fl mice to generate Thy1-cre/ERT2-eYFP+/−/ MCUfl/fl (Thy1-MCUfl/fl) animals. MCU deletion in Thy1-MCUfl/fl mice was induced at 8–10 weeks of age by oral administration of tamoxifen (80 mg/kg, once daily for 5 days), as previously described, resulting in >50 % loss of MCU expression in forebrain measured after three weeks (Thy1-MCUKD, Nichols et al. 2018). Male five-month old Thy1-MCUKD mice, along with Thy1-cre/ERT2-eYFP mice (Thy1 controls), were administered an intraperitoneal (i.p.) injection of Ru265 (10 mg/kg) dissolved in saline. Animals were then observed for 150 min by two raters blinded to the treatment conditions. The frequency of seizure-like behaviors resembling mild clonic seizures in the sitting position and severe clonic seizures (convulsions lasting 15 min or more) were measured using a revised Racine scale for mice (Erum et al. 2019). The frequency of mild or severe clonic seizures was reported as the number of observed events per 30 min interval. All mice were euthanized with an overdose of sodium pentobarbital (150 mg/kg, i.p.) at the completion of the experiments.
Generation of presynaptic-specific MCU knockdown mice (MCU-preKD)
CNS injection of neonatal mice followed protocols described elsewhere (Singh et al. 2018). Briefly, 1-day-old (P1) MCUfl/fl were anesthetized on ice for ~5 min until unresponsive, then fixed on a stereotaxic surgery platform. Anterior‐posterior axis was aligned between lambda and bregma. Dorsal-ventral axis was set so that the eyes and ears were aligned. The head was also fixed so that ear buds were aligned at the same height. The mice were injected with 1 μl of adeno-associated virus (AAV) encoding Cre-GFP (5.2×10¹³ particles/mL), or 2 uL of a 1:1 mix of AAV-cre-GFP and AAV-mito-LAR-GECO1.2 (2.4×10¹³ particles/mL; (Wu et al. 2014), using empirically determined stereotaxic coordinates targeting the ventral cochlear nucleus (VCN). The injection infected many cells in the VCN, and selectively infected contralateral calyx of Held presynaptic terminals. The virus was packaged by the University of Pennsylvania Vector Core. Coordinates used were (in mm): x = +1.40–1.50 (lateral), y = +2.3–2.5 (caudal), z = −2.5–3.0 (ventral), with x and y relative to lambda, and z relative to the surface of the skin. Afterward, mice were put on a heating pad (37°C) to recover, then returned to their home cage. Animals were used for experiments at 18–21 days after injection. Expression of AAV-Cre in infected neurons resulted in genetic deletion of MCU and loss of protein expression, called MCU-preKD (presynaptic knockdown) in Results. Infected cells and calyceal terminals were identified in slice recordings by GFP reporter fluorescence.
Acute brain slice preparation
Mice were rapidly decapitated and 150 or 200 μm‐thick transverse brainstem slices containing the medial nucleus of the trapezoid body (MNTB) were prepared using a vibrating blade microtome (VT 1200S, Leica Microsystems, Wetzlar, Germany), as previously described (Lujan et al. 2016). Slicing solution contained (in mM): 85 NaCl, 2.5 KCl, 1 glucose, 25 NaHCO3, 1.25 NaH2PO4, 75 sucrose, 0.5 CaCl2, 7 MgCl2, 3 myo‐inositol, 2 sodium pyruvate, 0.4 ascorbic acid; pH 7.4 when continuously bubbled with carbogen gas (95% O2–5% CO2). Slices were transferred to an incubation chamber containing recording artificial cerebrospinal fluid (ACSF; in mM): 125 NaCl, 2.5 KCl, 25 glucose, 25 NaHCO3, 1.25 NaH2PO4, 2 CaCl2, 1 MgCl2, 3 myo‐inositol, 2 sodium pyruvate, 0.4 ascorbic acid, 315–320 mOsm density, bubbled with carbogen gas (95% O2, 5% CO2) for 30–45 min at 37°C, and afterwards maintained at room temperature (~23°C) until used for recording.
Electrophysiology
Recordings were made from MNTB principal cells using a HEKA EPC10 amplifier controlled by PatchMaster software (HEKA Instruments, Holliston MA). Postsynaptic recordings were performed on 200 μm thick slices from MCU-fl and MCU-preKD mice at P18–21. Slices were transferred to a recording chamber on an upright microscope and perfused with recording ACSF continuously bubbled with carbogen at a rate of 1–2 ml/min at room temperature (23°C). For postsynaptic whole-cell voltage-clamp recordings in MNTB, ACSF buffer was augmented with (in μM) 50 APV, 10 bicuculline, and 0.5 strychnine to isolate AMPA receptor currents. Patch pipettes were fabricated from 2.0 mm outer diameter borosilicate capillary glass with open tip resistance of 2–3 MΩ. Voltage-clamp intracellular recording solution contained (in mM): 130 cesium gluconate, 10 CsCl, 5 sodium phosphocreatine, 10 HEPES, 5 EGTA, 10 TEA‐Cl, 4 Mg‐ATP, 0.5 GTP, 5 QX‐314, pH 7.2 and density 310–315 mOsm. Voltage‐clamped cells were held at −70 mV command voltage and were not corrected for liquid junction potential estimated at ~20 mV. Series resistance (Rs) was in all cases <10 MΩ and compensated so that residual Rs was ~0.5 MΩ throughout the recording (<94% compensation). Stimulation was delivered via midline bipolar electrode with 100‐μs biphasic pulses at 0.5 V over an experimentally determined threshold, usually <2.5 V. For “on-cell” recordings, recording electrodes were filled with ACSF and recordings made in current-clamp mode.
Presynaptic current and voltage recordings were made from calyx of Held terminals of P9–12 mice, using 150 μM thick slices containing MNTB. Presynaptic recordings had Rs<30 MΩ and were corrected for series resistance in voltage clamp recordings to ~8 MΩ residual resistance.
Voltage recordings from the presynaptic terminal were made in ACSF bath solution, using 5–7 MΩ pipettes filled with the following (in mM): 97.5 K-gluconate, 32.5 KCl, 10 HEPES, 1 MgCl2, 0.5 EGTA, 12 Na-phosphocreatine, 4 Mg-ATP. Recordings were discarded if leak current, checked intermittently in voltage-clamp mode, exceeded 150 pA at −80 mV holding potential. Recorded voltages were corrected for estimated liquid junction potential of +12.16 mV (LJPcalc, https://swharden.com/LJPcalc/).
Presynaptic ICa2+ and IK currents were recorded slices containing MNTB, as above. ACSF for ICa2+ recordings contained (in mM): 115 NaCl, 2.5 KCl, 10 glucose, 26 NaHCO3, 1.25 NaH2PO4, 2 CaCl2, 1 MgCl2, 3 myo‐inositol, 2 sodium pyruvate, 0.4 ascorbic acid, density 315–320 mOsm, bubbled with carbogen gas (95% O2, 5% CO2). ACSF was supplemented with 0.5 mM 4-AP, 10 mM TEA, 0.5 μM Strychnine, 10 μM bicuculline, and 1μM TTX to isolate voltage-gated calcium currents (Yamashita et al. 2010). Pipette solution for ICa2+ recordings contained (in mM): 130 Cs gluconate, 15 CsCl, 20 TEA-Cl, 5 Na-phosphocreatine, 10 HEPES, 4 MgATP, 0.3 GTP, and 10 mM EGTA to limit Ca2+-dependent channel inhibition (Forsythe et al. 1998). Pipette buffer was pH 7.4, 310–315 mOSm. For IK currents, bath solution was composed of (in mM): 125 NaCl, 2.5 KCl, 10 glucose, 25 NaHCO3, 1.25 NaH2PO4, 0.5 CaCl2, 2.5 MgCl2, 3 myo‐inositol, 2 sodium pyruvate, 0.4 ascorbic acid, 310–315 mOsm. The internal solution was composed of (in mM): 97.5 K-gluconate, 32.5 KCl, 10 HEPES, 1 MgCl2, 5 EGTA, pH 7.2 and density 315–317 mOsm, similar to prior reports (Wang et al. 1998; Dodson et al. 2003).
HEK293-F cells (Invitrogen 11625–019) were grown on poly-D-Lysine coated glass coverslips in a humidified incubator at 37°C and 5% CO2, using a high-glucose Dulbecco’s modified Eagle’s medium (Gibco 12800–017) supplemented with 10% heat-inactivated fetal bovine serum (FBS) and 1% non-essential amino acids (GIBCO 11140–050).Transient transfection of recombinant human Cav2.1 calcium channel α1 subunit (NCBI Ref. Sequence NM_000068.4) and ancillary subunits β4 and α2δ1 at a 1:1:1 molar ratio was performed using Turbofect Reagent (Thermo Scientific 01270256), according to the manufacturer protocol. Co-transfected green fluorescent protein (GFP) was used as expression reporter as previously described (Adams et al. 2009, 2010). Cells were transferred to a recording chamber (Warner Instruments RC-26) and perfused at ~1.5 ml/min with a solution containing 2 CaCl2, 1 MgCl2, 92 CsCl, 40 TEA-Cl, 10 HEPES and 10 Glucose (pH 7.4). Ru265 was prepared as a 2mM stock solution in water and an appropriate volume added to the bathing solution to the working concentrations. Borosilicate pipettes were filled with an internal solution containing (in mM): 105 CsMeSO4, 25 TEA-Cl, 11 EGTA, 10 HEPES, 1 CaCl2, 5 ATP-Mg and 0.4 GTP-Na, 3 Tris-phosphocreatine and 3 Na2-phosphocreatine (pH 7.2); electrode resistances were 2.7 to 3.8 MΩ.
HEK whole-cell currents were recorded at room temperature (22–24°C) using an Axopatch 200B (Molecular Devices) amplifier with the low-pass Bessel filter set at 2 KHz, and acquired with a Digidata 1322A System (Molecular Devices) at 10kHz using pClamp9 Software. Peak currents in response to a 30 ms voltage step to 0 mV from a holding potential of −100 mV, applied every 10 sec were recorded during bath application (up to 5 min) of Ru265 to obtain the time course of blockade. A p/4 protocol was used to subtract linear components. Series resistance was compensated by 70–75%.
Widefield imaging of mito-LAR-GECO1.2
Brain slices 200μm thick from WT (control) or homozygous MCUfl/fl (MCU-preKD) mice injected with 2μL of a 1:1 mix of AAV-Cre-GFP and AAV-mito-LAR-GECO1.2 were used for widefield fluorescence imaging at P17–23. Terminals were identified by presynaptic fluorescence from mito-LAR-GECO1.2, and GFP fluorescence. Recordings were performed at physiological temperature (33–35°C) in recording ACSF. Terminals were stimulated by extracellular midline electrode at high frequency (400Hz for 5 sec), and fluorescent signal from the low affinity Ca2+ indicator LAR-GECO1.2 targeted to the mitochondrial matrix was measured at 25 Hz, 39 ms exposure on an EMCCD camera (Hamamatsu EMCCD) at gain 25x, binned x2. Interleaved no stimulus controls were collected and used for baseline correction. Acquisition sweeps were separated by rest periods lasting >5 min.
Primary Hippocampal neuron culture
The isolation of hippocampus from animal and neuronal cultures were created and maintained as previously described (Swain et al. 2018). Neurons were obtained from embryonic brain at 18 days gestation from MCUfl/fl mice, following standard procedures. Briefly, mice were deeply anaesthetized with isoflurane until unresponsive, then killed by cervical dislocation. Embryos were removed from the uterus under sterile conditions. The hippocampi were isolated from embryos, cut into fine pieces, and triturated with a plastic pipette to dissociate. Dispersed cells were seeded onto high molecular weight PDL (70–150 kDa) coated coverslips in 24 well plates with Neurobasal Plus medium, with B‐27 supplement Plus, GlutaMAX‐I, and Antibiotic-Antimycotic (all from ThermoFisher Scientific; Waltham, MA, USA) at 120,000 cells/well, and maintained in sterile incubator at 37 Deg C, 5% CO2. One half of the media was replaced every two days. Neurons were infected with rAAV‐Cre‐mRuby virus (0.5 μL/well, ~1.7×10^13 GC/mL; (Singh et al. 2018) at DIV-3 to eliminate MCU expression. Uninfected neurons were cultured and collected in parallel as controls. Imaging was performed at 18 DIV, 15 days post-infection.
Protein detection of MCU
Forebrain neurons from MCU-fl mice were cultured at 120,000 cells/well in 24 well plates and harvested at 15–16 DIV. For MCU-KD, viral infection occurred at DIV3. Cells were pelleted at 4000 RCF for 20min at 4°C, then lysed in radio-immunoprecipitation assay buffer (RIPA) buffer (ThermoFisher Scientific; Waltham, MA, USA) supplement with protease/phosphatase inhibitors. Lysates were agitated for 30 minutes followed by centrifuged at 13000 RCF for 20 min at 4°C, to collect supernatant and stored at −80°C prior to further protein analysis. Protein concentrations of collected lysates were determined with Bradford protein assay on the day of analysis, allowing one freeze-thaw cycle.
Protein detection of lysate was performed using Jess Automated Western Blot System (ProteinSimple®, Bio-Techne, Minneapolis, MN, USA). Antibody diluent, blocking and washing buffers, plates, and capillary cartridges used the 66–440 kDa separation module (ProteinSimple®, Bio-Techne, Minneapolis, MN, USA). Experimental protocol followed the manufacturer’s instructions. Experimental detail below and analysis is provided to conform to journal requirements. Samples loaded at 25μg per channel. Anti-MCU monoclonal rabbit antibody (Cell Signaling Technology Cat# 14997, RRID:AB_2721812) and anti-β-actin monoclonal mouse antibody (Abcam Cat# ab8226; RRID:AB_306371) were used at 1:10 dilution . The anti-MCU chemiluminescence signal and anti-β-actin infrared (IR) signal were obtained by prediluted anti-rabbit secondary conjugated horseradish peroxidase (HRP) antibody and anti-mouse secondary IR antibody (Bio-Techne, Minneapolis, MN, USA, Cat# 043–822) at 1:20 dilution, respectively. The signal was visualized and areas corresponding to MCU and β-actin peaks were quantified in Compass software (ProteinSimple®, Bio-Techne, Minneapolis, MN, USA). All peaks were within the linear range of the software. MCU protein expression level per sample was normalized with β-Actin as loading control prior to comparison.
Calcium imaging with Fluo-4 dye
Hippocampal neurons were incubated for 5 hours with 10 μM bicuculline, 0.5 μM strychnine in neurobasal media to increase basal network activity (Samoilova et al. 2003), followed by 30 min incubation with 0.5 μM Fluo-4 dye (Molecular Probes, Life Technologies, Grand Island, NY) at 37°C, 5% CO2. After incubation, media was replaced with fresh neurobasal media with 10 μM bicuculline, 0.5 μM strychnine until used for imaging. Imaging was performed in HEPES-buffered Tyrode’s solution (plus bicuculline and strychnine) at 35°C and 5% CO2 in perfused bath. Fluo-4 was illuminated at 450–490 nm excitation by LED light engine (Lumencor SOLA, attenuated 80% by ND filter), and emission recorded at 500–550 nm. Cytosolic calcium oscillations were monitored using 20X water immersion objective (0.50 NA) on a Zeiss Upright Axio Examiner A1 imaging microscope at 50 fps (20 ms exposure). Images were captured on sCMOS camera (Photometrics Prime 95B) controlled by Visiview Software.
Data Analysis
Data and analysis comply with the recommendations and requirements of the journal for experimental design and analysis.
Electrophysiology data were analyzed in Igor Pro version 8, using custom scripts (Wavemetrics, Lake Oswego, OR), or using pClamp 11 and Origin2020b. Quantal analysis of spontaneous events was performed using a sliding-window thresholding algorithm, capturing events larger than 14 pA and excluding events with decay time constants longer than 10 ms. Events were classified as “big” if they were more than three times the average amplitude of the median quantal size from control recordings. Where indicated, data were normalized to initial values in recordings where control and treated conditions exist to account for expected variability between recordings at baseline. For example, initial EPSC amplitudes across all recordings from calyx of Held synapses were normally distributed (K2=5.412, P=0.0668, n=39 recordings, D’Agostino & Pearson test), but with amplitude range from 2.3 to 20 nA. All data from validated experiments were included, with no exclusion criteria for outliers.
Data from Ca2+ imaging experiments were analyzed using Fiji (Schindelin et al. 2012) and custom scripts in MATLAB (2022, Natick, Massachusetts: The MathWorks Inc.). The time profile from the images was obtained using Fiji. The data were corrected for photo bleaching using 2nd degree polynomial equation. To facilitate subsequent data analysis, xij is normalized by feature scaling () where xmax and xmin are the maximum and the minimum amplitudes of Fluo-4 intensity. Baseline fluorescence intensity of regions of interest prior to normalization was normally distributed (K2=4.656, P=0.0975, n=475 cells from 10 preparations, D’Agostino & Pearson test). Feature scaling was employed to enhance the spiking features of the dataset and facilitate comparison between replicates. Normalizing the data in this way enhances data analysis accuracy by mitigating the influence of varying scales. A semi-automated feature extraction method was used to estimate the spiking amplitude and spiking time profile. Feature extraction was based on two criteria. We considered the point as a peak when (1) the value is higher than set threshold value, and (2) the value is greater than its preceding value and succeeding value. The threshold was fixed for the whole population in an imaging series. This allows elimination of the noise level for each cell in each population (Swain et al. 2018).
Data presentation and statistical tests were performed in Prism (Version 9.5.1; Graphpad, La Jolla CA). Average data are presented as mean ± SD unless otherwise indicated. Paired statistical comparisons were performed using Student’s t-test. Comparisons of multiple groups at multiple timepoints used mixed-effects ANOVA followed by Dunnett’s multiple comparisons test. Statistical results are reported as p-value with significance at p<0.05, indicated by an asterisk in figures. Individual p-values are also reported in figure legends.
RESULTS
We employed multiple approaches to evaluate the effects of Ru265 on synaptic function at an identified synapse in acute brainstem slices, in primary neuronal cultures, and heterologously expressed channels. Together, these experiments identify Ru265-driven off-target effects on synaptic transmission and neuronal excitability. Further, we show that Ru265 effects on cell excitability are independent of the MCU, using post-mitotic knockdown of the MCU in neuronal cultures and in vivo. We elected to use a genetic knockdown approach over a global knockout model for two reasons. First, we showed previously that MCU-KO mice did not show neuroprotection in a hypoxia-ischemia model, indicating compensatory mechanisms may act to bypass the role of MCU (Nichols et al. 2017). Second, we were able to generate cultures of MCU-expressing and MCU-KD (via AAV cre-mediated deletion) neurons side-by-side, thus checking for culture viability, which can be variable.
Ru265 causes seizure-like activity independent of neuronal MCU
Ru265 is a selective, cell-permeable ruthenium complex inhibitor of mitochondrial calcium uptake, inhibiting the channel-forming mitochondrial calcium uniporter (MCU; (Woods et al. 2019). Treatment with Ru265 reduces brain injury in vivo following hypoxia/ischemia (Novorolsky et al. 2020). However, a neuroprotective dose of Ru265 also increases the frequency and duration of seizure-like behaviors when administered systemically. We administered injections of Ru265 to five-month old male WT mice and Thy1-MCU deficient mice at a dose of 10mg/kg (i.p.) because this dose produced clear seizure activity about an hour post injection in WT mice, as described previously (Novorolsky et al. 2020). There were no differences observed in the frequency or severity of seizures or seizure activity between WT and conditional MCU knockout mice (P=0.9136 two-way ANOVA versus genotype, n=6 mice per group), though incidence of mild seizures were clearly elevated by Ru265 (P<0.0001, two-way ANOVA versus time; Figure 1).
Ru265 alters the synaptic activity of MNTB neurons
To identify the effects of Ru265 on synaptic transmission including any off-target effects, we examined synaptic transmission using recording from an identifiable synaptic preparation, the glutamatergic calyx of Held synapse. This axosomatic synapse has identifiable, single axonal inputs, is quiescent at rest, and is amenable to multiple recording configurations in an acute brain slice preparation (Baydyuk et al. 2016). First, we used postsynaptic whole-cell voltage clamp recordings to determine whether the effects seen in vivo can be replicated at the synaptic level. Further, to confirm whether any effects were due to MCU inhibition, we performed parallel experiments in brain slices where MCU was genetically eliminated in the presynaptic terminal (MCU-preKD).
To test for effects on glutamatergic transmission at this well-characterized synapse, Ru265 was perfused via bath solution during whole-cell voltage-clamp recording from MNTB neurons from MCUfl/fl mice, which served as wild type controls. We elected to use 10 uM Ru265 in bath solution, similar to the effective preventative dose used previously in primary neuronal cultures (Novorolsky et al. 2020). Stimulation of axons in the ventral stria efficiently elicits orthodromic action potentials at the calyx terminal, resulting in highly synchronized excitatory postsynaptic currents (EPSC) in the innervated principal neuron of the MNTB. When stimulated at low frequency (0.1 Hz) in 2mM Ca2+ ACSF, evoked EPSC amplitude was decreased by persistent exposure to 10 μM Ru265, similar to the concentration used in cell-based protection studies (Novorolsky et al. 2020), over the course of extended recordings up to 130 min (Fig 2A). Initial EPSC amplitudes were normalized to account for natural variation between recordings, and linearly decreased after exposure of 10 μM Ru265. EPSC amplitude reduced to 9.4 ± 3.1% of control EPSC amplitude at 130 min (slope = −0.008 min−1, Fig 2B). Due to the extended nature of the recordings (>2 hours) some attrition in the number of recordings was observed. Where sufficient number of replicates were available, we saw a decrease in EPSC amplitude versus 10 minutes time point after 20 minutes exposure to 10 μM Ru265 (P<0.0001 by mixed-effects ANOVA followed by Dunnett’s multiple comparison tests). Surprisingly, after prolonged exposure to 10 μM Ru265, asynchronous events were also observed, which are almost never present in this acute brain slice preparation (Fig 2A, blue trace).
Figure 2. Effect of 10 μM Ru265 on synaptic transmission at MNTB principal neurons.

(A) Single evoked responses decrease in 10 μM Ru265. Top, Example traces from 0.1 Hz stimulation at the calyx of Held. Prolonged exposure to Ru265 significantly decreased EPSC amplitude. Bottom, traces normalized to peak value, illustrating development of spontaneous activity, but no change in evoked EPSC kinetics.
(B) EPSC amplitude was inhibited by 10 μM Ru265 (mean ± SD, remaining n are indicated per time point), and was inhibited >90% by the end of the recording period (130 min). Dotted lines represent 95% CI of a linear fit to the data. *P<0.05 Dunnett’s multiple comparison test compared to 10 minute time point.
(C) Representative traces of spontaneous activity in control (black) and after 2 hours exposure to 10 μM Ru265 (red) in same recording. Note bursts of large spontaneous events in addition to small, quantal events in Ru265.
(D) Appearance of big events increased in frequency during Ru265 exposure (mean ± SD, n are indicated per time point). Inset shows examples of quantal events (black) and big events in Ru265 (red).
(E) Frequency of spontaneous near-quantal events is increased by Ru265 (mean ± SD, n are indicated per time point).
(F) Short-term plasticity at 300 Hz is altered by 10 μM Ru265. Representative traces from the same cell are shown in response to brief (500 ms, 300 Hz) stimulation trains.
(G) Summary of EPSC amplitudes during the stimulus train (mean ± SD).
We examined spontaneous activity at the calyx of Held to monitor these events, as well as determine any effects of Ru265 on quantal parameters. Strikingly, 10 μM Ru265 induced large, synchronized transmitter release events (Fig 2C, “big events”). These events, classified as being three times larger than quantal events (i.e., amplitude >260 pA), started around 80 min following Ru265 exposure, and were comparable in size to evoked responses (>1nA, see inset in Fig 2D, and Supplemental Figure S1). Big event frequency increased with time and reached a peak of 5.0 ±1.8 events per second by 130 min in 10 μM Ru265, but increase in frequency was not significant by mixed-effects ANOVA (Fig 2D). The frequency of spontaneous quantal release, classified as being smaller than three times the median response in control recordings across all replicates, also increased during this time. Control recordings showed 4.4 ± 2.1 events per second which peaked at 17.1 ± 11.0 events per second by 80 min, though not significant by mixed-effects ANOVA (Fig 2E); however, quantal size was unchanged relative to control (Supplemental Figure S1).
To evaluate whether Ru265 affected short-term synaptic plasticity, 500 ms trains at 300Hz were used to induce short-term depression. While initial EPSC amplitudes were decreased by 10 μM Ru265, steady-state transmission remained intact and similar in amplitude to control conditions (P>0.05 by mixed-effects ANOVA, Fig 2F–G). EPSC inhibition significantly slowed the speed of decay in EPSC size at 30 and 60 minutes following Ru265 exposure (P=0.0102 and 0.0186 by mixed effects ANOVA, respectively) indicating reduced SV pool depletion.
The onset of effect of 10 μM Ru265, especially the emergence of large asynchronous events, was highly variable in nature (Fig 2D–E). Incubation of slices in Ru265 for two hours prior to slice recordings were not tenable, as they did not show any synaptic activity (data not shown). To perform experiments more tractable for dissecting the underlying targets and mechanism of Ru265, we ran similar experiments at 50 μM Ru265, at the same concentration used previously for cell-based experiments (Woods et al. 2019; Novorolsky et al. 2020). Overall, the onset of effect at 50 μM Ru265 was faster but qualitatively similar to that for 10 μM Ru265 concentration (Figure 3). For example, synapses showed strongly reduced EPSC size within 20 min after exposure to 50 μM Ru265 (Fig 3A). EPSC inhibition was significant at all time points after 10 minutes (P<0.0001 by mixed-effects ANOVA), followed a single exponential (τ=7.8 s, Fig 3B), to 4.4 ± 1% at 60 min, and fully inhibited evoked responses by 90 min. Large, asynchronous events emerged within 40 min of exposure (see Fig 3A inset, and Fig 3C). These big events peaked in frequency at ~50 min with treatment of 50 μM Ru265 at 11.2 ± 3.6 events per second (P=0.0004 at 40 and P=0.0072 at 50 minutes after Ru265 exposure when compared to control by mixed-effects ANOVA followed by Dunnett’s multiple comparisons test). Average amplitude of these big events was 0.86 ± 1.9 nA at 50 minutes after Ru265 exposure (Fig 3D, and see Supplemental Figure S1). the frequency of spontaneous quantal release was also significantly increased from 6.0 ± 4.3 events per second to a peak of 37.1 ± 24.4 events per second by 60 min in 50 μM Ru265 (P<0.05 by mixed effects ANOVA followed by Dunnett’s multiple comparisons test, Fig 3E). Again, quantal size was not altered (Supplemental Figure S1). Like treatment with 10 μM Ru265, these big events were transient, and fully dissipated by 100 min. Short-term plasticity in 50 μM Ru265 also looked similar to that in 10 μM, with with faster onset of effect (Fig 3F–G). Decay of EPSC amplitudes was similar, but steady-state transmission transiently increased at 10 and 20 minutes following Ru265 exposure, compared to control (P<0.05 at these two time points by mixed-effects ANOVA followed by Dunnett’s multiple comparisons test). Since the effects of Ru265 were similar at 10 and 50 μM, but elicited with shorter incubation time, we used 50 μM Ru265 for subsequent experiments.
Figure 3. Effect of 50 μM Ru265 on synaptic transmission at MNTB principal neurons.

(A) Evoked transmission decreases quickly in 50 μM Ru265. Top, example traces from 0.1 Hz stimulation during a recording following exposure to 50 μM Ru265. Bottom, traces normalized to peak value, showing EPSC kinetics are not altered, and development of rampant spontaneous events.
(B) Inhibition of EPSC amplitude by 50 μM Ru265 (mean ± SD, n are indicated per time point) was complete by 90 min, and fit by a single exponential. Dotted lines represent 95% CI of a linear fit to the data. *P<0.05 by Dunnett’s multiple comparison test compared to 10 minute recording time point.
(C) 50 μM Ru265 induced large, synchronized spontaneous synaptic activity. Representative traces of spontaneous activity in control (black) and after 40 min exposure to 50 μM Ru265 (red) from same recording. Note bursts of large events, in addition to small quantal events.
(D) Ru265 elicited big events whose frequency peaked around 50 min (mean ± SD, n are indicated per time point). Inset shows example quantal events (black), and big events (red) after 50 min Ru265 exposure. *P<0.05 compared to control by mixed effects ANOVA followed by Dunnett’s multiple comparisons test.
(E) Frequency of spontaneous near-quantal events is increased by Ru265 (mean ± SD, n are indicated per time point). Frequency was significantly increased at all timepoints after addition of Ru265 between 10–60 minutes. *P<0.05 by mixed effects ANOVA followed by Dunnett’s multiple comparisons test.
(F) Short-term plasticity at 300 Hz is altered by 50 μM Ru265. Representative traces from the same cell are shown in response to brief (500 ms, 300 Hz) stimulation trains.
(G) Summary of EPSC amplitudes during the stimulus train (mean ± SD).
The effect of Ru265 on excitability is independent of MCU
To determine whether the effects caused by Ru265 are through the MCU or through engaging other synaptic molecular targets, we generated viral-mediated MCU-knockdown specifically in the calyx presynaptic terminal (MCU-preKD), using neonatal AAV-cre-GFP infection of neurons in the ventral cochlear nucleus of MCUfl/fl mice (Figure 4). Infection of bushy cells of the VCN and associated calyx terminals were identified by GFP fluorescence in acute slices. Co-expression of the mitochondrial targeted LAR-GECO1.2 permitted visualization of mitochondrial Ca2+ uptake during a high frequency stimulation train, which was completely blocked in MCU terminals expressing Cre-GFP by P17 (Figure 4A–B). Effective knockdown of MCU was also verified by measuring MCU protein in primary cortical neuron cultures. At DIV 3, neurons were infected with AAV-cre-RFP. By 13 days post-infection, less than 20% of MCU protein was present (Fig 4 C–D). These results illustrate effective elimination of MCU in cultures neurons and in vivo.
Figure 4: Viral mediated MCU knockdown eliminates activity-dependent presynaptic mitochondrial Ca2+ uptake.

(A) Presynaptic calyx terminals infected with AAV-Mito-LAR-GECO1.2 were stimulated at high frequency (400 Hz, 5 sec, grey area) to raise cytosolic Ca2+ and drive mitochondrial Ca2+ uptake. Shown are summary intensity recordings (mean ± SD) of fluorescence signal in control (WT, n=5, black) and MCU-preKD (n=7, magenta) terminals.
(B) Summary plot of maximum LAR-GECO1.2 intensity during stimulation. MCU-preKD terminals significantly inhibited mitochondrial Ca2+ uptake, relative to controls *P=0.0004, Student’s t-test.
(C) Capillary-based protein detection of primary neuronal culture lysate was used to determine loss of MCU by 13 days post-infection with AAV-Cre. Representaitve image of protein detection results showing beta-actin (green bands) and MCU (black bands) in MCU-fl cultures and MCU-KD cultures at DIV 16, treated with AAV-Cre on DIV 3. Bands shown are from the same blot and cropped for clarity.
(D) Summary of MCU protein expression as ratio of β-Actin in MCU-fl and MCU-KD cultures. n = 6 cultures each of control and MCU-KD from three independent experiments of MCU-fl mouse embryonic tissue. *P<0.0013 by paired t-test.
MCU-preKD showed evoked and spontaneous activity like controls; however, 50 μM Ru265 still induced similar defects in transmission (Figure 5). EPSC amplitude was decreased with a similar time course (τ=8.9 minutes, Fig 5A–B). The EPSC amplitude was inhibited to 12.2 ± 11.6% of initial EPSC amplitude after 50 min treatment (P<0.05 for all timepoints versus 10 minutes by mixed-effects ANOVA followed by Dunnet’s multiple comparisons test, Fig 5B). Ru265 induced spontaneous big events (Fig. 5C), reaching a frequency peak of 6.3 ± 5.6 events per second by ~40 min (P=0.0292 by mixed-effects ANOVA, followed by Dunnett’s multiple corrections test), with average amplitude ~1.2 nA (Fig 5D, and Supplemental Figure S1). Notably, these big events were eliminated by TTX (Fig 5C–E, green traces), suggesting they were both synaptic in nature and likely evoked by aberrant presynaptic action potentials. In addition, the frequency of spontaneous quantal release was significantly increased by 50 μM Ru265 from 8.71 ± 3.2 events per second to a peak of 33.2 ± 7.8 events per second at 60 min (P<0.05 for 20–50 minutes time points, by mixed-effects ANOVA followed by Dunnet’s multiple comparisons test; Fig 5E) and reduced to 11.0 ± 4.1 events per second by TTX (P=0.9474 versus control). Spontaneous quantal size was unchanged (Supplemental Figure S1). Short-term plasticity in MCU-preKD mice was altered in a similar manner by 50 μM Ru265 during high frequency stimulation, with reduced initial release, and intact steady-state transmission (P>0.05 by mixed-effects ANOVA, Fig 5F–G). In sum, these results suggest that Ru265 suppresses evoked synaptic transmission and enhances spontaneous synaptic activity, affecting processes independent of the MCU.
Figure 5. Effect of Ru265 (50 μM) is present in MCU-preKD.

(A) Ru265 inhibits evoked transmission in MCU-preKD. Top, Example traces from 0.1 Hz stimulation at during a recording following exposure to 50 μM Ru265 in MCU-preKD synapse. Bottom, traces normalized to peak value show EPSC kinetics are not altered, and spontaneous events appear.
(B) EPSC amplitude was strongly inhibited by 50 μM Ru265 (mean ± SD, n are indicated per time point). Inhibition was fit by a single exponential. Dotted lines represent 95% CI. *P<0.05 by Dunnett’s multiple comparison test versus 10 minutes.
(C) Ru265 induces asynchronous release in MCU-preKD. Representative traces of spontaneous activity in control (black) and after addition of 50 μM Ru265 (red). Note, addition of 1 μM TTX (green) blocks big events. Inset is expanded amplitude to better represent quantal events.
(D) Time course for onset of big events (mean ± SD, n are indicated per time point). Inset shows an example mEPSC in control (black), TTX (green, peak offset for clarity), and a big event from Ru265 (red). *P<0.05 by Dunnett’s multiple comparison test versus control.
(E) Time course of frequency of spontaneous near-quantal events (mean ± SD, n are indicated per time point). *P<0.05 by Dunnett’s multiple comparison test versus control.
(F) Short-term plasticity in MCU-preKD synapse is altered by 50 μM Ru265. Representative traces from the same cell are shown in response to brief (500 ms, 300 Hz) stimulation trains.
(G) Summary of EPSC amplitudes during the stimulus train (mean ± SD).
Extracellular Ru360 has no effect on synaptic transmission.
To validate that the effect on neuronal activity was specific to Ru265, and not a general feature of ruthenium-based compounds, we repeated experiments using Ru360’, a non-cell-permeable analog which also inhibits the MCU (Matlib et al. 1998; Nathan et al. 2017). Previous work has indicated that presynaptic dialysis of Ru360 specifically inhibits mitochondrial Ca2+ uptake at the calyx of Held (Billups and Forsythe 2002; Yang et al. 2021). Ru360’ was delivered at 50 uM in bath, but had no effect on transmission at the calyx of Held of WT mice (Figure 6). When stimulated at low frequency (0.1 Hz), evoked EPSC amplitude was slightly decreased by persistent exposure to 50 μM Ru360 over between 40 and 60 minutes (P<0.05 by mixed-effects ANOVA, followed by Dunnett’s multiple corrections test; Fig 6A), likely representing nonspecific “run-down” in long duration recordings at this synapse. The normalized EPSC amplitude linearly decreased after exposure of 50 μM Ru360 to 70.3 ± 5.5% of control EPSC amplitude at 60 min (slope = −0.008 min−1, Fig 6B). Unlike Ru265, Ru360 did not induce significant spontaneous big events as did Ru265 over 60 min exposure (Fig. 6C and Supplemental Figure S1). No changes in quantal size and only a moderate increase in frequency of spontaneous events were observed (Figure 6C, and Supplemental Figure S1). Short-term plasticity was slightly altered by 50 μM Ru360, with slowly reduced initial release at 60 min, instead of loss of initial EPSC for Ru265. Steady-state transmission was not impacted by Ru360 (Fig 6D–E). Comparison of decay time constants versus time for the four conditions tested indicate that EPSC amplitude decay was significantly slowed by 50 μM Ru265, relative to 10 μM Ru265 or 50 μM Ru360 (Fig 6F). Decay time constants were linearly fit versus exposure time. Both 10 μM Ru265 (open black circles), and 50 μM Ru360 (blue triangles) were adequately fit by a single line, whose slope did not differ between the two conditions. In contrast, the slopes for cells treated with 50 μM Ru265 were significantly steeper (P<0.05 by extra sum-of-squares test), either in control or MCU-preKD recordings were, indicating a specific effect of Ru265 at this concentration. Additionally, when EPSC amplitudes were evaluated after 50 minutes exposure to Ru265 or Ru360, a specific effect was seen for 50 μM Ru265 (P<0.0001, ANOVA followed by Dunnett’s multiple comparisons test; Fig 6G). Together, these results indicate the effects of Ru265 do not represent a nonspecific effect of Ruthenium-based compounds.
Figure 6. Effect of 50 μM Ru360 on synaptic transmission at MNTB principal neurons.

(A) Single evoked responses decrease in 50 μM Ru360. Top, Example traces from 0.1 Hz stimulation at the calyx of Held. Prolonged exposure to Ru360 slightly decreased EPSC amplitude. Bottom, traces normalized to peak value. No spontaneous activity was observed..
(B) EPSC amplitude was inhibited by 50 μM Ru360 <30% by the end of the recording period (60 min; (mean ± SD, n are indicated per time point). Dotted lines represent 95% CI to a linear fit of the data. *P<0.05 compared to 10 minutes time point.
(C) Representative traces of spontaneous activity in control (black) and after 40 minutes exposure to 50 μM Ru360 (red) in same recording. No large spontaneous events were observed in Ru360.
(D) Short-term plasticity at 300 Hz is altered by 50 μM Ru360. Representative traces from the same cell are shown in response to brief (500 ms, 300 Hz) stimulation trains.
(E) Summary of EPSC amplitudes during the stimulus train (n=6–9, mean ± SD).
(F) Comparison of changes in short term plasticity decay. Best-fit estimates for short-term EPSC decay are plotted with confidence intervals, per time point and treatment. Slopes for decay constants were significantly different for 50 μM Ru265 either in control or MCU-preKD recordings, indicated by *.
(G) EPSC amplitudes compared across treatments illustrate a specific and significant inhibition by 50 μM Ru265 in both control or MCU-preKD recordings. *P<0.05 by mixed effects ANOVA followed by Dunnett’s multiple comparisons test.
Ru265 induces spontaneous neuronal firing.
Spontaneous big events were large and synchronized, suggesting they were mediated by aberrant action potentials (APs) in the presynaptic calyx axon. To directly determine whether Ru265 affected neuronal firing, we performed extracellular on-cell recordings from MNTB synapses. Indeed, 50 μM Ru265 induced spontaneous AP-mediated firing in both the presynaptic and postsynaptic compartments after >20 min bath application (Figure 7). Midline stimulation elicited presynaptic APs followed by a postsynaptic AP. Presynaptic APs could occasionally be resolved in the rising phase of the response (Fig. 7A). As mentioned, spontaneous AP spikes almost never occur in this synaptic preparation of auditory brainstem; however, Ru265 resulted in spontaneous firing (Fig 7B). The complex wave forms occasionally consisted of a paired presynaptic AP and a postsynaptic AP, suggesting that Ru265 can induce a presynaptic AP which triggers a postsynaptic spike (Fig 7B, representative of 4 recordings). The delay between presynaptic spike and postsynaptic spike was approximately 0.5 ms, characteristic of this synapse. In addition, we also observed spontaneous activity from MNTB neurons, visualized as single postsynaptic spikes. These findings strongly suggest that spontaneous big events are due to aberrant neuronal firing. As such, Ru265 may increase intrinsic cell excitability, perhaps by depolarizing neuronal membrane or through ion channels (e.g., K-channels) that suppress presynaptic spiking.
Figure 7. Ru265 induces spontaneous cell spiking in both presynaptic calyx terminal and postsynaptic neuron.

(A) Stimulated action potential spike during an on-cell recording in control and after perfusion with Ru256 (50 μM) for >20 min. Change in amplitude is due to increased membrane seal during the recording. Asterisk (*) indicates stimulus artifact.
(B) Example on-cell recordings from MCU-preKD synapses. Top: control recording. Bottom: recording from same cell after exposure to Ru265 (50 μM). Spontaneous activity was observed in postsynaptic MNTB neurons as single postsynaptic spikes, or complex waveforms including a presynaptic spike followed by a postsynaptic spike (green boxes).
Ru265 alters presynaptic membrane excitability.
Extracellular on-cell recordings from principal neurons of the MNTB (Figure 7) indicated that Ru265 induced aberrant presynaptic AP firing leading to the spontaneous big events (Figures 2, 3 and 5). To gain insight into how Ru265 influences intrinsic excitability in calyx of Held presynaptic terminals, we performed voltage recordings in WT control mice. Consistent with the results above, 50 μM Ru265 induced spontaneous presynaptic action potential bursts after approximately 15 min (Fig 8A, representative of four recordings). Notably, subthreshold depolarizations starting at around 10 min following Ru265 exposure were also observed which then developed into action potentials.
Figure 8. Ru265 enhances presynaptic excitability in WT mice.

(A) Ru265 induced spontaneous, synchronous activity in the presynaptic terminal. Representative whole-cell voltage recordings from the same terminal at baseline (black) and after 10 minutes (blue) and 15 minutes (red) superfusion with 50 μM Ru265. Note analog depolarizations at 10 minutes followed by repetitive presynaptic action potentials.
(B) Ru265 increased the frequency of APs due to depolarizing current injection. Representative traces of voltage response to 250 pA current injection in control (black) and after addition of 50 μM Ru265 for 15 minutes (red) are shown.
(C) Summary data illustrating the number of spikes in response to current injection in control and Ru265-treated cells, in response to step current injections lasting 100 ms at 50 pA intervals (−50 pA to 400 pA; mean ± SD). *P=0.032 for Ru265 versus in cell control.
(D) Ru265 triggered multiple spikes following AP-like current injections. Representative traces of APs in control (black) and after addition of 50 μM Ru265 for 15 minutes (red) in response to a 600 pA current injection are shown. Note occurrence of rebound spikes following −100 pA injection after exposure to Ru265.
(E) Summary data illustrating the number of spikes in response to 1 ms depolarizing current injection at 100 pA intervals (−100 pA to 800pA; mean ± SD).
(F) First derivative (dV/dt) plotted against membrane potential to visualize AP shape, derived from 100 ms traces (in B, C). The AP threshold and shape were only modestly changed by Ru265.
(G) Presynaptic input resistance (RInput) was not altered by exposure to Ru265 ( mean ± SD, adjusted P>0.671, multiple t-test).
(H) Presynaptic resting membrane potential (Vm Rest) was not changed by Ru265 (mean ± SD, adjusted P>0.968, multiple t-test).
To further test whether membrane excitability was altered, we injected 100 ms depolarizing current steps immediately after establishing recording (<2 min) and after 15 min exposure of Ru265 (n=12, Fig 8B–C). The number of APs evoked by 250 pA current, which maximally stimulated control recordings, significantly increased from 12.2 ± 10.5 at baseline to 20.6 ± 10.4 events in Ru265 (P=0.0032, Paired t-test), indicating increased excitability. This difference was not seen in control recordings (P=0.750, paired t-test). Input-output curves also showed significant increases with Ru265 compared to time-matched controls (P=0.015, Šídák’s multiple comparisons test between Ru165 and control at 15 minutes, following ANOVA; Fig 8C). Similar effects of Ru265 were seen for short, AP-like injections of 1 ms depolarizing current, increasing AP spike number from 0.8 ± 0.4 at baseline to 6.1 ± 10.1 events in response to 600 pA current injection (n=12, P=0.096, Paired t-test; Fig 8D). The input-output curve for this stimulation protocol was significantly increased by Ru265 compared to time-matched controls (P<0.0001, Šídák’s multiple comparisons test between Ru165 and control at 15 minutes, following ANOVA; Fig 8E). Plotting the first differential of the voltage trace during 100 ms depolarizations (dV/dt) against voltage was used to examine the AP waveform (Fig 8F). Only minor changes in AP shape were induced by Ru265, namely a slightly greater AP amplitude, relative to baseline recordings. Importantly, the AP threshold did not appear to be altered (inflection point in traces ~−45 mV). Passive membrane properties, such as input resistance and resting membrane potential, were not affected by Ru265 (Fig 8G–H).
Ru265 inhibits KCNQ potassium currents.
The results clearly show that Ru265 induces spontaneous neuronal spiking. To determine underlying mechanisms, we recorded whole cell K+ currents (IK) from the presynaptic calyx terminal. The IK is very large at this synapse, and composed of at least three currents that contribute to neuronal excitability: a TEA-sensitive high voltage-activated current (IHT, predominantly Kv3.1 (Wang et al. 1998), a titustoxin-sensitive low threshold-activated current (ILT, predominantly Kv1.2, (Dodson et al. 2003), and a slowly-activating current present at moderate depolarizations (IKCNQ, likely Kv7.5, (Huang and Trussell 2011).
Soon after establishing the whole cell voltage clamp configuration on terminals (<2min), we recorded baseline K currents for total IK, ILT, and IKCNQ, then superfused the slices with 50 uM Ru265 for up to 25 min. We recorded total IK with a series of brief voltage depolarizations (200 ms from −80 to +60 mV, following a 30 ms prepulse at −100 mV to fully activate all channels) and observed no change in the current-voltage function with exposure to Ru265 for up to 20 min (Figure 9A–B, P>0.05 for mixed-effects ANOVA). Currents at baseline were highly variable (range 7.1 to 14 nA peak, n=12 recordings) and normalized to current recorded at +60 mV in baseline conditions per cell, to facilitate comparison. Using a short step depolarization from −80 to −20 mV allowed isolation of ILT (Wang et al. 1998). Bath exposure to Ru265 moderately inhibited ILT at 5 and 15 min but was not significant (Figure 9C–D). Following a previously established protocol (Huang and Trussell 2011), a 5 sec step depolarization from −80 to-40 mV was used to monitor IKCNQ (Figure 9E). IKCNQ was significantly and progressively inhibited starting after 5 min bath exposure to Ru265 (Figure 9F).
Figure 9: Ru265 inhibits KCNQ type potassium channels at calyx of Held presynaptic terminal.

(A) Example recording and stimulation template of total IK current from calyx of Held. Terminals were held at −80 mV, stepped to −100 mV for 30 ms to relieve inactivation, then stepped from −80 mV to +60 mV for 200 ms in 20 mV increments. Black traces are baseline recordings, red traces are taken from the same recording after 20’ bath superfusion with 50 μM Ru265.
(B) Current-voltage relationship from stimulation protocol in panel A. Traces are shown for average of n=12 recordings at baseline, and at various time points after addition of 50 μM Ru265. Due to attrition in recordings, n=4 cells at 20’ exposure. Currents were normalized to current recorded at +60 mV in baseline conditions, measured at 190–200 ms during step depolarization. P>0.05 by mixed-effects ANOVA.
(C) Example recording of ILT currents, and effect of Ru265. Terminals were stepped from −80 mV to −20 mV at baseline (black) and after 20’ exposure to bath Ru265 (50 μM, red).
(D) Summary data of effect of ILT protocol. Number of replicates are indicated next to symbols in plot. Currents were measured at 45–50 ms during step depolarization. P>0.05 by mixed-effects ANOVA.
(E) Example recording and stimulation template to isolate IKCNQ. Cells were held at −80 mV and stepped to −40 mV for 5 seconds. Shown are recordings from the same terminal at baseline (black trace), and after 20’ superfusion with 50 μM Ru265 (red trace).
(F) Summary data for IKCNQ recordings. Currents were measured at 4.5–5 sec during step depolarization, normalized to baseline. n=12 recordings at baseline and 5’ Ru265 exposure, 9 terminals at 10’, and 5 terminals at 15–20’ exposure to 50 μM Ru265. *P<0.05 by pairwise Dunnett’s multiple corrections test versus baseline.
Since ILT and IKCNQ act to suppress spiking activity, but do not contribute to the AP waveform, progressive inhibition of these K+ currents by Ru265 can explain the emergence of spontaneous spiking activity and synchronized spontaneous events observed in the MNTB recordings. Our results suggest a moderate impact of Ru265 on ILT/Kv1.2, with a significantly stronger suppression of IKCNQ/Kv7.5. Holding the presynaptic recordings for the long periods of time required is challenging and a significant attrition of successful recordings occurred. We therefore cannot rule out the possibility of selective rundown of ILT and IKCNQ though IHT currents were not affected. Though effects on channels were nearly immediate (~5 min), the emergence of spontaneous spiking events was slower, occurring only after ~20 min exposure to Ru265, suggesting cumulative and perhaps use-dependent inhibition of ILT and IKCNQ.
Ru265 inhibits presynaptic Ca2+ currents.
Ru265 also inhibited transmission at the calyx of Held synapse, a novel and surprising result (Figures 2,3, and 5). Since synaptic vesicle release is strongly dependent on Ca2+ influx into the presynaptic terminal, we examined the effect of Ru265 on Ca2+ currents at the calyx presynaptic terminal. The presynaptic voltage-gated calcium current (ICa) was monitored via voltage-clamp recordings from the calyx terminal in acute hindbrain slices of P9–12 mice. At this age, ICa is almost exclusively P/Q type channels (Cav2.1, (Ishikawa et al. 2005).
The membrane potential was depolarized from −80 mV command potential to +70 mV for 2 ms to fully activate voltage-gated Ca2+ channels, then to 0 mV for 2 ms to drive Ca2+ influx, before returning to resting potential. Current integrals of ICa were measured during the step depolarization to 0 mV, delivered once every 30 sec during bath application of 50 μM Ru265, for 15 min. ICa was inhibited by Ru265 and could be partially recovered by washing the compound out of the bath (Fig. 10A). The ICa current integral decreased from 1.48 ± 0.59 pC to 1.08 ± 0.54 pC in the presence of Ru265 (n=8 recordings, P=0.0005 by Dunnet’s multiple comparisons test; Fig 10B). This effect could be washed out in 10 min (1.26 ± 0.75 pC, n=5; P=0.130). Control recordings did not show any inhibition over at least the first 10 min (Renden and Gersdorff 2007); and data not shown). Similarly, direct intracellular application of 1 μM Ru265, by inclusion in the presynaptic recording pipette for up to 15 min, had no effect on the recordings (data not shown).
Figure 10: Ru265 inhibits presynaptic Ca2+ channels at calyx of Held.

(A) Example recording of ICa from presynaptic calyx terminal. Ru265 was added to bath immediately after establishing recording (~1 min) and washed out after 10 minutes exposure. Inset shows depolarization protocol, and example traces obtained at times indicated by colored symbols (average of 2–3 traces from one recording).
(B) Summary data of current integrals at baseline (Black, n=8), after 15 minutes exposure to 50 μM Ru265 (red, n=8), and following 10–15 minutes washout (open blue symbols, n=5). Ru265 significantly decreased ICa (*P<0.05, mixed effects ANOVA followed by Dunnet’s multiple comparisons test), which was reversed by washout.
(C) Current-voltage (IV) relationship of ICa was measured with 10 ms step depolarizations in control ACSF, after 15 minutes Ru265 exposure, and after 10–15 minutes washout. Ru265 inhibited peak ICa during depolarization step significantly near peak activation and influx.
(D) Repolarization (tail) currents from the same experiments were similarly inhibited by Ru265 at all step potentials permitting Ca2+ influx.
In separate experiments, a series of 10 ms duration step depolarizations from −70 to +50 mV were applied to explore whether Ru265 altered the voltage dependence of the presynaptic ICa. Currents at 0mV step depolarization at baseline were normally distributed (K2=1.667, P=0.4345, n=12 recordings, D’Agostino & Pearson test; range 0.54 to 1.6 nA) and normalized to peak current. Currents were significantly inhibited after 15 min exposure to 50 μM Ru265 near the peak voltage steps. For example, peak current during a −10 mV step was inhibited by 40 ± 15% (n=7 pairs, P=0.0175, by multiple paired t-test; Fig 10C). Tail currents were similarly inhibited (Fig 10D) with no effect on voltage dependence (not shown). These results suggest that Ru265 significantly inhibits presynaptic Ca2+ currents through interaction with an extracellular region of the P/Q-type channel. Ca2+ dependence of transmission at this synapse has cooperativity of 4–5 (Lou et al. 2005). Ru265 inhibited ICa by approximately 29% on average when normalized to initial currents, which predicts 74–81% decrease in EPSC amplitude. Inhibition of ICa by Ru265 thus fully explains the decrease in transmission both amplitude and onset observed in our recordings.
Ru265 inhibits P/Q-type hCav2.1
At P9, calyx presynaptic terminals express almost exclusively P/Q-type calcium channels (Cav2.1) with minor (<10%) contribution from N-type calcium channels (Iwasaki et al. 2000). To confirm Ru265 directly inhibited P/Q-type channels, we recorded ICa from HEK cells expressing human Cav2.1 and accessory subunits (Lee et al. 1999; DeMaria et al. 2001; Adams et al. 2010). Voltage-gated Ca2+ currents in these cells are almost completely mediated by Cav2.1 and are inhibited >90% by the specific Cav2.1 blocker ω-Agatoxin-IVA (Waheed 2015). Bath application of 1–10 μM Ru265 slowly and partially inhibited ICa following repetitive stimulation (30 ms step from −100 mV to 0 mV), with incomplete inhibition after five min exposure (Figure 11A). Dose-response of ICa inhibition by Ru265 at five min post-exposure showed >98% inhibition by 50 μM Ru265, and an IC50 ~2.5 μM (Fig 11B). Inhibition could be partially reversed by washout of Ru265 (<50% ICa recovery, data not shown). These results confirm that Ru265 inhibits ICa though Cav2.1 P/Q-type channels thus likely strongly suppresses synaptic transmission by limiting synchronized synaptic vesicle release. In both experimental preparations, we think it is unlikely that Ru265-mediated decreased ICa is due to Ca2+-dependent inactivation from accumulation of cytosolic Ca2+, as high concentrations of Ca2+ buffer (10–11 mM EGTA) were included in the patch pipette.
Figure 11: hCav2.1 calcium channels are inhibited by Ru265.
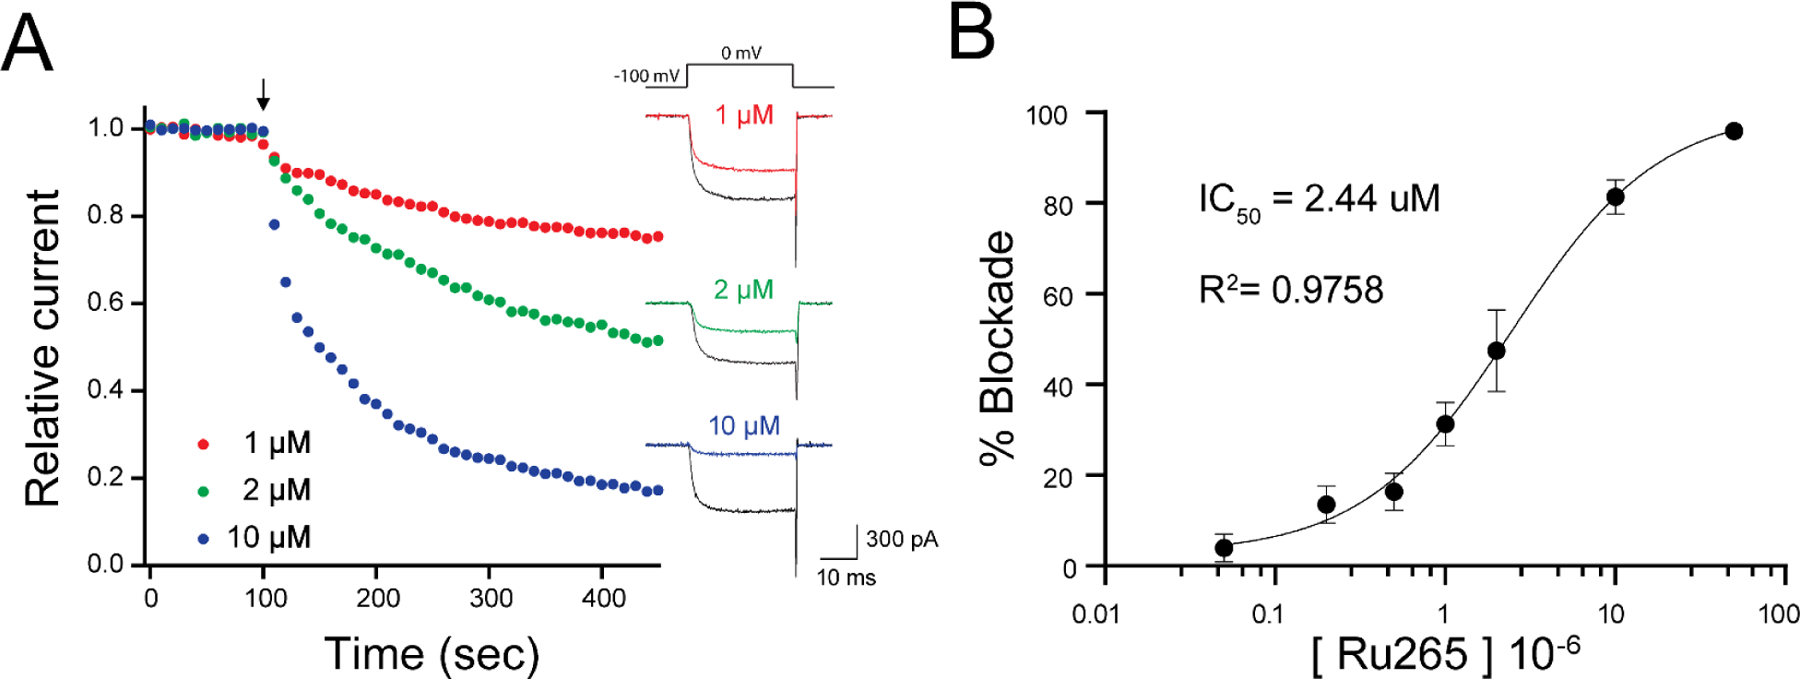
(A) Example time course of inhibition of hCav2.1 expressed in HEK cells by various doses of Ru265. Step depolarizations from −100 mV to 0 mV were delivered every 10 sec. Drug was bath applied at 100 sec (arrow). Example traces of baseline and inhibited ICa are shown at right.
(B) Dose-response of ICa inhibition at 3–5 minutes indicates IC50 for Ru265 ~ 2.5 μM in preliminary experiments. n=3–5 cells per dose, mean +/− SD are shown.
Ru265 synchronizes network activity in cultured hippocampal neurons.
To correlate the aberrant spiking activity observed in brainstem slices containing calyx of Held synapses (Figures 3 and 5) with behavioral seizures seen in Ru265-treated mice (Figure 1 and (Novorolsky et al. 2020), we monitored network activity in cultured primary hippocampal neurons. Somatic Ca2+ imaging with Fluo-4 was used as a proxy for electrical activity in neuronal cultures studied under widefield epifluorescence (Figure 12). In a field of view during recordings, 20–40 neuronal soma were identified and the frequency and amplitude of Ca2+ activity was measured before and after bath addition of Ru265 (Figure 12A). A feature extraction method that was used to estimate firing frequency and plotted as a raster scan showed a clear increase in neuronal firing immediately after the application of Ru265 (Figure 12B).
Figure 12. Ru265 increases network activity in MCUfl control neurons.

(A) Traces of somatic cytosolic Ca2+ signal in control hippocampal neurons, taken from a single experiment. Hatched vertical line indicates bath application of 50 μM Ru265. Cells are sorted by activity level at baseline.
(B) Raster plot of Ca2+ spiking pattern in cells from panel A, before and after drug. Drug was added at timepoint indicated by red hatched line.
(C) Single-cell activity is visualized as spike frequency (x-axis) and amplitude (z-axis). Shown is a single experiment from control mice. Activity in single cells following Ru265 (red dots) are translated forward on Y-axis for clarity, hatched black lines connect to activity at baseline (black dots).
(D) Summarized data from five neuronal populations in control cultures. Mean frequency is increased by Ru265 (pairwise t-test; *P=0.0013).
(E) Summary data of mean spiking amplitudes are also increased by Ru265 (pairwise t-test; *P=0.0105).
To illustrate the dynamics of this effect more holistically, we plotted frequency and mean event amplitude for each neuron before and after Ru265 treatment in a 3D scatter plot (Figure 12C). Notably, the activity of individual neurons collapsed to a more restricted range of frequency (basal range 0–29; Ru265 treated range 2–16) and amplitude (basal range 0.08–1; Ru265 treated range 0.7–0.9). We performed five biological replicates for reproducibility and observed that in all experiments Ru265 increased both overall firing frequency and amplitude (Figure 12D–E). Neuronal network activity was similarly altered by Ru265 in the cultures where MCU was knocked down (Supplementary Figure S2).
As a control, we exposed cultures to the membrane-impermeable MCU inhibitor Ru360’. Calcium imaging of neurons shows no effect of Ru360’ on spiking amplitude or frequency (Figure 13). This suggests that 50μM Ru265 alters neuronal network activity in primary hippocampal cultures by increasing mean spiking activity and synchronizing neuronal spiking across a local network.
Figure 13. Network activity was not affected by Ru360’.

(A) Traces of somatic cytosolic Ca2+ signal in control hippocampal neurons, taken from a single experiment. Hatched vertical line indicates bath application of 50 μM Ru360’. Cells are sorted by activity level at baseline.
(B) Raster plot representing Ca2+ spiking activity of single neurons from panel A, before and after drug application.
(C) Single-cell activity, visualized as spike frequency (x-axis) and amplitude (z-axis). Shown is a single experiment from control mice. Activity after Ru360’ treatment (red dots) are translated forward on Y-axis for clarity.
(D) Summarized data from five neuronal populations in control cultures. Mean frequency was not affected by Ru360’ (pairwise t-test: Not Significant; P=0.06).
(E) Summary data of mean spiking amplitudes showed no effect of Ru360’ (pairwise t-test: Not Significant; P=0.4339).
DISCUSSION
Although the suppression of mitochondrial Ca2+ uptake reduces ischemic injury in heart and brain, better MCU inhibitors are needed to realize this therapeutic approach. Ru265 shows promise in this regard, as this MCU inhibitor is transported across the cell membrane, but this compound produces seizure-like behaviors (Novorolsky et al. 2020; Woods et al. 2022; Huang and Wilson 2023). Identification of the mechanisms responsible for seizure induction by Ru265 is therefore crucial to the development of safer metal-based MCU inhibitors. In this regard, we describe the off-target effects of Ru265. Consistent with previous work (Novorolsky et al. 2020), we found that Ru265 produces seizure like-behaviours and show that MCU inactivation in Thy1-expressing neurons does not mitigate them. We have therefore gone on to identify the cellular mechanism responsible for Ru265-induced seizure-like behaviours.
In addition to the MCU, we have identified two major neuronal targets of Ru265. First, Ru265 caused aberrant neuronal spiking in hindbrain slices and network activity in primary hippocampal neuron cultures, with the most notable effect being due to inactivation of potassium channels. The inhibition of neuronal K+ channels, specifically KCNQ and low threshold K-currents, is not wholly unique, as K+ channel function is known to be disrupted by other Ru-based compounds. For example, ruthenium red and Ru360 inhibit K2P channels (Task3, TREK2, mTRAAK) by blocking the extracellular face of the ion selectivity pore (Braun et al. 2015; Pope et al. 2020). Secondly, Ru265 also inhibited synaptic P/Q-type (Cav2.1) voltage-gated Ca2+ channels, a mechanism not previously described for Ru-based MCU inhibitors. Ruthenium red has been shown to inhibit Ca2+ release from the sarcoplasmic reticulum by inhibiting ryanodine receptors and sarcolemmal Na+/Ca2+ exchange (Chamberlain et al. 1984; Gupta et al. 1988), but the suppression of voltage-gated Ca2+ channels has not been previously described. Our findings that Ru265 inhibits P/Q channel activity in both presynaptic terminals and heterologously expressed P/Q channels is therefore novel. Notably, neither of these effects were observed with Ru360 at similar concentration, suggesting they are specific to Ru265. In neurons, Ru265 thus has three independent targets that are engaged at micromolar concentration of compound, resulting in a complex effect on neuronal function: to inhibit aberrant mitochondrial Ca2+ uptake by blocking the MCU, increase neuronal firing by inhibiting KCNQ-type K+ channels, and concomitantly decrease synaptic neurotransmission by inhibiting P/Q-type Ca2+ channels. The IC50 for the inhibition of P/Q channel is 2.5 μM, which is about the same as the EC50 (5.0 μM) for in vitro neuroprotection (Novorolsky et al. 2020). These findings support our in vivo studies that the neuroprotective and pro-convulsant doses are similar.
While we did not examine interneuron function, we speculate that the activity of inhibitory interneurons may also be decreased by Ru265, reducing inhibitory tone and leading to runaway excitation resulting in seizure-like behaviors. We purposefully occluded inhibitory activity with bicuculline and strychnine pretreatment in primary cultures to encourage spontaneous activity and used these same inhibitors in calyx synapse recordings to isolate excitatory glutamatergic responses. Spontaneous spiking activity, which was transient in the hindbrain slices, centered around 10 Hz in both the neuronal cultures and hindbrain slices (Figs 3, 4, and 12). However, many inhibitory interneurons have tonic high frequency activity in the intact forebrain, much faster than 10 Hz, that actively limit seizure propagation (Cammarota et al. 2013; Hu et al. 2014). If inhibitory interneuron activity in brain seizure circuits becomes focused at ~10Hz by Ru265, and inhibitory output is reduced by inhibiting P/Q Ca2+ channels, that may also contribute to susceptibility of seizure-like behaviors.
Valence of off-target effects of Ru265
The inhibition of KCNQ K+ channels by Ru265 is detrimental to normal brain functioning and contributes to induction of seizures. Monogenic mutations in KCNQ channels (Kv7 family of channels, also called M-channels), are linked to epilepsy in human and animal models (Cooper 2010). Agonists for these channels have been pursued as antiepileptics (Raol et al. 2009). Specifically, loss of function mutations in KCNQ5 in humans and mice result in increased susceptibility to seizures (Wei et al. 2022). KCNQ5 (Kv7) are localized to axonal compartments (Hu and Bean 2018), so it is fortuitous we recorded from presynaptic terminals in this study. Our results suggest that assays based on the measurement of KCNQ K+ channel activity may be used to identify MCU inhibitors less likely to promote seizures.
A more complicated perspective exists regarding the “off-target” inhibition of Ca2+ channels by Ru265: is this effect detrimental, or potentially neuroprotective? P/Q -type channelopathies show that reduced Ca2+ channel activity can result in ataxia and both generalized and absence seizures in humans and mice (Zamponi et al. 2010). However, mouse mutants that exhibit inhibited P/Q-type channel activity, such as Rolling Nagoya or Leaner mice, are resistant to ischemic injury and cryo-mediated cellular damage (Mori et al. 2000; Tian et al. 2013; Kim et al. 2016). Similarly, P/Q-type channel antagonists have been promoted as neuroprotectants for decades (Small et al. 1995; Stefani et al. 1997; O’Neill et al. 2001). Thus, the ability of Ru265 to reduce ischemic neuronal death may be mediated in part by the inhibition of P/Q Ca2+ channel activity. However, because P/Q Ca2+ channel inhibition causes ataxia and seizures, it is an undesirable action of Ru265. We propose that further development of closely related Ru265 derivatives and other bimetallic-based MCU inhibitors intended to reduce ischemic damage should also closely monitor engagement of voltage-gated Ca2+ channels and aim to limit inhibition of these channels.
Limitations of this study
We have determined the identity of two additional molecular targets of Ru265, but there could be additional activity at other types of voltage-gated ion channels. We traced an effect of Ru265 on P/Q-type channels due to inhibited synaptic transmission. We do not believe other voltage-gated Ca2+ channels, such as somatically expressed L- or N-type, are significantly inhibited by Ru265 as primary neuronal cultures showed an increase in amplitude of somatic Ca2+ signal upon Ru265 exposure, likely due to influx through these voltage gated channels. Similarly, we identified an effect of Ru265 on KCNQ and low-threshold K+ channels in presynaptic recordings although additional low-threshold K+ channel targets may exist. Notably, neither resting membrane potential, AP shape, nor high threshold K+ currents were altered, suggesting no impact of Ru265 on voltage gated Na+ channels, and limited functional effect on K+ channel targets that set the membrane potential (e.g., Kv and Kir). As such, while Ru265 does not generally act as a non-selective ion channel antagonist, future experiments should also examine additional ionic conductances.
The time course of Ru265 effects on seizure-like behavior was mimicked in our brain slice experiments, with effects on neuronal spiking in brain slice, showing onset in 30–40 min after administration (Figs 1–5). Comparatively the Ru265-mediated change in activity in primary neuronal cultures occurred within a minute (Figs 12 and S2). As mentioned, network activity in cultures was enhanced by 5-hr pretreatment with bicuculline and strychnine, priming the environment for feedforward excitation. However, inhibitory inputs were similarly blocked in calyx of Held synaptic recordings, and effects on IKCNQ and spontaneous events were observed only after 10–15 min exposure to Ru265. Similarly, we do not fully understand mechanistically the antagonism of ICa in brain slice recordings and P/Q-HEK cells being slow, with time constants of ~8–10 min, and with incomplete inhibition even after 15 min (Fig 10 and 11). Ru265 effects on ion channels is presumably external, similar to other Ru-based compounds, as ICa was inhibited by Ru265 in the bath solution (Fig 10), but not when Ru265 was included in the patch pipette of presynaptic terminal recordings (data not shown). One possibility underlying the delay in effect is that Ru265 inhibits these ion channels through an activity-dependent mechanism. For example, in all experiments outlined above, progressive block was seen, potentially induced by the stimulation or step depolarization protocols used to assay synaptic or ion channel function. Additional protocols are needed to determine the precise mechanisms underlying ion channel interactions with Ru265.
We predict that while highly effective at suppressing ischemia-induced cell death, MCU inhibitors may have effects on cognitive behavior, which have yet to be thoroughly evaluated. For example, reducing MCU expression in haplo-insufficient mice increased the impact of high frequency firing on cytosolic Ca2+ load, and increased the magnitude of long-term potentiation (Devine et al. 2022). Brain-specific MCU loss reduced synchrony of hippocampal network oscillations and impaired learning behaviors (Bas-Orth et al. 2019; Rose et al. 2023). Thus, we speculate that specific, acute MCU inhibition may impair high-level cognitive performance, a potential concern for prophylactic development. Development of preferential and CNS penetrant MCU inhibitors will help address these concerns, and potentially offer an effective treatment to prevent cell death in heart and brain caused by ischemia.
Supplementary Material
What is already known:
Limiting mitochondrial calcium uptake is an effective target to limit neuronal death.
Ru265 inhibits the MCU and is neuroprotective but causes seizures in vivo.
What this study adds:
Ru265 specifically inhibits P/Q-type Calcium channels, inhibiting synaptic transmission.
Ru265 inhibits KCNQ-type Potassium channels, increasing intrinsic neuronal excitability and underlying proconvulsant effects in vivo.
Clinical Significance:
Seizure-inducing effects of Ru265 are not via activity at the MCU.
Limiting off-target effects of Ru265 facilitates development of effective MCU inhibitors.
Acknowledgements:
Holger Taschenberger for HEKA data import script into Igor Pro (bpc_ReadHeka). Marco Borges for peakdet Matlab macro.
Funding:
NSF 1943514, NIH NS117686 to R.R.; NSF 1750295 to JJW; Heart and Stroke Foundation of Canada (G-22-0031944) to GSR, Project Grant from the Canadian Institutes of Health Research to TPS, Dalhousie University Brain Repair Centre (Knowledge Translation Grant) to GSR.
Abbreviations:
- ACSF
artificial cerebrospinal fluid
- AP
action potential
- MCU
mitochondrial calcium uniporter
- MNTB
medial nucleus of the trapezoid body
- TEA
triethylamine
- VCN
ventral cochlear nucleus
Footnotes
Disclosures:
Peng Xu: None., Sarpras Swain: none, Robyn J Novorolsky: None, Esperanza Garcia: None, Joshua J Woods: None., Tracky Huang: None, Terrence P Snutch: None, Justin J Wilson: None, George S Robertson: None, Robert B Renden: None.
REFERENCES
- Adams PJ, Garcia E, David LS, Mulatz KJ, Spacey SD, Snutch TP. CaV2.1 P/Q-type calcium channel alternative splicing affects the functional impact of familial hemiplegic migraine mutations: Implications for calcium channelopathies. Channels. 2009;3(2):110–21. [DOI] [PubMed] [Google Scholar]
- Adams PJ, Rungta RL, Garcia E, Maagdenberg AMJM van den, MacVicar BA, Snutch TP. Contribution of calcium-dependent facilitation to synaptic plasticity revealed by migraine mutations in the P/Q-type calcium channel. Proc National Acad Sci. 2010;107(43):18694–9. [DOI] [PMC free article] [PubMed] [Google Scholar]
- Alevriadou BR, Patel A, Noble M, Ghosh S, Gohil VM, Stathopulos PB, et al. Molecular nature and physiological role of the mitochondrial calcium uniporter channel. Am J Physiol-cell Ph. 2021;320(4):C465–82. [DOI] [PMC free article] [PubMed] [Google Scholar]
- Angelova PR, Vinogradova D, Neganova ME, Serkova TP, Sokolov VV, Bachurin SO, et al. Pharmacological Sequestration of Mitochondrial Calcium Uptake Protects Neurons Against Glutamate Excitotoxicity. Mol Neurobiol. 2019;56(3):2244–55. [DOI] [PMC free article] [PubMed] [Google Scholar]
- Antony AN, Paillard M, Moffat C, Juskeviciute E, Correnti J, Bolon B, et al. MICU1 regulation of mitochondrial Ca2+ uptake dictates survival and tissue regeneration. Nat Commun [Internet]. 2016. Mar 9;7(1):10955. Available from: http://www.nature.com/articles/ncomms10955 [DOI] [PMC free article] [PubMed] [Google Scholar]
- Arduino DM, Perocchi F. Pharmacological modulation of mitochondrial calcium homeostasis. J Physiology. 2018;596(14):2717–33. [DOI] [PMC free article] [PubMed] [Google Scholar]
- Arduino DM, Wettmarshausen J, Vais H, Navas-Navarro P, Cheng Y, Leimpek A, et al. Systematic Identification of MCU Modulators by Orthogonal Interspecies Chemical Screening. Mol Cell. 2017;67(4):711–723.e7. [DOI] [PMC free article] [PubMed] [Google Scholar]
- Ashrafi G, Juan-Sanz J de, Farrell RJ, Ryan TA. Molecular Tuning of the Axonal Mitochondrial Ca2+ Uniporter Ensures Metabolic Flexibility of Neurotransmission. Neuron [Internet]. 2020. Feb 19;105(4):678–687.e5. Available from: https://linkinghub.elsevier.com/retrieve/pii/S0896627319309845 [DOI] [PMC free article] [PubMed] [Google Scholar]
- Bas-Orth C, Schneider J, Lewen A, McQueen J, Hasenpusch-Theil K, Theil T, et al. The mitochondrial calcium uniporter is crucial for the generation of fast cortical network rhythms. J Cereb Blood Flow Metab. 2019;40(11):2225–39. [DOI] [PMC free article] [PubMed] [Google Scholar]
- Baydyuk M, Xu J, Wu LG. The calyx of Held in the auditory system: Structure, function, and development. Hear Res [Internet]. 2016. Mar 25;338:22–31. Available from: http://linkinghub.elsevier.com/retrieve/pii/S0378595515301994 [DOI] [PMC free article] [PubMed] [Google Scholar]
- Billups B, Forsythe ID. Presynaptic Mitochondrial Calcium Sequestration Influences Transmission at Mammalian Central Synapses. J Neurosci [Internet]. 2002. Jul 15;22(14):5840–7. Available from: http://eutils.ncbi.nlm.nih.gov/entrez/eutils/elink.fcgi?dbfrom=pubmed&id=12122046&retmode=ref&cmd=prlinks [DOI] [PMC free article] [PubMed] [Google Scholar]
- Braun G, Lengyel M, Enyedi P, Czirják G. Sensitivity of K2P channels to ruthenium red. Brit J Pharmacol. 2015;172(7):1728–38. [DOI] [PMC free article] [PubMed] [Google Scholar]
- Britti E, Delaspre F, Tamarit J, Ros J. Mitochondrial calcium signalling and neurodegenerative diseases. Neuronal Signal. 2018;2(4):NS20180061. [DOI] [PMC free article] [PubMed] [Google Scholar]
- Broekemeier KM, Krebsbach RJ, Pfeiffer DR. Inhibition of the mitochondrial Ca2+ uniporter by pure and impure ruthenium red. Mol Cell Biochem. 1994;139(1):33–40. [DOI] [PubMed] [Google Scholar]
- Cammarota M, Losi G, Chiavegato A, Zonta M, Carmignoto G. Fast spiking interneuron control of seizure propagation in a cortical slice model of focal epilepsy. J Physiol. 2013;591(4):807–22. [DOI] [PMC free article] [PubMed] [Google Scholar]
- Carafoli E, Tiozzo R, Lugli G, Crovetti F, Kratzing C. The release of calcium from heart mitochondria by sodium. J Mol Cell Cardiol. 1974;6(4):361–71. [DOI] [PubMed] [Google Scholar]
- Chamberlain BK, Volpe P, Fleischer S. Inhibition of calcium-induced calcium release from purified cardiac sarcoplasmic reticulum vesicles. J Biol Chem. 1984;259(12):7547–53. [PubMed] [Google Scholar]
- Cooper EC. Potassium channels (including KCNQ) and epilepsy. Epilepsia. 2010;51(s5):10–10.20331704 [Google Scholar]
- DeMaria CD, Soong TW, Alseikhan BA, Alvania RS, Yue DT. Calmodulin bifurcates the local Ca2+ signal that modulates P/Q-type Ca2+ channels. Nature [Internet]. 2001;411(6836):484–9. Available from: http://www.ncbi.nlm.nih.gov/htbin-post/Entrez/query?db=m&form=6&dopt=r&uid=11373682 [DOI] [PubMed] [Google Scholar]
- Devine MJ, Szulc BR, Howden JH, López-Doménech G, Ruiz A, Kittler JT. Mitochondrial Ca2+ Uniporter haploinsufficiency enhances long-term potentiation at hippocampal mossy fibre synapses. J Cell Sci. 2022;135(22). [DOI] [PMC free article] [PubMed] [Google Scholar]
- Díaz-García CM, Meyer DJ, Nathwani N, Rahman M, Martínez-François JR, Yellen G. The distinct roles of calcium in rapid control of neuronal glycolysis and the tricarboxylic acid cycle. Elife. 2021;10:e64821. [DOI] [PMC free article] [PubMed] [Google Scholar]
- Dodson PD, Billups B, Rusznák Z, Szucs G, Barker MC, Forsythe ID. Presynaptic Rat Kv1.2 Channels Suppress Synaptic Terminal Hyperexcitability Following Action Potential Invasion. J Physiol [Internet]. 2003. May 30;550(1):27–33. Available from: http://www.jphysiol.org/cgi/doi/10.1113/jphysiol.2003.046250 [DOI] [PMC free article] [PubMed] [Google Scholar]
- Erum JV, Dam DV, Deyn PPD. PTZ-induced seizures in mice require a revised Racine scale. Epilepsy Behav. 2019;95:51–5. [DOI] [PubMed] [Google Scholar]
- Forsythe ID, Tsujimoto T, Barnes-Davies M, Cuttle MF, Takahashi T. Inactivation of Presynaptic Calcium Current Contributes to Synaptic Depression at a Fast Central Synapse. Neuron. 1998;20(4):797–807. [DOI] [PubMed] [Google Scholar]
- Groten CJ, MacVicar BA. Mitochondrial Ca2+ uptake by the MCU facilitates pyramidal neuron excitability and metabolism during action potential firing. Commun Biol. 2022;5(1):900. [DOI] [PMC free article] [PubMed] [Google Scholar]
- Guide for the Care and Use of Laboratory Animals. National Academies Press (US) [Internet]. 2011; Available from: http://www.nap.edu/catalog/12910 [PubMed] [Google Scholar]
- Gupta MP, Innes IR, Dhalla NS. Responses of contractile function to ruthenium red in rat heart. Am J Physiol. 1988;255(6 Pt 2):H1413–20. [DOI] [PubMed] [Google Scholar]
- Hamilton J, Brustovetsky T, Rysted JE, Lin Z, Usachev YM, Brustovetsky N. Deletion of mitochondrial calcium uniporter incompletely inhibits calcium uptake and induction of the permeability transition pore in brain mitochondria. J Biol Chem [Internet]. 2018. Oct 5;293(40):15652–63. Available from: http://eutils.ncbi.nlm.nih.gov/entrez/eutils/elink.fcgi?dbfrom=pubmed&id=30154242&retmode=ref&cmd=prlinks [DOI] [PMC free article] [PubMed] [Google Scholar]
- Hu H, Gan J, Jonas P. Fast-spiking, parvalbumin+ GABAergic interneurons: From cellular design to microcircuit function. Science. 2014;345(6196):1255263. [DOI] [PubMed] [Google Scholar]
- Hu W, Bean BP. Differential Control of Axonal and Somatic Resting Potential by Voltage-Dependent Conductances in Cortical Layer 5 Pyramidal Neurons. Neuron [Internet]. 2018. Mar 21;97(6):1315–1326.e3. Available from: 10.1016/j.neuron.2018.02.016 [DOI] [PMC free article] [PubMed] [Google Scholar]
- Huang H, Trussell LO. KCNQ5 channels control resting properties and release probability of a synapse. Nat Neurosci. 2011;14(7):840–7. [DOI] [PMC free article] [PubMed] [Google Scholar]
- Huang Z, Wilson JJ. Structure‐Activity Relationships of Metal‐Based Inhibitors of the Mitochondrial Calcium Uniporter. ChemMedChem. 2023;18(12):e202300106. [DOI] [PubMed] [Google Scholar]
- Ishikawa T, Kaneko M, Shin H, Takahashi T. Presynaptic N‐type and P/Q‐type Ca2+ channels mediating synaptic transmission at the calyx of Held of mice. J Physiol [Internet]. 2005. Oct 1;568(1):199–209. Available from: http://eutils.ncbi.nlm.nih.gov/entrez/eutils/elink.fcgi?dbfrom=pubmed&id=16037093&retmode=ref&cmd=prlinks [DOI] [PMC free article] [PubMed] [Google Scholar]
- Iwasaki S, Momiyama A, Uchitel OD, Takahashi T. Developmental Changes in Calcium Channel Types Mediating Central Synaptic Transmission. J Neurosci [Internet]. 2000. Jan 1;20(1):59–65. Available from: http://pubmed.gov/10627581 [DOI] [PMC free article] [PubMed] [Google Scholar]
- Jadiya P, Garbincius JF, Elrod JW. Reappraisal of metabolic dysfunction in neurodegeneration: Focus on mitochondrial function and calcium signaling. Acta Neuropathologica Commun. 2021;9(1):124. [DOI] [PMC free article] [PubMed] [Google Scholar]
- Jadiya P, Kolmetzky DW, Tomar D, Meco AD, Lombardi AA, Lambert JP, et al. Impaired mitochondrial calcium efflux contributes to disease progression in models of Alzheimer’s disease. Nat Commun. 2019;10(1):3885. [DOI] [PMC free article] [PubMed] [Google Scholar]
- Jung H, Kim SY, Cecen FSC, Cho Y, Kwon SK. Dysfunction of Mitochondrial Ca2+ Regulatory Machineries in Brain Aging and Neurodegenerative Diseases. Frontiers Cell Dev Biology. 2020;8:599792. [DOI] [PMC free article] [PubMed] [Google Scholar]
- Kim TY, Yoshimoto T, Aoyama Y, Niimi K, Takahashi E. Analysis of the protective effects of a neuronal Cav2.1 calcium channel in brain injury. Neuroscience. 2016;313:110–21. [DOI] [PubMed] [Google Scholar]
- Kwong JQ, Lu X, Correll RN, Schwanekamp JA, Vagnozzi RJ, Sargent MA, et al. The Mitochondrial Calcium Uniporter Selectively Matches Metabolic Output to Acute Contractile Stress in the Heart. Cell Rep [Internet]. 2015. Jul 7;12(1):15–22. Available from: http://linkinghub.elsevier.com/retrieve/pii/S2211124715005859 [DOI] [PMC free article] [PubMed] [Google Scholar]
- Lambert JP, Luongo TS, Tomar D, Jadiya P, Gao E, Zhang X, et al. MCUB Regulates the Molecular Composition of the Mitochondrial Calcium Uniporter Channel to Limit Mitochondrial Calcium Overload During Stress. Circulation. 2019;140(21):1720–33. [DOI] [PMC free article] [PubMed] [Google Scholar]
- Lee A, Wong ST, Gallagher D, Li B, Storm DR, Scheuer T, et al. Ca2+/calmodulin binds to and modulates P/Q-type calcium channels. Nature. 1999;399(6732):155–9. [DOI] [PubMed] [Google Scholar]
- Liu JC, Liu J, Holmström KM, Menazza S, Parks RJ, Fergusson MM, et al. MICU1 Serves as a Molecular Gatekeeper to Prevent In Vivo Mitochondrial Calcium Overload. Cell Reports. 2016;16(6):1561–73. [DOI] [PMC free article] [PubMed] [Google Scholar]
- Lou X, Scheuss V, Schneggenburger R. Allosteric modulation of the presynaptic Ca2+ sensor for vesicle fusion. Nature [Internet]. 2005. May 26;435(7041):497–501. Available from: https://www.nature.com/articles/nature03568 [DOI] [PubMed] [Google Scholar]
- Lujan B, Kushmerick C, Banerjee TD, Dagda RK, Renden R. Glycolysis selectively shapes the presynaptic action potential waveform. J Neurophysiol [Internet]. 2016. Dec 1;116(6):2523–40. Available from: http://jn.physiology.org/lookup/doi/10.1152/jn.00629.2016 [DOI] [PMC free article] [PubMed] [Google Scholar]
- Mahfooz K, Singh M, Renden R, Wesseling JF. A Well-Defined Readily Releasable Pool with Fixed Capacity for Storing Vesicles at Calyx of Held. Sporns O, editor. PLoS Computational Biology [Internet]. 2016;12(4):e1004855. Available from: http://dx.plos.org/10.1371/journal.pcbi.1004855 [DOI] [PMC free article] [PubMed] [Google Scholar]
- Marco GD, Vallese F, Jourde B, Bergsdorf C, Sturlese M, Mario AD, et al. A High-Throughput Screening Identifies MICU1 Targeting Compounds. Cell Reports. 2020;30(7):2321–2331.e6. [DOI] [PMC free article] [PubMed] [Google Scholar]
- Matlib MA, Zhou Z, Knight S, Ahmed S, Choi KM, Krause-Bauer J, et al. Oxygen-bridged Dinuclear Ruthenium Amine Complex Specifically Inhibits Ca2+ Uptake into Mitochondria in Vitroand in Situ in Single Cardiac Myocytes*. J Biol Chem [Internet]. 1998. Apr 24;273(17):10223–31. Available from: http://eutils.ncbi.nlm.nih.gov/entrez/eutils/elink.fcgi?dbfrom=pubmed&id=9553073&retmode=ref&cmd=prlinks [DOI] [PubMed] [Google Scholar]
- Morciano G, Naumova N, Koprowski P, Valente S, Sardão VA, Potes Y, et al. The mitochondrial permeability transition pore: an evolving concept critical for cell life and death. Biol Rev. 2021;96(6):2489–521. [DOI] [PubMed] [Google Scholar]
- Mori Y, Wakamori M, Oda S ichi, Fletcher CF, Sekiguchi N, Mori E, et al. Reduced Voltage Sensitivity of Activation of P/Q-Type Ca2+ Channels is Associated with the Ataxic Mouse MutationRolling Nagoya (tgrol ). J Neurosci. 2000;20(15):5654–62. [DOI] [PMC free article] [PubMed] [Google Scholar]
- Nathan SR, Pino NW, Arduino DM, Perocchi F, MacMillan SN, Wilson JJ. Synthetic Methods for the Preparation of a Functional Analogue of Ru360, a Potent Inhibitor of Mitochondrial Calcium Uptake. Inorg Chem. 2017;56(6):3123–6. [DOI] [PubMed] [Google Scholar]
- Nichols M, Elustondo PA, Warford J, Thirumaran A, Pavlov EV, Robertson GS. Global ablation of the mitochondrial calcium uniporter increases glycolysis in cortical neurons subjected to energetic stressors. J Cereb Blood Flow Metab [Internet]. 2017;37(8):3027–41. Available from: http://eutils.ncbi.nlm.nih.gov/entrez/eutils/elink.fcgi?dbfrom=pubmed&id=27909264&retmode=ref&cmd=prlinks [DOI] [PMC free article] [PubMed] [Google Scholar]
- Nichols M, Pavlov EV, Robertson GS. Tamoxifen-induced knockdown of the mitochondrial calcium uniporter in Thy1-expressing neurons protects mice from hypoxic/ischemic brain injury. Cell Death Dis [Internet]. 2018. May 22;9(6):606–11. Available from: http://www.nature.com/articles/s41419-018-0607-9 [DOI] [PMC free article] [PubMed] [Google Scholar]
- Novorolsky RJ, Nichols M, Kim JS, Pavlov EV, Woods JJ, Wilson JJ, et al. The cell-permeable mitochondrial calcium uniporter inhibitor Ru265 preserves cortical neuron respiration after lethal oxygen glucose deprivation and reduces hypoxic/ischemic brain injury. J Cereb Blood Flow Metab [Internet]. 2020;40(6):1172–81. Available from: http://eutils.ncbi.nlm.nih.gov/entrez/eutils/elink.fcgi?dbfrom=pubmed&id=32126877&retmode=ref&cmd=prlinks [DOI] [PMC free article] [PubMed] [Google Scholar]
- O’Neill MJ, Hicks CA, Ward MA, Osborne DJ, Wishart G, Mathews KS, et al. LY393615, a novel neuronal Ca2+ and Na+ channel blocker with neuroprotective effects in models of in vitro and in vivo cerebral ischemia. Brain Res. 2001;888(1):138–49. [DOI] [PubMed] [Google Scholar]
- Patron M, Granatiero V, Espino J, Rizzuto R, Stefani DD. MICU3 is a tissue-specific enhancer of mitochondrial calcium uptake. Cell Death Differ [Internet]. 2019;26(1):179–95. Available from: http://www.nature.com/articles/s41418-018-0113-8 [DOI] [PMC free article] [PubMed] [Google Scholar]
- Pope L, Lolicato M, Minor DL. Polynuclear Ruthenium Amines Inhibit K2P Channels via a “Finger in the Dam” Mechanism. Cell Chem Biol. 2020;27(5):511–524.e4. [DOI] [PMC free article] [PubMed] [Google Scholar]
- Qiu J, Tan YW, Hagenston AM, Martel MA, Kneisel N, Skehel PA, et al. Mitochondrial calcium uniporter Mcu controls excitotoxicity and is transcriptionally repressed by neuroprotective nuclear calcium signals. Nat Comms [Internet]. 2013;4(1):2034. Available from: https://www.nature.com/articles/ncomms3034 [DOI] [PMC free article] [PubMed] [Google Scholar]
- Raffaello A, Stefani DD, Sabbadin D, Teardo E, Merli G, Picard A, et al. The mitochondrial calcium uniporter is a multimer that can include a dominant‐negative pore‐forming subunit. Embo J 2013;32(17):2362–76. [DOI] [PMC free article] [PubMed] [Google Scholar]
- Raol YH, Lapides DA, Keating JG, Brooks‐Kayal AR, Cooper EC. A KCNQ channel opener for experimental neonatal seizures and status epilepticus. Ann Neurol. 2009;65(3):326–36. [DOI] [PMC free article] [PubMed] [Google Scholar]
- Rasmussen TP, Wu Y, Joiner M ling A, Koval OM, Wilson NR, Luczak ED, et al. Inhibition of MCU forces extramitochondrial adaptations governing physiological and pathological stress responses in heart. Proceedings of the National Academy of Sciences [Internet]. 2015. Jul 21;112(29):9129–34. Available from: http://www.pnas.org/lookup/doi/10.1073/pnas.1504705112 [DOI] [PMC free article] [PubMed] [Google Scholar]
- Reed KC, Bygrave FL. The inhibition of mitochondrial calcium transport by lanthanides and Ruthenium Red. Biochem J 1974;140(2):143–55. [DOI] [PMC free article] [PubMed] [Google Scholar]
- Renden R, von Gersdorff H. Synaptic vesicle endocytosis at a CNS nerve terminal: faster kinetics at physiological temperatures and increased endocytotic capacity during maturation. J Neurophysiol [Internet]. 2007;98(6):3349–59. Available from: https://www.physiology.org/doi/10.1152/jn.00898.2007 [DOI] [PubMed] [Google Scholar]
- Rose HM, Ferrán B, Ranjit R, Masingale AM, Owen DB, Hussong S, et al. Mitochondrial calcium uniporter deficiency in dentate granule cells remodels neuronal metabolism and impairs reversal learning. J Neurochem. 2023; [DOI] [PMC free article] [PubMed] [Google Scholar]
- Samoilova M, Li J, Pelletier MR, Wentlandt K, Adamchik Y, Naus CC, et al. Epileptiform activity in hippocampal slice cultures exposed chronically to bicuculline: increased gap junctional function and expression. J Neurochem. 2003;86(3):687–99. [DOI] [PubMed] [Google Scholar]
- Schindelin J, Arganda-Carreras I, Frise E, Kaynig V, Longair M, Pietzsch T, et al. Fiji: an open-source platform for biological-image analysis. Nat Methods. 2012;9(7):676–82. [DOI] [PMC free article] [PubMed] [Google Scholar]
- Singh M, Denny H, Smith C, Granados J, Renden R. Presynaptic loss of dynamin-related protein 1 impairs synaptic vesicle release and recycling at the mouse calyx of Held. The Journal of Physiology [Internet]. 2018;596(24):6263–87. Available from: https://onlinelibrary.wiley.com/doi/abs/10.1113/JP276424 [DOI] [PMC free article] [PubMed] [Google Scholar]
- Small DL, Monette R, Mealing G, Buchan AM, Morley P. Neuroprotective effects of ω-Aga-IVA against in vitro ischaemia in the rat hippocampal slice. NeuroReport. 1995;6(12):1617–20. [DOI] [PubMed] [Google Scholar]
- Stefani A, Spadoni F, Bernardi G. Differential Inhibition by Riluzole, Lamotrigine, and Phenytoin of Sodium and Calcium Currents in Cortical Neurons: Implications for Neuroprotective Strategies. Exp Neurol. 1997;147(1):115–22. [DOI] [PubMed] [Google Scholar]
- Swain S, Gupta RK, Ratnayake K, Priyanka PD, Singh R, Jana S, et al. Confocal Imaging and k-Means Clustering of GABAB and mGluR Mediated Modulation of Ca2+ Spiking in Hippocampal Neurons. Acs Chem Neurosci. 2018;9(12):3094–107. [DOI] [PubMed] [Google Scholar]
- Tian X, Zhou Y, Gao L, He G, Jiang W, Li W, et al. Analysis of ischemic neuronal injury in CaV2.1 channel α1 subunit mutant mice. Biochem Bioph Res Co. 2013;434(1):60–4. [DOI] [PubMed] [Google Scholar]
- Waheed Z CHARACTERIZATION OF THE +SSTR AND ΔSSTR SPLICE VARIANTS OF THE CaV2.1 P/Q-TYPE VOLTAGE-GATED CALCIUM CHANNEL. THE UNIVERSITY OF BRITISH COLUMBIA; 2015. [Google Scholar]
- Wang J, Yang S, Li H, Shen H, Lu X, Li X, et al. Downregulation of mitochondrial calcium uptake family 3 attenuates secondary brain injury after intracerebral hemorrhage in rats. Exp Neurol. 2023;361:114302. [DOI] [PubMed] [Google Scholar]
- Wang LYY, Gan L, Forsythe ID, Kaczmarek LK. Contribution of the Kv3.1 potassium channel to high-frequency firing in mouse auditory neurones. The Journal of Physiology [Internet]. 1998. May 15;509 ( Pt 1):183–94. Available from: http://eutils.ncbi.nlm.nih.gov/entrez/eutils/elink.fcgi?dbfrom=pubmed&id=9547392&retmode=ref&cmd=prlinks [DOI] [PMC free article] [PubMed] [Google Scholar]
- Wei AD, Wakenight P, Zwingman TA, Bard AM, Sahai N, Willemsen MH, et al. Human KCNQ5 de novo mutations underlie epilepsy and intellectual disability. J Neurophysiol. 2022;128(1):40–61. [DOI] [PMC free article] [PubMed] [Google Scholar]
- Woods JJ, Lovett J, Lai B, Harris HH, Wilson JJ. Redox Stability Controls the Cellular Uptake and Activity of Ruthenium‐Based Inhibitors of the Mitochondrial Calcium Uniporter (MCU). Angewandte Chemie Int Ed. 2020;59(16):6482–91. [DOI] [PubMed] [Google Scholar]
- Woods JJ, Nemani N, Shanmughapriya S, Kumar A, Zhang M, Nathan SR, et al. A Selective and Cell-Permeable Mitochondrial Calcium Uniporter (MCU) Inhibitor Preserves Mitochondrial Bioenergetics after Hypoxia/Reoxygenation Injury. ACS Cent Sci [Internet]. 2019. Jan 23;5(1):153–66. Available from: http://pubs.acs.org/doi/10.1021/acscentsci.8b00773 [DOI] [PMC free article] [PubMed] [Google Scholar]
- Woods JJ, Novorolsky RJ, Bigham NP, Robertson GS, Wilson JJ. Dinuclear nitrido-bridged osmium complexes inhibit the mitochondrial calcium uniporter and protect cortical neurons against lethal oxygen–glucose deprivation. Rsc Chem Biology. 2022;4(1):84–93. [DOI] [PMC free article] [PubMed] [Google Scholar]
- Woods JJ, Wilson JJ. Inhibitors of the mitochondrial calcium uniporter for the treatment of disease. Curr Opin Chem Biol. 2020;55:9–18. [DOI] [PubMed] [Google Scholar]
- Wu J, Prole DL, Shen Y, Lin Z, Gnanasekaran A, Liu Y, et al. Red fluorescent genetically encoded Ca2+ indicators for use in mitochondria and endoplasmic reticulum. Biochem J [Internet]. 2014. Nov 15;464(1):13–22. Available from: http://eutils.ncbi.nlm.nih.gov/entrez/eutils/elink.fcgi?dbfrom=pubmed&id=25164254&retmode=ref&cmd=prlinks [DOI] [PMC free article] [PubMed] [Google Scholar]
- Yamashita T, Eguchi K, Saitoh N, Gersdorff H von, Takahashi T. Developmental shift to a mechanism of synaptic vesicle endocytosis requiring nanodomain Ca2+. Nat Neurosci [Internet]. 2010;13(7):838–44. Available from: http://www.nature.com/doifinder/10.1038/nn.2576 [DOI] [PMC free article] [PubMed] [Google Scholar]
- Yang CH, Lee K, Ho W, Lee S. Inter‐spike mitochondrial Ca2+ release enhances high frequency synaptic transmission. J Physiology. 2021;599(5):1567–94. [DOI] [PubMed] [Google Scholar]
- Young P, Qiu L, Wang D, Zhao S, Gross J, Feng G. Single-neuron labeling with inducible Cre-mediated knockout in transgenic mice. Nat Neurosci. 2008;11(6):721–8. [DOI] [PMC free article] [PubMed] [Google Scholar]
- Zamponi GW, Lory P, Perez-Reyes E. Role of voltage-gated calcium channels in epilepsy. Pflügers Archiv - European J Physiology. 2010;460(2):395–403. [DOI] [PMC free article] [PubMed] [Google Scholar]
Associated Data
This section collects any data citations, data availability statements, or supplementary materials included in this article.