


Abstract
Ruzotolimod (Toll‐like receptor 7 (TLR7) agonist, RG7854) is an oral, small molecule immuno‐modulator activating the TLR 7 and is being evaluated in patients with CHB. As with other TLR7 agonists, the study drug‐related adverse events of flu‐like symptoms have been reported in some participants during phase I studies with ruzotolimod. An exploratory analysis of the relationship between pharmacokinetic (PK)/pharmacodynamic (PD) and flu‐like symptoms was performed in participants from two phase I studies including both healthy volunteers and NUC‐suppressed CHB patients who received either single or multiple ascending doses of orally administered ruzotolimod. Linear and logistic regression were used to explore potential relationships between dose, flu‐like symptoms, PK, and PD. Generalized linear regression was performed to predict the probability of flu‐like symptoms of all intensities at different RO7011785 (the active metabolite of the double prodrug ruzotolimod) PK exposure. This analysis showed that single or multiple doses of ruzotolimod at ⩾100 mg, the immune PD (IFN‐α, neopterin, IP‐10, and the transcriptional expression of ISG15, OAS‐1, MX1, and TLR7) responses increase with the RO7011785 PK exposure, which increases linearly with the doses from 3 mg to 170 mg of ruzotolimod. The analysis also showed that the probability of flu‐like symptoms occurrence increases with PD responses (IFN‐α and IP‐10). Dose reduction of ruzotolimod can be an effective way to reduce the magnitude of PD response, thus reducing the probability of study drug‐related flu‐like symptoms occurrence at all intensity in the participants who are highly sensitive to PD activation and intolerant to flu‐like symptoms.
Study highlights.
WHAT IS THE CURRENT KNOWLEDGE ON THE TOPIC?
Toll‐like receptor 7 (TLR7) agonists have the potential to augment host immune responses and contribute to immune control of HBV. It may become part of a curative regimen aiming to achieve a CHB functional cure. The most frequent treatment‐related adverse events of TLR7 agonists were flu‐like symptoms, which are consistent with the mechanism of action of TLR 7 agonists.
WHAT QUESTION DID THIS STUDY ADDRESS?
The relationship between PK, PD, and probability of occurrence flu‐like symptoms following single and multiple doses of oral administration of ruzotolimod in healthy volunteers and patients with CHB.
WHAT DOES THIS STUDY ADD TO OUR KNOWLEDGE?
Dose reduction of ruzotolimod can be an effective way to reduce the magnitude of PD response, thus reducing the probability of study drug‐related flu‐like symptoms occurrence at all intensities in the participants who are highly sensitive to PD activation and intolerant to flu‐like symptoms.
HOW MIGHT THIS CHANGE CLINICAL PHARMACOLOGY OR TRANSLATIONAL SCIENCE?
The exploratory analysis results provided a rationale for the dose modification scheme of ruzotolimod in the further clinical development of ruzotolimod in combination with other antiviral agents.
INTRODUCTION
An estimated 296 million people were living with chronic hepatitis B infection in 2019, with 1.5 million new infections each year. 1 Among these, 20% of chronic hepatitis B (CHB) patients develop cirrhosis and hepatic decompensation, while 5% will develop hepatocellular carcinoma. 2 The ideal treatment goal for CHB is the achievement of a functional cure defined as sustained, undetectable HBsAg and undetectable HBV DNA with or without seroconversion to hepatitis B surface antibody after completion of a finite course of treatment. 3 While available therapies such as pegylated interferon alfa‐2a (PEG‐IFN) and oral nucleot(s)ides (NUC; e.g., tenofovir disoproxil, tenofovir alafenamide fumarate, or entecavir) can effectively inhibit HBV replication but requiring a life‐long treatment in the vast majority of cases, they lack the ability to eliminate covalently closed circular DNA (cccDNA) and reduce HBsAg concentrations. 1 , 2 , 4 , 5 , 6 , 7 For example, multiple phase III studies have reported that only 4.0% of patients became HBsAg negative following adefovir, tenofovir disoproxil fumarate or Peg‐IFN, or a combination of NUC therapy with Peg‐IFN. 7
The complex interactions between HBV and the host immune system drive the process of chronic HBV infection, 8 and appropriate innate and adaptive immune responses are necessary to control HBV. 9 Even though anti‐HBs antibodies have protective capacity and a defective humoral response has been implicated in HBV chronicity, the quantity and functionality of HBV‐specific B‐cell responses during HBV infection are still poorly understood. 10 The reactivation of HBV replication in a proportion of B‐cell depleted patients treated with rituximab supports a role in HBV control and the therapeutic efficacy of anti‐HBs antibodies has been shown with HBV transgenic mice. 10 Another important characteristic of CHB infection is T‐cell exhaustion. Increased circulating antigens or viral load in CHB stimulates an immunological environment rich in co‐inhibitory receptors, such as PD‐1/PD‐L1 and T‐regulatory cells, that contribute to persistent T‐cell exhaustion and loss of an appropriate immune response to HBV infection. 11 , 12 Thus, it has been hypothesized that T‐cell reactivation may be used as a strategy to eliminate HBV, by mounting an efficient immune response that results in viral clearance. Immunomodulation, via toll‐like receptor (TLR) agonists, has been associated with the activation of virus‐specific TLRs, leading to the production of interferon (IFN)‐α and ‐ß, both of which suppress viral replication. 5 , 13 Specifically, TLR7 agonists have been found to activate immune responses within the liver environment without causing systemic inflammation. 14 , 15 Stimulation of TLR7 increases the efficiency of adaptive immune responses by cross‐priming cytotoxic T lymphocytes and modulating the production of IFN‐α. TLR7 agonist also augments plasmacytoid dendritic cells(pDC)‐based antigen presentation and T‐cell responses. 16 , 17 , 18 , 19 , 20 , 21 , 22 , 23 Additionally, TLR7 is expressed by B lymphocytes, and activation results in polyclonal expansion and differentiation, thus enriching the humoral component of the adaptive immune response. 24 , 25 IFN‐α induces the transcription of IFN‐stimulated genes which inhibits HBV replication, and IFN‐α confers the epigenetic repression of cccDNA transcription and NK cell activation. 16 , 17 , 18 , 19 , 20 , 21 , 22 , 23 These data have led to the development of TLR7 agonists for the treatment of CHB, which may contribute to immune control of HBV and may be part of a curative regimen aiming to achieve CHB functional cure. 26 , 27 , 28 , 29 , 30
Ruzotolimod is an oral double prodrug of the TLR7‐specific agonist RO7011785 (the active metabolite of ruzotolimod) that is under phase II development in CHB patients. The prodrug approach was used for oral delivery to optimize bioavailability of the active TLR7 agonist RO7011785 and to reduce TLR7 activation in the gastrointestinal tract. Ruzotolimod has been evaluated in healthy volunteers and CHB patients in two phase I studies. 31 , 32 Other prodrugs of TLR7 agonists (RO6864018 and RO6870868) have been evaluated in healthy volunteers 33 , 34 , 35 and patients with chronic hepatitis C virus (HCV) infection. 36 , 37 In these studies, oral dosing of the TLR7 prodrugs had generally acceptable safety and tolerability, and upregulated biomarkers of TLR7 activation, including IFNs and IFN‐stimulated gene products. Taken together, these data suggest that oral delivery of an active TLR7 agonist by a prodrug route represents an appropriate therapeutic approach.
One of the most common adverse events associated with the mechanism of action for TLR7 agonists is the presence of flu‐like symptoms including fever, chills, headache, myalgia, nausea, and vomiting. Adverse events related to flu‐like symptoms associated with the TLR7 pathway activation at the predicted efficacious doses were observed in the phase I studies of ruzotolimod and the clinical studies of other TLR7 agonists in the healthy volunteers and patients with chronic hepatitis B or C, 31 , 32 , 33 , 34 , 35 , 37 , 38 , 39 , 40 , 41 , 42 , 43 and the number of subjects with measurable systemic IFN, mean IFN levels and the intensity of flu‐like symptoms increased with higher TLR7 agonist exposure. 34
In order to further investigate the relationship between PK, PD, and flu‐like symptoms, the exploratory analysis results from the pooled PK and PD data of the two ruzotolimod phase I studies (NP39305 and YP39553) in healthy volunteers and NUC‐treated CHB patients were reported.
METHODS
Studies included for analysis
This analysis assessed PK, PD, and safety data from two randomized, sponsor‐open, investigator‐blinded, subject‐blinded, phase I, placebo‐controlled trials (NP39305(NCT02956850) and YP39553(NCT03530917)) conducted with oral administration of the TLR7 agonist ruzotolimod. The design and results of these two studies have been published. 31 , 32
NP39305 was designed to assess the safety, tolerability, PK, and PD of oral ruzotolimod in two parts: (a) single‐ascending doses (SAD) and multiple‐ascending doses (MAD) of ruzotolimod/placebo in HVs and (b) multiple ascending doses (MAD) of ruzotolimod/placebo in CHB patients. MAD in HVs were given every other day (QOD) with a 2‐week duration while CHB patients were treated with QOD regimen for 6 weeks. The doses of ruzotolimod evaluated in this study ranged from 3 mg to 170 mg. The study enrolled 155 participants (110 healthy volunteers, 30 NUC‐treated patients with CHB and 15 treatment‐naive patients with CHB; aged 18–65 years) and with a body mass index between 18 to 32 kg/m2. The study was conducted at 18 sites in eight countries and was approved by independent ethics committees (EU, Hong Kong, and New Zealand), in compliance with the clinical study protocol, the International Council for Harmonization Good Clinical Practice and additional applicable regulatory approvals.
YP39553 assessed the safety, tolerability, PK, and PD of oral ruzotolimod using an SAD/MAD approach in 70 healthy Chinese participants with multiple ascending QOD doses given over a 2‐week interval. The doses of ruzotolimod evaluated in this study ranged from 40 to 170 mg and the participants ranged in age from 18–60 years, with a body mass index between 19 to 28 kg/m2. This study was conducted at the phase I Clinical Trial Center, The Chinese University of Hong Kong, Hong Kong SAR, China, and approved by the local ethics committee, in compliance with the clinical study protocol, the International Council for Harmonization Good Clinical Practice, and additional applicable regulatory approvals, including an umbrella Clinical Trial Application approved by the National Medical Products Administration of China. All participants provided written informed consent prior to any study‐related procedures in studies NP39305 and YP39553.
Analysis population
The analysis population for PK/PD relationship included 144 healthy volunteers in SAD (3–170 mg) and MAD (100–170 mg QOD, 2 weeks), and 24 NUC‐suppressed CHB patients (150 and 170 mg QOD, 6 weeks) who were treated with oral ruzotolimod in Studies NP39305 and YP39553. The exploratory analysis population for predicting the probability of flu‐like symptoms using RO7011785 PK exposure and immune PD biomarkers included 48 healthy volunteers in MAD (100–170 mg QOD, 2 weeks), and 24 NUC‐suppressed CHB patients (150 and 170 mg QOD, 6 weeks) treated with oral ruzotolimod. In study NP39035, the treatment‐naive CHB patients in Cohort 4 (Part 2) have not been included for the analysis since the timepoints of PD Sampling were different from the other cohorts.
Safety assessments
For studies NP39035 and YP39553, safety assessments included vital signs (blood pressure, pulse rate, respiratory rate, and body temperature), electrocardiograms, physical examination, laboratory safety variables, and adverse events (AEs). These were monitored throughout the study on scheduled visits and unscheduled visits. Laboratory abnormalities were based on hematology, clinical chemistry (including liver function tests), coagulation, and urinalysis test results.
PK/PD assessment
For all cohorts in studies NP39305 and YP39553, blood for PK determination for ruzotolimod, the main active metabolite RO7011785 and additional metabolites, including RO7018822 and RO7033805, were collected pre‐dose and at 0–48 h post‐dose on Day 1, Day 13 (only in the MAD portion) and Day 41 (only for CHB patients). Non‐compartmental analysis using WinNonlin 6.4 (Pharsight Corporation, Mountain View, CA, USA) was used to calculate PK parameters. Plasma concentrations of ruzotolimod and its metabolites were measured by a specific and validated liquid chromatography–tandem mass spectrometry method. Population PK analysis was conducted using a nonlinear mixed‐effect model (NONMEM version 4.4.1) program to analyze simultaneously the dose plasma concentration–time data of ruzotolimod and its main active metabolite RO7011785. The plasma concentration–time data of ruzotolimod and its main active metabolite RO7011785 were best described by a two‐compartment model with linear eliminations for both the prodrug and the active metabolite, with transit compartments for the parent absorption and a uni‐directional transformation rate from the central compartment of the parent to the central metabolite one. Subroutine ADVAN6 was used in NONMEM VERSION 7.4.1. Standard goodness of fit plots showed good descriptive performances of both ruzotolimod and active metabolite RO7011785 plasma concentration–time data, without any major bias. From this population PK analysis, the individual RO7011785 PK parameters, including AUCinf of each subject in studies NP39305 and YP39553 were derived. The set of individual PK parameters was used to create virtual subjects, sampling their individual PK parameters in that set of estimated ones, and to predict the distribution of AUCinf following a dose administration of either 100 mg, 125 mg, or 150 mg every other day (QOD). Individual PK parameters were assumed to be log‐normally distributed for both the prodrug and the active metabolite; the mean value as well as the associated between‐subject variability was estimated. For the PK model schematic figure, please see it in the Data S1.
Blood samples were analyzed for multiple biomarkers, including the protein markers (IFN‐α, IL‐12 p40, IL‐10, IP‐10, TNF‐α, IL‐6) as well as expression of ISG15, OAS‐1, MX1, and TLR7 mRNAs. Samples were analyzed using the Luminex X‐MAP Cytokine/Chemokine Magnetic Beads (Millipore, Burlington, MA, USA) kit, Simoa IFN‐α Advantage Kit (Quanterix, Billerica, MA, USA) and Brahms Neopterin ELISA kit (Thermo Fisher Scientific, B·R·A·H·M·S GmbH, Hennigsdorf, Germany), respectively. Fluidigm targeted gene expression analysis was performed via TaqMan assay panels: ISG15 (Hs01921425_s1), OAS1 (Hs00973637_m1), MX1 (Hs00895608_m1), and TLR7 (Hs01933259_s1) with PPIB (Hs00168719_m1) and GUSB (Hs00939627_m1) for normalization.
Exploratory analysis
This analysis intended to assess the PK/PD relationship in study participants following multiple doses of ruzotolimod in HVs and NUC‐treated CHB patients in two phase I studies, regardless of whether they experienced flu‐like symptoms or not. No formal hypothesis testing was conducted due to the limited sample size in each dose cohort. A descriptive summary of flu‐like symptoms was provided in Table 1.
TABLE 1.
Details of study participants experiencing flu‐like symptoms and those who withdrew due to AEs.
| np39305 (Global) | yp39553 (China) | |||||
|---|---|---|---|---|---|---|
| Number of patients | MAD (HVs) 140 mg (n = 8) | MAD (HVs) 170 mg (n = 8) | NUC‐treated CHB patients 150 mg (n = 16) | NUC‐treated CHB patients 170 mg (n = 8) | MAD (HVs) 150 mg (n = 16) | SAD (HVs) 170 mg (n = 8) |
| Number of participants experienced flu‐like symptoms (intensity) | 1 (Mild) | 2 (Mild) |
4 (Mild) 1 (Moderate) |
1 (Mild) 1 (Severe) |
3 (Mild) 5 (Moderate) |
1 (Mild) |
| Number of participants withdrew/discontinued due to AEs | 0 | 1 (Withdrew) | 1 (Withdrew) | 1 (Withdrew) |
7 (Discontinued a ) 1 (Withdrew) |
0 |
Abbreviations: CHB, chronic hepatitis B; MAD, multiple ascending doses; SAD, single‐ascending doses.
Seven subjects with flu‐like symptoms were discontinued due to lymphopenia(transient, which resolved completely later) by principal investigators, 5 of which had moderate flu‐like symptoms.
Exploratory analysis was performed to assess the PD response under different multiple dose levels. Graphical and statistical techniques including linear, and logistic regression were used to explore potential relationships between dosing regimens, flu‐like symptoms, PK, and PD. Generalized linear regression with and without binary data family was performed to predict the probability of flu‐like symptoms at any given PK exposure. Data and all figures were evaluated and generated using R (version 4.1.2) with the “ggplot2” (version 3.4.0) package.
RESULTS
Flu‐like symptoms
In studies NP39305 and YP39553, in all SAD cohorts up to 140 mg and in the first MAD cohort (100 mg), there were no clusters of AEs that were considered to be potentially related to PD effects associated with increased TLR7 agonist exposure (e.g., flu‐like symptoms including influenza‐like illness or pyrexia) and there were no dose‐related trends in the incidence or severity of AEs. In total, flu‐like symptoms were reported in 12 HVs from the SAD cohort (1 in 170 mg cohort) and MAD cohorts (1 in 140 mg QOD cohort, 8 in 150 mg QOD cohort and 2 in 170 mg QOD cohort) cohorts in Studies NP39305 and YP39553, and 7 NUC‐treated CHB patients (5 in 150 mg QOD NUC‐treated patient cohorts and 2 in 170 mg QOD NUC‐treated patient cohort) in Study NP39305 (Table 1).
Among 19 participants with flu‐like symptoms, 12 participants (7 HVs and 5 NUC‐treated CHB patients) experienced mild flu‐like symptoms, six participants (5 HVs and 1 NUC‐treated CHB patients) experienced moderate flu‐like symptoms, and one participant (NUC‐treated CHB patient, 170 mg QOD) experienced severe flu‐like symptoms (Table 1). There were no noticeable changes in vital signs apart from an increase in body temperature in participants with flu‐like symptoms. The time to flu‐like symptom onset was 6–12 h after the first to third dose. The presence of flu‐like symptoms was transient and resolved within 24 h after onset following the administration of paracetamol. A total of 11 participants discontinued from the study treatment, among these, four participants withdrew due to AEs (flu‐like symptoms), and seven participants discontinued from further treatment by the principal investigator due to AEs (lymphopenia) (Table 1). AEs of lymphopenia were reported during an unscheduled laboratory test at the onset of flu‐like symptoms. Transient lymphopenia/cytopenia was reported in eight participants (seven in Study YP39553 and one in Study NP39305) with flu‐like symptoms which resolved within 24–48 h. For details, please refer to two publications. 31 , 33
PK/PD relationship
Pooled PK/PD data from studies NP39035 and YP39553 demonstrated that the PK exposure (C max:maximum plasma concentration observed and AUCinf: area under the concentration–time curve from Time 0 to infinity) of the active metabolite RO7011785 increased linearly with increasing doses, from 3–170 mg, after both single and multiple doses of ruzotolimod (Figure 1). Single and multiple doses of ruzotolimod resulted in dose‐dependent increases in TLR7 response markers (IFN‐α, neopterin, IP‐10, and the transcriptional expression of ISG15, OAS 1, MX1 and TLR7) at 100 mg or above (Figure 2 for IFN‐α, IP‐10 and ISG15, similar trends for neopterin, OAS 1, MX1 and TLR7, data not shown).
FIGURE 1.

Dose linearity of C max (a) and AUCinf (b) across NP39305 and YP39553. The point and line plots represent the relationship between the dose and PK exposure (C max and AUCinf). The gray area represents the 95% confidence interval. AUCinf, area under the plasma concentration–time curve from time 0 to infinity; C max, Maximum plasma concentration.
FIGURE 2.
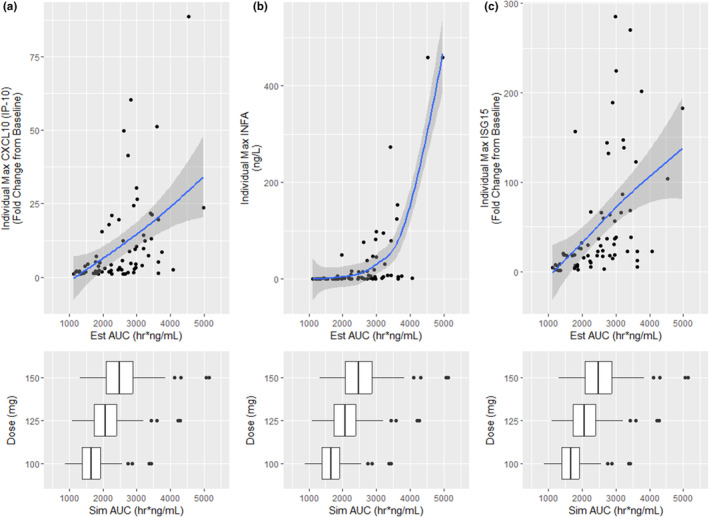
RO7011785 AUCinf versus PD response with simulated PK AUCinf in all participants of MAD cohorts and NUC‐treated CHB patients cohorts. The point and line plots at the top represent the relationship between AUCinf and PD response. The box plots at the bottom represent the simulated AUCinf at each dose level and the gray area represents the 95% confidence interval. AUCinf, area under the plasma concentration–time curve from time 0 to infinity; Est AUC, Empirical Bayesian Estimates of AUCinf based on the popPK model; MAD, multiple ascending doses; PD, Pharmacodynamics; PK, pharmacokinetics; Sim AUC, simulated AUCinf based on the popPK model.
A visual exploratory analysis of both studies showed that greater PD responses (IFN‐α and IP‐10, present as the individual max observed value for IFN‐α, and the individual max fold change from baseline for IP‐10) were observed in the participants with flu‐like symptoms than in those without flu‐like symptoms, even though their individual PK exposures (AUCinf) exhibited a considerable amount of overlap (Figure 3). The analysis also showed that participants with moderate or severe flu‐like symptoms (n = 8), had consistently higher IP‐10 and IFN‐α levels than those without moderate or severe flu‐like symptoms (Figure 3).
FIGURE 3.

RO7011785 AUCinf versus PD response with simulated PK AUCinf in all participants of MAD and NUC‐treated CHB patients with flu‐like symptoms. The point and line plots at the top represent the relationship between AUCinf and PD response, while the red points and lines represent participants without flu‐like symptoms and the blue ones represent participants with the symptom. The stars are subjects with flu‐like symptoms at a severity of moderate or higher. The box plots at the bottom represent the simulated AUCinf at each dose level and the gray area represents the 95% confidence interval. AUCinf, area under the plasma concentration–time curve from time 0 to infinity; Est AUC, Empirical Bayesian estimates of AUCinf based on the popPK model; MAD, multiple ascending doses; PD, pharmacokinetics; Sim AUC, simulated AUCinf based on the popPK model.
A linear regression analysis of PD biomarkers from participants who experienced flu‐like symptoms (HVs in MAD cohorts and NUC‐treated patients with CHB), showed that the presence of symptoms was associated with greater PD biomarker responses that increased with RO7011785 PK exposure, including dose‐dependent increases in systemic IFN‐α, IP‐10, and ISG15 (Figure 3).
The geometric mean of individual maximum IFN‐α concentration (pg/mL) value was 42.08 pg/mL for participants with flu‐like symptoms compared with 1.03 pg/mL for participants without these AEs. A PD analysis of IP‐10 in participants with flu‐like symptoms had 27.12 geometric mean of maximum fold change from baseline compared with those without flu‐like symptoms who had a 3.00‐fold change from baseline (Table 2). The relationship between flu‐like symptoms and ISG15 (Figure 4c) and other mRNA species (data not shown) was less distinct in participants with flu‐like symptoms than that observed between the presence of flu‐like symptoms and IFN‐α and IP‐10 responses (Figure 4a,b).
TABLE 2.
Geometric mean (SD) of maximum IFNα and maximum fold change from baseline of IP‐10 in participants with or without flu‐like symptoms in MAD cohorts and NUC‐treated CHB patients cohorts.
| Participants (n) | Geometric mean (SD) of maximum IFNα(pg/mL) | Geometric mean (SD) of maximum fold change from baseline of IP10 |
|---|---|---|
| Participants with flu‐like symptoms (18) | 42.08 (4.69) | 27.12 (1.78) |
| Participants without flu‐like symptoms(54) | 1.03 (7.26) | 3.00 (2.14) |
FIGURE 4.

PD response of biomarkers IFN α, IP10, and ISG15 versus probability of flu‐like symptoms in participants with any intensity (a) and with moderate or severe flu‐like symptoms (b) in the MAD cohorts and NUC‐treated CHB patients cohorts. Participants with any intensity of FLS were defined as 100% probability of FLS in (a–c), while in (d–f), only participants with moderate or severe FLS were defined as 100% probability of FLS. Black lines and blue areas represent the regression lines and their 95% confidence intervals. CHB, chronic hepatitis B; MAD, multiple ascending doses; PD, pharmacodynamics.
The logistic regression showed a correlation between the magnitude of PD response for IFN‐α, IP‐10, and ISG15 and the probability of flu‐like symptoms in the participants of the MAD cohorts and patients with NUC‐treated CHB groups (Figure 4a–c). Similar trends were observed in the participants with moderate or severe flu‐like symptoms (Figure 4d–f); however, even greater PD responses for IFN‐α or IP‐10, and ISG15 were needed to trigger flu‐like symptoms of higher intensity.
An analysis of the relationship between the dose of ruzotolimod, RO7011785 PK AUCinf and the probability of flu‐like symptoms in participants from both groups with all intensities of flu‐like symptoms (Figure 5a) and moderate or severe flu‐like symptoms (Figure 5b), showed that the probability of symptom occurrence at 150 mg, could be lowered apparently with a dose reduction from 150 to 100 mg (Figure 5a). The probability of moderate or severe flu‐like symptoms at 150 mg could also be reduced if the dose of ruzotolimod was lowered from 150 to 100 mg (Figure 5b).
FIGURE 5.
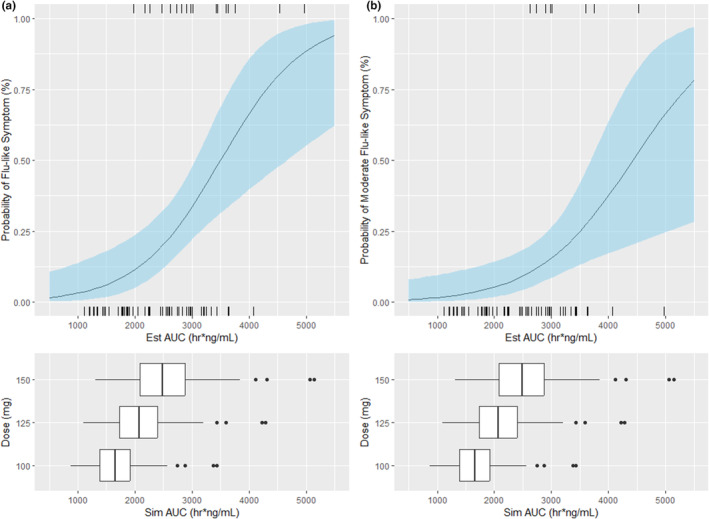
RO7011785 AUCinf versus probability of flu‐like symptoms for all participants with any intensity (a) and participants with moderate or severe flu‐like symptoms (b) in MAD cohorts and NUC‐treated CHB patients cohorts. Participants with any level of FLS were defined as 100% probability of FLS in (a), while in (b), only participants with moderate or higher FLS were defined as 100% probability of FLS. Black lines and blue areas represent the regression lines and their 95% confidence intervals. AUCinf, area under the plasma concentration–time curve from time 0 to infinity; CHB, chronic hepatitis B; Est AUC, Empirical Bayesian estimates of AUCinf based on the popPK model; MAD, multiple ascending doses; Sim AUC, simulated AUCinf based on the popPK model.
DISCUSSION
This PK/PD analysis of pooled data from two phase I studies aimed to characterize the PK and PD responses of healthy volunteers and NUC‐treated CHB patients who exhibited flu‐like symptoms following oral administration of ruzotolimod. Ruzotolimod was generally safe and had an acceptable tolerability after single and multiple QOD doses up to 170 mg in healthy volunteers and NUC‐treated CHB patients. 31 , 32 The most frequent treatment‐related adverse events were flu‐like symptoms, consistent with the mechanism of action of TLR 7 agonists. 15 The exploratory analysis showed that IFN‐α and IP‐10 levels correlate well with the probability of the occurrence and severity of flu‐like symptoms. Considering the dose‐dependent increase in TLR7 response markers (IFN‐α, neopterin, IP‐10, and the transcriptional expression of ISG15, OAS 1, MX1, and TLR7), dose reduction of ruzotolimod can lower the probability of flu‐like symptoms occurrence and the severity of flu‐like symptoms in those participants who are intolerant to flu‐like symptoms during the subsequent treatment period, and in the meantime, maintain appropriate PD effect. In the analysis of the relationship between PK exposure and PD response, high intersubject variability of the PD biomarkers (IFN‐α, neopterin, IP‐10, and the transcriptional expression of ISG15, OAS 1, MX1, and TLR7) was observed even across the different dose levels of ruzotolimod, This observation suggests that intersubject sensitivity of PD activation by TLR7 agonists, and the reason is unknown. An ongoing gene polymorphism analysis of the TLR7 based on the data from the two phase I studies may help explain this high intersubject variability of PD response.
Due to the limited treatment duration in phase I study (NP39305), minor responses on HBsAg reduction were observed after 6 weeks of treatment at 150 mg QOD and 170 mg QOD, and it is difficult to establish the relationship between RO7011785 PK exposure and HBsAg reduction based on phase I study results. To maximize the potential benefit of the efficacy endpoint which is assumed to correlate to the activation of the TLR7 pathway leading to dose‐dependent increases of immune PD biomarkers, as well as balance the safety considerations due to the limitation of the RO7011785 PK exposure (AUCinf) associated with monkey lowest‐observed‐adverse‐effect level (LOAEL, 2625 ng*h/mL), 150 mg QOD of ruzotolimod was selected as the dose regimen in the phase II platform study PIRANGA (NCT04225715) to combine with direct acting antivirals (DAAs). As mentioned in the previous publications, although the intersubject variability of the RO7011785 PK exposure is mild, the intersubject variability of immune PD response is much higher than that for PK exposure. Thus, even at the same dose levels, the participants who are highly sensitive to the TLR7 activation may have a higher probability of flu‐like symptoms with any intensity or higher intensities(moderate and above). Reducing the dose from 150 mg QOD and 100 mg QOD could significantly reduce the probability of moderate/severe or recurrent flu‐like symptoms in participants who are highly sensitive to TLR 7 activation while maintaining appropriate immune PD response. The relationship between immune PD response and efficacy end point based on phase II study results will help further justify the dose modification scheme due to poor tolerability.
CONCLUSION
This exploratory analysis predicts the probability of flu‐like symptoms occurrence after oral administration of ruzotolimod, and provides a rationale for dose modification to minimize flu‐like symptoms associated with ruzotolimod in the participants who are highly sensitive to the TLR7 activation and intolerant to flu‐like symptoms.
AUTHOR CONTRIBUTIONS
Q.J. and Y.C. wrote the manuscript. Q.J., Y.C., D.D., S.R., R.U., K.G., M.T., Y.Z., J.G., and Y.J. designed the research. Q.J., Y.C., D.D., S.R., R.U., K.G., M.T., Y.Z., J.G., and Y.J. performed the research. Q.J., Y.C., D.D., S.R., and R.U. analyzed the data. All authors reviewed the manuscript and approved the final draft.
FUNDING INFORMATION
Funding for the study was provided by F. Hoffman‐La Roche.
CONFLICT OF INTEREST STATEMENT
Q.J., Y.C., D.D., S.R., R.U., K.G. and M.T. are employees of F. Hoffmann‐La Roche, and Y.Z., J.F.G. and Y.J. are former employees of F. Hoffmann‐La Roche. All of them have no competing interests for this work.
Supporting information
Data S1.
ACKNOWLEDGMENTS
Editorial and medical writing support was provided by Cathy Chow (Weber Shandwick Hong Kong) funded by Hoffman‐LaRoche.
Jiang Q, Zhang Y, Duan D, et al. Using exploratory pharmacokinetic and pharmacodynamic analyses to predict the probability of flu‐like symptoms in healthy volunteers and patients with chronic hepatitis B treated with the toll‐like receptor 7 agonist ruzotolimod. Clin Transl Sci. 2024;17:e13896. doi: 10.1111/cts.13896
Yonghong Zhu, Joseph F. Grippo and Yuyan Jin: Former employees of F. Hoffmann‐La Roche.
REFERENCES
- 1. World Health Organization . Hepatitis B . Updated on 18 July. https://www.who.int/news‐room/fact‐sheets/detail/hepatitis‐b
- 2. Mehta P, Reddivari AKR. Hepatitis. StatPearls; 2020. [Google Scholar]
- 3. Lok AS, Zoulim F, Dusheiko G, Ghany MG. Hepatitis B cure: from discovery to regulatory approval. J Hepatol. 2017;67:847‐861. [DOI] [PubMed] [Google Scholar]
- 4. Fisicaro P, Barili V, Rossi M, et al. Pathogenetic mechanisms of T cell dysfunction in chronic HBV infection and related therapeutic approaches. Front Immunol. 2020;11:849. [DOI] [PMC free article] [PubMed] [Google Scholar]
- 5. Schinazi RF, Ehteshami M, Bassit L, Asselah T. Towards HBV curative therapies. Liver Int. 2018;38(Suppl 1):102‐114. [DOI] [PMC free article] [PubMed] [Google Scholar]
- 6. Kuipery A, Gehring AJ, Isogawa M. Mechanisms of HBV immune evasion. Antivir Res. 2020;179:104816. [DOI] [PubMed] [Google Scholar]
- 7. Lok AS, Zoulim F, Dusheiko G, et al. Durability of hepatitis B surface antigen loss with nucleotide analogue and peginterferon therapy in patients with chronic hepatitis B. Hepatol Commun. 2020;4(1):8‐20. [DOI] [PMC free article] [PubMed] [Google Scholar]
- 8. Cai Y, Yin W. The multiple functions of B cells in chronic HBV infection. Front Immunol. 2020;11:582292. doi: 10.3389/fimmu.2020.582292 [DOI] [PMC free article] [PubMed] [Google Scholar]
- 9. Zheng P, Dou Y, Wang Q. Immune response and treatment targets of chronic hepatitis B virus infection: innate and adaptive immunity. Front Cell Infect Microbiol. 2023;13:1206720. doi: 10.3389/fcimb.2023.1206720 [DOI] [PMC free article] [PubMed] [Google Scholar]
- 10. Bertoletti A, Le Bert N. Immunotherapy for chronic hepatitis B virus infection. Gut and Liver. 2018;12(5):497‐507. [DOI] [PMC free article] [PubMed] [Google Scholar]
- 11. Wang WT, Zhao XQ, Li GP, et al. Immune response pattern varies with the natural history of chronic hepatitis B. World J Gastroenterol. 2019;25(16):1950‐1963. [DOI] [PMC free article] [PubMed] [Google Scholar]
- 12. Ye B, Liu X, Li X, Kong H, Tian L, Chen Y. T‐cell exhaustion in chronic hepatitis B infection: current knowledge and clinical significance. Cell Death Dis. 2015;6:e1694. [DOI] [PMC free article] [PubMed] [Google Scholar]
- 13. Bertoletti A, Ferrari C. Innate and adaptive immune responses in chronic hepatitis B virus infections: towards restoration of immune control of viral infection. Gut. 2012;61(12):1754‐1764. [DOI] [PubMed] [Google Scholar]
- 14. Funk E, Kottilil S, Gilliam B, Talwani R. Tickling the TLR7 to cure viral hepatitis. J Transl Med. 2014;12:129. [DOI] [PMC free article] [PubMed] [Google Scholar]
- 15. Gane EJ, Lim YS, Gordon SC, et al. The oral toll‐like receptor‐7 agonist GS‐9620 in patients with chronic hepatitis B virus infection. J Hepatol. 2015;63(2):320‐328. [DOI] [PubMed] [Google Scholar]
- 16. Akira S, Takeda K. Toll‐like receptor signalling. Nat Rev Immunol. 2004;4(7):499‐511. [DOI] [PubMed] [Google Scholar]
- 17. Kawai T, Akira S. Innate immune recognition of viral infection. Nat Immunol. 2006;7(2):131‐137. [DOI] [PubMed] [Google Scholar]
- 18. Sadler AJ, Williams BR. Interferon‐inducible antiviral effectors. Nat Rev Immunol. 2008;8(7):559‐568. [DOI] [PMC free article] [PubMed] [Google Scholar]
- 19. Belloni L, Allweiss L, Guerrieri F, et al. IFN‐alpha inhibits HBV transcription and replication in cell culture and in humanized mice by targeting the epigenetic regulation of the nuclear cccDNA minichromosome. J Clin Invest. 2012;122(2):529‐537. [DOI] [PMC free article] [PubMed] [Google Scholar]
- 20. Birmachu W, Gleason RM, Bulbulian BJ, et al. Transcriptional networks in plasmacytoid dendritic cells stimulated with synthetic TLR 7 agonists. BMC Immunol. 2007;8:26. [DOI] [PMC free article] [PubMed] [Google Scholar]
- 21. Hanten JA, Vasilakos JP, Riter CL, et al. Comparison of human B cell activation by TLR7 and TLR9 agonists. BMC Immunol. 2008;9:39. [DOI] [PMC free article] [PubMed] [Google Scholar]
- 22. Oh JZ, Kurche JS, Burchill MA, Kedl RM. TLR7 enables cross‐presentation by multiple dendritic cell subsets through a type I IFN‐dependent pathway. Blood. 2011;118(11):3028‐3038. [DOI] [PMC free article] [PubMed] [Google Scholar]
- 23. Lanford RE, Guerra B, Chavez D, et al. GS‐9620, an oral agonist of toll‐like receptor‐7, induces prolonged suppression of hepatitis B virus in chronically infected chimpanzees. Gastroenterology. 2013;144(7):1508‐1517. [DOI] [PMC free article] [PubMed] [Google Scholar]
- 24. Tel J, Sittig SP, Blom RA, et al. Targeting uptake receptors on human plasmacytoid dendritic cells triggers antigen cross‐presentation and robust type I IFN secretion. J Immunol. 2013;191(10):5005‐5012. [DOI] [PubMed] [Google Scholar]
- 25. Bekeredjian‐Ding IB, Wagner M, Hornung V, et al. Plasmacytoid dendritic cells control TLR7 sensitivity of naive B cells via type I IFN. J Immunol. 2005;174(7):4043‐4050. [DOI] [PubMed] [Google Scholar]
- 26. Meng Z, Zhang X, Pei R, et al. Combination therapy including CpG oligodeoxynucleotides and entecavir induces early viral response and enhanced inhibition of viral replication in a woodchuck model of chronic hepadnaviral infection. Antivir Res. 2016;125:14‐24. [DOI] [PubMed] [Google Scholar]
- 27. Menne S, Tumas DB, Liu KH, et al. Sustained efficacy and seroconversion with the toll‐like receptor 7 agonist GS‐9620 in the woodchuck model of chronic hepatitis B. J Hepatol. 2015;62(6):1237‐1245. [DOI] [PMC free article] [PubMed] [Google Scholar]
- 28. Lucifora J, Bonnin M, Aillot L, et al. Direct antiviral properties of TLR ligands against HBV replication in immune‐competent hepatocytes. Sci Rep. 2018;8(1):5390. [DOI] [PMC free article] [PubMed] [Google Scholar]
- 29. Niu C, Li L, Daffis S, et al. Toll‐like receptor 7 agonist GS‐9620 induces prolonged inhibition of HBV via a type I interferon‐dependent mechanism. J Hepatol. 2018;68(5):922‐931. [DOI] [PubMed] [Google Scholar]
- 30. Janovec V, Hodek J, Clarova K, et al. Toll‐like receptor dual‐acting agonists are potent inducers of PBMC‐produced cytokines that inhibit hepatitis B virus production in primary human hepatocytes. Sci Rep. 2020;10(1):12767. [DOI] [PMC free article] [PubMed] [Google Scholar]
- 31. Luk A, Jiang Q, Glavini K, et al. A single and multiple ascending dose study of toll‐like receptor 7 agonist (RO7020531) in Chinese healthy volunteers. Clin Transl Sci. 2020;13:985‐993. [DOI] [PMC free article] [PubMed] [Google Scholar]
- 32. Yuen MF, Balabanska R, Cottreel E, et al. TLR7 agonist RO7020531 versus placebo in healthy volunteers and patients with chronic hepatitis B virus infection: a randomised, observer‐blind, placebo‐controlled, phase 1 trial. Lancet Infect Dis. 2023;23(4):496‐507. [DOI] [PubMed] [Google Scholar]
- 33. Grippo JF, Folitar I, Passe S, et al. Safety, tolerability, pharmacokinetics, and pharmacodynamics of a TLR7 agonist prodrug RO6870868 in healthy volunteers. Clin Transl Sci. 2021;14:1524‐1534. [DOI] [PMC free article] [PubMed] [Google Scholar]
- 34. Grippo J, Folitar, I , de Rooij, JVDW , et al. Optimization of a phase 2 study design in chronic hepatitis B (CHB) patients based on safety, pharmacokinetics (PK) and pharmacodynamics (PD) from phase 1 studies using two prodrugs of a toll‐like receptor 7 (TLR7) agonist. Hepatology. 2016;64:1869. [Google Scholar]
- 35. Agarwal K, Ahn SH, Elkhashab M, et al. Safety and efficacy of vesatolimod (GS‐9620) in patients with chronic hepatitis B who are not currently on antiviral treatment. J Viral Hepat. 2018;25:1331‐1340. [DOI] [PubMed] [Google Scholar]
- 36. Bergmann JF, de Bruijne J, Hotho DM, et al. Randomised clinical trial: anti‐viral activity of ANA773, an oral inducer of endogenous interferons acting via TLR7, in chronic HCV. Aliment Pharmacol Ther. 2011;34:443‐453. [DOI] [PubMed] [Google Scholar]
- 37. Boonstra A, Liu BS, Groothuismink ZMA, et al. Potent immune activation in chronic hepatitis C patients upon administration of an oral inducer of endogenous interferons that acts via toll‐like receptor 7. Antivir Ther (Lond). 2012;17:657‐667. [DOI] [PubMed] [Google Scholar]
- 38. Luk A, Jiang Q, Glavini K, et al. Single and multiple ascending dose study of toll‐like receptor 7 (TLR 7) agonist (RO7020531) in Chinese healthy volunteers. APASL. 2019;13:985‐993. [DOI] [PMC free article] [PubMed] [Google Scholar]
- 39. Gane E, Folitar I, Schwabe C, et al. RO7020531, a novel prodrug of a toll‐like receptor 7 agonist, is safe, well tolerated and activates TLR signalling in healthy volunteers. EASL. 2018;68:S514‐S515. [Google Scholar]
- 40. Jiang Q, Grippo, J , Jun Shi, L , et al. Ascending dose pharmacokinetic (PK)/pharmacodynamic (PD) bridging study of toll‐like receptor 7 (TLR 7) agonist (RO6864018) in Asian and Caucasian healthy subjects. APASL 2017.
- 41. Janssen HLA, Brunetto MR, Kim YJ, et al. Safety, efficacy and pharmacodynamics of vesatolimod (GS‐9620) in virally suppressed patients with chronic hepatitis B. J Hepatol. 2018;68:431‐440. [DOI] [PubMed] [Google Scholar]
- 42. Hu Y, Zhang H, Wu M, et al. Safety, pharmacokinetics and pharmacodynamics of TQ‐A3334, an oral toll‐like receptor 7 agonist in healthy individuals. Expert Opin Investig Drugs. 2021;30:263‐269. [DOI] [PubMed] [Google Scholar]
- 43. Gane E, Pastagia M, Schwertschlag U, et al. Safety, tolerability, pharmacokinetics, and pharmacodynamics of oral JNJ‐64794964, a TLR‐7 agonist, in healthy adults. Antivir Ther. 2021;26:58‐68. [DOI] [PubMed] [Google Scholar]
Associated Data
This section collects any data citations, data availability statements, or supplementary materials included in this article.
Supplementary Materials
Data S1.