Abstract
Background: Integrating immune checkpoint inhibitors with multi-target tyrosine kinase inhibitors presents an innovative and hopeful strategy in liver cancer treatment. Nonetheless, a degree of resistance to this treatment is noticeable in certain patients. Alternative splicing (AS) represents a common biological process that controls the variety of life functions via isoforms. Purpose: Investigating how gene AS affects the effectiveness of combined immunotherapy in treating hepatocellular carcinoma (HCC). Methods: Our retrospective examination focused on AS's effect on immune therapy effectiveness, utilizing accessible tissue sequencing and clinical records for HCC. For corroborating our results, we gathered samples of drug-resistant HCC tissue, nearby tissues, HCC tissue with high drug responsiveness, and healthy liver tissue from clinical studies. Results: The study revealed a link between the frequency of AS occurrences, the expression levels of programmed cell death 1 ligand 1, and the resistance to tumor medications. Our study detailed the AS occurrences in HCC, leading to the creation of a risk-assessment function and a predictive model using AS data. The results of our study revealed that the risk score effectively distinguished between various immune subtypes and the effectiveness of immune therapy. Additional examination of the chosen AS occurrences uncovered their effects on both the immune microenvironment and cellular immunity. Our investigation also delved into the regulatory framework of AS, uncovering the role of stringently controlled splicing factors in the emergence of tumors and the modulation of the body's immune response. Conclusions: Increased AS in HCC diminishes the efficacy of immunotherapy; conversely, more AS in peritumoral tissue elevates the likelihood of tumor immune evasion.
Keywords: hepatocellular carcinoma, alternative splicing, immunotherapy, immune resistance, immune subtype
Introduction
Hepatocellular carcinoma (HCC) represents a cancerous growth characterized by its high occurrence and fatal outcomes.1,2 The issue of HCC in China is alarming, with more than 400 000 new cases annually, a 12.5% 5-year survival rate, and nearly 40% of patients diagnosed in later stages.3-5 Approaches to immune therapy, like the use of programmed cell death protein 1 (PD-1) antibodies, have demonstrated remarkable effectiveness in treating HCC. Nonetheless, certain patients display low responsiveness to PD-1 antibody medications and may even experience tumor growth during the treatment.5-7 The development of diverse therapeutic approaches centered on immune checkpoint inhibitors (ICIs) is progressively advancing the systemic treatment of HCC. This change serves a dual purpose: it regulates tumor expansion and enhances the life quality of patients.8,9
Alternative splicing (AS), a widespread biological occurrence in eukaryotes, facilitates the creation of varied life forms by synthesizing several protein isoforms from RNA precursors via exon configurations. The significance of AS in the growth and resilience of tumor cells has earned it acclaim, highlighting its importance as a research field.10-12 Earlier, our group investigated the link between HCC diversity and patient outcomes using methods like whole-exome sequencing, single-cell sequencing, and clinical studies.13-15 In this study, we explored the link between AS and the prognosis of HCC patients, along with its connection to the effectiveness of immunotherapy, utilizing sequencing data accessible to the public and our clinical specimens.
Methods
Data Collection and Ethics Statement
Both the expression and clinical information related to HCC were retrieved from the XENA database (https://xenabrowser.net/datapages/) and the AS data from the TCGA database (https://portal.gdc.cancer.gov/). Post-intersection, only those data sets that were finalized without any missing values were considered. The reporting of this study conforms to TRIPOD guidelines. 16
Fresh samples of tumor tissue and related paraneoplastic tissues were gathered, accompanied by MRESIST evaluations indicating either a stable (SD) or progressive (PD) disease following four to six rounds of PD-1 antibody and multi-target tyrosine kinase inhibitors treatment. Furthermore, we gathered biopsy samples of immune-responsive HCC and a single instance of healthy liver tissue before treatment.
The study protocol was approved by the Ethics Committee of Chinese People's Liberation Army General Hospital, and all enrolled patients were informed in detail and gave written consent. The ethical approval number is S2018-111-01. All patients were told that some of the tumor tissue would be used for scientific research and completed written informed consent forms.
AS Data Analysis and Construction of Risk-Scoring Function
The TCGA sequencing data was normalized using Z-Score normalization. Initially, the cohort was split into two groups: one for training and the other for validation, maintaining a ratio of 2:1. Subsequently, we determined the percentage of splicing in (PSI) and the z-Score figures in the AS dataset. A unidirectional COX analysis was performed to pinpoint AS genes linked to survival rates. The LASSO regression analysis, utilizing filtered AS genes, was conducted, employing cross-validation to identify the most effective mix with the minimal LASSO regression error. Subsequently, we conducted a multivariate COX analysis on the filtered AS genes and developed the risk-scoring function (RSF).
Prognostic Nomogram, Correlation Analysis of Clinical Indicators, and Validation
We stratified the 220 patients into two groups based on their risk scores (RSs) and performed survival analysis. To identify significant clinical indicators, we conducted both univariate and multifactorial COX analyses and constructed forest plots for both groups. We further evaluated the correlation between RS and clinical indicators. Additionally, we compared the distribution of clinical information by the median PSI values of the AS genes included in the function. Subsequently, we developed a predictive model by combining RSF with clinical indicators and generated a nomogram for visualization. We then validated the model using data from the validation group and plotted survival curves for 1, 2, and 3 years, and calculated the area under the curve (AUC), respectively. We judge the performance of the prediction model by drawing the decision curve analysis (DCA), and the results were validated using GEO data (GSE54236) and ROC curves were plotted.
Tumor Immune Microenvironment Analysis and ssGSEA Analysis
We evaluated “stromal score,” “immune score,” “estimated score,” and “tumor purity score” employing the ESTIMATE package. In addition, the CIBERSORT package was used to assess immune cell infiltration, while the ssGSEA module was used to analyze immune function in both study groups. In this study, we analyzed the potential impact of AS on immune function based on PSI values of the AS gene in RSF, divided into high and low groups.
Immune Subtypes and Immunotherapy Analysis
We referred to the 2018 article Immune Landscape in Cancer, which classified six immune subtypes of tumors: wound healing (C1), IFN-γ dominant (C2), inflammation (C3), lymphocyte depleted (C4), immunosuppression (C5), and TGF-β dominant (C6). 15 Next, we compared cohort data and explored any potential differences in immune subtypes between the RS wave high and the RS wave low. To assess the immune escape potential of these two groups of tumors, we employed the TIDE immune escape scoring tool (HTTP://TIDE). DFCI. HARVARD. EDU/). In addition, we analyzed the differential expression of immune-related genes and immune checkpoint-related genes between the two groups.
Differential Gene Analysis and Immune Function Gene Oncology Enrichment Analysis
We performed differential gene expression analysis and explored its potential impact on immune cells and survival employing gene ontology (GO) analysis. In addition, we divided patients into subgroups based on the PSI value for each gene in RSF and evaluated any potential immune-related gene differences. We also performed GO enrichment analyses of differentially expressed and immune-related genes to further elucidate their potential biological significance.
AS and Splicing Factors Regulatory Network
We performed correlation analysis of AS genes significantly associated with patient survival, focusing on their association with splicing factors (SFs). We only retained statistically significant results with a correlation coefficients greater than 0.7. Next, we classified AS genes as high and low risk based on hazard ratio versus 1 in COX analysis, while retaining node information. Using CYTOSCAPE software, we statistically sequenced different AS genes and SF based on the degree of network regulation and visualized the regulatory network as a circular diagram (See Supplementary Material for the SFs dataset.).
Immunofluorescence and Polymerase Chain Reaction
We sectioned the samples and immunofluoresced programmed cell death 1 ligand 1 (PD-L1) and CD8. To evaluate the mRNA sequences of the isoforms, we extracted data from the NCBI (https://https://www.ncbi.nlm.nih.gov//) and designed primers for polymerase chain reaction (PCR) of these samples. To minimize potential errors, we conducted two experiments (Antibody information and primer sequence provided in Supplementary Material).
Statistical Methods
To quantify continuous variables in this study, we reported mean standard deviation using t-testing. Categorical variables, on the other hand, are evaluated using Chi-square or Fisher precision tests. Genes with more than a twofold difference in expression were considered significantly differentially expressed. We used P < .05 as a criterion for statistical significance in this study, without any additional explanation. For our analysis, we employed various software programs including DNAMAN v6.0, SPSS v23.0, IMAGE J, and R4.0.3.
Results
Cohort Data Characteristics and Risk-Scoring Function
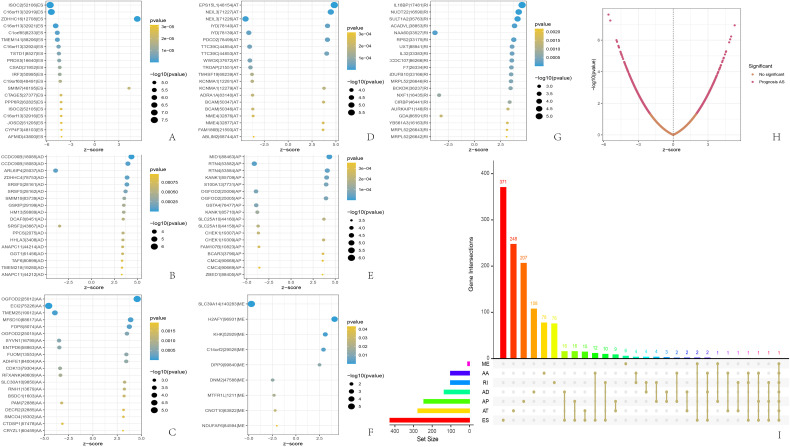
Of the 220 patients in our study cohort, 152 were men and 68 were women. The average age was 57 and most patients were in stage 1 (Table 1). Finally, we collected one normal liver tissue (N), two pre-treatment needle biopsy samples (R1 & R2), and five drug-resistant tumor specimens (T1-T5) and adjacent normal tissues (P1-P5) from a rapidly responding HCC. Using SpliceSeq software, we categorize AS into seven categories: exon skipping (ES), backup promoter (AP), retained intron (RI), alternate acceptor site (AA), mutually exclusive exons (ME), backup donor site (AD), and alternate terminator (AT). 16 We identified a total of 1202 AS genes associated with patient prognosis, ES being the most common type (Figure 1I). We retained the top 20 genes for each AS associated with prognosis based on the lowest P-value (Figure 1A-H). From the bubble diagram, we observed that most ES splicing events were below average, while most AD and RI splicing events were above average and the rest were not significantly biased. After COX analysis and LASSO analysis of the 1202 AS genes, we obtained the following RSF: RS = (ZDHHC16 * 2.4346) + (FAXDC2 * 3.0303) + (EPS15L1 * 5.3840) − (ECI2 * 3.6717) + (IL18BP * 1.0328) − (PRDX5 * 2.949) with gene names representing PSS values (the Supplementary Figure S1, pictures A-E).
Table 1.
Clinical Information of 220 Patients.
| All patients | Low-risk group | High-risk group | P-value | |
|---|---|---|---|---|
| Gender (male/female) |
152 / 68 | 77 / 33 | 76 / 35 | .884 |
| Age (mean ± SD; years) |
57.08 ± 13.21 | 56.93 ± 13.23 | 57.23 ± 13.30 | .867 |
| Risk score | 1.85 ± 3.26 | 0.47 ± 0.19 | 3.23 ± 4.19 | <.001 |
| Grade (G1/G2/G3 + G4) |
27 / 99 / 94 | 17 / 56 / 37 | 10 / 43 / 57 | .02 |
| Stage (S1/S2/S3 + S4) |
105 / 47 / 68 | 64 / 19 / 27 | 41 / 28 / 41 | .009 |
| T (T1/T2/T3/T4) |
107 / 49 / 55 / 9 | 65 / 20 / 21 / 4 | 42 / 29 / 34 / 5 | .016 |
| M (M0/M1) |
216 / 4 | 119 / 1 | 117 / 3 | .622 |
| N (N0/N1) | 216 / 4 | 118 / 2 | 118 / 2 | .689 |
Figure 1.
Landscape description of alternative splicing in liver cancer tissue. (A-G) The 20 genes with the highest frequency of the 7 AS types associated with patient prognosis; (H) the distribution and P-value of the AS associated with prognosis; (I) UPSET plots of the AS associated with prognosis. AS, alternative splicing.
Correlation Analysis of RS with Clinical Indicators and Construction of the Prognostic Prediction Model
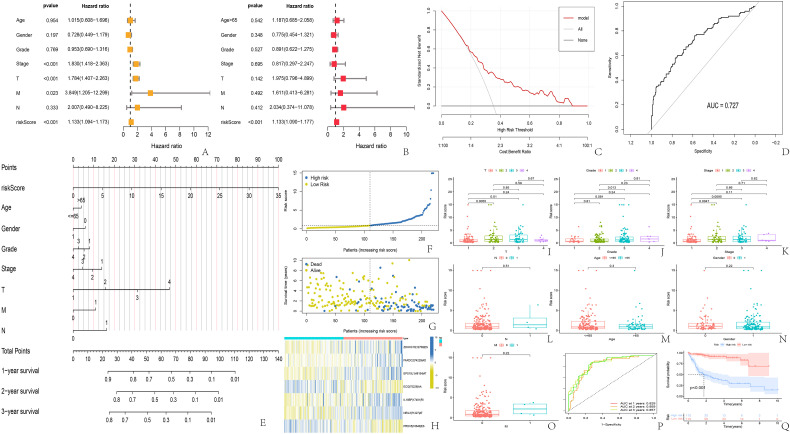
Our findings revealed notable statistical variances in RS among different stages, grades, and T of the tumor, yet there were no significant disparities in RS across age, gender, N, and M (Table 1 and Figure 2I-O). The levels of NEIL3, EPS15L1, and FAXDC2 showed a correlation with the stage and T, whereas NEIL3, ZDHHC16, and FAXDC2 had a correlation with the grade. Additionally, there was a notable disparity in EPS15L1 across genders and ages, while IL18BP showed significant gender differences (Figure S1-S2 in Supplementary Material). Stratification of the high and low-risk categories was done according to the median RS (Figure 2F), revealing a notably reduced overall survival in the high-risk group compared to the low-risk group, suggesting a link between the RS and prognosis (Figure 2G, Q). The thermal mapping of RS genes revealed that the ASs in ECI2 and PRDX5 act as safeguarding elements for survival, whereas the ASs in the remaining five genes pose a high risk (Figure 2H). Analysis using both univariate and multifactorial COX revealed RS as a standalone risk element for predicting outcomes in HCC patients (Figure 2A, B). A predictive model was further developed utilizing clinical markers and RS, showcased in a Nomogram (Figure 2E). The Nomogram indicated that RS and T's contribution to higher score weights and their enhanced precision in forecasting patients at 1, 2, and 3 years were evident, with AUCs of 0.829, 0.859, and 0.857, in that order (Figure 2Q). We deemed that the model was decent by DCA and the model also got an acceptable external validation effect with an AUC of 0.727 (Figure 2C, D).
Figure 2.
Correlation between risk scores and clinical indicators, and prognostic prediction models. (A) univariate COX analysis; (B) multivariate COX analysis; (C) 5. The DCA curve of Nomogram validation; (D) the ROC of external validation for the risk prediction model; (E) Nomogram of the prognostic model; (F, G) The scatter plot of risk score and survival time for the high-risk and low-risk groups; (H) The heatmap of genes involved in the risk score function; (I-O) difference analysis of risk score and clinical indicators; (P) ROC and AUC for predicting survival at 1, 2, and 3 years; (Q) survival curve for high- and low-risk groups. AUC, area under the curve; DCA, decision curve analysis.
Results of Tumor Immune Microenvironment and ssGSEA Analysis
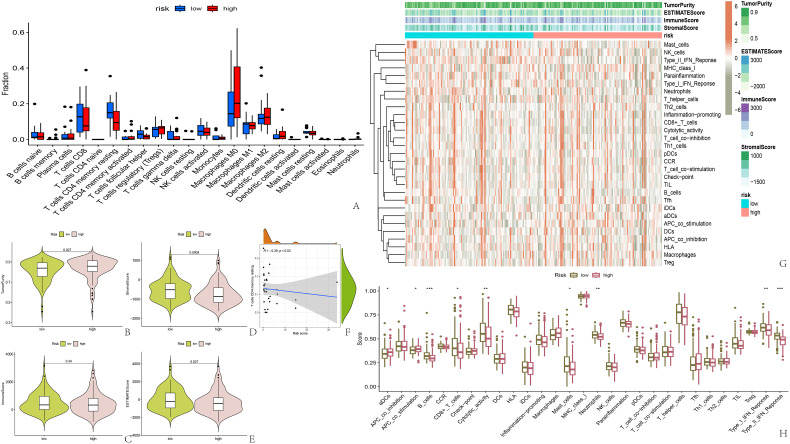
Examination of the tumor's microenvironment revealed a notably greater purity in the high-risk group, with a reduced proportion of stromal cells compared to the low-risk group (Figure 3B-E). Nonetheless, the presence of immune cells was consistent, a fact further verified by examining the quantity of immune infiltrating cells (Figure 3A). Conversely, ssGSEA analysis outcomes showed a notably stronger response of B cells, CD8+ T cells, neutrophils, type I, and type II interferon in the low-risk group compared to the high-risk group (Figure 3G, H). Additionally, our stratification of samples according to the median PSI value revealed a significant correlation between the ASs of ECI2 and IL18BP and the purity of the tumor and immune system scoring. In particular, the cohort exhibiting a high PSI of ECI2 demonstrated greater tumor cleanliness and a reduced immune rating, in contrast to the reverse trend seen with IL18BP. Furthermore, our findings revealed that the ASs in ECI2 and IL18BP genes exert a greater influence on immune responses compared to the other five genes (Figure S3-S5 in Supplementary Material). Ultimately, a slight inverse relationship was observed between RS and CD4+ T cells (Figure 3F).
Figure 3.
Analysis of tumor immune microenvironment and immune function. (A) Immune cell infiltration in high-risk and low-risk groups; (B-E) Score for the tumor immune microenvironment in two groups; (F) Negative correlation between risk score and CD4+ memory T cell count; (G, H) Heatmap and bar chart of ssGSEA immune function analysis.
Analysis of Immune Subtypes and Immunotherapy Effects
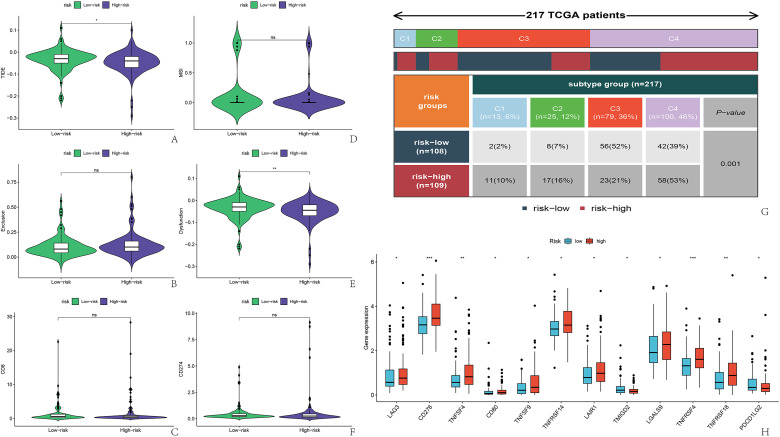
Out of 217 patients who successfully matched immune subtypes, they were classified into C1-C4, with C3 and C4 types accounting for 36% and 46% of the overall count, respectively. A notable disparity was observed in the immune subtypes among the two groups. In the low-risk category, over 50% of the patients fell into the C3 category, 39% into the C4 group, and the other two categories constituted a small fraction. Conversely, C4 constituted 53% of the group at high risk, while the other three categories made up a comparable share, each ranging from 10% to 20%. (Image 4, images G)
Furthermore, our examination of genes linked to immunotherapy across two cohorts revealed that 12 genes exhibited varied expression. Within this gene group, TMIGD2 and PDCD1LG2 showed high expression levels in the low-risk category, whereas LAG3, CD276, CD80, TNFSF4, TNFSF9, TNFRSF4, TNFRSF14, TNFRSF18, and LAIR1 exhibited high expression in the high-risk segment (Figure 4H). Additionally, we charted the correlation heat maps between RS and genes used in immunotherapy, (Figure S5 in Supplementary Material, pictures F), along with the correlation map of RS in relation to immunotherapy genes. In total, our research pinpointed 17 genes associated with RS (Figure S5 in the Supplementary Material, pictures G-W).
Figure 4.
Prediction of immune therapy efficacy and classification of tumor immune subtypes in patients. (A-F) TIDE software scoring for immunotherapy effectiveness; (g) Subtyping of HCC included in the study; (H) Differential expression of immune checkpoint-related genes and risk score. HCC, hepatocellular carcinoma.
GO Enrichment Analysis of Immune Function
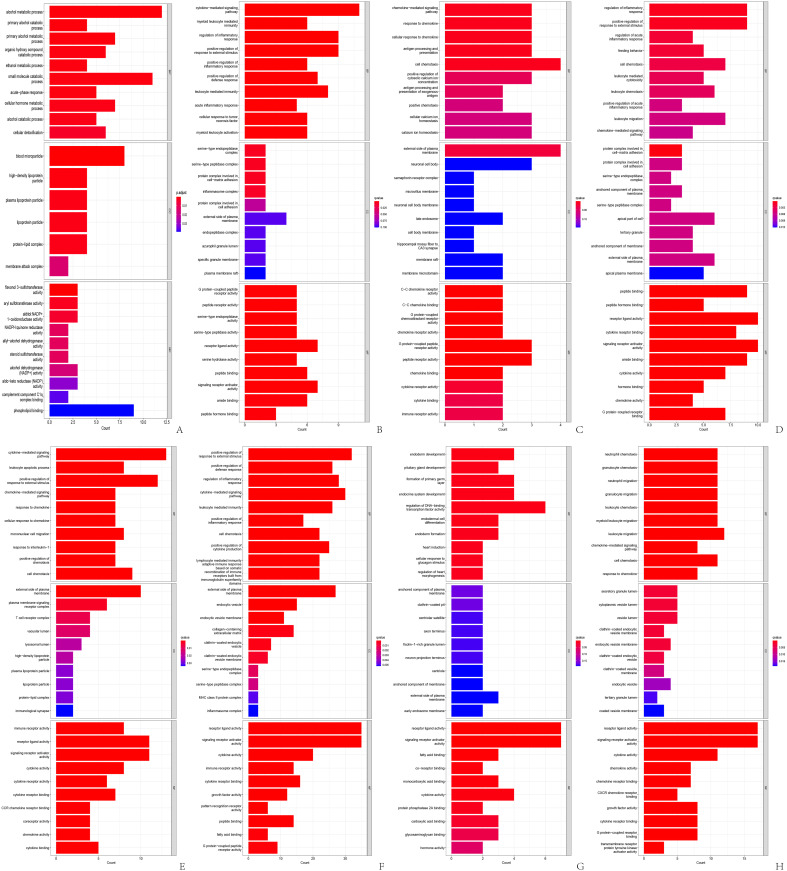
Genes showing varied expression levels between the high and low-risk categories were predominantly found in pathways related to alcohol metabolism and mitochondrial oxidation (Figure 5A). Elevated PSI levels of ECI2 triggered the activation of cytokine-driven routes and leukocyte inflammation processes, (Figure 5B), whereas heightened PSI levels of EPS15L1 affected chemokine-driven cellular movement and the processing and display of antigens (Figure 5C). Variations in cellular immune activities, including immediate inflammatory control and leukocyte-driven cytotoxic reactions, were observed between FAXDC2's high and low PSI categories (Figure 5D). IL18BP correlated with the movement of cytokines and monocytes, (Figure 5E), whereas PRDX5 significantly influenced DNA-binding transcription factors, impacting the growth of the endoderm where hepatocytes are part of (Figure 5G). Predominantly, the ZDHHC16 gene influenced the functioning of leukocytes, with a notable impact on neutrophils (Figure 5H).
Figure 5.
Go analysis of all differential expression genes. (A): GO analysis of differentially expressed genes in high-risk and low-risk groups; (B): GO analysis of differentially expressed genes in the high and low PSI groups of ECI2 gene; (C) GO analysis of differentially expressed genes in the high and low PSI groups of EPS15L1 gene; (D) GO analysis of differentially expressed genes in the high and low PSI groups of FAXDC2 gene; (E) GO analysis of differentially expressed genes in the high and low PSI groups of IL18BP gene; (F) GO analysis of differentially expressed genes in the high and low PSI groups of NEIL3 gene; (G) GO analysis of differentially expressed genes in the high and low PSI groups of PRDX5 gene; (H) GO analysis of differentially expressed genes in the high and low PSI groups of ZDHHC16 gene. GO, gene ontology.
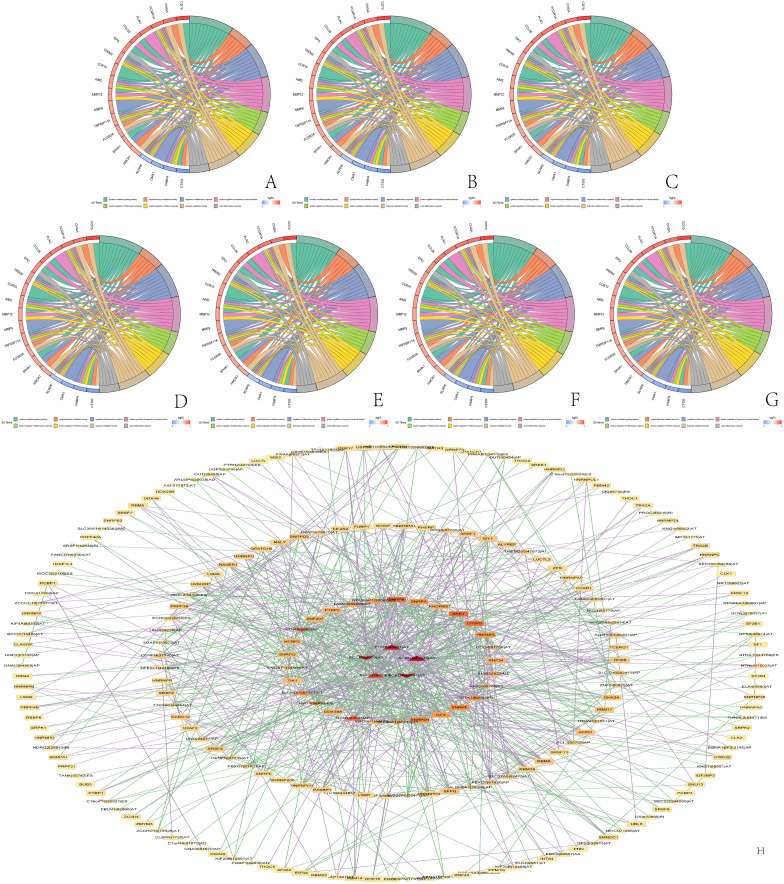
Furthermore, the circle plot of immune function-related differentially expressed genes enabled us to observe the differences in immune function between the high and low PSI groups. The ECI2 gene mainly affected the inflammatory response of leukocytes (Figure 6A), while the EPS15L1 gene mainly affected inflammatory cell chemotaxis, antigen processing, and presentation (Figure 6B). The FAXDC2 gene mainly regulated the leukocyte inflammatory response (Figure 6C), and the IL18BP gene had a significant effect on cytokine regulation of chemotaxis and monocyte migration (Figure 6D). The NEIL3 gene PSI value changes caused significant differences in the expression of immune-related genes, primarily affecting the positive regulation of inflammation and leukocyte-mediated immune response (Figure 6E). The PRDX5 gene acted on endothelial cell function (Figure 6F), and the ZDHHC16 gene promoted neutrophil migration and chemotaxis (Figure 6G).
Figure 6.
Go analysis of immune-related genes and regulatory network diagrams of alternative splicing control. (A) Immune-related genes with differential expression levels between the high and low PSI groups of ECI2 gene and enriched immune functions; (B) Immune-related genes with differential expression levels between the high and low PSI groups of EPS15L1 gene and enriched immune functions; (C) immune-related genes with differential expression levels between the high and low PSI groups of FAXDC2 gene and enriched immune functions; (D) immune-related genes with differential expression levels between the high and low PSI groups of IL18BP gene and enriched immune functions; (E) immune-related genes with differential expression levels between the high and low PSI groups of NEIL3 gene and enriched immune functions; (F) immune-related genes with differential expression levels between the high and low PSI groups of PRDX5 gene and enriched immune functions; (G) Immune-related genes with differential expression levels between the high and low PSI groups of ZDHHC16 gene and enriched immune functions; (H) Alternative splicing genes associated with patient survival and regulation network of splicing factors, where triangles represent the high-risk prognostic splicing genes that lead to poor patient survival, V-shaped symbols represent the low-risk prognostic splicing genes that lead to good patient survival, and rectangles represent splicing factors, where stronger regulation is symbolized by deeper red color.
AS and SFs Regulatory Network
The regulatory network showed that AS genes and SF could be classified into four levels depending on the degree of regulation. The most regulated AS genes were PCB, ACBD4 and SCP2. On the other hand, the most highly regulated SFs included SRRT, CPSF6, HNRNPL, RNF34, DDX39A, TIA, NCBP2, ZNF207, PTBP3, and the SNRP family (Figure 6H).
Immunofluorescence Results and PCR of AS Genes
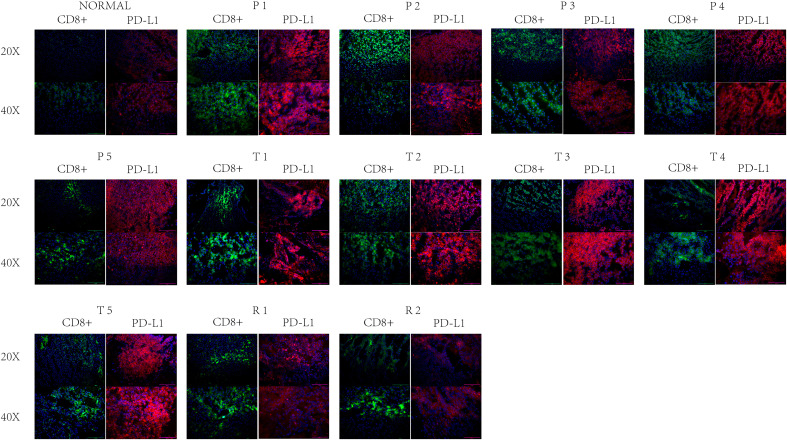
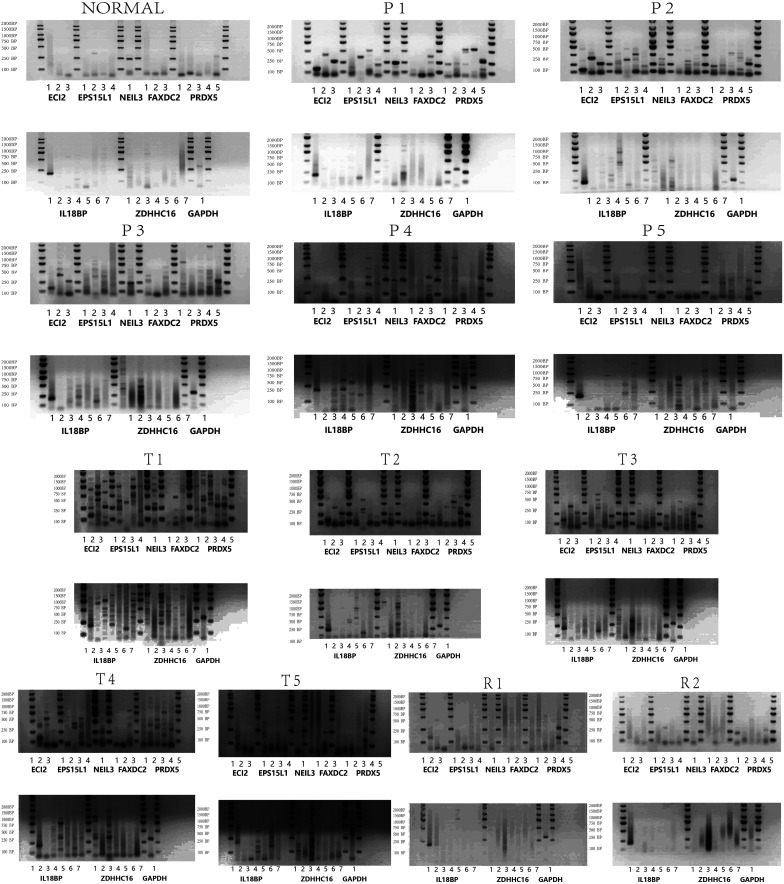
Immunofluorescence scans showed a noticeable rise in CD8+ cell count and a slight elevation in PD-L1 fluorescence intensity in R1 and R2 relative to N. During P1-P5, CD8+ cell count matched that in R1 and R2, but PD-L1 fluorescence intensity exceeded that in R1 and R2. Nonetheless, during T1-T5, the count of CD8+ cells paralleled that in P1-P5, yet the intensity of PD-L1 fluorescence was markedly greater than in P1-P5 and R1-R2 (Figures 7 and 8). In N, solely the AS of ECI2 and NEIL3 was visible, followed by R1 and R2. Both P1-P5 and T1-T5 exhibited a greater prevalence of AS (Table 2, Figures 7 and 8).
Figure 7.
Immune fluorescence results. Green represents CD8 antibody and red represents PD-L1. PD-L1, programmed cell death 1 ligand 1
Figure 8.
Isoforms PCR results. PCR electrophoresis results of multiple splicing isoforms of ECI2, EPS15L1, NEIL3, FAXDC2, PRDX5, IL18BP, and ZDHHC16. PCR, polymerase chain reaction.
Table 2.
Statistics for AS in Different Samples.
| NAMES | N | R1 | R2 | P1 | P2 | P3 | P4 | P5 | T1 | T2 | T3 | T4 | T5 |
|---|---|---|---|---|---|---|---|---|---|---|---|---|---|
| ECI2 | |||||||||||||
| V1 | Δ | * | * | * | # | # | # | # | # | ||||
| V2 | √ | * | * | * | # | # | # | # | |||||
| V3 | * | * | * | # | # | # | # | ||||||
| EPS15L1 | |||||||||||||
| ISO1 | * | # | # | ||||||||||
| ISO2 | Δ | * | * | * | # | # | # | # | # | ||||
| ISO3 | * | * | * | * | # | # | # | ||||||
| ISO4 | * | * | # | # | # | ||||||||
| NEIL3 | |||||||||||||
| X1 | √ | Δ | * | * | * | * | # | # | # | # | # | ||
| FAXDC2 | |||||||||||||
| V1 | |||||||||||||
| VX1 | * | # | # | ||||||||||
| VX2 | * | * | * | # | # | # | # | # | |||||
| PRDX5 | |||||||||||||
| V1 | * | * | * | # | # | # | # | ||||||
| V2 | * | * | * | * | # | # | # | # | # | ||||
| V3 | Δ | * | * | * | * | # | # | # | # | # | |||
| V4 | * | * | * | # | # | # | # | # | |||||
| V5 | Δ | * | * | * | * | * | # | # | # | # | # | ||
| IL18BP | |||||||||||||
| A | * | * | * | # | # | # | # | ||||||
| C | Δ | ||||||||||||
| D | * | # | |||||||||||
| E | * | * | * | * | # | # | # | # | |||||
| F | * | # | |||||||||||
| G | * | * | * | * | * | # | # | # | # | # | |||
| H | * | # | |||||||||||
| ZDHHC16 | |||||||||||||
| V1 | * | * | # | # | # | ||||||||
| V2 | |||||||||||||
| V3 | * | * | * | * | * | # | # | # | # | # | |||
| V4 | * | # | |||||||||||
| V5 | # | ||||||||||||
| V6 | * | # | |||||||||||
| V7 |
Notes: “√” indicates that this type of isoform is present in normal liver tissue; “Δ” indicates that this type of isoform is present in high treatment response HCC tissues; “*” indicates that this type of isoform is present in drug-resistant tumors adjacent normal tissues; “#” indicates that this type of isoform is present in drug-resistant tumors tissues.
AS, alternative splicing; HCC, hepatocellular carcinoma.
Discussion
AS denotes that in the process of post-transcriptional RNA splicing of genes, a single gene may yield varied cleavage patterns, leading to the creation of diverse mRNAs and proteins. Lately, a growing body of research has demonstrated the vital involvement of AS in the evolution and advancement of cancers. Studies indicate the presence of various AS isoforms in HCC tissues, playing a key role in controlling multiple molecular routes such as TGF-b, EGFR, MYC, and VEGF, and are crucial for cell growth, invasion, metastasis, and immune evasion.17-20
Furthermore, the influence of transcription factors and RNA co-protein factors, which control AS, extends to affecting HCC. Considering these factors, AS is progressively emerging as a viable focus for cancer treatment medications. 21 Investigating the variances in AS among drug-resistant and drug-sensitive cancer tissues could beneficially influence our comprehension of tumor resistance processes, the creation of novel treatments, and the enhancement of patient care results.
Elevated TIDE scores and dysfunction scores in the high-risk category suggest malfunctioning T-cells and reduced effectiveness of immunotherapy, implying that the RS is somewhat predictive of immunotherapy's success. Examining the immune microenvironment showed that RS minimally influenced the quantity of immune cells, but mainly impacted their functionality. The RS's ability to distinctly identify various immune subtypes validates that the role of immune cells within the microenvironment is more pivotal than their quantity in influencing HCC regression.13,22
Additionally, examining each AS gene in RSF has shed light on the close connection between RS and tumor immunity. The results of our study reveal notable variances in the gene activity of various ICIs across the groups, especially in the expression of PDCD1LG2, 23 potentially elucidating the resistance to immunotherapy. Subsequent research uncovered that most AS genes play a role in the movement and stimulation of immune cells, as well as in controlling inflammatory reactions. The map of the regulatory network indicated the SNRP family's activity, aligning with its physiological role.24 Furthermore, it was observed that the most stringently controlled SPs, such as SRRT, CPSF6, HNRNPL, RNF34, DDX39A, TIA, NCBP2, ZNF207, and PTBP3, contribute to tumor expansion and immune system regulation, underscoring AS's crucial role in tumor immune evasion.24-33 At the same time, we have also found that these genes have a certain impact on mitochondrial respiratory function, so whether their alternative shears can affect the effect of immunotherapy through affecting mitochondrial function still needs further experimental exploration.
For validating these results, we analyzed the count of CD8+ cells and PD-L1 expression in standard liver tissues, tissues of HCC responsive to drugs, those resistant to drugs, and paracancerous tissues resistant to drugs. Unexpectedly, our findings revealed a greater fluorescence intensity of PD-L1 in the paracancerous tissues of drug-resistant tumors compared to drug-sensitive HCC tissues, underscoring the significance of focusing on the roles of paracancerous tissues in immunotherapy. The PCR outcomes for AS aligned with those obtained from immunofluorescence studies. The manifestation of AS aligned with the intensity of PD-L1 immunofluorescence and could be more pronounced in healthy liver tissues compared to HCC tissues, underscoring AS's substantial effect on the tumor's immune microenvironment, where increased AS results in less potent immunotherapy. In addition, since it is difficult to obtain liver cancer sequencing samples before immunocombined-targeted therapy, we used the samples from the TCGA database. Owing to the extensive variety of protein isoforms resulting from AS and the absence of antibodies for detection in the market, their validation at the protein level was not conducted. Nonetheless, our PCR tests were conducted to establish the level of gene transcription, yielding robust proof.
Conclusion
In summary, we described the AS status of HCC, established RS functions and prognostic models, identified 7 promising AS genes, and analyzed the relationship between AS and immunotherapy from several dimensions including tumor immune microenvironment, tumor immune subtypes, prediction of immunotherapy efficacy, and differential expression of genes associated with immune checkpoints. We also found that immune-resistant HCC tissues and their paraneoplastic tissues not only had significantly higher PD-L1 expression than drug-responsive HCC tissues, but also had more AS, highlighting the potential impact of AS on resistance to immunotherapies.
Supplemental Material
Supplemental material, sj-docx-1-tct-10.1177_15330338241265962 for Prediction Model for Immunotherapy Efficacy in Hepatocellular Carcinoma Based on Alternative Splicing Sequencing Data by Huizhong Shi, Yang Liu, Zhao Liu, Xinlan Ge, Jushan Wu, Haowen Tang, Yi Zhang and Shichun Lu in Technology in Cancer Research & Treatment
Acknowledgments
The graphical abstract was created using https://www.medpeer.cn/.
Abbreviations
- AA
alternate acceptor site
- AD
alternate donor site
- AP
alternate promoter
- AS
alternative splicing
- AT
alternate terminator
- AUC
area under the curve
- C1
wound healing
- C2
IFN-γ dominant
- C3
inflammatory
- C4
lymphocyte depleted
- C5
immunologically quiet
- C6
TGF-β dominant
- DCA
decision curve analysis
- ES
exon skip
- GO
gene oncology
- HCC
hepatocellular carcinoma
- HR
hazard ratio
- ICIs
immune checkpoint inhibitors
- ME
mutually exclusive exons
- mTKIs
multi-target tyrosine kinase inhibitors
- N
normal liver tissue
- OS
overall survival
- P1-P5
drug-resistant tumors adjacent normal tissues
- PCR
polymerase chain reaction
- PD
progress disease
- PD-1
programmed cell death protein 1
- PD-L1
programmed cell death 1 ligand 1
- PSI
percent spliced in
- R1 & R2
HCC with high treatment response
- RI
retained intron
- RSs
risk scores
- RSF
risk-scoring function
- SD
stable disease
- T1-T5
drug-resistant tumors
Footnotes
Contributors: HZ Shi and Y Liu analyzed data, conducted basic experiments. HZ Shi and Z Liu wrote the paper. XL Ge and Y Liu collected the samples. JS Wu and HZ Shi collected and analyzed the clinical data. HW Tang, Y Zhang, and SC Lu supervised and guided the study. All authors contributed to critical revisions of the manuscript and approved the final version of the manuscript for submission.
The authors declared no potential conflicts of interest with respect to the research, authorship, and/or publication of this article.
Ethics Approval: The study protocol was approved by the Ethics Committee of Chinese People's Liberation Army General Hospital, and all enrolled patients were informed in detail and gave written consent. The ethical approval number is S2018-111-01.
Funding: The author(s) received no financial support for the research, authorship, and/or publication of this article.
ORCID iD: Shichun Lu https://orcid.org/0009-0003-7444-734X
Supplemental Material: Supplemental material for this article is available online.
References
- 1.Ioannou GN. Epidemiology and risk-stratification of NAFLD-associated HCC. J Hepatol. 2021;75(6):1476–1484. [DOI] [PubMed] [Google Scholar]
- 2.Yip TC, Lee HW, Chan WK, Wong GL, Wong VW. Asian perspective on NAFLD-associated HCC. J Hepatol. 2022;76(3):726–734. [DOI] [PubMed] [Google Scholar]
- 3.Sung H, Ferlay J, Siegel RL, et al. Global cancer statistics 2020: GLOBOCAN estimates of incidence and mortality worldwide for 36 cancers in 185 countries. CA Cancer J Clin. 2021;71(3):209–249. [DOI] [PubMed] [Google Scholar]
- 4.Bemanian A, Cassidy LD, Fraser R, Laud PW, Saeian K, Beyer KMM. Racial disparities of liver cancer mortality in Wisconsin. Cancer Causes Control. 2019;30(12):1277–1282. [DOI] [PMC free article] [PubMed] [Google Scholar]
- 5.He WQ, Gao X, Gao L, Ma Y, Sun D, Sun J. Contrasting trends of primary liver cancer mortality in Chinese Mongol and non-Mongol. Asian Pac J Cancer Prev. 2021;22(9):2757–2763. [DOI] [PMC free article] [PubMed] [Google Scholar]
- 6.Sidali S, Trépo E, Sutter O, Nault JC. New concepts in the treatment of hepatocellular carcinoma. United European Gastroenterol J. 2022;10(7):765–774. [DOI] [PMC free article] [PubMed] [Google Scholar]
- 7.Zhang Z, Jiao T, Li J, et al. Efficacy of treatment based on TKIs in combination with PD-1 inhibitors for unresectable recurrent hepatocellular carcinoma. World J Surg Oncol. 2023;21(1):53. [DOI] [PMC free article] [PubMed] [Google Scholar]
- 8.Di Federico A, Rizzo A, Carloni R, et al. Atezolizumab-bevacizumab plus Y-90 TARE for the treatment of hepatocellular carcinoma: preclinical rationale and ongoing clinical trials. Expert Opin Investig Drugs. 2022;31(4):361–369. [DOI] [PubMed] [Google Scholar]
- 9.Mollica V, Rizzo A, Marchetti A, et al. The impact of ECOG performance status on efficacy of immunotherapy and immune-based combinations in cancer patients: the MOUSEION-06 study. Clin Exp Med. 2023;23(8):5039–5049. [DOI] [PubMed] [Google Scholar]
- 10.Wright CJ, Smith CWJ, Jiggins CD. Alternative splicing as a source of phenotypic diversity. Nat Rev Genet. 2022;23(11):697–710. [DOI] [PubMed] [Google Scholar]
- 11.Sciarrillo R, Wojtuszkiewicz A, Assaraf YG, et al. The role of alternative splicing in cancer: from oncogenesis to drug resistance. Drug Resist Updat. 2020;53:100728. [DOI] [PubMed] [Google Scholar]
- 12.Ule J, Blencowe BJ. Alternative splicing regulatory networks: functions, mechanisms, and evolution. Mol Cell. 2019;76(2):329–345. [DOI] [PubMed] [Google Scholar]
- 13.Shi H, Zhang W, Hu B, et al. Whole-exome sequencing identifies a set of genes as markers of hepatocellular carcinoma early recurrence. Hepatol Int. 2023;17(2):393–405. doi: 10.1007/s12072-022-10457-x [DOI] [PubMed] [Google Scholar]
- 14.Zhang Z, Shang J, Hu B, et al. Prognosis and tumour immune microenvironment of patients with hepatocellular carcinoma by a novel pyroptosis-related lncRNA signature. Front Immunol. 2022;13:836576. [DOI] [PMC free article] [PubMed] [Google Scholar]
- 15.Lu Y, Yang A, Quan C, et al. A single-cell atlas of the multicellular ecosystem of primary and metastatic hepatocellular carcinoma. Nat Commun. 2022;13(1):4594. [DOI] [PMC free article] [PubMed] [Google Scholar]
- 16.Collins GS, Reitsma JB, Altman DG, Moons KG. Transparent reporting of a multivariable prediction model for individual prognosis or diagnosis (TRIPOD): the TRIPOD statement. Br Med J. 2014;350(jan07 4):g7594. [DOI] [PubMed] [Google Scholar]
- 17.Ma XL, Qu XD, Yang WJ, et al. Elevated soluble programmed death-ligand 1 levels indicate immunosuppression and poor prognosis in hepatocellular carcinoma patients undergoing transcatheter arterial chemoembolization. Clin Chim Acta. 2020;511:67–74. [DOI] [PubMed] [Google Scholar]
- 18.Huang TX, Fu L. The immune landscape of esophageal cancer. Cancer Commun (Lond). 2019;39(1):79. [DOI] [PMC free article] [PubMed] [Google Scholar]
- 19.Ryan MC, Cleland J, Kim R, Wong WC, Weinstein JN. Spliceseq: a resource for analysis and visualization of RNA-Seq data on alternative splicing and its functional impacts. Bioinformatics. 2012;28(18):2385–2387. [DOI] [PMC free article] [PubMed] [Google Scholar]
- 20.Zhou HZ, Li F, Cheng ST, et al. DDX17-regulated alternative splicing that produced an oncogenic isoform of PXN-AS1 to promote HCC metastasis. Hepatology. 2022;75(4):847–865. [DOI] [PMC free article] [PubMed] [Google Scholar]
- 21.Lee SE, Alcedo KP, Kim HJ, Snider NT. Alternative splicing in hepatocellular carcinoma. Cell Mol Gastroenterol Hepatol. 2020;10(4):699–712. [DOI] [PMC free article] [PubMed] [Google Scholar]
- 22.Yu L, Kim J, Jiang L, et al. MTR4 drives liver tumorigenesis by promoting cancer metabolic switch through alternative splicing. Nat Commun. 2020;11(1):708. [DOI] [PMC free article] [PubMed] [Google Scholar]
- 23.Chen D, Zhao Z, Chen L, Li Q, Zou J, Liu S. PPM1G promotes the progression of hepatocellular carcinoma via phosphorylation regulation of alternative splicing protein SRSF3. Cell Death Dis. 2021;12(8):722. [DOI] [PMC free article] [PubMed] [Google Scholar]
- 24.Ma WK, Voss DM, Scharner J, et al. ASO-based PKM splice-switching therapy inhibits hepatocellular carcinoma growth. Cancer Res. 2022;82(5):900–915. [DOI] [PMC free article] [PubMed] [Google Scholar]
- 25.Ruf B, Heinrich B, Greten TF. Immunobiology and immunotherapy of HCC: spotlight on innate and innate-like immune cells. Cell Mol Immunol. 2021;18(1):112–127. [DOI] [PMC free article] [PubMed] [Google Scholar]
- 26.Fan F, Chen K, Lu X, Li A, Liu C, Wu B. Dual targeting of PD-L1 and PD-L2 by PCED1B-AS1 via sponging hsa-miR-194-5p induces immunosuppression in hepatocellular carcinoma. Hepatol Int. 2021;15(2):444–458. [DOI] [PubMed] [Google Scholar]
- 27.Zahler AM, Rogel LE, Glover ML, Yitiz S, Ragle JM, Katzman S. SNRP-27, the C. elegans homolog of the tri-snRNP 27K protein, has a role in 5’ splice site positioning in the spliceosome. RNA. 2018;24(10):1314–1325. [DOI] [PMC free article] [PubMed] [Google Scholar]
- 28.Lykke-Andersen S, Rouvière JO, Jensen TH. ARS2/SRRT: at the nexus of RNA polymerase II transcription, transcript maturation and quality control. Biochem Soc Trans. 2021;49(3):1325–1336. [DOI] [PubMed] [Google Scholar]
- 29.Tan S, Zhang M, Shi X, et al. CPSF6 links alternative polyadenylation to metabolism adaption in hepatocellular carcinoma progression. J Exp Clin Cancer Res. 2021;40(1):85. [DOI] [PMC free article] [PubMed] [Google Scholar]
- 30.Gu J, Chen Z, Chen X, Wang Z. Heterogeneous nuclear ribonucleoprotein (hnRNPL) in cancer. Clin Chim Acta. 2020;507:286–294. [DOI] [PubMed] [Google Scholar]
- 31.He X, Zhu Y, Zhang Y, et al. RNF34 functions in immunity and selective mitophagy by targeting MAVS for autophagic degradation. EMBO J. 2019;38(14):e100978. [DOI] [PMC free article] [PubMed] [Google Scholar]
- 32.Bao Y, Jiang A, Dong K, et al. DDX39 As a predictor of clinical prognosis and immune checkpoint therapy efficacy in patients with clear cell renal cell carcinoma. Int J Biol Sci. 2021;17(12):3158–3172. [DOI] [PMC free article] [PubMed] [Google Scholar]
- 33.Akira S, Maeda K. Control of RNA stability in immunity. Annu Rev Immunol. 2021;39(1):481–509. [DOI] [PubMed] [Google Scholar]
Associated Data
This section collects any data citations, data availability statements, or supplementary materials included in this article.
Supplementary Materials
Supplemental material, sj-docx-1-tct-10.1177_15330338241265962 for Prediction Model for Immunotherapy Efficacy in Hepatocellular Carcinoma Based on Alternative Splicing Sequencing Data by Huizhong Shi, Yang Liu, Zhao Liu, Xinlan Ge, Jushan Wu, Haowen Tang, Yi Zhang and Shichun Lu in Technology in Cancer Research & Treatment


