Figure 2.
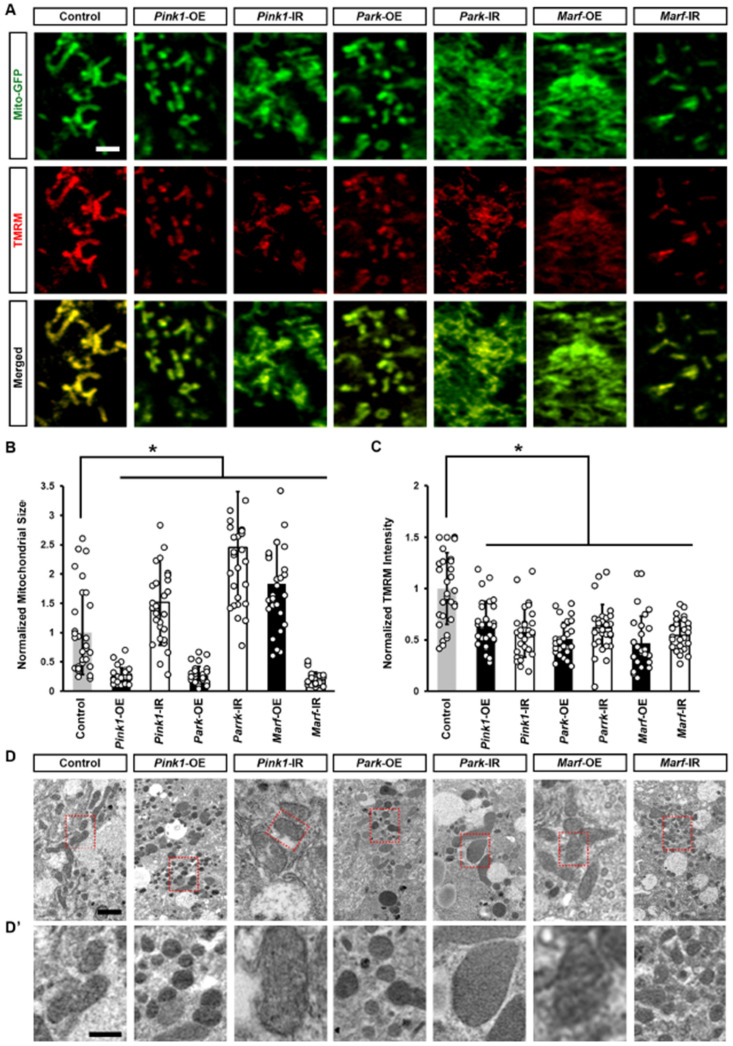
Defective mitochondrial dynamics resulted in altered mitochondrial morphology and reduced mitochondrial function: (A–D’) Mitochondrial morphology in Drosophila nephrocytes (female, 4-day-old) overexpressing (OE) or inhibiting (RNAi; IR) Pink1, park, or Marf. Control, Dot > mito-GFP. (A) Dot > mito-GFP (green) was to label the mitochondria. Mitochondrial membrane potential was indicated by TMRM (red). Scale bar = 1 µm. (B) Quantitation of mitochondrial size in Pink1/park/Marf-OE/IR nephrocytes. (C) Quantitation of TMRM fluorescence in Pink1/park/Marf-OE/IR nephrocytes. (D,D’) Transmission electron microscopy (TEM) of mitochondria in nephrocytes. Red dotted box outlines the area magnified in (D’). Scale bar: (D) = 5 µm; (D’) = 2 µm. N = 30 mitochondria from 6 flies, per group per assay. Results presented as mean ± SD; statistical significance: *, p < 0.05.

