Abstract
Activated hepatic stellate cells produce increased type I collagen in hepatic fibrosis. The increase in type I collagen protein results from an increase in mRNA levels that is mainly mediated by increased mRNA stability. Protein–RNA interactions in the 3′-UTR of the collagen α1(I) mRNA correlate with stabilization of the mRNA during hepatic stellate cell activation. A component of the binding complex is αCP2. Recombinant αCP2 is sufficient for binding to the 3′-UTR of collagen α1(I). To characterize the binding affinity of and specificity for αCP2, we performed electrophoretic mobility shift assays using the poly(C)-rich sequence in the 3′-UTR of collagen α1(I) as probe. The binding affinity of αCP2 for the 3′-UTR sequence is ∼2 nM in vitro and the wild-type 3′ sequence binds with high specificity. Furthermore, we demonstrate a system for detecting protein–nucleotide interactions that is suitable for high throughput assays using molecular beacons. Molecular beacons, developed for DNA–DNA hybridization, are oligonucleotides with a fluorophore and quencher brought together by a hairpin sequence. Fluorescence increases when the hairpin is disrupted by binding to an antisense sequence or interaction with a protein. Molecular beacons displayed a similar high affinity for binding to recombinant αCP2 to the wild-type 3′ sequence, although the kinetics of binding were slower.
INTRODUCTION
Cirrhosis, a leading cause of death, results from overexpression of extracellular matrix proteins, including collagen type I, in the liver. The major source of type I collagen in cirrhosis is activated hepatic stellate cells. Upon a fibrogenic stimulus hepatic stellate cells are transformed from a quiescent to an activated phenotype (for reviews see 1,2). We have previously shown that the type I collagen α1(I) mRNA is primarily regulated at the post-transcriptional level in activated hepatic stellate cells, resulting in a markedly increased half-life (from ∼1.5 to >24 h) (3). Part of the increased mRNA stability may be mediated by the binding of αCP2 (also known as hnRNPE2 and PCBP2) to a C-rich region in the 3′-UTR of collagen α1(I) mRNA. αCP2, first described as a component of the α complex, binds to the 3′-UTR of α-globin mRNA and is required for its stability (4,5). Subsequent studies demonstrated binding of αCP2 to the 3′-UTR of tyrosine hydroxylase and 15-lipoxygenase, indicating that it may perform a regulatory function for multiple mRNAs (6,7). Additional collagen α1(I) mRNA stability may be mediated via a conserved 5′ stem–loop sequence (8,9).
αCP2 belongs to a family of proteins characterized by the presence of an RNA-binding domain known as the KH domain. KH domains are responsible for binding specific RNA sequences by the induced fit mechanism (10,11). KH domain-containing proteins play key regulatory roles in the processing of RNA, from splicing to mRNA stability. Proteins containing KH domains usually have multiple domains, but one is sufficient for RNA binding (12). A group of KH proteins, including αCP1, αCP2, hnRNPK and nova, contain two N-terminal KH domains attached by a linker region to a C-terminal KH domain, suggesting a possible functional relationship between these proteins (10).
The electrophoretic mobility shift assay (EMSA) with radiolabeled RNA probes is the usual technique to measure RNA-binding proteins, but it is not amenable to multiple assays or screening approaches. αCP2 binding may also be studied using radiolabeled DNA probes, since the interaction between αCP2 and either RNA or DNA are identical in EMSA studies (13,14). An alternative method to EMSA would be to monitor the binding of fluorescent DNA oligonucleotide probes in solution. Molecular beacons are DNA oligonucleotides with a coupled fluorophore–quencher pair, one on the 5′- and one on the 3′-end. The presence of complementary sequences just prior to the fluorophore allows the formation of a hairpin which brings the fluorophore and quencher close together, quenching the fluorescence. When this hairpin is disrupted by binding to an antisense sequence, the fluorophore and quencher are separated, resulting in an increase in fluorescence. This technique has been used to monitor the accumulation of PCR products, but has not been used to monitor protein–nucleic acid interactions prior to this study (15,16).
In this study we undertook an examination of αCP2 to characterize its specificity and binding affinity for the 3′-UTR of collagen α1(I) mRNA. We used EMSA and molecular beacon technology to examine protein–nucleotide interactions with purified, recombinant αCP2. We show that αCP2 specifically binds to the 3′-UTR of collagen α1(I) with high affinity in the absence of additional factors. Furthermore, we have used molecular beacon probes to examine αCP2–DNA interactions as a new technique for determining protein–oligonucleotide interactions. Factors that disrupt the αCP2–molecular beacon (MB) interaction would be potential anti-fibrotic therapeutics.
MATERIALS AND METHODS
Recombinant protein purification
GST–αCP2 was produced as described by Frangioni and Neel (17). Briefly, αCP2 cDNA was cloned into the PGEX-3X vector and then transformed into Escherichia coli DH5α. Expression was induced in exponentially growing cells by addition of 0.1 mM IPTG. The cells were grown for an additional 3 h prior to harvesting and lysis by sonication. The sonicated cells were spun at 8000 r.p.m. in a Sorvall SS-34 rotor to remove cellular debris and the supernatant was incubated overnight with 500 µl of glutathione–Sepharose beads (Amersham Pharmacia Biotech, Germany) with protease inhibitors. The beads were washed three times in ice-cold phosphate-buffered saline (PBS) and the recombinant protein eluted with 50 mM reduced glutathione in 100 mM Tris pH 7.6, 100 mM NaCl2. The beads were removed from the supernatant by centrifugation. Protein concentration was determined by running 10–50 µl of the supernatant on an SDS gel, staining with Coomassie brilliant blue and comparison to standards with AlphaImager software (Alpha Innotech Corp.). Proteins were stored in 5% glycerol at –80°C.
Cytoplasmic lysates
NIH 3T3 cells were grown in DMEM plus 10% calf serum and antibiotics. Cells were washed in ice-cold PBS, scraped off the plate in 1 ml of PBS and centrifuged at 14 000 r.p.m. at 4°C for 5 min. The resulting pellet was resuspended in 100–300 µl of hypotonic lysis buffer [10 mM Tris 7.6, 1 mM potassium acetate, 1.5 mM magnesium acetate, 2 mM dithiothreitol (DTT) and protease inhibitors] on ice. Cells were lysed by 5–10 strokes with a 1.5 ml pellet pestle (Nalgene 749521-1590) and the cytoplasm cleared of debris by centrifuging at 14 000 r.p.m. for 10 min at 4°C. Lysates were stored at –80°C. Protein determination was by the Bradford assay (Bio-Rad, Richmond, CA) using BSA as the standard.
EMSA
Proteins were suspended in binding buffer (12.5 mM HEPES pH 7.9, 15 mM KCl, 0.25 mM EDTA, 5 mM MgCl2, 1 mM DTT, 0.2 mg/ml tRNA, 50 U RNasin, 10% glycerol) to a total volume of 20 µl and RNA added to the reaction mix to a total volume of 25 µl. An aliquot of 12 000 c.p.m. of radiolabeled RNA was added per reaction. The reactions were incubated on ice for 30 min prior to running on 6% native gels (60:1 acrylamide:bis-acrylamide) for 90 min at 250 mV. The gel was dried and exposed to film or quantitated on a PhosphoImager as described in the figure legends (9).
Kd determination
For Kd determination, excess αCP2 was used to determine how much of the probe was able to be bound, referred to as ‘active’ probe. This was used in determining the amount of free and bound probe. Newly synthesized, gel-purified probes produced >99% active probe. Non-linear regression was done as in Zheng et al. (19).
Nucleotide sequences and labeling
The wild-type 3′-UTR sequence was cloned into a plasmid containing an upstream T7 promoter, which was used for in vitro transcription with radiolabeled [32P]UTP. The DNA oligonucleotides were phosphorylated with [γ-32P]ATP by polynucleotide kinase. The mutant RNA oligonucleotides were generated by transcription with T7 RNA polymerase using oligonucleotide templates containing the T7 start and the antisense binding target sequence. All probes were purified by electrophoresis on a 6% native gel as above. The synthesized probe was sliced out of the gel and extracted overnight in 10 mM Tris pH 7.6, 100 mM NaCl2 and ethanol precipitated and resuspended in RNase-free water prior to use.
Molecular beacon and oligonucleotide design
The molecular beacon sequence was based on the minimal binding sequence on the collagen 3′-UTR except for a 3 nt deletion. This sequence was chosen because of a better signal-to-noise ratio upon fluorescence of the molecular beacon (data not shown). At the 5′-end the molecular beacon contained a 6′-FAM group, with a DABCYL group at the 3′-end. The molecular beacon and the corresponding antisense oligodeoxynucleotides were synthesized and dried at Midland Certified Reagent Co. (Midland, TX). The molecular beacon and the oligonucleotides were rehydrated and stored at concentrations of 100 µM at –20°C until use. Sense oligonucleotides for competition experiments were synthesized at TIB MolBiol (Berlin, Germany) and stored under identical conditions.
Melting point determinations
The melting curves of the molecular beacon and the homologous oligonucleotide sequence (S40) were recorded by measuring the hyperchromicity of the molecules. This was done at a concentration resulting in an extinction of 1 OD at 260 nm in 50 mM KCl, 5 mM MgCl2, 20 mM Tris–HCl, pH 7.5, 0.001% (v/v) Brij-35 in 100 µl microcuvettes in a heated Beckman DU640 spectral absorption photometer.
Experiments were conducted in 384-well plates (Greiner Labortechnik, Germany). All pipetting steps were performed using a Shallow Well-IGEL 384 (CyBio AG, Germany). All measurements were performed using a Fluoroskan Ascent (Labsystems, Germany). Excitation wavelength was 485 nm (slit 20 nm) and emission was measured with a 520 nm (slit 20 nm) filter in a reaction volume of 50 µl. All reactions were performed at 37°C or at room temperature as stated in the figure legends. All data points consist of at least four reactions.
Concentrations of αCP2 and the GST control protein used were 0.07, 0.14, 0.28 and 0.56 µM and molecular beacon concentrations were 0.025, 0.05 and 0.1 µM. Reactions were started by addition of molecular beacon. Fluorescence readings were obtained at regular intervals of 3 min to 8 h; observation times up to 24 h were chosen. Routinely, as a reference, maximum fluorescence dequenching was obtained within 3 min by addition of a 4-fold excess of antisense DNA over molecular beacon. All experiments included controls for the intrinsic fluorescence consisting of assay buffer alone, assay buffer with molecular beacon, and assay buffer with αCP2.
The relative fluorescence increase freaction was calculated as
freaction = (Freaction – Fbuffer) ÷ (Fprotein alone + Fmolecular beacon alone – 2 × Fbuffer)
with Freaction being the fluorescence observed with the protein–molecular beacon interaction, Fbuffer the fluorescence observed with the assay buffer control, Fprotein alone the fluorescence observed with the protein control and Fmolecular beacon alone the fluorescence observed with the molecular beacon control.
The concentration of the αCP2–molecular beacon complex was calculated according to
[αCP2] = freaction ÷ fmax × [αCP2]0
with fmax being the relative fluorescence increase after addition of the antisense oligonucleotide.
Initial reaction velocities were determined during the linear phase of the reaction. With initial velocity v and initial concentrations [αCP2]0 and [MB]0, the kinetic constant k was calculated according to
k = v ÷ ([αCP2]0 × [MB]0).
Competition binding experiments
In competition binding experiments, αCP2 at a concentration of 0.05 µM was preincubated overnight at room temperature in the presence of various sense DNA oligonucleotide concentrations, ranging from 3.2 to 0.05 µM (Table 1). Reactions were started by addition of 0.07 µM molecular beacon.
Table 1. Oligonucleotide sequences of single-stranded probes.
| Probe | Sequence |
|---|---|
| Wild-type 3′-UTR RNA | 5′-UCC CUC CCA CCC AGC CCA CUU UUC CCC AAC CCU-3′ |
| CONS DNA | 5′-TCC CTC CCA CCC AGC CCA CTT TTC CCC AAC CCT-3′ |
| CONS+SL DNA | 5′-GCGTGT TCC CTC CCA CCC AGC CCA CTT TTC CCC AAC CAC ACG C-3′ |
| CONS DNA D1 | 5′-TCA CTC CCA CCC AGC CCA CTT TTC ACC AAC ACT-3′ |
| CONS DNA D3 | 5′-TCC CTC CCA CAC AGC CCA CTT TTC ACC AAC ACT-3′ |
| CONS DNA D5 | 5′-TCC CTC CCA CCC AGC CCA CTT TTC ACC AAC CCT-3′ |
| CONS DNA D6 | 5′-TCC CTC CCA CCC AGC CCA CTT TTC CCC AAC ACT-3′ |
| CONS DNA D356 | 5′-TCC CTC CCA CAC AGC CCA CTT TTC ACC AAC ACT-3′ |
| S40 (truncated recognition sequence and stem) | 5′-GCG TGT TCC CTC CCA AGC CCA CTT TTC CCC AAC CAC ACG C-3′ |
| S28 (truncated recognition sequence) | 5′-TCC CTC CCA (CCC) AGC CCA CTT TTC CCC AAC C-3′ |
| Poly(C) | 5′-CCC CCC CCC CCC CCC CCC CCC CCC CCC CCC CCC-3′ |
| Poly(G) | 5′-GGG GGG GGG GGG GGG GGG GGG GGG GGG GGG GGG-3′ |
| Mutant 2 | 5′-TCC CTC CCA CCC AGC CCA GAA AAG ATC TGG CCT-3′ |
Sequences in bold are stem–loop sequences. Underlined nucleotides indicate the C→A mutations used in EMSAs.
Activation energy determination
Reactions were performed in 96-well plates (Greiner Labortechnik, Germany) in a total volume of 100 µl with αCP2 at a concentration of 0.24 µM and molecular beacon at 0.2 µM. Reactions were performed at 4, 10, 17, 23, 30 and 37°C. Sample aliquots were incubated separately at the respective temperature and quickly transferred to the MTP for fluorescence read-out. Fluorescence was measured after 0, 30, 60, 90 and 150 min. fmax was reached at the end of the observation interval by addition of antisense oligonucleotides at a concentration of 1 µM.
In the Arrhenius plot (lnk versus 1/T), the slope yielded the activation energy according to
d(lnk)/d(1/T) = –Ea/R,
with R = 8.31441 J/K/mol.
RESULTS
Recombinant αCP2
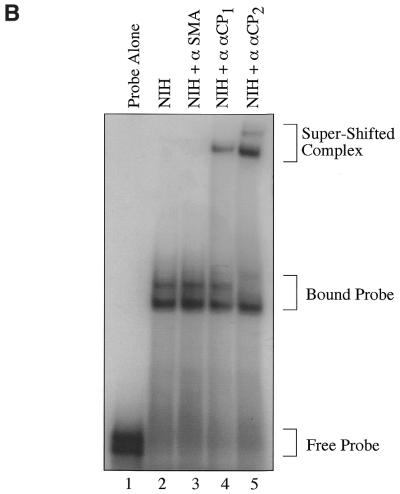
αCP2 RNA-binding activity is present in collagen-producing fibroblasts and activated hepatic stellate cells, where it binds to and stabilizes collagen α1(I) mRNA (3). In this study we have assessed the binding of purified recombinant αCP2 to the 3′-UTR of collagen α1(I) mRNA independent of other putative cofactors. Recombinant GST–αCP2 alone binds to an RNA probe consisting of 30 nt of the poly(C)-rich region in the 3′-UTR of collagen α1(I), hereafter referred to as the 3′-UTR (Fig. 1A, lane 2, and Table 1). When the recombinant GST–αCP2 fusion protein was cleaved with Factor Xa to remove the GST, the αCP2 fragment still binds to the 3′-UTR probe (Fig. 1A, lane 3). This supports the concept that αCP2 does not require post-translational modifications for binding to the collagen α1(I) 3′-UTR. The binding activity to the 3′-UTR present in NIH 3T3 cytoplasmic lysates migrates at a similar rate on native gels to the recombinant Factor Xa-cleaved αCP2 (Fig. 1A, lane 4), suggesting that it is the only factor required for binding. This complex migrates at the same rate as the binding activity in activated human hepatic stellate cells (hscs) (Fig. 1A, lane 5). However, the binding activity of cytoplasmic lysates from NIH 3T3 cells to the 3′-UTR may also appear as a doublet, possibly reflecting the binding of additional components, different isoforms of αCP2 or modified αCP2. Using specific antibodies against αCP1 and αCP2, we demonstrate that both proteins contribute to the binding of radiolabeled 3′-UTR RNA in NIH 3T3 cytoplasmic lysates (Fig. 1B). Both αCP1- and αCP2-specific antibodies caused a supershift (Fig. 1B, lanes 4 and 5), while a control antibody against smooth muscle actin did not (lane 3). It appears that the upper band in the doublet is entirely comprised of αCP2, as it shifts completely in the presence of a specific antibody to αCP2 (Fig. 1B, lane 5). Endogenous αCP2 may undergo some modifications in vivo that are responsible for the different migration rates of the cleaved recombinant αCP2 and the endogenous protein (Fig. 1A).
Figure 1.
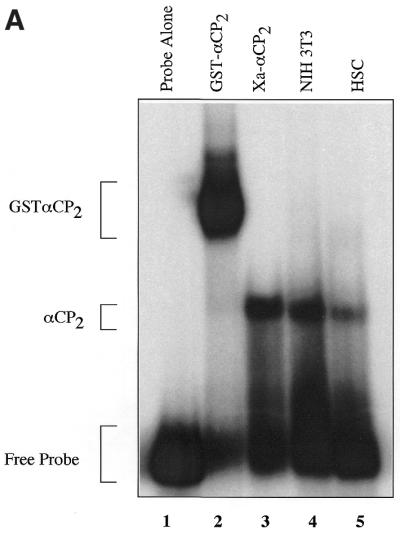
αCP2 binds to the collagen α1(I) 3′-UTR. (A) In vitro transcribed RNA labeled by [α-32P]UTP incorporation was incubated with either no extract (lane 1), 40 ng recombinant GST–αCP2 (lane 2), 20 ng recombinant Factor Xa-cleaved GST–αCP2 (lane 3), 10 µg NIH 3T3 cytoplasmic lysate (lane 4) or 10 µg cytoplasmic lysate from activated human hscs (lane 5). The extracts were incubated on ice for 30 min with 11 000 c.p.m. (∼10 pmol) of probe in a total volume of 25 µl and electrophoresed on a 6% native acrylamide gel. The gel was dried and exposed to film. (B) Specific antibodies were used to supershift αCP1 (lane 4) or αCP2 (lane 5), while an antibody to smooth muscle actin did not cause a shift (lane 3). Binding reactions were done as in (A). Antibodies were generous gifts from R. Andino and M. Czyzyk-Krzeska.
Recombinant αCP2 binds to specific sequences
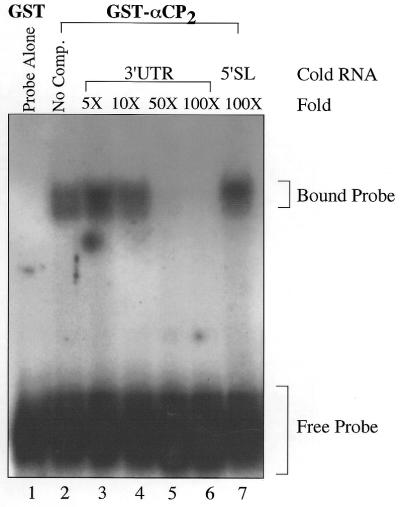
The originally identified α complex consisted of multiple proteins that specifically bound to the α-globin 3′-UTR, but the requirement for protein factors other than αCP2 for binding was unclear. To test whether recombinant αCP2 alone was also specific for the 3′-UTR of collagen α1(I), an RNA competition was carried out by adding excess amounts of cold 3′-UTR RNA to the reactions. Binding of the probe was abolished at 50- to 100-fold excess of cold 3′-UTR RNA (Fig. 2, lanes 5 and 6), but 100-fold excess of an unrelated sequence was unable to abolish binding (Fig. 2, lane 7). This indicates that recombinant GST–αCP2 contains the specificity observed in cell extracts of the α complex and supports the hypothesis of binding in a sequence-specific manner.
Figure 2.
Binding of the 3′-UTR is competed by cold 3′-UTR RNA. In this experiment 20 ng GST–αCP2 was incubated with 15 000 c.p.m. (15 pmol) of radiolabeled RNA. Cold RNA, at the indicated fold excess, was added just prior to incubation with the radiolabeled probe and the reaction mixture kept on ice for 30 min prior to electrophoresis on a 6% native gel. The addition of cold 3′-UTR in excess competed with binding of the radiolabeled probe (lanes 2–6). Addition of 100-fold excess of an unrelated sequence (lane 7) had no effect on binding, indicating a specific interaction of GST–αCP2 with the 3′-UTR.
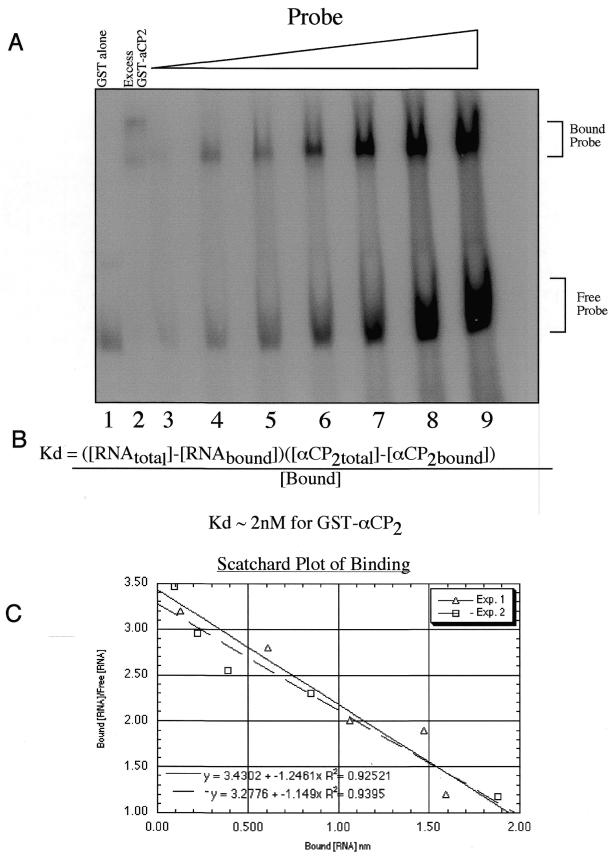
To determine the affinity of αCP2 binding to the 3′-UTR, increasing amounts of probe were added to a constant amount of αCP2 protein (Fig. 3A) (18). By measuring the amount of bound and free probe the Kd was determined. Using this assay and non-linear regression (19), an equilibrium Kd value of 2.1 nM was obtained (Fig. 3B), a value consistent with the low nanomolar Kd of other RNA-binding proteins (20). Additional experiments performed with a constant amount of probe and increasing amounts of recombinant protein produced similar results. Additionally, a Scatchard analysis of the data was done as a graphic representation of the non-linear calculations and is shown in Figure 3C. The Scatchard plot gave a Kd of ∼1 nM, close to the non-linear regression determined Kd.
Figure 3.
Recombinant GST–αCP2 binds the 3′-UTR with a Kd of 2.1 nM. Recombinant GST–αCP2 was incubated at a constant amount, between 1 and 4 pmol, with increasing amounts of radiolabeled RNA probe added to the incubation mixture to determine the Kd of GST–αCP2 binding. (A) In lane 2, 44 pmol αCP2 was added to ensure that all the probe was active or able to be bound, while only 4.4 pmol αCP2 was used in lanes 3–9. In lanes 1 and 2, 5 pmol radiolabeled RNA was used and in lane 3, 2.5 pmol was used. Then the amount of probe was increased to 5, 7.5, 15, 30, 46 and 60 pmol in lanes 4–9, respectively. The samples were run on a 6% native gel, dried and exposed on a PhosphoImager cassette and quantitated. (B) The equation shown was used in non-linear regression to determine the Kd of αCP2 with the 3′-UTR of collagen α1(I) (19). Several gels were quantitated and analyzed separately and averaged to determine a Kd of 2.1 nM for αCP2. (C) A Scatchard analysis of two representative gels was performed. Non-linear analysis was preferred to Scatchard analysis and this value was used for final determination of the Kd.
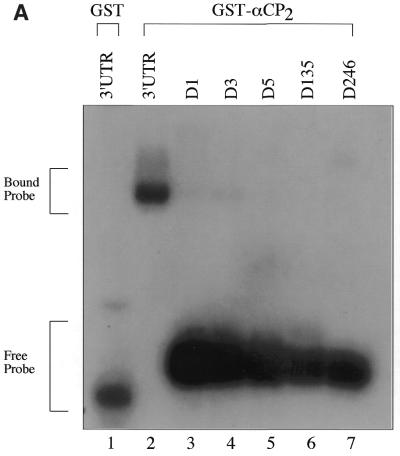
We next assessed the sequence specificity of the poly(C)-rich 3′-UTR for binding to αCP2. Given the presence of six triple C repeats in the 3′-UTR sequence, we selectively mutated the middle C to an A in each of the six triplets (see Table 1). Interestingly, the single point mutations D1, D3 and D5 in the radiolabeled RNAs caused >95% loss of binding to recombinant αCP2, despite there still being 19 of the 20 C residues in the sequence (Fig. 4A).
Figure 4.
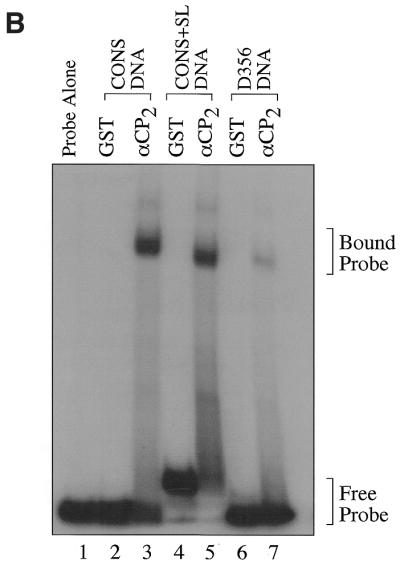
GST–αCP2 specifically binds 3′-UTR DNA sequences. (A) RNA sequences containing point mutations in the C triplets present in the 3′-UTR were generated as described in Materials and Methods. These were used in EMSA reactions to determine if the base changes affected binding of αCP2. The point mutations resulted in a >95% decrease in binding by αCP2, indicating a very high sequence specificity in the EMSA reactions. (B) Radiolabeled DNA was synthesized by phosphorylating 200 ng ssDNA using polynucleotide kinase and [γ-32P]ATP. The probes were gel purified and 15 000 c.p.m. were used per reaction. The 3′-UTR DNA binds specifically to GST–αCP2 (lanes 2 and 3). The addition of a stem–loop sequence to the ends of the 3′-UTR sequence did not affect binding to GST–αCP2 (lanes 4 and 5). Mutations in three of the C triplet repeats caused an 80% reduction in binding the DNA (lanes 6 and 7).
We also examined if single-stranded (ss)DNA oligonucleotides could bind with specificity to αCP2 and if the presence of stem–loop sequences affected binding. DNA sequences containing the wild-type 3′-UTR sequence (CONS DNA) bound to recombinant GST–αCP2 specifically (Fig. 4B, lanes 2 and 3). The addition of complementary sequences, both 5′ and 3′ of the 3′-UTR, to enable formation of a stem–loop (CONS+SL DNA), did not affect binding (Fig. 4B, lanes 4 and 5). The stem–loop sequence, listed in Materials and Methods, is similar to the sequence of the molecular beacon described later. Characterization of the single point mutations was not possible with the DNA oligonucleotides due to a non-specific interaction with the GST domain. Single mutants D3, D5 and D6 bound non-specifically to GST alone (data not shown), but mutants in three of the six C triplets (D356 DNA) showed an 80% decrease (quantitated by densitometry) in binding to GST–αCP2 (Fig. 4B, lanes 6 and 7). These data were the basis for the generation and characterization of the αCP2 interaction with the molecular beacon.
Molecular beacon analysis of the αCP2–target sequence interaction
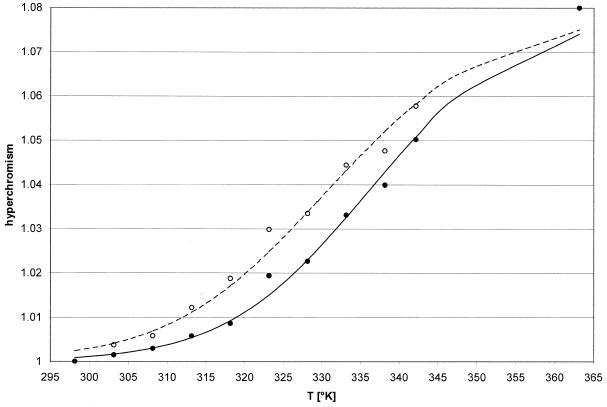
Molecular beacons provide the potential for examining protein–nucleotide interactions by monitoring changes in fluorescence. The melting characteristics of the molecular beacon and of the homologous oligonucleotide sequence without the fluorophore and quencher are similar. Both molecules melted with a broad transition (Fig. 5). At the buffer conditions used the melting point was at ∼337 K for the molecular beacon and ∼331 K for the S40 oligonucleotide.
Figure 5.
Hyperchromism curves of the MB and S40 sequences. The MB and S40 oligonucleotides were dissolved in reaction buffer at a concentration of 1 OD (260 nm) in heated 100 µl quartz cuvettes. Temperature was increased in 5 K steps and the absorbance at 260 nm recorded. MB, filled circle; S40, open circle.
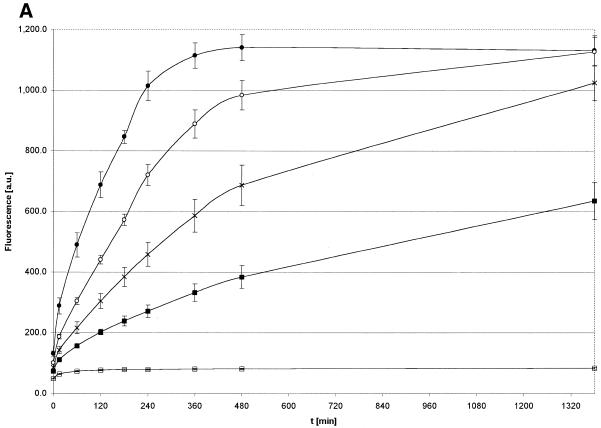
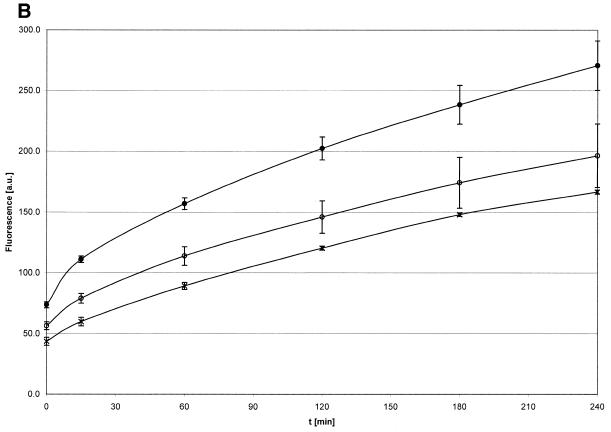
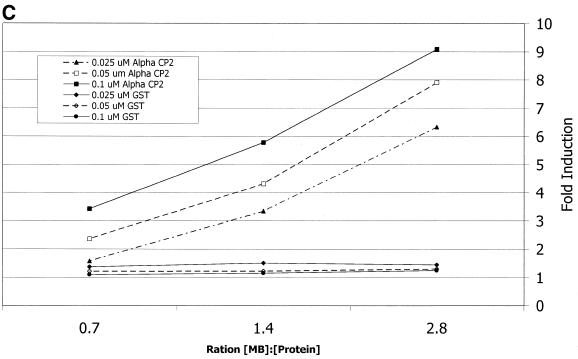
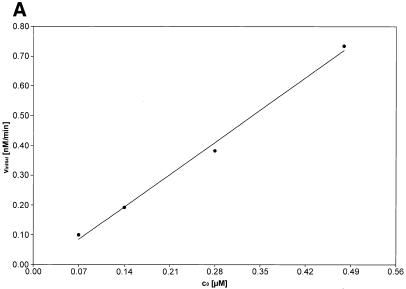
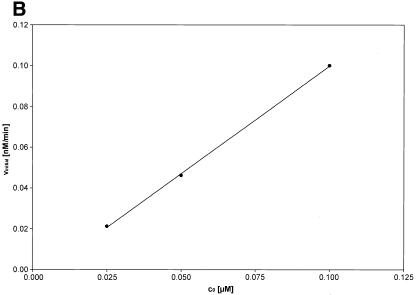
The underlying hypothesis is that when αCP2 binds to a molecular beacon containing its single-strand binding site, the interaction will disrupt the hairpin loop, relieve the quenching and produce an increase in fluorescence. On examining the αCP2–MB interactions as described in Materials and Methods, the fluorescence was concentration dependent. With a constant molecular beacon concentration, the increase in fluorescence intensity was proportional to the increase in αCP2 concentration (Fig. 6A). Likewise, with a constant αCP2 concentration, the fluorescence increase was proportional to the increase in molecular beacon concentration (Fig. 6B). No significant change in fluorescence was observed when GST or BSA was used instead of GST–αCP2 at comparable concentrations, reflecting the specificity of the interaction (Fig. 6C). Additional studies with BSA or GST up to 400-fold excess of molecular beacon showed no increase in fluorescence (data not shown). The dual concentration dependence of these data indicate a second order reaction. The initial velocities of both constant protein and constant molecular beacon were examined (Fig. 7A and B). The increase in fluorescence was slow under our assay conditions, with maximum fluorescence levels reached after ∼20 h. However, this rate increased with the inclusion of glycerol in the incubation (data not shown), as routinely used in EMSAs. The αCP2–MB maximum fluorescence obtained in titration experiments was ∼80% of the maximal fluorescence observed with antisense oligonucleotides.
Figure 6.
Kinetics of the αCP2–MB interaction. The kinetics of the fluorescent reaction at 37°C at constant concentrations of either molecular beacon (A) or αCP2 (B). (A) Molecular beacon (0.1 µM) and different concentrations of αCP2 (filled circle, 0.56 µM; open circle, 0.28 µM; cross, 0.14 µM; filled box, 0.07 µM; open box, 0 µM). The reaction was slow, with maximum fluorescence reached after ∼20 h. (B) αCP2 (0.07 µM) and different concentrations of molecular beacon (filled circle, 0.1 µM; open circle, 0.05 µM; cross, 0.025 µM). (C) GST and αCP2 were used with a constant MB concentration to assess non-specific protein–MB interactions. There was no increase with GST alone, indicating that the fluorescence is due to a specific interaction between αCP2 and the MB sequence. The concentration of MB is noted in the figure; the data points were all taken at 480 min, under the conditions described in Materials and Methods.
Figure 7.
Initial velocities of the αCP2–MB interaction. (A) The initial velocities (vinitial) of the association reaction at 37°C at a constant concentration of molecular beacon (0.1 µM) and different concentrations of αCP2 (0.48, 0.28, 0.14 and 0.07 µM). vinitial is proportional to the concentration of αCP2. (B) The initial velocities (vinitial) of the association reaction at 37°C at constant concentrations of αCP2 (0.07 µM) and different concentrations of molecular beacon (0.1, 0.05 and 0.025 µM). vinitial is proportional to the concentration of molecular beacon.
Specificity of αCP2–MB binding
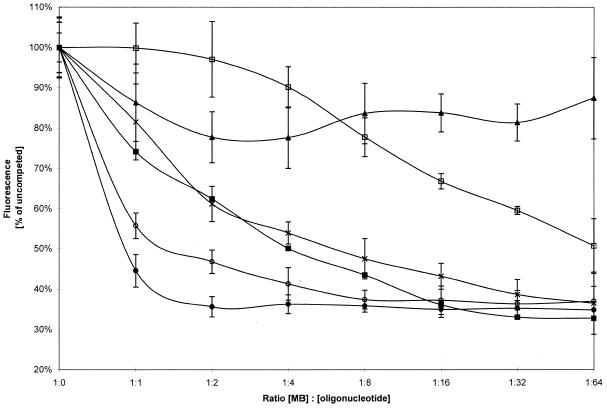
To assess the specificity of the αCP2–MB interaction, competition experiments were done using DNA sequences without the fluorophore (see Table 1). αCP2 was preincubated with unlabeled oligonucleotides at different concentrations prior to addition of the molecular beacon and the fluorescence was compared to a control uncompeted reaction. After preincubation with equimolar concentrations of poly(C) the fluorescence was decreased to ∼40% of the uncompeted reaction. A maximal inhibition of 45% relative to the uncompeted reaction was obtained with an 8-fold molar excess of poly(C) over molecular beacon (Fig. 8).
Figure 8.
Inhibitory oligonucleotides compete with the molecular beacon. Inhibition of fluorescence increases with addition of different oligonucleotides. αCP2, at a concentration of 0.05 µM, was preincubated overnight with various excesses of sense DNA oligonucleotides [filled circle, poly(C); open circle, S33; cross, S28; filled box, S40; open box, mutant 2; filled triangle, poly(G)] from a 64-fold excess over αCP2 to equimolar ratios.
The addition of unlabeled DNA from the 3′-UTR of collagen α1(I) mRNA (CONS DNA) at a concentration equal to the molecular beacon reduced the fluorescence to ∼55% of the uncompeted reaction. The lowest levels were reached with an 8-fold excess of cold CONS DNA over molecular beacon, producing a maximum inhibition of ∼65% of the control reaction (Fig. 8).
DNA sequences without the fluorophore that are homologous to the binding sequence in the molecular beacon or to the molecular beacon sequence plus the hairpin, S28 and S40, respectively, also inhibited fluorescence in a concentration-dependent manner. However, the concentration–fluorescence curve (Fig. 8) was shifted upwards when compared to the CONS DNA chase binding experiment, indicating a slower competition than CONS DNA. The S28 and S40 curves were almost superimposable and the hairpin sequence itself did not have an impact on the reaction.
The curve was further moved upwards with mutant 2, previously shown to be ineffective in binding αCP2 in cell extracts (3). With poly(G), even at a 64-fold molar excess, fluorescence was only decreased by ∼15% (Fig. 8). This indicates an extremely low binding affinity of αCP2 for poly(G) compared to the wild-type 3′-UTR.
Activation energy of the αCP2–MB interaction
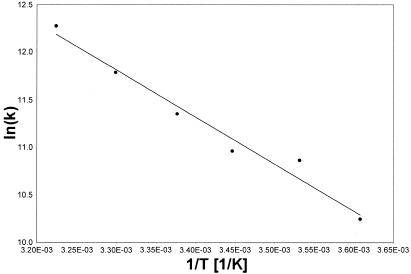
In the Arrhenius plot (Fig. 9) the slope was –4934.3 K. This yielded an activation energy for the αCP2–MB interaction of ∼41 kJ/mol.
Figure 9.
Activation energy of αCP2–MB binding. An Arrhenius plot of the kinetics was drawn from data obtained at different temperatures. The slope of the graph was –4934.3 K, indicative of an activation energy of ∼41 kJ/mol for the αCP2–MB interaction.
DISCUSSION
This study has analyzed the binding activity of recombinant αCP2, a KH domain-containing RNA-binding protein. αCP2 binding to collagen α1(I) mRNA correlates with a stabilization of mRNA in activated hepatic stellate cells and has been shown to bind to other mRNAs in vitro (21). We therefore sought to determine the binding specificity of recombinant αCP2 in vitro using EMSA. These experiments demonstrated that αCP2 binds the 3′-UTR RNA without any post-translational modification, that binding is specific for the 3′-UTR sequence in vitro and that binding of bacterially expressed recombinant protein occurs with an affinity of 2.1 nM. These data are consistent with a role of αCP2 in regulating collagen α1(I) mRNA stability in activated hepatic stellate cells. Although there were some differences in migration between the cleaved, recombinant αCP2 and the supershifted αCP2 in NIH 3T3 lysates (Fig. 2), it is possible that these differences result from in vivo modification that occurs in NIH 3T3 cells or reflect differences in splicing variants (22).
Molecular beacons have been used to detect oligonucleotide sequences in PCR reactions where conditions have been optimized to detect single base pair mismatches, indicating that molecular beacons are very sensitive indicators of binding affinity (15,16). Here we report the application of molecular beacon technology to the characterization of a protein–oligonucleotide interaction. With this assay large-scale measurements of protein–nucleotide interactions are possible. Traditionally, this kind of interaction has been studied in EMSA assays or in filter-binding assays, which are not practical for large-scale examinations (23). We have used the molecular beacon methodology to investigate aspects of the αCP2–collagen target sequence interaction. First, it was established that the reaction followed first order kinetics with respect to αCP2 and molecular beacon concentrations, but it was of second order overall, as found with other RNA-binding proteins (24), and the energy of activation was ∼41 kJ/mol.
Molecular beacons designed based on the wild-type collagen sequence had signal-to-noise ratios of ∼3-fold with antisense DNA, which is likely due to secondary structure formation (data not shown). We have optimized the design of the molecular beacon to generate a signal-to-background fluorescence ratio of ∼12-fold. To this end, the sequence (S28) was shortened by the deletion of a triple C sequence in comparison with the collagen 3′-UTR sequence (S31 and CONS DNA). The results with the improved structures are consistent with previous reports from antisense DNA association experiments with beacons (16).
Under our assay conditions the melting point of the molecular beacon was ∼64°C, with a broad transition. At 37°C the molecular beacon was largely present with the stem region in its double-stranded conformation, as is indicated by the low degree of hyperchromism at this temperature. The hyperchromism curve of the S40 oligonucleotide was slightly shifted to the left compared to the molecular beacon, resulting in a melting point for the S40 sequence of ∼58°C. The only structural difference between the molecular beacon and the S40 sequence is the presence of the 6-FAM and DABCYL groups at the 5′- and 3′-ends, respectively, which apparently stabilize the stem structure.
The maximum fluorescence obtained with αCP2–MB (protein–DNA association) was 20% lower than that of the MB–antisense association (DNA–DNA association). The similar fluorescence levels in both binding events, which are proportional to the sixth power of the interfluorophore distance, indicate that the molecular beacon is unfolded upon binding in both cases and that the end-to-end distances are almost identical.
There is high binding specificity in the interaction between recombinant αCP2 and the molecular beacon sequence. In our kinetic molecular beacon competition experiments a clear preference for binding of poly(C) and the S40 sequence was observed. In these experiments it was demonstrated that differences in binding avidity between the different probes could be discriminated. However, due to incompletely saturated binding with a slow association velocity and the short preincubation time with the oligonucleotide probes, direct quantitative comparisons of the binding affinities were not possible. To directly compare association velocities, molecular beacons with a single-stranded loop region adopted from the oligonucleotide probes would have to be used. We found that many of these had suboptimal signal-to-noise ratios (data not shown), probably due to the formation of secondary structures within the loop. The design of suitable molecular beacon sequences may require evolutionary cycles for optimization.
We have also demonstrated that protein–nucleotide interactions can be monitored using molecular beacons. The time scale of the interaction with the molecular beacon is much longer than that observed during EMSA, possibly due to differences in assay conditions. Differences in the assay buffers for mobility shift and fluorescence may account for part of the difference, as increasing the concentration of glycerol in the reaction buffer accelerated the increase in fluorescence (data not shown). An alternative explanation is that differences in the oligonucleotide structure between the probes cause the differences in binding kinetics. Since the kinetics of binding were not changed with radiolabeled sequences containing a hairpin but not the fluorophore, the differences in binding velocity between the target sequence and the molecular beacon cannot be due to the presence of the stem structure. However, introduction of the fluorophore and quencher at either end of the molecule may effect interaction with αCP2. Finally, the differences could reflect a two-step binding reaction. In this model the loop sequence quickly associates loosely with the KH domain in the first step. The second step is rate limiting and encompasses separation of the fluorophore/quencher pair. Only the second step is associated with an increase in fluorescence and tight binding. This model is consistent with the proposed induced fit mechanism for KH domains (11,25) and for other protein–RNA interactions (24). It may also explain why different dissociation constants have been reported for RNA-binding proteins when different experimental methods were used (23). In summary, more work is needed to clarify the reasons for the observed differences. Our data demonstrate that molecular beacons should prove useful in screening for disruption or enhancement of protein–nucleotide interactions, e.g. in high throughput screening assays. High throughput multi-sample analyses are readily performed with the molecular beacon assay, but not with traditional EMSAs.
We have characterized the binding affinity of recombinant αCP2 using both the standard EMSA and a novel use of molecular beacon technology. The data presented here are consistent with other recent studies on αCP2 interactions (10,26,27), demonstrating αCP2 binding to poly(A)-binding protein and inhibition of mRNA deadenylation (28). A model of post-transcriptional regulation of collagen α1(I) is emerging in which the response to a fibrotic stimulus results in sequence-specific interaction of αCP2 with the collagen α1(I) mRNA 3′-UTR. Once localized to the 3′-UTR, αCP2 acts to stabilize the mRNA, perhaps by interacting with and tethering PABP to the mRNA (26). By binding to the 3′-UTR alone or by interactions with PABP, αCP2 may prevent deadenylation of the mRNA (29), resulting in a decrease in mRNA turnover and an increase in collagen production. Furthermore, given the presence of a conserved 5′ stem–loop (9), it is possible that αCP2 may interact with proteins recruited to the stem–loop, much like PABP interacts with the cap-binding complex (30), and may further stabilize the message. By regulating αCP2 binding, cells may regulate the stability of the message by increasing the binding of two general mRNA-binding proteins, namely PABP and the 5′ cap complex. To further develop this model it will be important to determine how αCP2 is regulated in vivo, since it is present in both quiescent and activated hepatic stellate cells but binds only in activated cells.
REFERENCES
- 1.Friedman S.L. (2000) J. Biol. Chem., 275, 2247–2250. [DOI] [PubMed] [Google Scholar]
- 2.Brenner D.A., Waterboer,T., Choi,S.K., Lindquist,J.N., Stefanovic,B., Burchardt,E., Yamauchi,M., Gillan,A. and Rippe,R.A. (2000) J. Hepatol., 32 (suppl. 1), 32–38. [DOI] [PubMed] [Google Scholar]
- 3.Stefanovic B., Hellerbrand,C., Holcick,M., Briendl,M., Liebhaber,S. and Brenner,D.A. (1997) Mol. Cell. Biol., 17, 5201–5209. [DOI] [PMC free article] [PubMed] [Google Scholar]
- 4.Kiledjian M., Wong,X. and Liebhaber,S. (1995) EMBO J., 14, 4357–4364. [DOI] [PMC free article] [PubMed] [Google Scholar]
- 5.Wang X., Kiledijan,M., Weiss,I. and Liebhaber,S. (1995) Mol. Cell. Biol., 15, 1769–1777. [DOI] [PMC free article] [PubMed] [Google Scholar]
- 6.Paulding W.R. and Czyzyk-Krzeska,M.F. (1999) J. Biol. Chem., 274, 2532–2538. [DOI] [PubMed] [Google Scholar]
- 7.Ostareck D.H., Ostareck-Lederer,A., Wilm,M., Theile,B.J., Mann,M. and Hentze,M.W. (1997) Cell, 89, 597–606. [DOI] [PubMed] [Google Scholar]
- 8.Stefanovic B., Lindquist,J. and Brenner,D.A. (2000) Nucleic Acids Res., 28, 641–647. [DOI] [PMC free article] [PubMed] [Google Scholar]
- 9.Stefanovic B., Hellerbrand,C. and Brenner,D.A. (1998) Mol. Cell. Biol., 19, 4334–4342. [DOI] [PMC free article] [PubMed] [Google Scholar]
- 10.Ostareck-Lederer A., Ostareck,D.H. and Hentze,M.W. (1998) Trends Biochem. Sci., 23, 409–411. [DOI] [PubMed] [Google Scholar]
- 11.Adinolfi S., Bagni,C., Morelli,M.A.C., Fraternali,F., Musco,G. and Pastore,A. (1999) Biopolymers, 51, 153–164. [DOI] [PubMed] [Google Scholar]
- 12.Leffers H., Dejgaard,K. and Celis,J.E. (1995) Eur. J. Biochem., 230, 447–453. [PubMed] [Google Scholar]
- 13.Kiledjian M., Day,N. and Trifillis,P. (1999) Methods, 17, 84–91. [DOI] [PubMed] [Google Scholar]
- 14.Russell J.E., Morales,J., Makeyev,A.V. and Liebhaber,S.A. (1998) Mol. Cell. Biol., 18, 2173–2183. [DOI] [PMC free article] [PubMed] [Google Scholar]
- 15.Tyagi S., Bratu,D.P. and Kramer,F.R. (1998) Nature Biotechnol., 16, 49–53. [DOI] [PubMed] [Google Scholar]
- 16.Tyagi S. and Kramer,F. (1996) Nature Biotechnol., 14, 303–308. [DOI] [PubMed] [Google Scholar]
- 17.Frangioni J.V. and Neel,B. (1993) Anal. Biochem., 210, 179–187. [DOI] [PubMed] [Google Scholar]
- 18.Meisterernst M., Gander,I., Rogge,L. and Winnaker,E.-L. (1988) Nucleic Acids Res., 16, 4419–4435. [DOI] [PMC free article] [PubMed] [Google Scholar]
- 19.Zheng J., Cahill,S.M., Lemmon,M.A., Fushman,D., Schlessinger,J. and Cowburn,D. (1996) J. Mol. Biol., 255, 14–21. [DOI] [PubMed] [Google Scholar]
- 20.Henry K.A., Zweib,C. and Fried,H.M. (1997) Protein Expr. Purif., 9, 15–26. [DOI] [PubMed] [Google Scholar]
- 21.Holcick M. and Liebhaber,S. (1997) Proc. Natl Acad. Sci. USA, 94, 2410–2414. [DOI] [PMC free article] [PubMed] [Google Scholar]
- 22.Funke B., Zuleger,B., Benavente,R., Schuster,T., Goller,M., Stevenin,J. and Horak,I. (1996) Nucleic Acids Res., 24, 3821–3828. [DOI] [PMC free article] [PubMed] [Google Scholar]
- 23.Hall K. and Stump,W. (1992) Nucleic Acids Res., 20, 4283–4290. [DOI] [PMC free article] [PubMed] [Google Scholar]
- 24.Wilson G., Sun,Y., Lu,H. and Brewer,G. (1999) J. Biol. Chem., 274, 33374–33381. [DOI] [PubMed] [Google Scholar]
- 25.Musco G., Steir,G., Joseph,C., Morelli,M.A.C., Nilges,M., Gibson,T.J. and Pastore,A. (1996) Cell, 85, 237–245. [DOI] [PubMed] [Google Scholar]
- 26.Mangus D.A., Amrani,N. and Jacobson,A. (1998) Mol. Cell. Biol., 18, 7383–7396. [DOI] [PMC free article] [PubMed] [Google Scholar]
- 27.Chkheidze A.N., Lyakhov,D.L., Makeyev,A.V., Morales,J., Kong,J. and Liebhaber,S.A. (1999) Mol. Cell. Biol., 19, 4572–4581. [DOI] [PMC free article] [PubMed] [Google Scholar]
- 28.Wang Z., Day,N., Trifillis,P. and Kiledjian,M. (1999) Mol. Cell. Biol., 19, 4552–4560. [DOI] [PMC free article] [PubMed] [Google Scholar]
- 29.Ford L.P., Bagga,P.S. and Wilusz,J. (1997) Mol. Cell. Biol., 17, 398–406. [DOI] [PMC free article] [PubMed] [Google Scholar]
- 30.Tarun S.Z. Jr, Wells,S.E., Deardorff,J.A. and Sachs,A.B. (1997) Proc. Natl Acad. Sci. USA, 94, 9046–9051. [DOI] [PMC free article] [PubMed] [Google Scholar]


