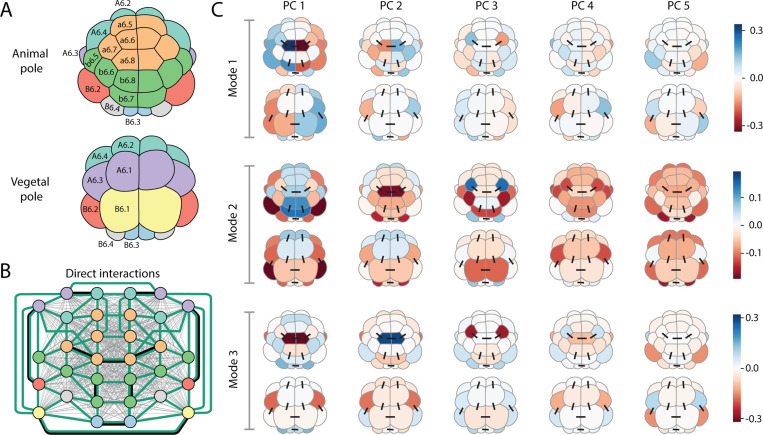
FIG. 7. Statistical physics modeling identifies spatially ordered collective modes in expression data and reveals underlying interactions.
(A) Schematic of the 32-cell stage embryo colored by cell type. (B) Graph representation of the 32-cell stage embryo, colored by cell type with edges representing inferred direct interactions in regularized statistical model. Embryo-wide (grey lines) and neighbor (green) cell-cell interactions are present in model, as well as specific cell-cell interactions (black lines). A full ranking of terms is in Table S3. (C) Principal modes of variation from inferred regularized model. The inferred model from (B) is a Gaussian and hence the distribution can be interpreted as a multidimensional ellipsoid defined by the covariance matrix . Here, the first three principal directions of that covariance matrix (called Mode 1–3) are shown, which together capture over 80% of the variance of the model. Each such direction, or mode , has both spatial and PC components and is visually represented by five columns (PC’s = 1,...,5) where column shows an embryo (both animal and vegetal view shown) with cell colored by the value . Black lines show direct interactions between specific cells. The first mode represents a left-right mode of variation, whereas the second mode appears to somewhat correspond to an animal-vegetal mode.

