Abstract
There are multiple independent genetic signals at the Ras-responsive element binding protein 1 (RREB1) locus associated with type 2 diabetes risk, fasting glucose, ectopic fat, height, and bone mineral density. We have previously shown that loss of RREB1 in pancreatic beta cells reduces insulin content and impairs islet cell development and function. However, RREB1 is a widely expressed transcription factor and the metabolic impact of RREB1 loss in vivo remains unknown. Here, we show that male and female global heterozygous knockout (Rreb1+/−) mice have reduced body length, weight, and fat mass on high-fat diet. Rreb1+/− mice have sex- and diet-specific decreases in adipose tissue and adipocyte size; male mice on high-fat diet had larger gonadal adipocytes, while males on standard chow and females on high-fat diet had smaller, more insulin sensitive subcutaneous adipocytes. Mouse and human precursor cells lacking RREB1 have decreased adipogenic gene expression and activated transcription of genes associated with osteoblast differentiation, which was associated with Rreb1+/− mice having increased bone mineral density in vivo. Finally, human carriers of RREB1 T2D protective alleles have smaller adipocytes, consistent with RREB1 loss-of-function reducing diabetes risk.
Keywords: Diabetes, RREB1, transcription factor, insulin sensitivity, adipocyte
Diabetes is a metabolic disease characterized by hyperglycemia due to defects in insulin secretion and/or function. Multiple genetic association signals have been identified in the Ras-responsive element binding protein 1 (RREB1) locus that alter risk for T2D1-3 and other metabolic and anthropomorphic traits, including fasting glucose1,4, visceral adiposity5, waist-hip ratio6, bone mineral density7, and height8. Fine-mapping studies demonstrated that a nonsynonymous variant (p.Asp1171Asn)9 is responsible for one of the T2D association signals, supporting RREB1 as the effector transcript at the locus. RREB1 is a zinc finger transcription factor that binds to RAS-responsive elements found in gene promoters, acting as both a transcriptional activator10,11 and repressor12,13. Microdeletions on chromosome 6p, which includes RREB1 in the minimal region, have been identified as a cause of Noonan Syndrome, characterized by short stature and heart abnormalities14. Previous studies have also identified a role for Rreb1 in epithelial-to-mesenchymal transition during early embryogenesis15, brown fat adipogenesis16 and in muscle cells17.
As RREB1 is widely expressed18 and there are genetic associations at this locus with multiple phenotypes and traits, it is unclear in which tissues RREB1 perturbation contributes to diabetes risk. Multi-omic integration of genetic, transcriptomic, and epigenomic data supports equal contribution of islet, adipose, liver, and muscle in mediating disease risk19. We have previously found that RREB1 knockdown or knockout negatively impacts beta cell development and function20, suggesting that T2D-risk alleles result in a loss-of-function. Additionally, our previous findings in zebrafish suggest that loss of Rreb1 has effects in other metabolic tissues21. To understand the relevant contributions of different tissues on the genetic association of RREB1 with T2D and related metabolic traits including adiposity, we characterized a global Rreb1 heterozygous knockout mouse model and investigated the effects of RREB1 perturbation on human adipocyte development and function.
Results
Global heterozygous Rreb1 knockout mice have reduced length, body weight, and fat mass
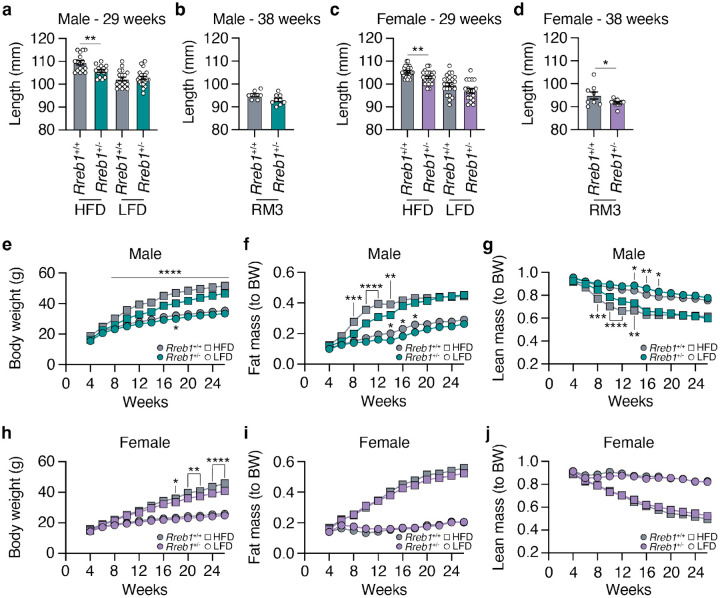
To explore the impact of RREB1 loss on metabolic traits, we generated global heterozygous knockout (Rreb1+/−) mice as homozygous null mice are embryonic lethal14,22. Global Rreb1+/− mice were placed on one of three diets at the time of weaning: a high-fat diet (HFD: 60% fat, 20% protein, 20% carbohydrates); calorie-matched low-fat diet (LFD: 10% fat, 20% protein, 70% carbohydrates); or SDS rat and mouse No.3 Breeding diet (RM3: 11% fat, 27% protein, 62% carbohydrates). Male Rreb1+/− mice had reduced body length on HFD at 29 weeks of age (Fig. 1a). However, there were no significant differences in length for male Rreb1+/− mice on LFD at 29 weeks of age (Fig. 1a) or at 38 weeks of age on an RM3 diet (Fig. 1b), suggesting that the effect on body length is dependent on calorie intake. Female Rreb1+/− mice were significantly smaller in length than control mice on HFD at 29 weeks of age (Fig. 1c), but showed a trend on RM3 diet (p=0.068) at 38 weeks of age (Fig. 1d). These results are consistent with the genetic association of variation at the RREB1 locus with height and our previous observations in zebrafish21,23,24.
Fig. 1 ∣. Reduced length, body weight, and fat mass in Rreb1 heterozygous knockout mice.
a Length in mm of wildtype (grey) and Rreb1 heterozygous knockout (green) male mice at 29 weeks on HFD and LFD. n = 15-21. b Length in mm of wildtype (grey) and Rreb1 heterozygous knockout (green) male mice at 38 weeks on RM3 diet. n = 7-9. c Length in mm of wildtype (grey) and Rreb1 heterozygous knockout (purple) female mice at 29 weeks on HFD and LFD. n = 18-24. d Length in mm of wildtype (grey) and Rreb1 heterozygous knockout (purple) female mice at 38 weeks on RM3 diet. n = 9-11. e-g Biweekly measurements of (e) body weight in grams (g), (f) fat mass normalized to body weight (BW), and (g) lean mass normalized to body weight (BW) of wildtype (grey) and Rreb1 heterozygous knockout (green) male mice on HFD and LFD. n = 15-21. h-j Biweekly measurements of (h) body weight in grams (g), (i) fat mass normalized to body weight (BW), and (j) lean mass normalized to body weight (BW) of wildtype (grey) and Rreb1 heterozygous knockout (purple) female mice on HFD and LFD. n = 18-24. Data are presented as mean ± s.e.m. Statistical analyses were performed by (a-d) unpaired t test (d, with Welch correction) or (e-j) two-way ANOVA with Tukey’s multiple comparisons test. *p<0.05, **p<0.01, ***p<0.001, and ****p<0.0001.
In addition to the reduction in body length, Rreb1+/− male mice had reduced body weight by 8 weeks of age on HFD (Fig. 1e). Biweekly EchoMRI was used to determine if the changes in body weight were due to alterations in body composition. Male Rreb1+/− mice had decreased fat mass (Fig. 1f) and increased lean mass (Fig. 1g) when normalized to body weight from 8 to 14 weeks of age before converging with colony-mate controls at 16 weeks. While there was little change in body weight on LFD (Fig. 1e), male Rreb1+/− mice also weighed less on the RM3 diet (Extended Data Fig. 1a,b), had decreased fat mass (Extended Data Fig. 1c,d), and increased lean mass (Extended Data Fig. 1e,f). Female Rreb1+/− mice had reduced body weight on HFD at 18 weeks of age (Fig. 1h) and at 13 weeks of age on RM3 (Extended Data Fig. 1g,h), but had no significant differences in fat mass (Fig. 1i) or lean mass (Fig. 1j) on HFD, LFD, or on RM3 diet (Extended Data Fig. 1i,j,k,l). Overall, Rreb1 heterozygosity, depending on diet and sex, resulted in mice that were smaller (shorter and lighter), with reduced relative fat mass and increased lean mass.
Global Rreb1 heterozygous knockout mice have altered white adipose tissue depot size
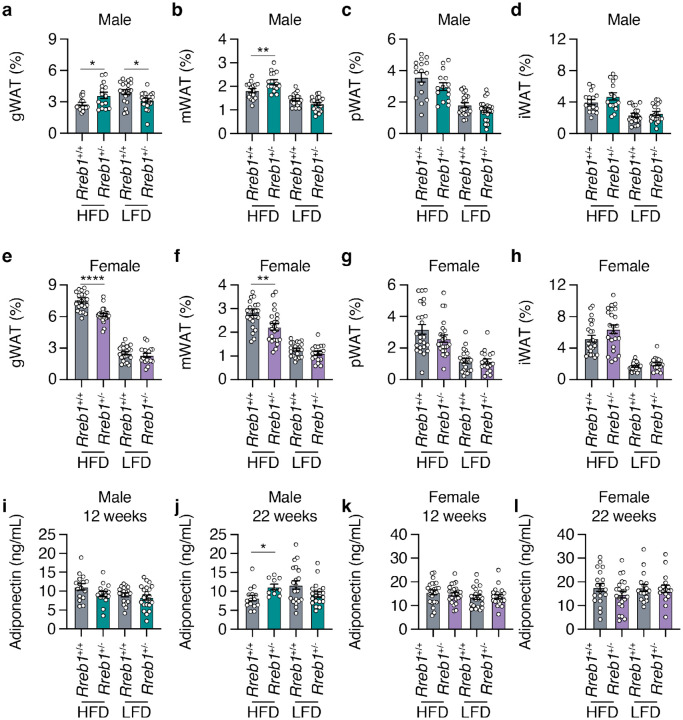
To determine if the decrease in overall fat mass changed the size of various visceral and subcutaneous fat depots, we measured fat depot size in male and female Rreb1+/− mice. On HFD, male Rreb1 heterozygous mice had increased gonadal (Fig. 2a) and mesenteric visceral fat pads (Fig. 2b) but had no significant differences in perirenal (Fig. 2c) or subcutaneous inguinal fat pads (Fig. 2d) compared to wildtype control mice. Conversely, on LFD and RM3 diet male Rreb1+/− mice had decreased gonadal (Fig. 2a; Extended Data Fig. 2a) and on RM3 diet had decreased mesenteric (Extended Data Fig. 2a) visceral fat pads, which is consistent with the overall decrease in fat mass measured by EchoMRI. Female Rreb1+/− knockout mice also had decreased gonadal (Fig. 2e) and mesenteric (Fig. 2f) fat depot size on HFD, and no changes in white adipose depot size on LFD (Fig. 2e-h) or on RM3 diet (Extended Data Fig. 2b). As RREB1 is a transcription factor, we isolated brown, gonadal, and inguinal adipose tissues of Rreb1+/+ and Rreb1+/− mice on RM3 diet at 26 weeks of age and performed bulk RNA-seq. Differential expression analysis identified 70 genes that were significantly upregulated (padj < 0.05 and log2FC > 1.5) and only two that were downregulated (padj < 0.05 and log2FC < −1.5) (Extended Data Table 1) in adipose tissue isolated from adult mice. Gene enrichment analysis found that the differentially expressed genes were enriched for GO terms relating to muscle, such as ‘sarcomere organization’, ‘myofibril assembly’, and ‘muscle cell development’ (Extended Data Table 2). Given the differences in fat mass we next assessed whether Rreb1+/− mice had changes in plasma adiponectin levels. Adiponectin levels were unchanged at 12 weeks (Fig. 2i) and significantly increased at 22 weeks (Fig. 2j) in Rreb1+/− male mice on HFD, consistent with the increased gonadal and mesenteric fat mass. There were no changes in adiponectin level in Rreb1+/− male mice on LFD (Fig. 2i,j) or on RM3 diet (Extended Data Fig. 2c,d) and no differences in adiponectin levels in female Rreb1+/− mice (Fig. 2k,l and Extended Data Fig. 2e,f), despite reductions in fat depot size.
Fig. 2 ∣. Rreb1 heterozygous knockout mice have differences in depot size of white adipose tissue.
a-d Comparisons of visceral gonadal (a, gWAT), mesenteric (b, mWAT), perirenal (c, pWAT), and subcutaneous inguinal (d, iWAT) white adipose tissue weight (% normalized to body weight) at 26 weeks in wildtype (grey) and Rreb1 heterozygous knockout (green) male mice on HFD and LFD. n = 15-21. e-h Comparisons of visceral gonadal (e, gWAT), mesenteric (f, mWAT), perirenal (g, pWAT), and subcutaneous inguinal (h, iWAT) white adipose tissue weight (% normalized to body weight) at 26 weeks in control (grey) and Rreb1 heterozygous knockout (purple) female mice on HFD and LFD. n = 18-24. i,j Plasma adiponectin (ng/mL) after an overnight fast at (i) 12 weeks and (j) 22 weeks for male wildtype (grey) and Rreb1 heterozygous knockout (green) mice on HFD and LFD. n = 15-22. k,l Plasma adiponectin (ng/mL) after an overnight fast at (k) 12 weeks and (l) 22 weeks for female wildtype (grey) and Rreb1 heterozygous knockout (purple) mice on HFD and LFD. n = 17-24. Data are presented as mean ± s.e.m. Statistical analyses were performed using a one-way ANOVA with Sidak’s multiple comparison test or (f,g,h,j) Brown-Forsythe and Welch ANOVA tests with Dunnett's T3 multiple comparisons test *p<0.05, **p<0.01, and ****p<0.0001.
To understand the reduction of adipose tissue depot size in Rreb1+/− mice, we next assessed the distribution of adipocyte size and cell number by histological analysis of white adipose tissues at 29 weeks of age. In the gonadal depot, male Rreb1+/− mice on HFD had significantly fewer adipocytes of smaller size (area <4500 μm2) and more adipocytes of larger size (area >5750 μm2) (Fig. 3a), consistent with the increased gonadal depot size (Fig. 2a). In females, gonadal adipocyte size was unchanged for Rreb1+/− mice on HFD (Fig. 3b), despite a smaller overall gonadal tissue size (Fig. 2e). For subcutaneous adipocytes, there was no significant difference in adipocyte size in male Rreb1+/− mice on HFD (Fig. 3c). However, female Rreb1+/− mice had significantly more subcutaneous adipocytes of smaller size (area <4500 μm2) and fewer adipocytes of larger size (>5250 μm2) compared to wildtype mice on HFD (Fig. 3d). Similarly to females, male Rreb1+/− mice on a RM3 diet at 38 weeks of age had a significant increase in the number of small adipocytes and fewer large adipocytes in gonadal (Extended Data Fig. 3a), perirenal (Extended Data Fig. 3b), and subcutaneous adipose tissue (Extended Data Fig. 3d) compared to wildtype control mice. Finally, there were no differences in visceral gonadal (Fig. 3e,f), mesenteric (Extended Data Fig. 3c) or subcutaneous (Fig. 3g,h) adipocyte size for Rreb1+/− mice on LFD or RM3 diet. Taken together, these results suggest that haploinsufficiency of Rreb1 leads to sex- and diet-specific decreases in fat mass, white adipose depot size, adipocyte size, and adipocyte area.
Fig. 3 ∣. Sex- and tissue-specific differences in adipocyte size of white adipose tissue in Rreb1 heterozygous knockout mice.
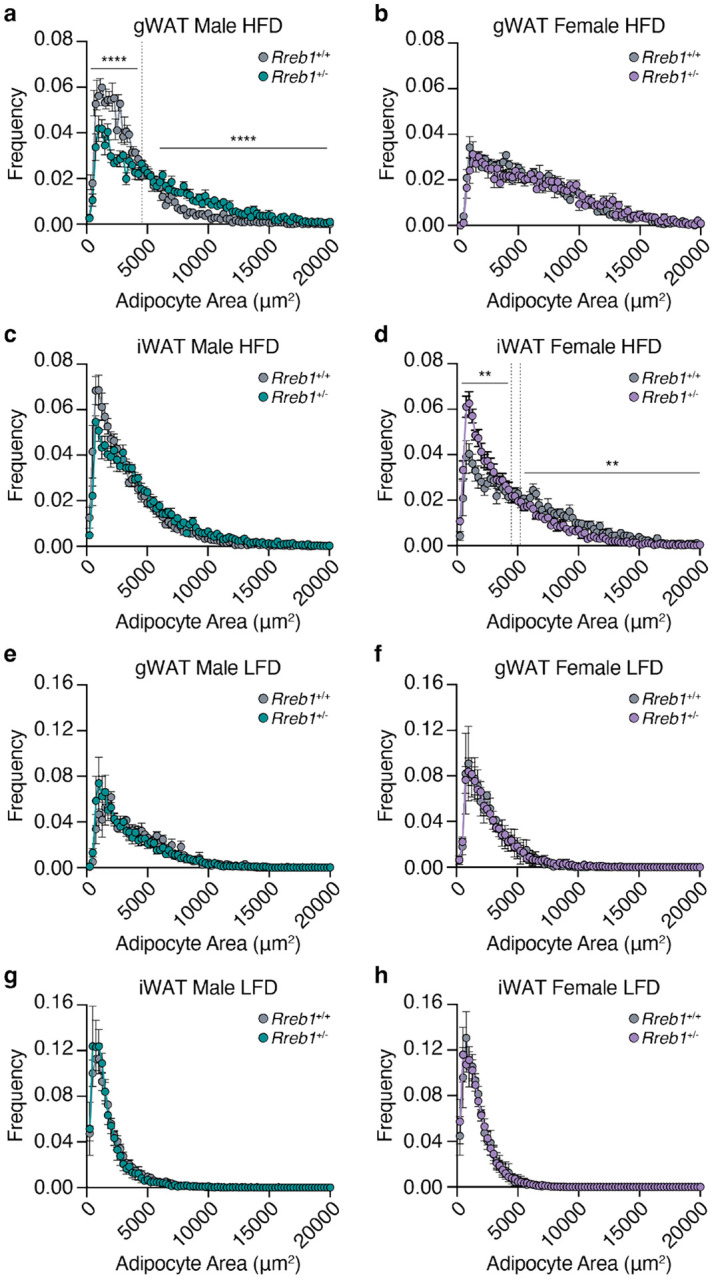
a-d Quantification of adipocyte area (μm2) within (a,b) visceral gonadal (gWAT, both sexes: Rreb1+/+ n = 5, Rreb1+/− n = 5 mice) and (c,d) subcutaneous inguinal (iWAT, both sexes: Rreb1+/+ n = 6, Rreb1+/− n = 6 mice) fat depots from (a,c) male and (b,d) female Rreb1+/+ and Rreb1+/− mice fed a HFD at 29 weeks of age. Dotted line denotes the interval where the dataset converges. e-h Quantification of adipocyte area (μm2) within (e,f) visceral gonadal (gWAT, both sexes: Rreb1+/+ n = 3, Rreb1+/− n = 6 mice) and (g,h) subcutaneous inguinal (iWAT, male: Rreb1+/+ n = 6, Rreb1+/− n = 5; female: Rreb1+/+ n = 6, Rreb1+/− n = 6 mice) fat depots from (e,g) male and (f,h) female Rreb1+/+ and Rreb1+/− mice fed a LFD at 29 weeks of age. Data are presented as mean adipocyte frequency within each 250 μm2 sized bin ± s.e.m. Statistical analyses were performed on the area under the curve for adipocytes in (a) <4500 and >5750 μm2 or (d) <4500 and >5250 μm2 adipocyte size ranges by (a,d,e,f,h) unpaired t test or (b,c,g) Mann-Whitney two tailed test, depending on the normality of the data distribution. **p<0.01 and ****p<0.0001.
Global Rreb1 knockout mice have increased lipid accumulation in the liver
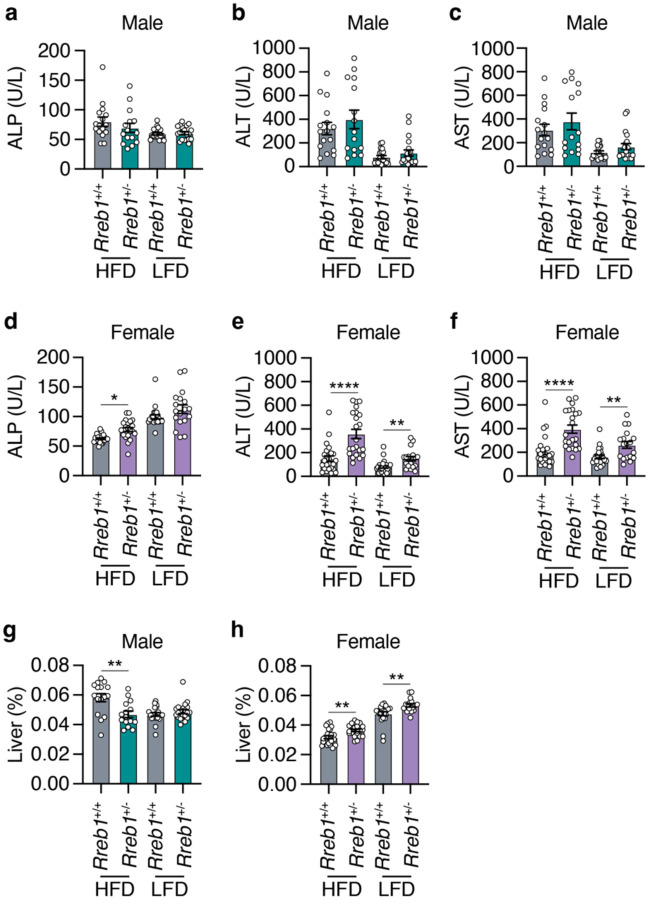
To determine whether the reduced adipose tissue size was due to fat being stored ectopically in the liver, we next performed histological analysis of liver tissue in Rreb1+/− male and female mice. Rreb1+/− male and female mice had qualitatively increased lipid droplet accumulation in the liver compared to wildtype controls (Extended Data Fig. 4). To assess the impact of ectopic fat on liver function in Rreb1+/− mice, serum alkaline phosphatase (ALP), alanine aminotransferase (ALT), and aspartate aminotransferase (AST) levels were measured. There were no differences in liver enzymes between male Rreb1+/− and control mice (Fig. 4a,b,c). However, female Rreb1+/− mice had significantly increased ALP, ALT, and AST levels (Fig. 4d,e,f). Consistent with the liver enzyme measurements, male Rreb1+/− mice had reduced liver weight (Fig. 4g), while female Rreb1+/− mice had increased liver weight compared to littermate controls (Fig. 4h). These data suggest that Rreb1 heterozygosity leads to ectopic lipid accumulation in the liver.
Fig. 4 ∣. Global Rreb1 heterozygous knockout mice have ectopic fat in the liver.
a,b,c Plasma (a) alkaline phosphatase (ALP; U/L), (b) alanine aminotransferase (ALT; U/L), and (c) aspartate aminotransferase (AST; U/L) levels in Rreb1+/+ and Rreb1+/− male mice at 29 weeks on HFD and LFD. n = 15-20. d,e,f Plasma (d) alkaline phosphatase (ALP; U/L), (e) alanine aminotransferase (ALT; U/L), and (f) aspartate aminotransferase (AST; U/L) levels in Rreb1+/+ and Rreb1+/− female mice at 29 weeks on HFD and LFD. n = 14-23. g,h Liver weight (adjusted for body weight, %) of Rreb1+/+ and Rreb1+/− on HFD and LFD at 29 weeks of age in (g) male (n = 15-21) and (h) female (n = 17-23) mice. Data are presented as mean ± s.e.m. Statistical analysis performed by (a,g) Brown-Forsythe and Welch ANOVA tests with Dunnett's T3 multiple comparisons test, (b,c,e,f) ordinary one-way ANOVA with Sidak’s multiple comparison tests, and (d) ANOVA Kruskal-Wallis test. (a,b,e,f) data were transformed Y=log(Y) before statistical analysis. * p<0.05, ** p<0.01, and **** p<0.0001.
Global heterozygous Rreb1 knockout mice show reduced food intake and energy expenditure
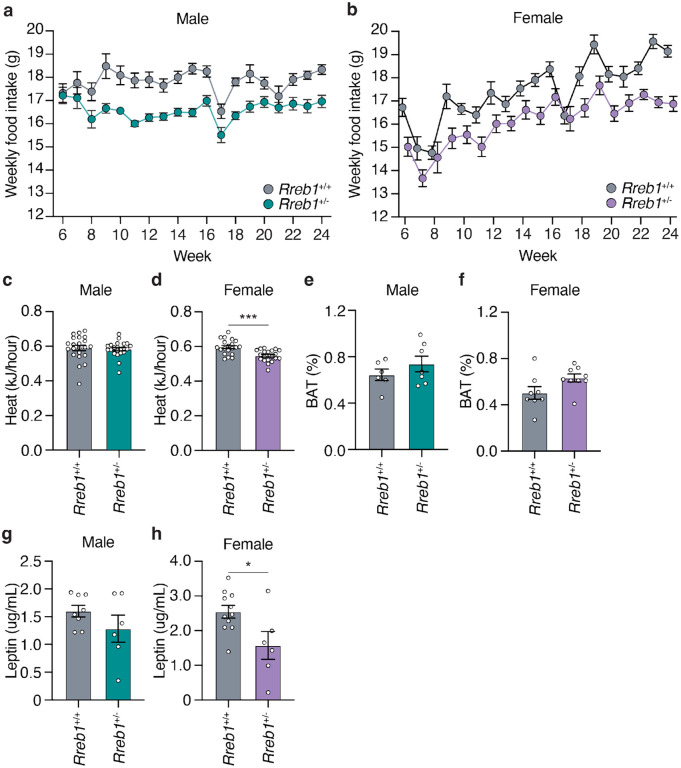
To test whether the reduced weight and fat mass in Rreb1+/− mice is due to changes in food intake and energy expenditure, we measured weekly food intake from 6 to 24 weeks on HFD. Both male (Fig. 5a) and female Rreb1+/− mice (Fig. 5b) had reduced food intake compared to colony-mate controls (AUC: males, p = 0.013; females, p = 0.0126). After 24 weeks, energy expenditure was assessed by indirect calorimetry. While male Rreb1+/− mice had no change in heat production (Fig. 5c), female Rreb1+/− mice had significantly decreased heat production (Fig. 5d), consistent with reduced energy expenditure. There were no changes in the percentage of brown adipose tissue (BAT) in either male (Fig. 5e) or female (Fig. 5f) Rreb1+/− mice, suggesting no thermogenic differences due to Rreb1 haploinsufficiency. The same cohorts of mice were also assessed for body weight and composition during the food intake phenotyping period. Interestingly, Rreb1+/− male mice no longer showed statistically significant differences in body weight and fat mass compared to the controls (Extended Data Fig. 5a,c), potentially due to the effects of housing two male mice together. The body weight of Rreb1+/− female mice was significantly decreased (Extended Data Fig. 5b), consistent with previous observations, but additionally both fat and lean mass were also decreased in these mice (Extended Data Fig. 5d,f). Consistent with decreases in body weight and fat content, serum leptin was unchanged in male Rreb1+/− mice (Fig. 5g), but significantly decreased in female Rreb1+/− mice (Fig. 5h). Therefore, Rreb1+/− mice have reduced adiposity, decreased food intake, and decreased circulating leptin levels.
Fig. 5 ∣. Reduced food intake and energy expenditure in Rreb1 heterozygous knockout mice.
a,b Comparisons of weekly food intake (g) measured from 6 to 24 weeks for Rreb1+/+ and Rreb1+/− (a) male and (b) female mice on HFD. (a) Rreb1+/+ and Rreb1+/− n = 11 cages, each containing 2 animals. (b) Rreb1+/+ n = 9 and Rreb1+/− n = 11 cages, each containing 2 animals. c,d Heat production of Rreb1+/+ and Rreb1+/− (c) male and (d) female mice over a 24-hour period. (c) n = 22, (d) n = 20 mice. e,f Comparisons of brown adipose tissue (BAT) weight of Rreb1+/− (e) male and (f) female mice with wildtype littermate control mice at 38 weeks on RM3 diet. (e) n = 6-7 mice, (f) n = 8-9 mice. g,h Circulating leptin levels in Rreb1+/− (g) male and (h) female mice with wildtype littermate control mice. (g) n = 6-8, (h) n = 6-11 mice. Data are presented as mean ± s.e.m. (a,b) Area under the curve was calculated for statistical analysis (males: 6-24 weeks and females: 6-23 weeks). Statistical analyses were performed by two-tailed unpaired t test or (c) a Mann Whitney test. *p<0.05, ***p<0.001.
Global Rreb1 heterozygous knockout mice exhibit improved insulin sensitivity
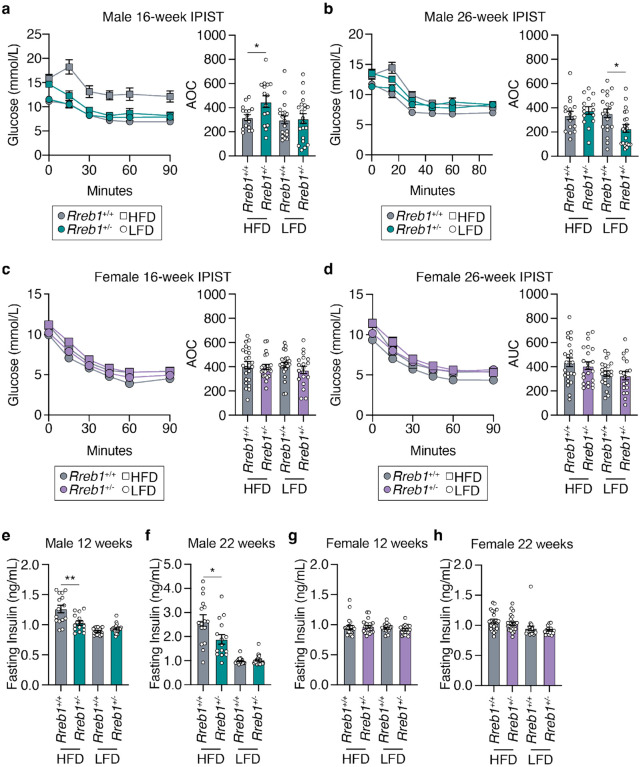
To determine the impact of Rreb1 haploinsufficiency on glucose homeostasis, we next performed intraperitoneal glucose tolerance tests (IPGTT) at 12 and 22 weeks of age. Neither male (Extended Data Fig. 6a,b) nor female (Extended Data Fig. 6c,d) Rreb1+/− mice had differences in glucose tolerance. Insulin sensitivity was measured using an intraperitoneal insulin sensitivity test (IPIST) at 16 and 26 weeks of age. Male Rreb1+/− mice fed a HFD had improved insulin sensitivity at 16 weeks of age (Fig. 6a), but had no significant differences in insulin sensitivity at 26 weeks of age (Fig. 6b). However, male Rreb1+/− mice had reduced insulin sensitivity at 26 weeks of age when fed a LFD (Fig. 6b). No differences in insulin sensitivity were detected for Rreb1+/− female mice on HFD or LFD at either 16 (Fig. 6c) and 26 weeks of age (Fig. 6d), which may result from female mice being protected against HFD-induced metabolic syndrome25. In line with the early improvement in insulin sensitivity, fasting insulin levels were decreased in male Rreb1+/− mice at 12 weeks (Fig. 6e) and 22 weeks (Fig. 6f) on HFD. Female Rreb1+/− mice had no change in fasting insulin at 12 or 22 weeks of age on HFD or LFD (Fig. 6g,h). As we have previously shown that loss of Rreb1 negatively impacts beta cell function21, we measured insulin secretion from mouse islets ex vivo. Insulin secretion in response to high glucose from Rreb1+/− female mouse islets was significantly reduced (Extended Data Fig. 6e).
Fig. 6 ∣. Male Rreb1+/− mice have differences in insulin sensitivity and fasting insulin levels.
a,b IPIST on Rreb1+/+ (grey) and Rreb1+/− (green) male mice aged (a) 16 weeks and (b) 26 weeks on HFD and LFD n = 15-21. c,d IPIST on Rreb1+/+ (grey) and Rreb1+/− (purple) female mice aged (c) 16 and (d) 26 weeks of age on HFD and LFD. n = 19-24. e-h Plasma insulin after an overnight fast at (e,g) 12 and (f,h) 22 weeks for (e,f) male and (g,h) female Rreb1+/+ and Rreb1+/− mice on HFD and LFD. n = 15-24. Data are shown as mean ± s.e.m. Area of curve (AOC) was calculated and statistical analyses performed between genotypes using (a,b,c,d) one way ANOVA with Sidak’s multiple comparisons test or (e,f,g) Brown-Forsythe and Welch ANOVA tests with Dunnett's T3 multiple comparisons test. Where necessary to normalize data distribution before analysis, data was transformed by (e,h) Y=1/Y or (f,g) Y=log(Y). *p<0.05, **p<0.01.
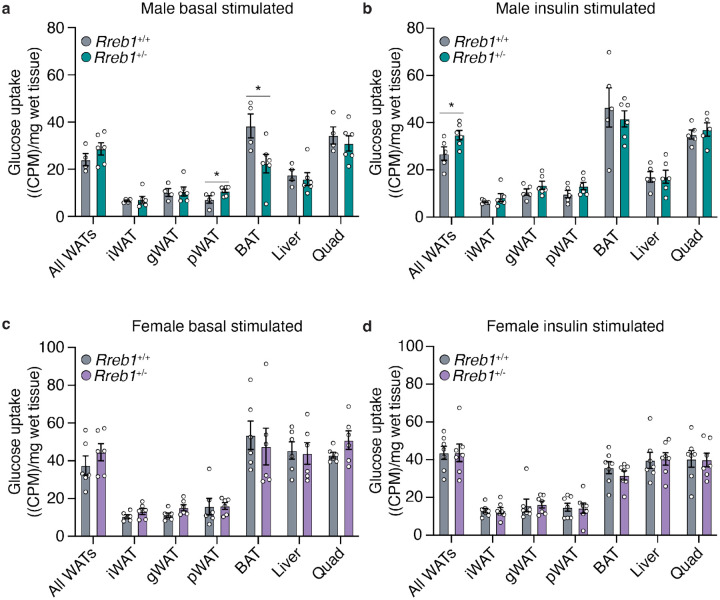
To determine if loss of Rreb1 changed glucose uptake in adipose tissue, we performed radiolabeled tracing using [3H]-2-deoxy-glucose in wildtype and Rreb1+/− mice on a standard chow diet (18% fat, 24% protein, and 58% carbohydrates) between age 34 and 37 weeks of age. Under basal conditions, male Rreb1+/− mice had increased glucose uptake in perirenal white adipose tissue and decreased glucose uptake in brown adipose tissue (Fig. 7a). Moreover, when male Rreb1+/− mice were stimulated with insulin, there was a significant increase in glucose uptake across all white adipose tissues (Fig. 7b). Female Rreb1+/− had no change in glucose uptake under basal (Fig. 7c) or insulin stimulated conditions (Fig. 7d), consistent with the in vivo insulin sensitivity tests (Fig. 6c,d). Taken together, these results suggest that depending on sex, diet, and age, global Rreb1 haploinsufficiency decreases insulin secretion, reduces fasting insulin, and results in smaller, more insulin sensitive adipocytes.
Fig. 7 ∣. Improved insulin-stimulated glucose uptake in male Rreb1+/− mice.
a,b Basal (a) and insulin-stimulated (b) glucose uptake ((CPM)/mg of wet tissue weight) in all white adipose tissues (WAT), inguinal (iWAT), gonadal (gWAT), perirenal (pWAT), brown adipose tissue (BAT), liver and quadricep in male wildtype (grey) and Rreb1+/− (green) mice. c,d Basal (c) and insulin-stimulated (d) glucose uptake ((CPM)/mg of wet tissue weight) in all white adipose tissues (WAT), inguinal (iWAT), gonadal (gWAT), perirenal (pWAT), brown adipose tissue (BAT), liver and quadricep in female wildtype (grey) and Rreb1+/− (purple) mice. Data are shown as mean ± s.e.m. Statistical analyses were performed between genotypes using an unpaired t-test. n = 4-7. *p<0.05.
Rreb1 perturbation impacts adipogenesis in vitro
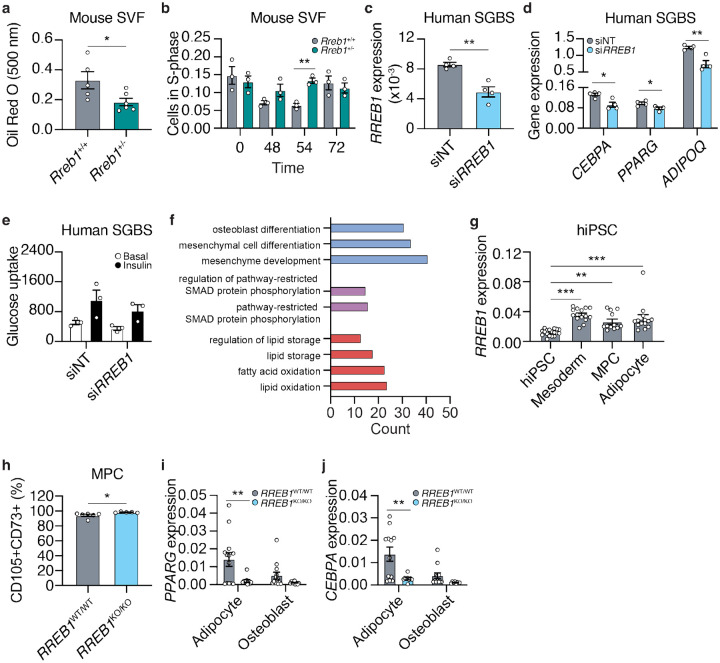
To understand how loss of Rreb1 reduces adipocyte size, we isolated cells from the mouse stromal vascular fraction (SVF) of Rreb1+/+ and Rreb1+/− mice and differentiated them in vitro for 48 hours. There was a significant reduction in the formation of adipocytes from SVF cells isolated from male Rreb1+/− mice compared to wildtype control (Fig. 8a). In addition, there was a significant increase in the number of BrdU+ S-phase cells immediately following induction of differentiation (Fig. 8b), suggesting that in the absence of Rreb1 fewer pre-adipocytes exit the cell cycle and commit to differentiation26.
Fig. 8 ∣. Loss of Rreb1 decreases adipocyte formation and expression of pro-adipogenic genes.
a Quantification of adipocyte formation using Oil Red O staining (absorbance at 500 nm) in stromal vascular fraction (SVF) cells from wildtype (Rreb1+/+; grey) and knockout (Rreb1+/−; green) mice. n = 5-6. b Quantification of BrdU+ S-phase cells during in vitro differentiation of SVF cells from Rreb1+/+ (grey) and Rreb1+/− (green) male mice. n = 3. c RREB1 expression 48 hours following transient transfection of siRNAs against RREB1 (siRREB1) or non-targeting control (siNT) siRNAs in SGBS cells. n = 4. d Gene expression analysis of CEBPA, PPARG, and ADIPOQ at day 5 of in vitro differentiation of SGBS cells to adipocytes. SGBS were treated with siNT and siRREB1 48 hours before differentiation. n = 4. e Glucose uptake of SGBS cells at day 12 of in vitro differentiation. SGBS were treated with siNT and siRREB1 48 hours before differentiation. n = 3. f Gene enrichment analysis of RREB1 knockdown SGBS cells at day 12. The number of differentially expressed genes (count) in a subset of gene ontologies relating to mesenchymal stem cell differentiation (blue), SMAD pathway (purple), and lipids (red). g RREB1 transcript expression normalized to PPIA in human induced pluripotent stem cell (hiPSC), mesoderm, mesenchymal progenitor cells (MPC), and adipocytes. h Flow cytometry analysis of CD105 and CD73 co-expression in wildtype (RREB1WT/WT; grey) and RREB1 knockout (RREB1KO/KO; blue) hiPSC-derived mesenchymal progenitor cells (MPC). i,j hiPSC wildtype (RREB1WT/WT; grey) and RREB1 knockout (RREB1KO/KO; blue) cells were differentiated to adipocyte and osteoblast lineages. The expression of adipocyte genes (i) PPARG and (j) CEBPA were measured by qPCR and normalized to PPIA. Data are presented as mean ± s.e.m. Statistical analyses were performed by unpaired t test or one-way ANOVA. *p<0.05, **p<0.01, ***p<0.001.
To model human adipogenesis we used the Simpson-Golabi-Behmel syndrome (SGBS) human pre-adipocyte cell model27. RREB1 transcript expression increased over the first four days of adipocyte induction and continued to be expressed in maturing adipocytes (Day 8 and 12) (Extended Data Fig. 7a,b), coinciding with the upregulation of pro-adipogenic genes (Extended Data Fig. 7c,d,e; Extended Data Table 3). Supporting our data, RREB1 transcript was also found to be significantly upregulated in scRNA-seq data of adipocytes derived from SGBS cells28. Additionally, RREB1 is more highly expressed in human adipocytes than in progenitor cells29,30, consistent with a potential role for RREB1 in human adipogenesis.
To determine if RREB1 is required for adipogenesis, RREB1 expression was transiently knocked down using siRNAs two days before differentiation; gene expression analysis confirmed a 57% reduction in RREB1 transcript at day 0 (Fig. 8c). After five days of differentiation, loss of RREB1 significantly reduced expression of adipogenic genes CEBPA, PPARG, and ADIPOQ (Fig. 8d), suggesting RREB1 is required for human adipogenic differentiation. Interestingly, despite defects in adipogenic gene expression, there were no differences in insulin-stimulated glucose uptake (Fig. 8e), even when normalized for total protein content (Extended Data Fig. 7f). Transcriptomic analysis of siNT control and siRREB1 SGBS cells after five days of differentiation identified 170 upregulated (log2FC >1.5, padj < 0.05) and 73 downregulated (log2FC < −1.5, padj < 0.05) genes following RREB1 knockdown (Extended Data Table 4). Gene enrichment analysis revealed a significant enrichment of genes involved in ‘regulation of pathway-restricted SMAD protein phosphorylation’ and ‘pathway-restricted SMAD protein phosphorylation’ (Fig. 8f; Extended Data Table 5), which is consistent with the known interaction of RREB1 and SMAD proteins to activate gene expression during epithelial-to-mesenchymal transition15. There were significant enrichments for several GO terms relating to lipids, including ‘regulation of lipid storage’, ‘lipid storage’, ‘fatty acid oxidation’, and ‘lipid oxidation’ (Fig. 8f; Extended Data Table 5). Interestingly, the GO terms ‘osteoblast differentiation’, ‘mesenchymal cell differentiation’, and ‘mesenchyme development’ were significantly enriched (Fig. 8f; Extended Data Table 5), suggesting that loss of RREB1 results in activation of osteogenic genes.
To understand if RREB1 is required for mesenchymal progenitor cell differentiation to fat, we used a RREB1 homozygous null human induced pluripotent stem cell (hiPSC) line21. Isogenic wildtype control (RREB1WT/WT) and knockout (RREB1KO/KO) hiPSCs were differentiated to mesoderm, mesenchymal progenitor cells (MPC), and adipocytes using established protocols31 and commercially available kits. RREB1 transcript is detected throughout all stages of the differentiation and peaks in mesodermal cells (Fig. 8g), consistent with the known role of RREB1 in early development and gastrulation22. RREB1 transcript was significantly reduced at the mesoderm stage (Extended Data Fig. 7g). RREB1 knockout significantly increased the expression of key mesodermal transcription factors MIXL1 (Extended Data Fig. 7h), TBXT (Extended Data Fig. 7i), without changing NCAM1 expression (Extended Data Fig. 7j). There was also a significant increase in the formation of CD105+CD73+ MPCs derived from RREB1KO/KO hiPSCs compared to wildtype control (Fig, 8h). Despite improved formation of earlier progenitor populations, RREB1KO/KO MPCs differentiated to both adipocyte and osteoblast lineages had reduced expression of adipocyte genes PPARG (Fig. 8i) and CEBPA (Fig. 8j). Together, these data suggest that in the absence of RREB1 MPCs, the common precursor to both adipocytes and osteoblasts, fail to robustly activate expression of adipogenic genes and instead activate the osteoblast lineage.
Rreb1 haploinsufficiency increases bone mineral density in mice
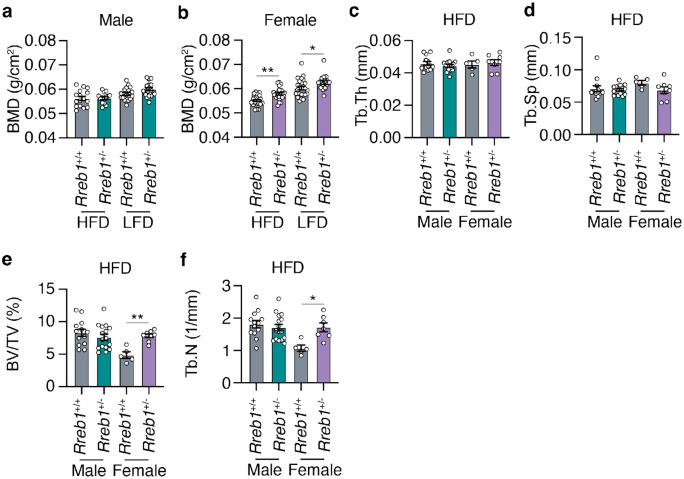
As the RREB1 locus is also associated with bone mineral density (BMD)7 and our in vitro differentiation model supports changes in osteoblast formation, we measured BMD in the tibia of Rreb1+/− mouse using dual-energy X-ray absorptiometry (DEXA). While there were no differences in BMD of male Rreb1+/− mice (Fig. 9a), female Rreb1+/− mice on HFD and LFD at 29 weeks had significantly increased BMD (Fig. 9b). Further measurements of the tibial trabecular bone using microCT found no significant differences in trabecular thickness (Fig. 9c; Tb.Th) and separation (Fig. 9d; Tb.Sp) following Rreb1 knockout. However, there were significant increases in both trabecular bone volume (Fig. 9e; BV/TV) and trabecular number (Fig. 9f; Tb.N) in female mice. Together, these data suggest that loss of RREB1 influences skeletal traits and is directionally consistent with human genetic association data for the RREB1 locus.
Fig. 9 ∣. Increased bone mineral density in Rreb1 heterozygous knockout mice.
a,b Bone mineral density (BMD; g/cm2) on HFD and LFD of (a) male (n = 14-20) and (b) female (n = 17-24) mice at 29 weeks. c,d,e,f MicroCT analysis of male and female mice on HFD for (c) trabecular thickness (Tb.Th), (d) trabecular separation (Tb.Sp), (e) bone volume/tissue volume (BV/TV), and (f) trabecular number (Tb.N). n = 5-16. Data are presented as mean ± s.e.m. Statistical analyses were performed by one-way ANOVA with Šídák's multiple comparisons test. *p<0.05 and **p<0.01.
Human carriers of RREB1 non-coding protective alleles have reduced adipocyte area
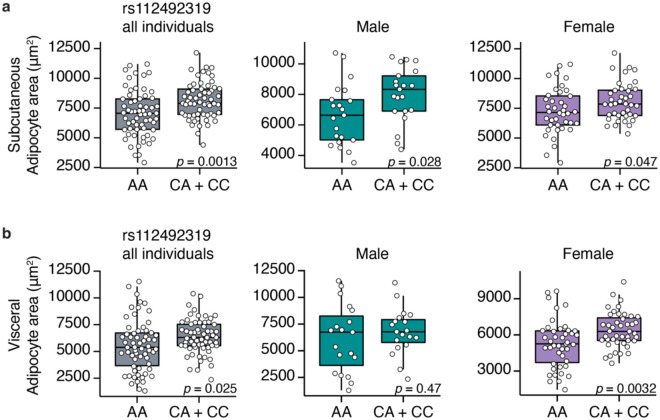
A consistent phenotype amongst our in vitro and in vivo models is a reduction in adipocyte size. To understand if human carriers of T2D-protective alleles have alterations in adipocyte size, we performed histological analysis of adipocyte area in donor subcutaneous and visceral adipose tissue32. For two of the T2D association signals (rs9505097 and rs9370984) at the RREB1 locus, there were no significant differences in subcutaneous or visceral adipocyte area (Extended Data Fig. 8). For the rs112498319 variant, homozygous carriers of the T2D-protective allele had a significant reduction in subcutaneous adipocyte area in all individuals (Fig. 10a). When classifying individual donors by sex, significant reductions in subcutaneous adipocyte area for both male and female carriers of the protective A allele remained (Fig. 10a). While there was also a significant reduction in visceral adipocyte area in all individuals, the reduction was driven by a significant reduction in female carriers of the T2D-protective A allele (Fig. 10b). The credible set for the rs112498319 contains over 200 variants (Extended Data Fig. 9), one of which is located within a region that has long-range contact with the RREB1 gene (Extended Data Fig. 9). This region overlaps with a putative enhancer that is activated during adipogenesis based on ATAC-seq data from SGBS cells as well as MED1 and H3K27ac ChIP-seq data and DNase I hypersensitive sites from BM-hMSCs (Extended Data Fig. 9). Taken together, these data support our mouse model where Rreb1 heterozygous loss-of-function is protective against T2D by reducing adipocyte size in females, leading to more insulin sensitive adipocytes.
Fig. 10 ∣. Changes in human adipocyte area in RREB1 rs112492319 variant carriers.
a,b Adipocyte area of (a) subcutaneous and (b) visceral fat from human donors carrying rs112492319 variants. Left graph: all individuals (pooled and matched); middle graph: males; right graph: females. Data are presented as mean ± s.e.m. Statistical analyses were performed by unpaired t-test. Individual p values are labelled in each graph.
Discussion
There is compelling genetic evidence that variation at the RREB1 locus influences T2D risk and other metabolic traits. Our previous study21 supports a role for pancreatic beta cells in mediating T2D risk at the RREB1 locus; however, the relative contribution of other diabetes-relevant tissues and whether RREB1 T2D-risk alleles result in a loss- or gain-of-function remains unknown. Using a global heterozygous Rreb1 knockout mouse model, we now show that Rreb1 haploinsufficiency reduces length, body weight, and fat mass (Fig. 11). Rreb1+/− mice had diet- and sex-specific differences in adipose tissue; male Rreb1+/− mice on HFD had increased depot size and larger adipocytes, whereas male mice on LFD and female mice on HFD had reduced depot size with smaller adipocytes in females (Fig. 11). Male mice showed significant improved insulin sensitivity on HFD when measured in vivo by IPIST at 16 weeks (although lost by 26 weeks and reversed on a LFD at that age), together with lower fasting insulin on HFD at both age points, and had improved glucose uptake in white adipose tissue in response to insulin in vivo. Mouse and human pre-adipocytes demonstrated defects in adipogenesis and were instead primed to form osteoblasts, consistent with the increase in BMD measured in female Rreb1+/− mice. Finally, there were significant decreases in adipocyte size for male and female human carriers of the T2D-protective alleles, suggesting that Rreb1 loss-of-function protects against diabetes due to the generation of smaller, more insulin sensitive adipocytes.
Fig. 11 ∣. RREB1 loss-of-function protects against type 2 diabetes.
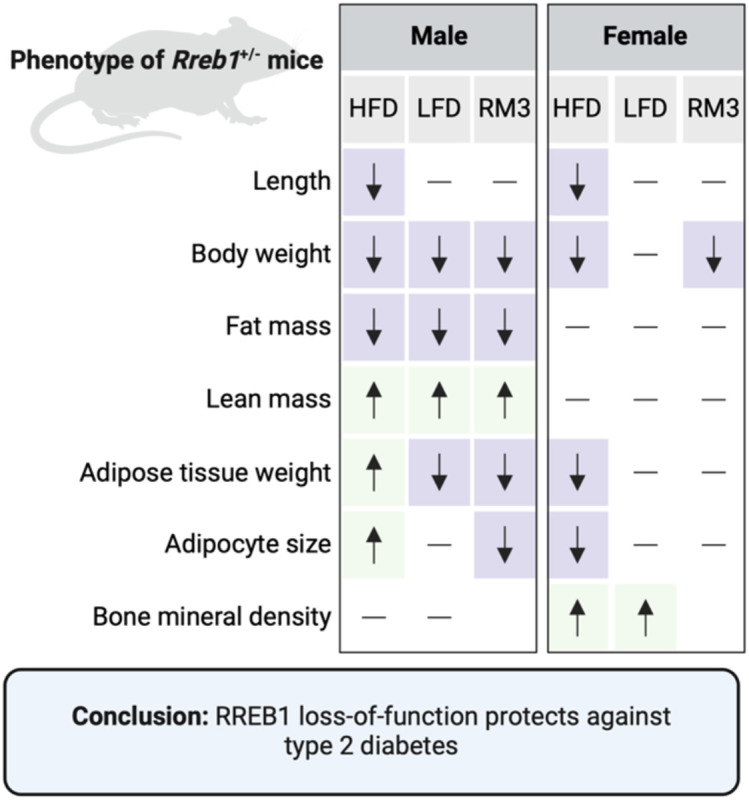
Overview of significant differences in measured phenotypes in the global Rreb1 heterozygous knockout male and female mice on HFD, LFD, and RM3 diet. Created with BioRender.com.
Rreb1 haploinsufficiency in mice causes decreased weight gain on a HFD and diet-specific differences in visceral adipose tissue. Adipocyte tissue is expanded by either increasing the size (hypertrophy) or number (hyperplasia) of adipocytes. Adipocyte hypertrophy is associated with T2D33,34, dyslipidemia35, and cardiovascular disease36. Studies examining functional differences, such as gene expression37,38, adipokine secretion39, and rate of lipolysis40, support a correlation between adipocyte size and insulin resistance. Consistent with the correlation between adipocyte size and function, Rreb1 heterozygous mice have smaller adipocytes with increased insulin sensitivity. Human carriers of the RREB1 variant rs112492319 also have differences in subcutaneous and visceral adipocyte area, with carriers of the T2D-risk allele having increased adipocyte size. This improved insulin sensitivity likely compensates for the detrimental effects of RREB1 loss-of-function on pancreatic beta cell development and function.
Previous studies have shown that RREB1 is required for the generation of brown adipocytes from precursor cells16,41. Rreb1 was significantly upregulated during mesenchymal stem cell differentiation to brown fat in mice16. The promoter region of Rreb1 contains an active super-enhancer bound by the master adipogenic transcription factor PPARγ16. Overexpression of Rreb1 increased thermogenic capacity in brown adipocytes16, while knockdown decreased adipogenesis16,41. Mechanistically, Rreb1 positively regulates expression of brown fat genes Ucp1 and Cidea by recruiting the H3K27me3 demethylase, Jmjd3, to promoters41. Here we show using both human and mouse cellular models that RREB1 loss-of-function decreases expression of pro-adipogenic genes, supporting an additional role for RREB1 in white adipogenesis. Despite a significant decrease in the brown adipocyte gene Elovl3 in our SGBS knockdown model, we did not measure any significant differences in BAT following Rreb1 haploinsufficiency in vivo.
In conclusion, our work suggests that genetic variation at the RREB1 locus protects against T2D by impacting progenitor cell differentiation resulting in smaller, more insulin sensitive adipocytes. We have characterized an in vivo global heterozygous knockout mouse model, which supports a key role for the adipose tissue in mediating T2D-risk at the RREB1 locus. Future studies aimed at understanding the tissue-specific contribution of RREB1 will be important to further dissect the genetic contribution of RREB1 in diabetes.
Methods
Animal models and animal care
Global heterozygous C57BL/6N-Rreb1tm1b(EUCOMM)Wtsi knockout mice (homozygotes are embryonic lethal) were obtained from International Mouse Phenotyping Consortium (IMPC) (Sanger, UK)42-45. Mice were maintained following UK Home Office legislation and local ethical guidelines issued by the Medical Research Council (Responsibility in the Use of Animals for Medical Research, July 1993). Procedures were approved by the MRC Harwell Animal Welfare and Ethical Review Board (AWERB). Mice were maintained in an animal room with 12h light and dark cycle with a temperature of 21±2°C and 55±10% humidity. Mice were fed ad libitum either 1) a standard rat and mouse No. 3 breeding diet (RM3; Special Diets Services, France) containing 11%kcal fat, 27%kcal protein, and 62%kcal carbohydrates; 2) a high-fat diet (HFD; D12492, Research Diets, New Brunswick, NJ, USA) of 60%kcal fat, 20%kcal protein, and 20%kcal carbohydrates; or 3) a low-fat diet (LFD; D12450J, Research Diets, New Brunswick, NJ, USA) of 10%kcal fat, 20%kcal protein and 70%kcal carbohydrates. Phenotyping tests were performed according to EMPReSS (European Phenotyping Resource for Standardised Screens from EUMORPHIA) standardized protocols as described (http://empress.har.mrc.ac.uk/). The cohort of mice used for in vivo glucose uptake assays were fed standard chow of 18% calories from fat, 24% calories from protein, and 58% calories from carbohydrates (2018 Teklad Global 18% Protein Rodent Diet). In vivo glucose uptake assays were performed per procedures approved by the Institutional Animal Care and Use Committee of the Stanford Animal Care and Use Committee (APLAC) protocol number #32982.
Body composition
Body composition, including whole body fat mass and lean mass, were measured using Nuclear Magnetic Resonance (EchoMRI-100H). Briefly, mice were restrained in a clear plastic tube before insertion into the instrument for body composition measurements. Body length was measured (in mm) from the tip of the nose to the base of the tail using a ruler. Bone mineral content and bone mineral density were accessed using the II Dual Energy Xray Analyser (DEXA) (PIXImus). An intraperitoneal injection of anesthetic solution (10 μl ketamine/Xylazine per gram of body weight) was given to mice prior to the DEXA procedure. MicroCT analysis was performed using Skyscan 1172 to access tibia tubercular bone. At 38 weeks old, mice were humanely euthanized by cervical dislocation and individual fat depots were dissected and weighed: gonadal WAT (gWAT), mesenteric WAT (mWAT), perirenal WAT (pWAT), inguinal WAT (iWAT)46,47.
Histological analysis
Liver, white adipose tissues (gWAT, gonadal; mWAT, mesenteric; pWAT, perirenal; and iWAT, inguinal subcutaneous), brown adipose tissue were dissected and fixed in Surgipath neutral buffered formaldehyde (Leica). Tissues were embedded with paraffin and were stained with hematoxylin and eosin. Images were captured using the NanoZoomer slide scanner (Hamamatsu Photonics) and adipocyte size was calculated using Adiposoft48. Adipocytes were sorted into size ranges. For the HFD and LFD comparisons in both sexes, the size range of each bin differed by 250 μm2 increments. For the RM3 initial diet study only males were analyzed and bin sizes increased in 1000 μm2 increments. Where relative frequency of adipocyte area data for heterozygotes and wildtype mice converged/diverged, a cutoff size range was determined by visual inspection of the data to allow calculation of area under the curve in the regions of divergence (shown by dotted lines in the Figures). This allowed testing of differences within larger and smaller adipocyte size range. AUC was also calculated for the entire dataset. AUC determination and statistical tests were carried out in GraphPad Prism. Data was evaluated for normality using a combination of D’Agostino and Pearson tests in combination with QQ plots. Depending on normality and equality of variance two tailed t-tests or Mann-Whitney two tailed tests were used.
Plasma analysis
Plasma insulin was measured using a Mouse Insulin ELISA (Mercodia, 10-1247-01). Adiponectin was measured using a Mouse Adiponectin ELISA (Merck, EZMADP-60K). Leptin was measured using Millipore Leptin ELISA (Millipore, EZML-82k). Plasma liver function markers (ALP, ALT, AST) were measured on an AU400 Automated Clinical Chemistry Analyzer (Olympus).
Food intake and metabolic rate measurement
For food intake studies, two mice of the same genotype and sex were weaned into a cage at 3 weeks of age. A fine scale was used to measure weekly food weights at the same time as cage changing. Metabolic rate was accessed using Oxymax indirect calorimetry (Columbus Instruments) including oxygen consumption, carbon dioxide production, respiratory exchange ratio (RER), and heat production49. Oxygen consumption and carbon dioxide production were normalized to body weight. Heat production (energy expenditure) was determined using the equation heat = CV x VO2, where CV = 3.815 + 1.232 x RER (CV, calorific value based on the observed respiratory exchange ratio)49.
In vivo measurements of glucose homeostasis
Intraperitoneal glucose tolerance tests (IPGTT) were performed at 12 and 20 weeks of age. Mice were fasted for 16 hours and were weighed before the test was performed. A blood sample was collected at time zero/baseline from the tail vein using a Lithium-Heparin microvette tube (Sarstedt) after local anesthetic (EMLA cream, Eutectic Mixture of Local Anesthetics, Lidocaine/Prilocaine, AstraZeneca). Mice were intraperitoneal injected with a glucose dose of 2 g/kg body weight (20% glucose in 0.9% NaCl). Blood glucose measurements were performed as above at 30-, 60-, and 120-minutes post glucose injection. Plasma glucose was measured using an GM9 Glucose Analyser (Analox Instruments).
Intraperitoneal insulin sensitivity tests (IPIST) were performed at 16 and 24 weeks of age. Mice were fasted for 5-6 hours and were weighed before the test was performed. A baseline glucose level was measured before mice were injected intraperitoneally with insulin solution. Mice were intraperitoneal injected with 0.5-1.5 IU insulin/kg body weight (0.05-0.15 IU /ml insulin diluted in 0.9% NaCl). Blood glucose measurements were performed at 15-, 30-, 45-, 60-, and 90-minutes post injection.
Pancreatic islet isolation
The islet isolation procedure was performed as previously described50. In brief ice-cold Collagenase XI 0.5 mg/mL solution (Sigma-Aldrich, C7657) was injected into the bile duct and the pancreas was perfused. The pancreas was then removed and incubated at 37°C for 15 minutes with vigorous shaking every 5 minutes. To wash the samples, 0.5% (v/v) fatty acid free BSA solution (Sigma-Aldrich, A8806) was added and the samples were placed on ice for 10 minutes. The washing step was repeated once more before the islets were hand-picked under the microscope.
In vitro glucose stimulated insulin secretion assay (GSIS)
Pancreatic islets were isolated from 13-14 week old female Rreb1+/+ and Rreb1+/− mice (n = 4 mice per genotype) and cultured overnight in RPMI-1640 GlutaMax™ (Gibco, 61870036) containing 10% FBS and 1% Pen-Strep. The following day islets were equilibrated in 2 mM glucose in Krebs-Ringer HEPES (KRH) buffer containing 0.2% (w/v) fatty acid free BSA (Sigma-Aldrich, A7030) for 1 hour (37°C, 5% CO2). Five islets of approximate equal size were hand-picked into each well of a multi-well plate for static GSIS. Islets were treated for 1 hour (37°C, 5% CO2) with 5 different secretagogues. At the end of the incubation, supernatant was collected and islets were collected in acid-ethanol solution (75% (v/v) ethanol, 2% (v/v) HCl, 0.1% (v/v) Triton X-100). This process was repeated two more times to achieve 3 technical replicates in assessing insulin secretion per secretagogue condition. Supernatant and islets in acid-ethanol were stored at −20°C before further analysis. Secreted insulin in supernatant samples was measured using the Ultra-Sensitive Mouse Insulin ELISA Kit (Crystal Chem). Islets in acid-ethanol were sonicated for 5 seconds at 40 kHz, centrifuged (16,000 x g, 4°C, 15 min) and total protein content measured using the Pierce™ BCA Protein Assay Kit (ThermoFisher Scientific). Three technical replicates were used for each secretagogue condition except for the 20 mM glucose and 500 μM tolbutamide condition, where for one wildtype mouse only two technical replicates were used. Each data point represents the average of the technical replicates.
Glucose uptake assay
For in vitro glucose uptake assays cells were washed with PBS and medium was changed to KRH (50 mM HEPES, 136 mM NaCl, 1.25 mM MgSO4, 1.25 mM CaCl2, 4.7 mM KCl, pH 7.4) buffer for three hours. Cells were treated with either BSA control or 0.1 mg/mL insulin and left to incubate for 3 hours. After incubation, cells were treated with a mixture of 2-deoxyglucose and 3H-2-deoxyglucose for 10 minutes at 37°C. Cells were then washed twice in cold KRH buffer before being lysed in RIPA lysis buffer for liquid scintillation counting. Data are expressed as raw CPM counts or normalized to total protein. In vivo glucose uptake assays were performed as described previously51. Briefly, mice were fasted for 2 hours and injected intraperitoneally with 3H-2-deoxyglucose at 100 uCi/kg with saline or 1U/kg insulin in a total volume of 120 μL per mouse. After 30 minutes, the mice were euthanized. Wet tissue weights were recorded and then homogenized in 0.1% SDS for liquid scintillation counting. Data are expressed as CPM/mg wet tissue weight.
SVF isolation and in vitro differentiation
Individual mouse adipose depots were carefully excised and placed in PBS. Tissues were cut into 1-2 mm pieces, and transferred into digestion buffer [sterile Hank’s Balanced Salt Solution (Sigma Aldrich, H8264), 0.8 mg/mL (0.08%) collagenase, type II (Worthington Biochemical Corp., LS004174), and 30 mg/mL (3%) bovine serum albumin (Sigma Aldrich, A9418)]. Tissues were incubated for 20-45 minutes with vigorous shaking by hand every 10 minutes. Digestion was considered complete when there were no more visible clumps of tissue. To isolate the SVF fraction, samples were centrifuged for 3 minutes at 300xg and the cell pellet was resuspended in growth media (DMEM with 10% FBS and 1% Pen/Strep). The resulting cell suspension was filtered through a 40 μm nylon mesh and plated onto a 10 cm dish. After 24 hours, the attached cells were gently washed twice with PBS before adding fresh growth media. When cells reached 80-90% confluency they were passaged using TrypLE Express (ThermoFisher, 12604013) and were plated at a density of 180,000-200,000 cells/well of 6-well plate for the Oil Red O studies, or 60,000 cells/well for proliferation studies. Twenty-four hours after plating (day 0), media was changed to DMEM with 10% FBS, 125 mM indomethacin, 1 nM T3, 1 μM dexamethasone, 0.5 μM IBMX, and 20 nM human insulin. On day 4, media was changed to DMEM with 10% FBS, 1 nM T3, and 20 nM human insulin. Oil Red O assay was performed at day 7.
Oil Red O assay
Cells were washed with DPBS twice and fixed with 4% paraformaldehyde for 15 minutes on ice. Cells were then rinsed twice with water and incubated with 60% isopropanol for 5 minutes at room temperature. A 3:2 dilution of Oil Red O filtered solution (0.5 g/100 mL isopropanol; Sigma-Aldrich) was added to cells and incubated for 5 minutes at room temperature. Oil Red O was then rinsed with ddH2O three times before addition of a 4% (v/v) IGEPAL® CA-630 (4 mL in 96 mL 100% isopropanol) solution for 10 minutes with gentle shaking on an orbital shaker (Sigma-Aldrich) at room temperature. Lipid content quantification was measured using 100 μL of sample that was transferred into a 96 well plate at an absorbance of 500 nm.
Click-iT® Plus EdU proliferation assay
Cells were incubated with 10 μM EdU at 37°C for 2 hours. Cells were rinsed with DPBS three times before fixation with 4% PFA for 15 minutes at room temperature. Cells were rinsed twice with 3% (w/v) BSA in PBS and then permeabilized in 0.5% TritonX-100 for 20 minutes at room temperature. Cells were incubated for 30 minutes at room temperature with the Click-iT Plus EdU Cell Proliferation Kit according to manufacturer’s instructions (ThermoFisher Scientific, C10640). Nuclear staining was performed using the NucBlue™ Live ReadyProbes™ Reagent (ThermoFisher Scientific, R37605) and images were captured at 488 nm excitation wavelength by the Zeiss LSM700 confocal microscope..
SGBS differentiation and gene silencing
SGBS cell line was maintained and differentiated as previously described27,52 and experiments were performed using cells between generation 34 and 39. Cells were cultured in DMEM/F12 with 10% FBS, 33 μM biotin (Sigma-Aldrich, B4693), 17 μM pantothenate (Sigma-Aldrich, P5155), and antibiotics (Gibco, 15140-122; 100 IU/mL penicillin and 100 μg/mL streptomycin). For differentiation, 20,000 cells were plated per well of a 12-well plate. Once cells reached near confluence (day 0, approximately three days post plating), cells were washed with PBS before adding DMEM/F12 supplemented with 33 μM biotin, 17 μM pantothenate, antibiotics, 0.01 mg/mL transferrin (Sigma-Aldrich, T2252), 20 nM insulin (Gibco, 12585-014), 100 nM cortisol (Sigma-Aldrich, H0888), 0.2 nM T3 (Sigma-Aldrich, T6397), 25 nM dexamethasone (Sigma-Aldrich, D1756), 250 μM IBMX (Sigma-Aldrich, I5879), and 2 μM rosiglitazone (Cayman, 71740). On day 4, the media was replaced with DMEM/F12 supplemented with 33 μM biotin, 17 μM pantothenate, antibiotics, 0.01 mg/mL transferrin, 20 nM insulin, 100 nM cortisol, and 0.2 nM T3. Media was replaced on day 8 and cells were collected at day 12 for further analysis. Gene silencing was performed according to Lipofectamine RNAiMAX transfection protocol using 50 nM SMART pool (mixture of four siRNAs) on-TARGETplus siRNAs against either non-targeting control (siNT) or RREB1 (siRREB1). Transfection was performed on day −2 or 48-hours before differentiation and knockdown efficiency was assessed at day 0.
hiPSC differentiation to adipocytes and osteoblasts
RREB1 wildtype and knockout hiPSC lines were previously generated21. The STEMdiff Mesenchymal Progenitor Kit (StemCell Technologies, 05240) was used to generate mesenchymal progenitor cells from RREB1 wildtype and knockout hiPSC lines. Briefly, hiPSCs were plated on Matrigel-coated plates (Corning, 354230) at a density of 5x10⁴ cells/cm2 in mTeSR1 (StemCell Technologies, 85850) supplemented with 10 μM Y-27632 (StemCell Technologies, 72304). Forty-eight hours after plating, media was changed to STEMdiff-ACF Mesenchymal Induction Medium for four days with daily media changes. On day 4, the cells were switched to MesenCult-ACF Plus Medium and passaged accordingly to manufacturer’s protocol on day 6. The cells were then passaged twice weekly at 80% confluency and maintained in MesenCult-ACF Plus Medium. The resulting mesenchymal progenitor cells were cryopreserved using MesenCult-ACF Freezing Medium. MesenCult Adipogenic Differentiation Kit (Human) and MesenCult Osteogenic Differentiation Kit (Human) were used to induce differentiation of hiPSC-derived mesenchymal progenitor cells to adipocytes and osteoblasts, respectively (StemCell Technologies, 05412 and 05465).
RNA isolation and transcriptomic analyses
For mouse adipose tissues and islets, total RNA was extracted using the Lipid Tissue Mini kit (Qiagen) and the RNeasy Micro kit (Qiagen), respectively, according to the manufacturer’s instructions. RNA concentration was measured using a NanoDrop ND-1000 spectrophotometer (ThermoFisher Scientific). RNA integrity was accessed using the 2100 Bioanalyser (Agilent). Total RNA quantity and integrity were assessed using Quant-IT RiboGreen RNA Assay Kit (Invitrogen) and Agilent Tapestation. Purification of mRNA, generation of double stranded cDNA and library construction were performed using NEBNext Poly(A) mRNA Magnetic Isolation Module (E7490) and NEBNext Ultra II Directional RNA Library Prep Kit for Illumina (E7760L) with our own adapters and barcode tags (dual indexing53). The concentrations used to generate the multiplex pool were determined by Picogreen. The final size distribution of the pool was determined using a Tapestation system (Agilent), and quantification was determined by Qubit (ThermoFisher Scientific) before sequencing on an Illumina NovaSeq6000 as 150bp paired end. For SGBS samples, total RNA was extracted using TRIzol according to manufacturer’s instructions (ThermoFisher Scientific, 15596026). Sample QC, mRNA library preparation (poly A enrichment), and RNA-seq (NovaSeq PE150) were performed by Novogene. Reads were mapped to the human genome build GRCh38 or mouse genome build GRCm38 using STAR (v2.7.9a)54 with ENSEMBL gene annotations (v101). featureCounts (v2.0.1) was used to determine gene expression levels and differential expression analysis was performed using DESeq255.
Analysis of enhancer activity and interactome during adipogenesis and osteogenesis
Fastq files from ATAC-Seq during SGBS differentiation were obtained from GSE17879656 and processed using the nextflow pipeline (https://nf-co.re/atacseq/2.1.2, version 2.1.2) developed and maintained by the nf-core framework57. Briefly, reads were aligned to the hg19 reference genome using BWA58 and normalized coverage tracks created using BEDtools59. MED1, H3K27ac ChIP-Seq and DNase-seq [GSE113253] were processed as previously described60. Data for enhancer capture Hi-C at Day 10 of BM-hMSC-TERT adipogenesis [GSE140782] was processed as previously described61. Integration and visualization of genomic data was performed using the python package pyGenomeTracks v3.862.
Adipocyte area measurements in human donor adipose tissue
Adipocyte area estimates, together with genotype calls based on the Illumina Global Screening bead chip array, were retrieved from the Munich Obesity BioBank (MOBB) to investigate the relationship between fat cell size and RREB1 genotype in a large cohort of human samples. Briefly, subcutaneous and visceral adipose tissue, together with buffy coat for genomic DNA extraction were collected during elective abdominal surgery. Written informed consent was obtained from all study participants and the study protocol was approved by the ethics committee of the Technical University of Munich (Study No. 5716/13). Hematoxylin and Eosin-stained slides were generated from formalin-fixed paraffin embedded tissue and adipocyte area was determined using a machine learning based approach (Adipocyte U-net) as described earlier32,63. A lower bound threshold of 200 μm2 and an upper bound threshold of 16,000 μm2 was set to remove potential artefacts. Mean adipocyte area per depot and individual was calculated based on a number of 200 unique identified objects and used for all further analyses stratifying between different RREB1 genotypes.
Statistical analysis
All data are displayed as means ± s.e.m. Statistical analyses were generated using Prism 10.0.2 (GraphPad). Details of the statistical tests used are indicated in the figure legends. Statistical significance is represented as *p<0.05, **p<0.01, ***p<0.001, ****p<0.0001.
Acknowledgements
We thank the Wellcome Trust Sanger Institute Mouse Genetics Project (Sanger MGP) and its funders for providing the mutant mouse line C57BL/6N-Rreb1tm1b(EUCOMM)Wtsi and the European Mouse Mutant Archive (www.infrafrontier.eu; Repository number EM:14150) partner the Mary Lyon Centre at MRC Harwell from which the mouse line was received. Funding and associated primary phenotypic information may be found at www.sanger.ac.uk/mouseportal and https://www.mousephenotype.org. We thank the UKRI Medical Research Council (MC_U142661184, MC_UP_2201/1) for supporting the mouse studies. NAJK was supported by the Stanford Maternal and Child Health Research Institute (MCHRI) Postdoctoral fellowship. MZ was supported by the K99/R00 NIH Pathway to Independence Award (K99AR081618) from NIAMS. JWK was supported by the NIH through grants: P30 DK116074 (to the Stanford Diabetes Research Center), R01 DK116750, R01 DK120565, R01 DK106236; and by the American Diabetes Association through grant 1-19-JDF-108. KJS was supported by R01DK125260, Stanford Diabetes Research Center P30DK116074, and American Heart Association 23IPA1042031. This work was funded in Oxford and Stanford by the Wellcome Trust (095101, 200837), the UKRI Medical Research Council (MR/L020149/1), and the NIH (UM1-1DK126185). ALG was supported by a Wellcome Trust Senior Fellow in Basic Biomedical Science.
Footnotes
Competing interests
ALG discloses that her spouse is an employee of Genentech and hold stock options in Roche. All other authors declare no interests that could be considered conflicting.
Data Availability
Sequencing data will be available at the European Genome-phenome Archive (EGA) under study number EGAS50000000253.
References
- 1.Fuchsberger C. et al. The genetic architecture of type 2 diabetes. Nature 536, 41–47 (2016). 10.1038/nature18642 [DOI] [PMC free article] [PubMed] [Google Scholar]
- 2.Mahajan A. et al. Genome-wide trans-ancestry meta-analysis provides insight into the genetic architecture of type 2 diabetes susceptibility. Nature Genetics 46, 234–244 (2014). 10.1038/ng.2897 [DOI] [PMC free article] [PubMed] [Google Scholar]
- 3.Mahajan A. et al. Fine-mapping type 2 diabetes loci to single-variant resolution using high-density imputation and islet-specific epigenome maps. Nat Genet 50, 1505–1513 (2018). 10.1038/s41588-018-0241-6 [DOI] [PMC free article] [PubMed] [Google Scholar]
- 4.Scott R. A. et al. Large-scale association analyses identify new loci influencing glycemic traits and provide insight into the underlying biological pathways. Nat Genet 44, 991–1005 (2012). 10.1038/ng.2385 [DOI] [PMC free article] [PubMed] [Google Scholar]
- 5.Chu A. Y. et al. Multiethnic genome-wide meta-analysis of ectopic fat depots identifies loci associated with adipocyte development and differentiation. Nat Genet 49, 125–130 (2017). 10.1038/ng.3738 [DOI] [PMC free article] [PubMed] [Google Scholar]
- 6.Liu C. T. et al. Genome-wide association of body fat distribution in African ancestry populations suggests new loci. PLoS Genet 9, e1003681 (2013). 10.1371/journal.pgen.1003681 [DOI] [PMC free article] [PubMed] [Google Scholar]
- 7.Feng S. et al. Regulatory SNP of RREB1 is Associated With Bone Mineral Density in Chinese Postmenopausal Osteoporosis Patients. Front Genet 12, 756957 (2021). 10.3389/fgene.2021.756957 [DOI] [PMC free article] [PubMed] [Google Scholar]
- 8.Yengo L. et al. A saturated map of common genetic variants associated with human height. Nature 610, 704–712 (2022). 10.1038/s41586-022-05275-y [DOI] [PMC free article] [PubMed] [Google Scholar]
- 9.Mahajan A. et al. Refining the accuracy of validated target identification through coding variant fine-mapping in type 2 diabetes. Nat Genet 50, 559–571 (2018). 10.1038/s41588-018-0084-1 [DOI] [PMC free article] [PubMed] [Google Scholar]
- 10.Ray S. K., Nishitani J., Petry M. W., Fessing M. Y. & Leiter A. B. Novel transcriptional potentiation of BETA2/NeuroD on the secretin gene promoter by the DNA-binding protein Finb/RREB-1. Mol Cell Biol 23, 259–271 (2003). 10.1128/MCB.23.1.259-271.2003 [DOI] [PMC free article] [PubMed] [Google Scholar]
- 11.Thiagalingam A., Lengauer C., Baylin S. B. & Nelkin B. D. RREB1, a ras responsive element binding protein, maps to human chromosome 6p25. Genomics 45, 630–632 (1997). 10.1006/geno.1997.5001 [DOI] [PubMed] [Google Scholar]
- 12.Flajollet S., Poras I., Carosella E. D. & Moreau P. RREB-1 is a transcriptional repressor of HLA-G. J Immunol 183, 6948–6959 (2009). 10.4049/jimmunol.0902053 [DOI] [PubMed] [Google Scholar]
- 13.Zhang S. et al. p16 INK4a gene promoter variation and differential binding of a repressor, the ras-responsive zinc-finger transcription factor, RREB. Oncogene 22, 2285–2295 (2003). 10.1038/sj.onc.1206257 [DOI] [PubMed] [Google Scholar]
- 14.Kent O. A. et al. Haploinsufficiency of RREB1 causes a Noonan-like RASopathy via epigenetic reprogramming of RAS-MAPK pathway genes. Nat Commun 11, 4673 (2020). 10.1038/s41467-020-18483-9 [DOI] [PMC free article] [PubMed] [Google Scholar]
- 15.Su J. et al. TGF-beta orchestrates fibrogenic and developmental EMTs via the RAS effector RREB1. Nature 577, 566–571 (2020). 10.1038/s41586-019-1897-5 [DOI] [PMC free article] [PubMed] [Google Scholar]
- 16.Brunmeir R. et al. Comparative Transcriptomic and Epigenomic Analyses Reveal New Regulators of Murine Brown Adipogenesis. PLoS Genet 12, e1006474 (2016). 10.1371/journal.pgen.1006474 [DOI] [PMC free article] [PubMed] [Google Scholar]
- 17.Nakatake Y. et al. Generation and Profiling of 2,135 Human ESC Lines for the Systematic Analyses of Cell States Perturbed by Inducing Single Transcription Factors. Cell Rep 31, 107655 (2020). 10.1016/j.celrep.2020.107655 [DOI] [PubMed] [Google Scholar]
- 18.Miyake J. H., Szeto D. P. & Stumph W. E. Analysis of the structure and expression of the chicken gene encoding a homolog of the human RREB-1 transcription factor. Gene 202, 177–186 (1997). 10.1016/s0378-1119(97)00491-5 [DOI] [PubMed] [Google Scholar]
- 19.Torres J. M. et al. A Multi-omic Integrative Scheme Characterizes Tissues of Action at Loci Associated with Type 2 Diabetes. Am J Hum Genet 107, 1011–1028 (2020). 10.1016/j.ajhg.2020.10.009 [DOI] [PMC free article] [PubMed] [Google Scholar]
- 20.Mattis K. K. et al. Loss of RREB1 in pancreatic beta cells reduces cellular insulin content and affects endocrine cell gene expression. bioRxiv, 2022.2006.2004.494826 (2022). 10.1101/2022.06.04.494826 [DOI] [PMC free article] [PubMed] [Google Scholar]
- 21.Mattis K. K. et al. Loss of RREB1 in pancreatic beta cells reduces cellular insulin content and affects endocrine cell gene expression. Diabetologia 66, 674–694 (2023). 10.1007/s00125-022-05856-6 [DOI] [PMC free article] [PubMed] [Google Scholar]
- 22.Morgani S. M., Su J., Nichols J., Massague J. & Hadjantonakis A. K. The transcription factor Rreb1 regulates epithelial architecture, invasiveness, and vasculogenesis in early mouse embryos. Elife 10 (2021). 10.7554/eLife.64811 [DOI] [PMC free article] [PubMed] [Google Scholar]
- 23.Kuhnapfel A. et al. First genome-wide association study of 99 body measures derived from 3-dimensional body scans. Genes Dis 9, 777–788 (2022). 10.1016/j.gendis.2021.02.003 [DOI] [PMC free article] [PubMed] [Google Scholar]
- 24.Soranzo N. et al. Meta-analysis of genome-wide scans for human adult stature identifies novel Loci and associations with measures of skeletal frame size. PLoS Genet 5, e1000445 (2009). 10.1371/journal.pgen.1000445 [DOI] [PMC free article] [PubMed] [Google Scholar]
- 25.Pettersson U. S., Walden T. B., Carlsson P. O., Jansson L. & Phillipson M. Female mice are protected against high-fat diet induced metabolic syndrome and increase the regulatory T cell population in adipose tissue. PLoS One 7, e46057 (2012). 10.1371/journal.pone.0046057 [DOI] [PMC free article] [PubMed] [Google Scholar]
- 26.Zhao M. L. et al. Molecular Competition in G1 Controls When Cells Simultaneously Commit to Terminally Differentiate and Exit the Cell Cycle. Cell Rep 31, 107769 (2020). 10.1016/j.celrep.2020.107769 [DOI] [PMC free article] [PubMed] [Google Scholar]
- 27.Wabitsch M. et al. Characterization of a human preadipocyte cell strain with high capacity for adipose differentiation. Int J Obes Relat Metab Disord 25, 8–15 (2001). 10.1038/sj.ijo.0801520 [DOI] [PubMed] [Google Scholar]
- 28.Li J. et al. Single-cell transcriptome dataset of human and mouse in vitro adipogenesis models. Sci Data 10, 387 (2023). 10.1038/s41597-023-02293-x [DOI] [PMC free article] [PubMed] [Google Scholar]
- 29.Moller A. F. & Madsen J. G. S. JOINTLY: interpretable joint clustering of single-cell transcriptomes. Nat Commun 14, 8473 (2023). 10.1038/s41467-023-44279-8 [DOI] [PMC free article] [PubMed] [Google Scholar]
- 30.Emont M. P. et al. A single-cell atlas of human and mouse white adipose tissue. Nature 603, 926–933 (2022). 10.1038/s41586-022-04518-2 [DOI] [PMC free article] [PubMed] [Google Scholar]
- 31.Su S. et al. A Renewable Source of Human Beige Adipocytes for Development of Therapies to Treat Metabolic Syndrome. Cell Rep 25, 3215–3228 e3219 (2018). 10.1016/j.celrep.2018.11.037 [DOI] [PMC free article] [PubMed] [Google Scholar]
- 32.Honecker J. et al. A distribution-centered approach for analyzing human adipocyte size estimates and their association with obesity-related traits and mitochondrial function. Int J Obes (Lond) 45, 2108–2117 (2021). 10.1038/s41366-021-00883-6 [DOI] [PMC free article] [PubMed] [Google Scholar]
- 33.Lönn M., Mehlig K., Bengtsson C. & Lissner L. Adipocyte size predicts incidence of type 2 diabetes in women. Faseb j 24, 326–331 (2010). 10.1096/fj.09-133058 [DOI] [PubMed] [Google Scholar]
- 34.Weyer C., Foley J. E., Bogardus C., Tataranni P. A. & Pratley R. E. Enlarged subcutaneous abdominal adipocyte size, but not obesity itself, predicts Type II diabetes independent of insulin resistance. Diabetologia 43, 1498–1506 (2000). 10.1007/s001250051560 [DOI] [PubMed] [Google Scholar]
- 35.Veilleux A., Caron-Jobin M., Noel S., Laberge P. Y. & Tchernof A. Visceral adipocyte hypertrophy is associated with dyslipidemia independent of body composition and fat distribution in women. Diabetes 60, 1504–1511 (2011). 10.2337/db10-1039 [DOI] [PMC free article] [PubMed] [Google Scholar]
- 36.Ryden M. & Arner P. Cardiovascular risk score is linked to subcutaneous adipocyte size and lipid metabolism. J Intern Med 282, 220–228 (2017). 10.1111/joim.12641 [DOI] [PubMed] [Google Scholar]
- 37.Jernås M. et al. Separation of human adipocytes by size: hypertrophic fat cells display distinct gene expression. Faseb j 20, 1540–1542 (2006). 10.1096/fj.05-5678fje [DOI] [PubMed] [Google Scholar]
- 38.Honecker J. et al. Transcriptome and fatty-acid signatures of adipocyte hypertrophy and its non-invasive MR-based characterization in human adipose tissue. EBioMedicine 79, 104020 (2022). 10.1016/j.ebiom.2022.104020 [DOI] [PMC free article] [PubMed] [Google Scholar]
- 39.Skurk T., Alberti-Huber C., Herder C. & Hauner H. Relationship between adipocyte size and adipokine expression and secretion. J Clin Endocrinol Metab 92, 1023–1033 (2007). 10.1210/jc.2006-1055 [DOI] [PubMed] [Google Scholar]
- 40.Laurencikiene J. et al. Regulation of lipolysis in small and large fat cells of the same subject. J Clin Endocrinol Metab 96, E2045–2049 (2011). 10.1210/jc.2011-1702 [DOI] [PubMed] [Google Scholar]
- 41.Pan D. et al. Jmjd3-Mediated H3K27me3 Dynamics Orchestrate Brown Fat Development and Regulate White Fat Plasticity. Dev Cell 35, 568–583 (2015). 10.1016/j.devcel.2015.11.002 [DOI] [PMC free article] [PubMed] [Google Scholar]
- 42.White J. K. et al. Genome-wide generation and systematic phenotyping of knockout mice reveals new roles for many genes. Cell 154, 452–464 (2013). 10.1016/j.cell.2013.06.022 [DOI] [PMC free article] [PubMed] [Google Scholar]
- 43.Skarnes W. C. et al. A conditional knockout resource for the genome-wide study of mouse gene function. Nature 474, 337–342 (2011). 10.1038/nature10163 [DOI] [PMC free article] [PubMed] [Google Scholar]
- 44.Bradley A. et al. The mammalian gene function resource: the International Knockout Mouse Consortium. Mamm Genome 23, 580–586 (2012). 10.1007/s00335-012-9422-2 [DOI] [PMC free article] [PubMed] [Google Scholar]
- 45.Pettitt S. J. et al. Agouti C57BL/6N embryonic stem cells for mouse genetic resources. Nat Methods 6, 493–495 (2009). 10.1038/nmeth.1342 [DOI] [PMC free article] [PubMed] [Google Scholar]
- 46.Muso M. et al. A Wars2 mutant mouse shows a sex and diet specific change in fat distribution, reduced food intake and depot-specific upregulation of WAT browning. Front Physiol 13, 953199 (2022). 10.3389/fphys.2022.953199 [DOI] [PMC free article] [PubMed] [Google Scholar]
- 47.Gray S. L. et al. Leptin deficiency unmasks the deleterious effects of impaired peroxisome proliferator-activated receptor gamma function (P465L PPARgamma) in mice. Diabetes 55, 2669–2677 (2006). 10.2337/db06-0389 [DOI] [PubMed] [Google Scholar]
- 48.Galarraga M. et al. Adiposoft: automated software for the analysis of white adipose tissue cellularity in histological sections. J Lipid Res 53, 2791–2796 (2012). 10.1194/jlr.D023788 [DOI] [PMC free article] [PubMed] [Google Scholar]
- 49.Church C. et al. A mouse model for the metabolic effects of the human fat mass and obesity associated FTO gene. PLoS Genet 5, e1000599 (2009). 10.1371/journal.pgen.1000599 [DOI] [PMC free article] [PubMed] [Google Scholar]
- 50.Hugill A., Shimomura K. & Cox R. D. Islet Insulin Secretion Measurements in the Mouse. Curr Protoc Mouse Biol 6, 256–271 (2016). 10.1002/cpmo.14 [DOI] [PubMed] [Google Scholar]
- 51.Zhao M., Wat L. W. & Svensson K. J. Protocol for in vivo measurement of basal and insulin-stimulated glucose uptake in mouse tissues. STAR Protoc 4, 102179 (2023). 10.1016/j.xpro.2023.102179 [DOI] [PMC free article] [PubMed] [Google Scholar]
- 52.Tews D. et al. 20 Years with SGBS cells - a versatile in vitro model of human adipocyte biology. Int J Obes (Lond) 46, 1939–1947 (2022). 10.1038/s41366-022-01199-9 [DOI] [PMC free article] [PubMed] [Google Scholar]
- 53.Lamble S. et al. Improved workflows for high throughput library preparation using the transposome-based nextera system. BMC Biotechnology 13, 104 (2013). 10.1186/1472-6750-13-104 [DOI] [PMC free article] [PubMed] [Google Scholar]
- 54.Dobin A. et al. STAR: ultrafast universal RNA-seq aligner. Bioinformatics 29, 15–21 (2013). 10.1093/bioinformatics/bts635 [DOI] [PMC free article] [PubMed] [Google Scholar]
- 55.Love M. I., Huber W. & Anders S. Moderated estimation of fold change and dispersion for RNA-seq data with DESeq2. Genome Biol 15, 550 (2014). 10.1186/s13059-014-0550-8 [DOI] [PMC free article] [PubMed] [Google Scholar]
- 56.Perrin H. J. et al. Chromatin accessibility and gene expression during adipocyte differentiation identify context-dependent effects at cardiometabolic GWAS loci. PLoS Genet 17, e1009865 (2021). 10.1371/journal.pgen.1009865 [DOI] [PMC free article] [PubMed] [Google Scholar]
- 57.Ewels P. A. et al. The nf-core framework for community-curated bioinformatics pipelines. Nature Biotechnology 38, 276–278 (2020). 10.1038/s41587-020-0439-x [DOI] [PubMed] [Google Scholar]
- 58.Li H. & Durbin R. Fast and accurate short read alignment with Burrows-Wheeler transform. Bioinformatics 25, 1754–1760 (2009). 10.1093/bioinformatics/btp324 [DOI] [PMC free article] [PubMed] [Google Scholar]
- 59.Quinlan A. R. & Hall I. M. BEDTools: a flexible suite of utilities for comparing genomic features. Bioinformatics 26, 841–842 (2010). 10.1093/bioinformatics/btq033 [DOI] [PMC free article] [PubMed] [Google Scholar]
- 60.Rauch A. et al. Osteogenesis depends on commissioning of a network of stem cell transcription factors that act as repressors of adipogenesis. Nat Genet 51, 716–727 (2019). 10.1038/s41588-019-0359-1 [DOI] [PubMed] [Google Scholar]
- 61.Madsen J. G. S. et al. Highly interconnected enhancer communities control lineage-determining genes in human mesenchymal stem cells. Nat Genet 52, 1227–1238 (2020). 10.1038/s41588-020-0709-z [DOI] [PubMed] [Google Scholar]
- 62.Lopez-Delisle L. et al. pyGenomeTracks: reproducible plots for multivariate genomic datasets. Bioinformatics 37, 422–423 (2021). 10.1093/bioinformatics/btaa692 [DOI] [PMC free article] [PubMed] [Google Scholar]
- 63.Glastonbury C. A. et al. Machine Learning based histology phenotyping to investigate the epidemiologic and genetic basis of adipocyte morphology and cardiometabolic traits. PLoS Comput Biol 16, e1008044 (2020). 10.1371/journal.pcbi.1008044 [DOI] [PMC free article] [PubMed] [Google Scholar]
Associated Data
This section collects any data citations, data availability statements, or supplementary materials included in this article.
Data Availability Statement
Sequencing data will be available at the European Genome-phenome Archive (EGA) under study number EGAS50000000253.


