

Abstract
The area in and around Chicago, IL, is a hotspot of West Nile virus activity. The discovery of a Culex pipiens form molestus Forskӓl population in Chicago in 2009 added to speculation that offspring from hybridization between Cx. pipiens f. pipiens L. and f. molestus could show a preference for feeding on humans. We collected blood-fed female mosquitoes (N = 1,023) from eight residential sites and one public park site in Chicago in July and August 2012. Bloodmeal analysis using the COI (cytochrome c oxidase subunit I) gene was performed to ascertain host choice. Almost all (99%) bloodmeals came from birds, with American Robins (Turdus migratorius L.) and House Sparrows (Passer domesticus L.) making up the largest percentage (74% combined). A forage ratio analysis comparing bird species fed upon and available bird species based on point count surveys indicated Northern Cardinals (Cardinalis cardinalis) and American Robins (Turdus migratorius) appeared to be over-utilized, whereas several species were under-utilized. Two human bloodmeals came from Culex pipiens complex mosquitoes. Admixture and population genetic analyses were conducted with 15 microsatellite loci on head and thorax DNA from the collected blood-fed mosquitoes. A modest amount of hybridization was detected between Cx. pipiens f. pipiens and f. molestus, as well as between f. pipiens and Cx. quinquefasciatus Say. Several pure Cx. quinquefasciatus individuals were noted at the two Trumbull Park sites. Our data suggest that Cx. pipiens complex mosquitoes in the Chicago area are not highly introgressed with f. molestus and appear to utilize avian hosts.
Keywords: Culex pipiens complex, West Nile virus, Culex pipiens form molestus, bloodmeal analysis, microsatellite analysis
West Nile virus (WNV) was introduced to the United States in 1999 in New York City (Lanciotti et al. 1999). New cases of WNV disease developed across the country in subsequent years, and outbreaks have since occurred regularly when conditions favor high rates of transmission. As of 2018, the last full year data are available, cumulative human WNV disease cases in the United States totaled over 50,000 (CDC 2018). Of particular concern is the incidence of West Nile Neuroinvasive Disease (WNND), a more debilitating condition caused by the virus (Davis et al. 2006). The CDC data indicate that Illinois and the Chicago area continue to be locations where WNND cases are reported.
Several mosquito species in the genus Culex are important vectors of WNV in the United States. Culex tarsalis L., found mainly in the western United States, favors habitats such as irrigation ditches, whereas taxa in the Cx. pipiens complex are associated with human habitation and widely distributed. Members of the Cx. pipiens complex in the United States consist of Cx. pipiens L., which enters winter diapause and is found in cooler environments, and Cx. quinquefasciatus (Say), which does not enter diapause and so occurs in southern areas of the United States. A large pipiensquinquefasciatus hybrid zone exists across the middle of the United States (Barr 1957, Kothera et al. 2009). Both Cx. pipiens and Cx. quinquefasciatus are anautogenous. Finally, the autogenous and nondiapausing form of Cx. pipiens known as Cx. pipiens form molestus is rare in the United States and known from a small number of populations: New York City, NY (Kent et al. 2007, Huang et al. 2008); Boston, MA (Spielman 1957); San Mateo and Sacramento Counties, CA (McAbee et al. 2004, Cornel et al. 2012, Kothera et al. 2013, Nelms et al. 2013); and Chicago, IL (Wray 1946, Mutebi and Savage 2009). Relevant distinctions between the two taxonomic forms include habitat preference (f. pipiens is found above-ground, whereas f. molestus in the United States utilizes below-ground habitats) and mating behavior (f. molestus is stenogamous so can mate in confined spaces, whereas f. pipiens is thought to require more space for mating, i.e., is eurogamous).
Two studies conducted while WNV was first spreading across the United States in the early 2000s suggested Cx. pipiens complex mosquitoes served as “bridge vectors,” biting both birds and humans and thus increasing the risk of transmission of WNV (Apperson et al. 2004, Kilpatrick et al. 2005). Given that the Chicago area is an area of consistently high WNV activity, several researchers have used host bloodmeal analysis to investigate whether Cx. pipiens complex taxa and hybrids show a preference for biting humans. Hamer et al. (2008a) examined bloodmeals collected in and around Chicago in 2005, and found a high proportion (16%) of human bloodmeals. They suggested that Cx. pipiens fit the description of a bridge vector. Hamer et al. (2009) followed up that study by looking at a larger set of blood-fed females, collected from 2005 to 2007 but found no shift from bird to mammal hosts during an increase in human WNV disease cases, which would have been supportive of the bridge vector hypothesis. Instead, they found that American Robins (Turdus migratorius), Blue Jays (Cyanocitta cristata L.), and House Finches (Carpodacus mexicanus Müller) consistently accounted for a majority of the WNV positive bloodmeals. Huang et al. (2009) conducted a microsatellite analysis on a subset of mosquitoes collected during the Hamer studies, and compared those results to one population each of Cx. quinquefasciatus (from Harris County, TX) and Cx. pipiens f. molestus (from New York City). They found a low rate of hybridization between f. molestus and f. pipiens, but found a comparatively higher proportion of f. molestus ancestry in mosquitoes that had taken a mammalian bloodmeal. Around this time, but after the above two studies were published, a f. molestus population was discovered in Chicago at the Calumet Water Treatment plant in Cook County, IL (Mutebi and Savage 2009). Population genetic comparisons indicated that the Calumet population had a subset of the microsatellite alleles found in above-ground Cx. pipiens populations in the Chicago area, and suggested that the rate of hybridization between the forms was low (Kothera et al. 2010). The Calumet population exists in colony at the CDC, Division of Vector-Borne Diseases in Fort Collins, CO, but the natural population was eliminated after its discovery and to the best of our knowledge has not recovered. Around the same time, a f. pipiens colony from Chicago was also established at CDC Fort Collins.
The confirmed presence of f. molestus in Chicago raises the question of whether hybridization between the two taxonomic forms has an effect on host selection. To answer this question, we collected blood-fed female mosquitoes in July and August 2012 from nine locations in the Chicago area, analyzed their bloodmeals to identify the vertebrates on which they fed, compared bloodmeal identifications to abundance data obtained from bird point counts, and conducted a microsatellite analysis to estimate the degree of hybridization between f. pipiens and f. molestus in the Chicago area.
Materials and Methods
Mosquito Collection
During July and August 2012, in communities around the Chicago area, eight residential sites and one site located in a public park were visited to collect resting engorged mosquitoes (Fig. 1; Table 1). Despite having “Park” in the names, collection sites were located in typical residential areas in Chicago. The aim was to collect engorged mosquitoes and the collections were conducted in the front and back yards of homes, with permission of the owners. Each location was visited twice, and resting mosquitoes were collected with large backpack aspirators (Nasci 1981). Engorged specimens were tubed individually, packed into boxes on dry ice, and shipped the same day to the CDC laboratory in Fort Collins. Using chill tables, dissecting microscopes, and dichotomous keys (Darsie and Ward 2005), specimens were identified to species or lowest taxonomic unit. Culex specimens were identified morphologically as belonging to the Cx. pipiens complex or Cx. restuans Theobald. Additionally, some specimens were identified as Cx. spp. if morphological identification was difficult due to the condition of the specimen but were still used in the study. Mosquitoes were dissected on the chill table such that the blood-fed abdomen was separated from the rest of the body and the two were tubed separately for bloodmeal and microsatellite analyses, respectively.
Fig. 1.
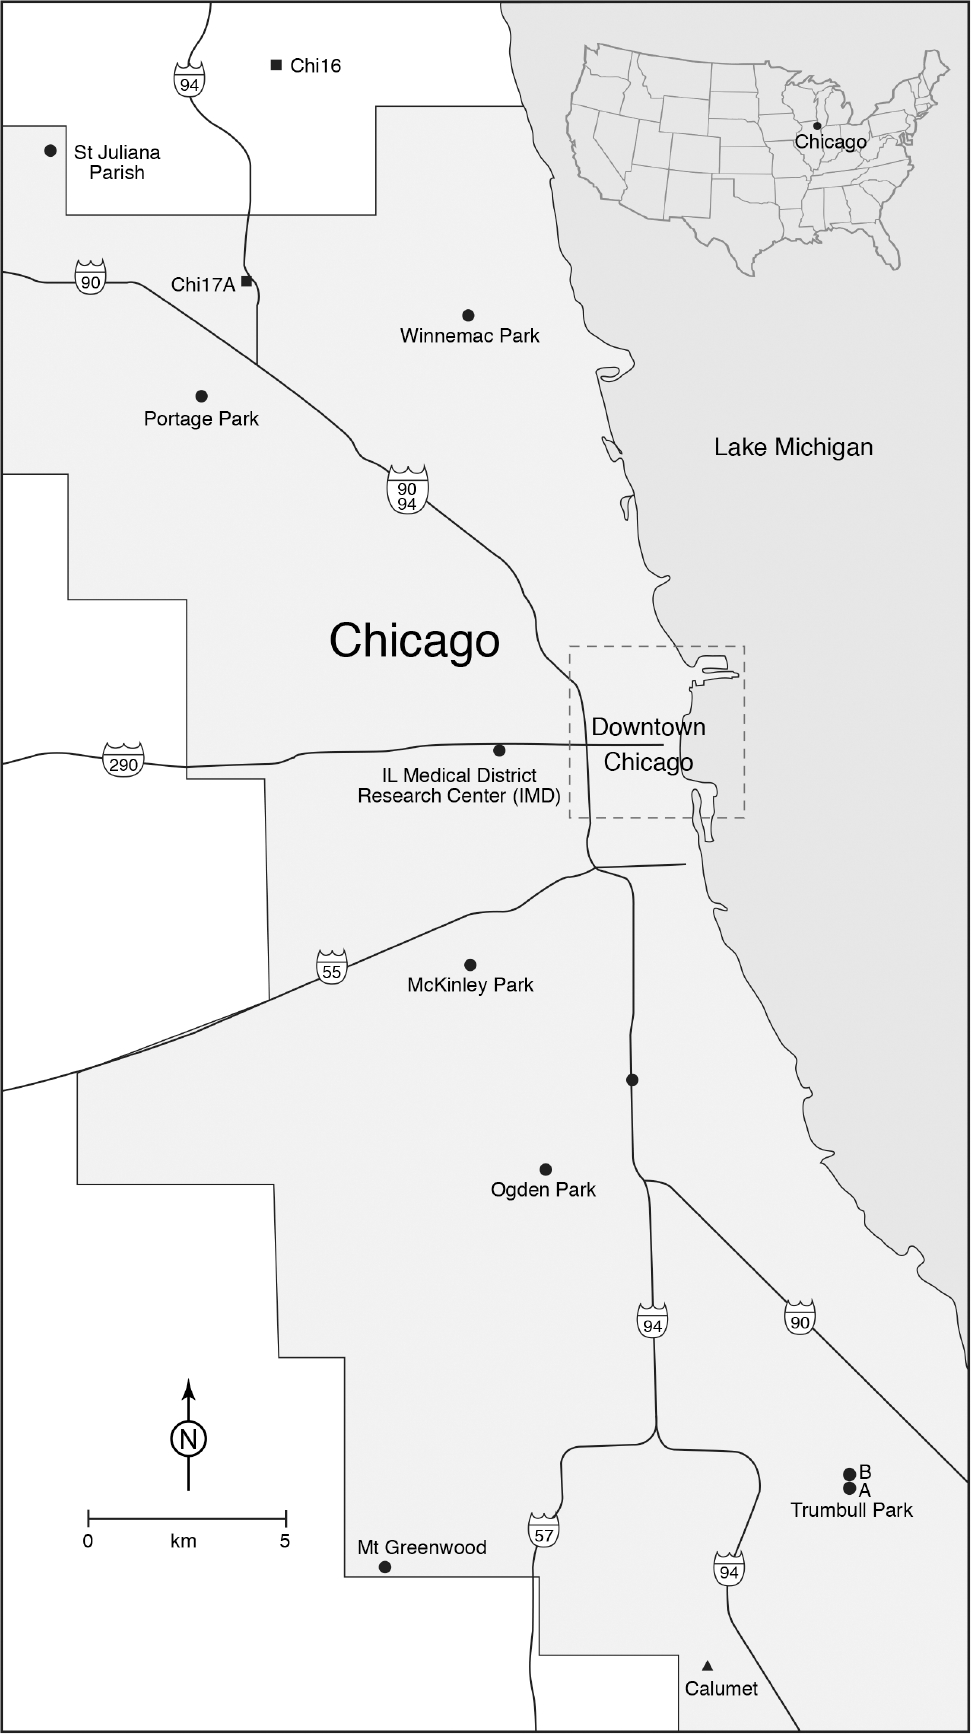
Map of study area showing the nine sites sampled for this study, as well as the locations of three populations sampled previously (for which there are no bloodmeal data; Chi16, Chi17A, Calumet; see Methods for details).
Table 1.
Site names and locations, taxa, and number of specimens per site
| Site Name | State | Latitude | Longitude | Species | N |
|---|---|---|---|---|---|
|
| |||||
| Portage Park | IL | 41.9569 | −87.7646 | Cx. pipiens f. pipiens | 136 |
| Winnemac Park | IL | 41.9742 | −87.6822 | Cx. pipiens f. pipiens | 131 |
| Mt. Greenwood | IL | 41.6865 | −87.7080 | Cx. pipiens f. pipiens | 104 |
| McKinley Park | IL | 41.8251 | −87.6803 | Cx. pipiens f. pipiens | 122 |
| Trumbull Park A | IL | 41.7049 | −87.5644 | Cx. pipiens f. pipiens | 56 |
| Trumbull Park Ba | IL | 41.7077 | −87.5651 | Cx. pipiens f. pipiens | 275 |
| St. Juliana Parish | IL | 42.0123 | −87.8120 | Cx. pipiens f. pipiens | 36 |
| Ogden Park | IL | 41.7778 | −87.6581 | Cx. pipiens f. pipiens | 22 |
| IMDb | IL | 41.8749 | −87.6724 | Cx. pipiens f. pipiens | 20 |
| Chi16c | IL | 42.0317 | −87.7414 | Cx. pipiens f. pipiens | 34 |
| Chi17Ac | IL | 41.9825 | −87.7506 | Cx. pipiens f. pipiens | 31 |
| Calumetc | IL | 41.6633 | −78.6083 | Cx. pipiens f. molestus | 65 |
| New Orleansc | LA | 29.9090 | −90.0230 | Cx. quinquefasciatus | 34 |
| Roselandc | LA | 30.9430 | −90.0660 | Cx. quinquefasciatus | 29 |
Trumbull B was the one collection site located in a park, and the other sites were in residential areas.
Illinois Medical District Research Center.
Specimens for these sites were initially collected for other studies (see text).
Bloodmeal Analysis
Host DNA was extracted utilizing the QIamp DNA Investigator kit (Qiagen, Valencia, CA) as described in the manufacturer’s protocol, and eluted in 80 μl EB buffer (Qiagen) on a Qiagen BioRobot Universal System (Qiagen). PCR to amplify a 700bp fragment of the host COI gene was performed as described previously (Ivanova et al. 2007, Kent et al. 2009, Crabtree et al. 2013). Briefly, the assay utilized a 1:1:2 volume ratio of forward primers VF1_t1, FV1d_t1, VFli_t1, and reverse primers VR1d_t1, VR1_t1, and VRli_t1, respectively. These primers contained M13 tails for subsequent sequencing with M13F (−12) and M13R (−27) as previously described by Messing (1983). The following PCR protocol was utilized: 95° for 5 min, 5 cycles of (95° for 30 s, 52° for 40 s, and 72° for 1 min) followed by 35 cycles of (95° for 30 s, 54° for 40 s, and 72° for 1 min) and a final extension of 72° for 10 min prior to a hold at 4°. PCR products were visualized using gel electrophoresis and those showing amplification were purified using the Qiaquick PCR purification kit (Qiagen) prior to sequencing. Sequencing was performed on an ABI 3130 automated sequencer utilizing reagents from the BigDye 3.1 kit (Applied Biosystems, Foster City, CA). Sequences were aligned and edited using Geneious 8.1 (Biomatters Ltd., Auckland, New Zealand). Bloodmeal hosts were identified with GenBank using the BLAST program and confirmed using the Barcode of Life Data Systems (Ratnasingham and Hebert 2007). Species identifications were organized by population and the total of each host species was tallied.
Host Selection
We conducted 5-min unlimited distance avian point counts at the nine study sites (Bibby et al. 2000). All birds seen or heard between sunrise and 10:00 a.m. were recorded. Each site was visited three times between July and August 2012. We estimated the abundance of species by determining the number of individuals of a given species per point count location. An estimate of host utilization, a foraging ratio known as the Manly resource selection design II index (Manly et al. 2002, Hamer et al. 2009), was estimated for each bird species observed in the point counts or through bloodmeal analysis and is defined as
The index, compared bird species observed visually to those identified in bloodmeal analysis to determine whether species were over- or under-utilized as hosts by mosquitoes. Index values greater than one suggest that the species is over-utilized. The variance of was estimated using the delta method (Bickel and Doksum 2001), and the square root of the variance is reported in Tables 2 and 3 as the standard error. Some bird species were represented in the point counts but not the bloodmeals, and the reverse also occurred. Adjustments were made to the index in the manner of Hamer et al. (2009), where bird species that were identified during the point counts but not present in blood meals were given a count value of one. Likewise, bird species not observed during the point counts but present as blood meal hosts were also given a count value of one.
Table 2.
Estimates of host selection () with standard error (se. ) for Culex pipiens complex mosquitoes
| Bird Species | No. in point counts | No. (%) ID’d in bloodmeals | se. | |
|---|---|---|---|---|
|
| ||||
| House Finch (Carpodacus mexicanus) | 1a | 62 (7.4) | 35.772 | 35.997 |
| Cedar Waxwing (Bombycilla cedrorum) | 1 | 39 (4.6) | 22.502 | 22.749 |
| Cooper’s Hawk (Accipiter cooperii) | 1a | 8 (1.0) | 4.616 | 4.888 |
| Northern Cardinal (Cardinalis cardinalis) | 3 | 20 (2.4) | 3.846 | 2.371 |
| American Robin (Turdus migratorius) | 59 | 348 (41.5) | 3.403 | 0.434 |
| Chicken (Gallus gallus) | 1a | 5 (0.6) | 2.885 | 3.156 |
| American Kestrel (Falco sparverius) | 1a | 2 (0.2) | 1.154 | 1.412 |
| Baltimore Oriole (Icterus galbula) | 1a | 2 (0.2) | 1.154 | 1.412 |
| Mourning Dove (Zenaida macroura) | 19 | 30 (3.6) | 0.911 | 0.262 |
| House Sparrow (Passer domesticus) | 141 | 221(26.3) | 0.902 | 0.081 |
| Northern Flicker (Colaptes auratus) | 1 | 1b | 0.577 | 0.815 |
| Eastern Wood-pewee (Contopus virens) | 1 | 1b | 0.577 | 0.815 |
| Blue Jay (Cyanocitta cristata) | 1 | 1b | 0.577 | 0.815 |
| Yellow-rumped Warbler (Dendroica coronata) | 1 | 1b | 0.577 | 0.815 |
| Yellow Warbler (Dendroica petechia) | 1 | 1b | 0.577 | 0.815 |
| Gray Catbird (Dumetella carolinensis) | 1 | 1b | 0.577 | 0.815 |
| Acadian Flycatcher (Empidonax virescens) | 1 | 1b | 0.577 | 0.815 |
| Black-and-White Warbler (Mniotilta varia) | 1 | 1b | 0.577 | 0.815 |
| Great Crested Flycatcher (Myiarchus crinitus) | 1 | 1b | 0.577 | 0.815 |
| Prothonotary Warbler (Protonotaria citrea) | 1 | 1b | 0.577 | 0.815 |
| White-breasted Nuthatch (Sitta carolinensis) | 1 | 1b | 0.577 | 0.815 |
| Warbling Vireo (Vireo gilvus) | 1 | 1b | 0.577 | 0.815 |
| Canada Warbler (Wilsonia canadensis) | 1 | 1b | 0.577 | 0.815 |
| Common Redpoll (Carduelis flammea) | 1a | 1 (0.1) | 0.577 | 0.815 |
| Cliff Swallow (Petrochelidon pyrrhonota) | 1a | 1 (0.1) | 0.577 | 0.815 |
| Red-bellied Woodpecker (Melanerpes carolinus) | 2 | 1b | 0.288 | 0.353 |
| Monk Parakeet (Mysiopsitta monachus) | 2 | 1b | 0.288 | 0.353 |
| Downy Woodpecker (Picoides pubescens) | 2 | 1b | 0.288 | 0.353 |
| Common Grackle (Quiscalus quiscula) | 2 | 1b | 0.288 | 0.353 |
| Red-eyed Vireo (Vireo olivaceus) | 2 | 1 (0.1) | 0.288 | 0.353 |
| Swainson’s Thrush (Catharus ustulatus) | 3 | 1b | 0.192 | 0.222 |
| Ring-billed Gull (Larus delawarensis) | 6 | 1b | 0.096 | 0.104 |
| American Redstart (Setophaga ruticilla) | 7 | 1b | 0.082 | 0.088 |
| Black-capped Chickadee (Poecile atricapillus) | 11 | 1b | 0.052 | 0.055 |
| American Crow (Corvus brachyrhynchos) | 12 | 1b | 0.048 | 0.050 |
| Chimney Swift (Chaetura pelagica) | 14 | 1b | 0.041 | 0.043 |
| European Starling (Sturnus vulgaris) | 50 | 3 (0.4) | 0.035 | 0.020 |
| Canada Goose (Branta canadensis) | 17 | 1b | 0.034 | 0.035 |
| American Goldfinch (Spinus tristis) | 28 | 1 (0.1) | 0.021 | 0.021 |
| Rock Pigeon (Columba livia) | 41 | 1 (0.1) | 0.014 | 0.014 |
Bird species listed were observed visually, via bloodmeal, or both.
Bird species not observed in point counts but present in mosquito blood meals.
Bird species observed in point counts but not present in mosquito blood meals.
Table 3.
Estimates of host utilization () with standard error (se. ) for Culex restuans mosquitoes
| Bird Species | No. in point counts | No. (%) ID’d in bloodmeals | se. | |
|---|---|---|---|---|
|
| ||||
| Cedar Waxwing (Bombycilla cedrorum) | 1 | 3 (4.2) | 13.290 | 15.275 |
| Cooper’s Hawk (Accipiter cooperii) | 1a | 3 (4.2) | 13.290 | 15.275 |
| House Finch (Carpodacus mexicanus) | 1a | 2 (2.8) | 8.860 | 10.807 |
| Northern Cardinal (Cardinalis cardinalis) | 3 | 5 (6.9) | 7.383 | 5.330 |
| Acadian Flycatcher (Empidonax virescens) | 1 | 1b | 4.430 | 6.246 |
| Cliff Swallow (Petrochelidon pyrrhonota) | 1a | 1 (1.4) | 4.430 | 6.246 |
| American Kestrel (Falco sparverius) | 1a | 1 (1.4) | 4.430 | 6.246 |
| Baltimore Oriole (Icterus galbula) | 1a | 1 (1.4) | 4.430 | 6.246 |
| Black-and-White Warbler (Mniotilta varia) | 1 | 1b | 4.430 | 6.246 |
| Blue Jay (Cyanocitta cristata) | 1 | 1b | 4.430 | 6.246 |
| Canada Warbler (Wilsonia canadensis) | 1 | 1b | 4.430 | 6.246 |
| Chicken (Gallus gallus) | 1a | 1 (1.4) | 4.430 | 6.246 |
| Common Redpoll (Carduelis flammea) | 1a | 1 (1.4) | 4.430 | 6.246 |
| Eastern Wood-pewee (Contopus virens) | 1 | 1b | 4.430 | 6.246 |
| Gray Catbird (Dumetella carolinensis) | 1 | 1b | 4.430 | 6.246 |
| Great Crested Flycatcher (Myiarchus crinitus) | 1 | 1b | 4.430 | 6.246 |
| Northern Flicker (Colaptes auratus) | 1 | 1b | 4.430 | 6.246 |
| Prothonary Warbler (Protonotaria citrea) | 1 | 1b | 4.430 | 6.246 |
| Warbling Vireo (Vireo gilvus) | 1 | 1b | 4.430 | 6.246 |
| White-breasted Nuthatch (Sitta carolinensis) | 1 | 1b | 4.430 | 6.246 |
| Yellow Warbler (Dendroica petechia) | 1 | 1b | 4.430 | 6.246 |
| Yellow-rumped Warbler (Dendroica coronata) | 1 | 1b | 4.430 | 6.246 |
| Common Grackle (Quiscalus quiscula) | 2 | 1b | 2.215 | 2.702 |
| Downy Woodpecker (Picoides pubescens) | 2 | 1b | 2.215 | 2.702 |
| Monk Parakeet (Mysiopsitta monachus) | 2 | 1b | 2.215 | 2.702 |
| Red-bellied Woodpecker (Melanerpes carolinus) | 2 | 1b | 2.215 | 2.702 |
| Red-eyed Vireo (Vireo olivaceus) | 2 | 1 (1.4) | 2.215 | 2.702 |
| American Robin (Turdus migratorius) | 59 | 24 (33.3) | 1.802 | 0.388 |
| Swainson’s Thrush (Catharus ustulatus) | 3 | 1b | 1.477 | 1.697 |
| House Sparrow (Passer domesticus) | 141 | 28 (38.9) | 0.874 | 0.153 |
| Ring-billed Gull (Larus delawarensis) | 6 | 1b | 0.738 | 0.793 |
| American Redstart (Setophaga ruticilla) | 7 | 1b | 0.633 | 0.673 |
| Mourning Dove (Zenaida macroura) | 19 | 2 (2.8) | 0.466 | 0.343 |
| Black-capped Chickadee (Poecile atricapillus) | 11 | 1b | 0.403 | 0.418 |
| American Crow (Corvus brachyrhynchos) | 12 | 1b | 0.369 | 0.382 |
| Chimney Swift (Chaetura pelagica) | 14 | 1b | 0.316 | 0.326 |
| Canada Goose (Branta candansis) | 17 | 1b | 0.261 | 0.267 |
| American Goldfinch (Carduelis tristis) | 28 | 1 (1.4) | 0.158 | 0.160 |
| Rock Pigeon (Columba livia) | 41 | 1 (1.4) | 0.108 | 0.109 |
| European Starling (Sturnus vulgaris) | 50 | 1 (1.4) | 0.089 | 0.089 |
Bird species listed were observed visually, via bloodmeal, or both.
Bird species not observed in point counts but present in mosquito blood meals.
Bird species observed in point counts but not present in mosquito blood meals.
Microsatellite Analysis
The heads and thoraces of individual mosquitoes were processed for DNA extraction as per Savage et al. (2007), except they were homogenized in 400 μl of BA-1 buffer. An aliquot of 220 μl was used for DNA extraction using a Qiagen Biorobot. Genomic DNA was eluted with 100 μl of AVE buffer and specimens were assayed with a panel of 15 microsatellite markers as per Kothera et al. (2012). Briefly, the markers were divided into two multiplexed PCR reactions (Supplementary Table 1; Edillo et al. 2007, Keyghobadi et al. 2004, Molecular Ecology Resources Primer Development Consortium et al. 2012) with the following PCR program: 95° for 15 min, and 35 cycles of (94° for 45 s, 54° for 45 s, and 72° for 45 s) followed by 72° for 10 min. The forward primer of each primer pair was fluorescently labeled for visualization on a Beckman-Coulter CEQ8000 sequencer (Fullerton, CA). Allele sizes were called using the instrument’s Fragment Analysis software. Individual multilocus genotypes were exported to an Excel spreadsheet, organized by population, and the program Convert (Glaubitz 2004) was used to format the data for use in the programs Structure (Pritchard et al. 2000) and Arlequin (Excoffier et al. 2007).
Genetic Data Analysis
We included data in the microsatellite analysis from known populations of Cx. quinquefasciatus from Louisiana (Kothera et al. 2009) and Cx. pipiens f. molestus from Chicago (Kothera et al. 2010) to ensure the analyses included nonhybrid examples of the taxa that may have been present. To determine whether genetic diversity and differentiation had changed since a previous microsatellite analysis of Chicago populations, data from two f. pipiens populations were also included (Kothera et al. 2009). The program Arlequin was used to obtain an estimate of genetic diversity within populations (Expected Heterozygosity, HE), as well as to calculate an AMOVA (Analysis of Molecular Variance) and perform pairwise FST tests between populations. The statistical significance of FST tests was determined with permutation tests. Groups for the AMOVA were defined as the three taxa (f. pipiens, f. molestus, and Cx. quinquefasciatus) and the analysis partitioned the genetic diversity of the microsatellite data into three levels: 1) within populations as defined in Table 1, 2) among populations within each taxa, and 3) among the three taxa. We also used Arlequin to examine each locus in each population for adherence to Hardy–Weinberg Equilibrium (HWE) and for evidence of linkage disequilibrium (LD), both of which can be statistically significant if population admixture or hybridization has occurred.
Structure was used in two ways. First, we used the program to determine K, the most likely number of clusters, or genetic groups, in the data. This was done by running 10 simulations per K (ranging from 1 to 10) using the default settings, a burn-in of 50,000 iterations and 1,000,000 data collecting steps. The K value associated with the highest posterior probability is the most likely number of genetic clusters (Pritchard et al. 2000). Second, we examined the membership coefficients (i.e., the q values) to determine the extent of hybridization between f. molestus and f. pipiens. Membership coefficients are assigned to each individual, sum to one and are divided across K number of clusters for each individual. For example, a genetically pure individual will have a q value at or close to 1 in a single cluster, whereas a hybrid’s q values are divided across two or more clusters. We used a cutoff of q ≤ 0.90 to identify hybrids between f. pipiens and f. molestus. That is, if an individual had at least 10% ancestry assigned to two or more taxa, it was identified as a hybrid (Vähä and Primmer 2006).
Results
Bloodmeal Identification
The number of blood-fed mosquitoes collected and number of host species per site were variable across sites (Table 1; Supplementary Table 2). All specimens were assayed to determine bloodmeal host identification. Of the N = 1023 specimens collected, 840 blood-fed mosquito abdomens (81.2%) were successfully identified to 18 host species (Table 4). Seventy-two of the 102 specimens with bloodmeal identifications but no microsatellite amplification were likely Culex restuans (see Microsatellite Results). Almost all bloodmeals (N = 834) came from bird species, but one Eastern Gray Squirrel (Sciurus carolinensis), one domestic pig (Sus scrofa) and four human bloodmeals were identified, two of which came from non-Culex spp. mosquitoes. In total, 82% of bloodmeals were from three species of birds: American Robins (Turdus migratorius; n = 388, 46.2%), House Sparrows (Passer domesticus; n = 247, 29.4%) and House Finches (Carpodaucus mexicanus; n = 65, 7.7%). The proportion relative to the total number of bloodmeals from the three above-mentioned bird species was not significantly different between Culex pipiens f. pipiens and Cx. restuans (P = 0.08).
Table 4.
Bloodmeal hosts and identified mosquito species
| Mosquito species | Bloodmeal Hosts |
No amplification for bloodmeal ID PCR | Totals | |||||
|---|---|---|---|---|---|---|---|---|
| Human | Other mammal | American Robin (Turdus migratorius) | House Sparrow (Passer domesticus) | House Finch (Carpodacus mexicanus) | Birds of Other Species | |||
|
| ||||||||
| Aedes triseriatus (Say) | 1 | 1 | 2 | |||||
| Aedes vexans (Meigen) | 1 | 1 | ||||||
| Anopheles quadrimaculatus (Say) | 1 | 1 | ||||||
| Culex pipiens a | 2 | 1 | 324 | 196 | 54 | 109 | 154 | 840 |
| Culex pipiens form pipiens x form molestus hybridsa | 4 | 9 | 3 | 4 | 1 | 21 | ||
| Culex pipiens x Culex quinquefasciatus hybridsa | 13 | 4 | 1 | 3 | 5 | 26 | ||
| Culex quinquefasciatus a | 8 | 1 | 0 | 2 | 2 | 13 | ||
| Culex restuans a | 24 | 28 | 2 | 12 | 6 | 72 | ||
| No microsatellite amplification – morphological ID only as “pipiens/restuans” | 15 | 9 | 5 | 4 | 14 | 47 | ||
| 1023 | ||||||||
Identification made from microsatellite markers.
Most (N = 217/388) of the American Robin bloodmeals were collected from the Trumbull B site, which was the only collection site located in a public park. The next most numerous species in the bloodmeal data were Cedar Waxwings (Bobycilla cedrorum; N = 45, 5.4%), Mourning Doves (Zenaida macroura; N = 33, 3.9%), and Northern Cardinals (Cardinalis cardinalis; N = 24, 3.0%). The remaining species were represented by 11 or fewer bloodmeals (i.e., ≤ 2% of the total). Two human bloodmeals were observed from Cx. pipiens f. pipiens mosquitoes, both collected from the McKinley Park site.
Bird Abundance and Host Selection
In terms of absolute numbers, more House Sparrows were observed in the point counts than any other species, followed by American Robins and European Starlings (Sturnus vulgaris L.; Table 2, column 2). With regard to Culex pipiens complex, host selection indices for Northern Cardinals [Cardinalis cardinalis; (standard error = 2.4)], and American Robins [Turdus migratorius; ], were greater than one and associated with relatively small standard errors. Species that appeared over-utilized but whose selection indices reflected large standard errors included House Finch [Carpodacus mexicanus Müller; ], and Cedar Waxwing [Bombycilla cedrorum Vieillot; ]. Conversely, several species were under-utilized, where their abundance in the bird point counts was not reflected in the proportion of bloodmeals taken, including Rock Pigeon (Columba livia Gmelin), American Goldfinch (Spinus tristis L.), and Canada Goose (Branta Canadensis L.; index range 0.01–0.03). The remaining 28 species had index values ranging from 0.5 to 3.8. Host selection values for Culex restuans show less congruence between numbers of mosquitoes collected and numbers of bird species counted, likely reflecting the comparatively fewer specimens collected of that species compared to Cx. pipiens complex (Table 3).
Microsatellite Identification
All specimens collected were assayed with the panel of microsatellites. In total, 738 specimens had both a bloodmeal identification and microsatellite amplification, although the total bloodmeal identifications (N = 840) and total microsatellite amplifications (N = 900) were each used for those analyses (Table 5). With regard to identifying Cx. restuans with our panel of microsatellites, we observed previously that the loci CxqGT4 and CxpGT51 (Supplementary Table 1) generate diagnostic allele sizes for Cx. restuans of 158 and 80, respectively, whereas the remaining markers fail to amplify (L.K., unpublished data). Thus, the panel could be used for identification of Cx. restuans, but not for population genetics analyses.
Table 5.
Amplification details for the 1023 specimens in this study
| Bloodmeal | Bloodmeal | |
|---|---|---|
| Identificationa Yes | Identification No | |
|
| ||
| Microsatellite Amplificationb Yes | 738 | 162 |
| Yes Microsatellite Amplification No | 102 | 21 |
Host blood meals were identified using the COI gene
Mosquito species identifications and degree of intraspecific hybridization were assessed with a panel of 15 microsatellites.
Genetic diversity as measured by HE was similar across the nine Chicago sites sampled for this study and averaged 0.62 (range 0.60–0.65). These values are similar to the data from Chicago sampled several years prior (average = 0.66, Kothera et al. 2009). Deviations from HWE defined by statistically significant differences (P ≤ 0.05) between Observed and Expected Heterozygosity (HO and HE) after Bonferroni correction were found in some loci in most populations (Supplementary Table 3). Two sites, Trumbull A and Trumbull B, had the most instances of deviations from HWE, 10 and 7, respectively, whereas the remaining sites had five or fewer instances. No instances of LD between loci were significant after Bonferroni correction. Pairwise FST test values were low overall and generally not statistically significant (Table 6). Exceptions were comparisons involving the Trumbull A and Trumbull B sites, where low but significant FST values were observed. The AMOVA results indicated almost all of the genetic diversity resides within populations (82.1% of diversity) and among groups (17.7%), with the remaining 1% attributed to the populations within groups (Table 7).
Table 6.
Pairwise FST values between nine sampling sites in Chicago
| Portage Park | Winnemac Park | Mt. Greenwood | McKinley Park | Trumbull Park A | Trumbull Park B | St. Juliana Parish | Ogden Park | |
|---|---|---|---|---|---|---|---|---|
|
| ||||||||
| Winnemac Park | 0.000 | |||||||
| Mt. Greenwood | 0.001 | 0.002 | ||||||
| McKinley Park | 0.000 | 0.001 | 0.001 | |||||
| Trumbull Park A | 0.006a | 0.005 | 0.004 | 0.003 | ||||
| Trumbull Park B | 0.003 | 0.003 | 0.004 | 0.003 | 0.001 | |||
| St. Juliana Parish | 0.003 | 0.002 | 0.005 | 0.001 | 0.005 | 0.003 | ||
| Ogden Park | −0.001 | −0.001 | 0.001 | 0.000 | 0.002 | 0.002 | −0.001 | |
| IMDb | 0.001 | 0.002 | −0.003 | 0.003 | 0.000 | 0.001 | 0.003 | 0.000 |
Bold values indicate statistically significant genetic differentiation (P ≤ 0.05).
Illinois Medical District Research Center
Table 7.
Table of AMOVA results
| Source of Variation | d.f. | Sum of Squares | Variance Components | Percentage of Variation |
|---|---|---|---|---|
|
| ||||
| Among groupsa | 3 | 656.49 | 0.941 | 17.59 |
| Among populations within groups | 10 | 56.46 | 0.008 | 0.14 |
| Within populations | 2176 | 9574.19 | 4.400 | 82.26 |
| Total | 2189 | 10287.13 | 5.348 | |
All populations listed in Table 1 were included in this analysis.
For definitions of groups, see text.
The highest posterior probability in the Structure analysis was associated with K = 3 genetic groups when the Calumet Cx. Pipiens f. molestus population and the two Cx. quinquefasciatus populations were included in the analysis, and there was one genetic group per taxa (Fig. 2). Figure 2 and an examination of the coefficient of membership (q) values indicated that there was a modest number of hybrids between f. pipiens and f. molestus (N = 21, Supplementary Table 3). Most (N = 16) occurred at three sites: Mt. Greenwood (N = 6), Winnemac Park (N = 4), and McKinley Park (N = 4), with zero, one, or two hybrids at the remaining sites. The two Cx. pipiens complex mosquitoes that took human bloodmeals at the McKinley Park site were f. pipiens by our definition of hybrids, since both had < 10% f. molestus ancestry (molestus genetic cluster q values = 0.031 and 0.089). The highest proportion of f. molestus ancestry was 30%, found in one individual each from the Winnemac Park and Mt. Greenwood sites. The bloodmeal ID associated with both of those individuals were House Sparrows.
Fig. 2.
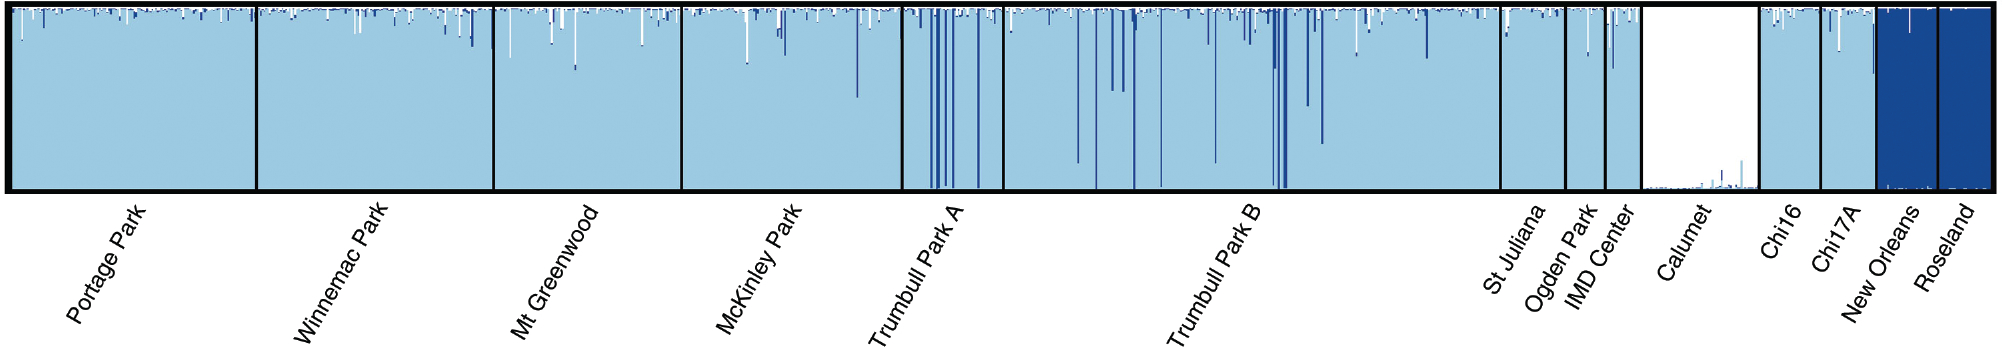
Structure diagram for the nine sites sampled in this study (nine sites starting from the left side), as well as five sites sampled previously. Each individual is represented by a thin vertical line, and the diagram shows three genetic groups in this system: light shading = Cx. pipiens f. pipiens, white = Cx. Pipiens f. molestus, and dark shading = Cx. quinquefasciatus.
Hybrids between Cx. pipiens f. pipiens and Cx. quinquefasciatus were also observed (N = 26). Most (N = 17) occurred at the Trumbull B site (Supplementary Table 3). Moreover, 13 pure Cx. quinquefasciatus individuals (q ≥ 0.90) were detected at the Trumbull A (N = 7) and Trumbull B (N = 6) sites. These individuals showed more genetic similarity to the Louisiana populations than to any mosquitoes collected from Chicago. The percent Cx. quinquefasciatus ancestry in f. pipiens – Cx. quinquefasciatus hybrids ranged from 0.10 to 0.85.
Discussion
Bloodmeal Analysis
In the current study, over 99% (735/738) of bloodmeals identified from Cx. pipiens complex mosquitoes (as identified by microsatellite analysis) collected in the Chicago area in July and August 2012 were taken from birds, and < 1% was taken from mammals (two humans, and one squirrel). Two studies of similar design with specimens collected from the Chicago area from 2005 to 2007 by Hamer et al. (2008, 2009) had a much different ratio of the two groups: 80% birds and 16% mammals (including humans). Notably, Hamer et al. (2009) found that 83% of mammal bloodmeals taken by Cx. pipiens complex mosquitoes (N = 100) came from humans. This finding led the authors to suggest Cx. pipiens complex mosquitoes could be exhibiting a preference for biting humans, although a shift toward mammals and away from birds when the number of human WNV cases increased in late summer was not observed. We offer several possible reasons for the apparent discrepancy in the proportion of mammal blood meals between this study and previous work. First, the sampling period may have had an effect on species composition. In our study, samples were collected in July and August, whereas Hamer et al. (2009) made collections from May to October. Second, the collection methods were somewhat different between the studies. We utilized backpack aspirators only, and the Hamer et al. (2009) study collected specimens from CDC light traps, gravid traps, and backpack aspirators. Also, in our bloodmeal analysis, we used one primer cocktail that targeted all classes of host vertebrates to amplify the COI gene while Hamer et al. (2009) aimed to do the same thing with successive PCR reactions using separate primer pairs that targeted particular classes of vertebrates. Finally, it is possible that the choice of sampling sites had an effect on the proportion of blood-fed mosquitoes collected in each study, despite an emphasis by both research groups to sample from human-occupied areas. Several of the above stated differences are not mutually exclusive and we suggest that the collection methods and site selection could be the biggest drivers of differences in results between the two studies.
There was generally congruence between the bird species represented in our point counts and those present in the bloodmeal data. However, in several instances species that had good representation in the bloodmeal analysis were not observed in the point counts and variance in the data resulted in large standard errors, which we acknowledge reduces our ability to draw firm conclusions about host selection. The discrepancy could be due to differences in detectability among bird species during attempts to count them, and it is possible that the effort to conduct the surveys was insufficient to fully characterize potential hosts. For example, House Finches and Cedar Waxwings exist as large, mobile flocks during the time of the year when this study took place, and their numbers could have been sparse while point counts were taken yet abundant in terms of being blood meal hosts. Nevertheless, several bird species appeared to be over-utilized relative to their observed abundance and had sufficient bloodmeal data as well. Bird species in this group included American Robins, Northern Cardinals, House Sparrows, and House Finches, which have been cited by other studies as preferred host species in—Connecticut (Molaei et al. 2006, Simpson et al. 2009), Tennessee (Savage et al. 2007), California (Montgomery et al. 2011), and Ohio (Garvin et al. 2018). The same studies reported that some abundant bird species, such as American Crows (Corvus brachyrhynchos), are routinely overlooked as bloodmeal hosts by Culex mosquitoes, and our results support those assertions.
One way to examine whether the different taxa in the Cx. pipiens complex exhibit a preference for birds or humans is to conduct choice experiments such as was done by Fritz et al. (2015) who used specimens from the CDC f. pipiens and f. molestus colonies from Chicago to conduct host choice tests. As noted above, these colonies were established a few years before the present study was conducted, and thus likely are an accurate representation of biotypes present in Chicago. They found that both f. molestus and f. pipiens readily fed on birds or humans when only one host was available. When given the choice between a chicken and human, however, f. molestus females preferred the human and f. pipiens females preferred the chicken. Backcrossed offspring of controlled crosses showed intermediate levels of preference. These results, along with the current study and Hamer et al.’s work, suggest that Cx. pipiens complex individuals are opportunistic when they host seek, but may have genetically influenced preferences if given a choice of hosts.
Microsatellite Analysis
Genetic Diversity
The Structure analysis to find the most likely number of genetic groupings indicated that K = 3, which would be expected because we included known populations of f. molestus and Cx. quinquefasciatus. The determination of K = 3 underscores the assertion that f. molestus and f. pipiens are distinct genetic entities in Chicago, and it appears that f. molestus ancestry in the sampled populations is low to non-existent. Genetic diversity as measured by HE among the Cx. pipiens f. pipiens populations sampled for this study was moderate. In addition, there appeared to be little change in genetic diversity over the 5-yr span of our collections. Moreover, most pairwise FST tests were not significant, which indicates that there are few barriers to gene flow among the nine sites. Thus, although specimens were collected from nine locations, they appear to act like one large population in terms of gene flow. This finding suggests that advantageous alleles, such as newly acquired insecticide resistance mutations, could spread easily across the Chicago area. The AMOVA results are consistent with the FST tests and indicated there was little genetic differentiation among populations within groups, in this case taxon groupings. It should be noted that Arlequin’s determination of the amount of differentiation between populations of a particular taxon (the second level of the AMOVA) is likely artificially low because there was only one f. molestus and two Cx. quinquefasciatus populations in the analysis. Nevertheless, the data suggest little differentiation among Cx. pipiens f. pipiens populations.
Hybridization
Although there are high levels of gene flow and little genetic differentiation among f. pipiens populations, there were significant departures from HWE in several loci and populations in this study (Supplementary Table 3). Two nonmutually exclusive phenomena could explain this finding. First, when genetically distinct entities cross, the allele frequencies in the resulting offspring may not conform to Hardy Weinberg expectations. This may have been the case, as hybrids between f. pipiens and the other two taxa were observed in the study. In particular, the Trumbull A and Trumbull B sites had the highest numbers of f. pipiens – Cx. quinquefasciatus hybrids, the most deviations from HWE, and were the locations where pure Cx. quinquefasciatus was collected. Second, although the nine sites were analyzed as though they were distinct populations, the lack of genetic differentiation across them suggests defining the sites as populations may not be biologically accurate and instead the functioning population encompasses some of or all of the nine sampled sites, an example of the Wahlund effect (Hartl and Clark 1997). There may also be a relationship between deviations from HWE and hybridization at the remaining sites.
It is difficult to determine whether the frequency of f. pipiens – f. molestus hybrids and f. pipiens – Cx. quinquefasciatus hybrids represent a stable collection of genotypes, or if the proportion of each taxa and hybrid type will change over time. The microsatellite data for the two Chicago populations collected in 2005 (Chi16, Chi17A) show a similar degree of f. pipiens – f. molestus introgression, but f. pipiens – Cx. quinquefasciatus hybrids were not detected in the 2005 data (Fig. 2). Hybrids as we defined them (i.e., q ≥ 0.10 in two groups) were detected at all of the collection sites, suggesting that hybridization is not confined to a particular site. In a previous microsatellite study of Culex pipiens complex samples from Chicago, Huang et al. (2009) used a Structure cutoff of q ≥ 0.05 to identify hybrids when they determined that mosquitoes that took bloodmeals from humans had a higher f. molestus ancestry than mosquitoes that fed on nonhuman hosts. Interestingly, several of their specimens with high degrees of molestus ancestry were collected close to the Calumet site (G Hamer, personal communication). Our estimate of the extent of f. pipiens – f. molestus hybrids therefore is comparatively conservative, but is in line with a study using simulated data for the program Structure that found a cutoff of q ≥ 0.10 most accurately separated hybrid from non-hybrid individuals (Vähä and Primmer 2006). Nevertheless, having both kinds of hybrids present in Chicago suggests the possibility of novel genotypes not otherwise possible, where alleles from the three taxa could be present in a single individual. Our analysis did not detect Cx. quinquefasciatus – f. molestus hybrids or three-way hybrids, but future studies utilizing genomics approaches could be applied to the problem and would be sensitive enough to detect such introgression.
Hybridization may have consequences for disease transmission by vector mosquitoes. This phenomenon has been investigated by a small number of studies involving the Culex pipiens complex in the United States (Ciota et al. 2013, Joyce et al. 2018) which found that hybrids of Cx. pipiens taxa transmitted virus at a higher rate relative to at least one of the parent strains. Thus, hybridization could affect the incidence of WNV transmission in Chicago and other areas where hybridization occurs.
It is not known whether additional populations of f. molestus exist in Chicago, but it is clear that f. molestus populations in the United States are rare. The Calumet f. molestus population, as well as a f. molestus population from New York City, possesses a subset of alleles found in nearby above-ground f. pipiens populations (Kothera et al. 2010), suggesting that f. molestus populations can be established by f. pipiens populations when favorable conditions exist.
The presence of a small number of pure Cx. quinquefasciatus at the Trumbull A and Trumbull B sites, along with the small number of identified f. pipiens – Cx. quinquefasciatus hybrids (3% of bloodfed specimens) suggests that Cx. quinquefasciatus is not well-established in Chicago. Instead, the data suggest that small numbers of Cx. quinquefasciatus are occasionally introduced to the area. If Cx. quinquefasciatus was becoming established in the area, the microsatellite data would show early generation hybrids with q values around 50%. Instead, there was a small number of pure Cx. quinquefasciatus individuals, and the q values for Cx. quinquefasciatus hybrid ancestry ranged from 10 to 85%. It is possible that Cx. quinquefasciatus is occasionally brought to Chicago during the summer months by trucks or boats, and if hybrids with enough pipiens ancestry are formed, they may be able to diapause over the winter. Subsequent collection efforts are needed to verify whether Cx. quinquefasciatus continues to be found at the Trumbull Park sites.
Although we were primarily interested in Cx. pipiens complex mosquitoes, 72 Cx. restuans individuals were identified in the microsatellite analysis. Culex restuans is similar morphologically to members of the Cx. pipiens complex and individuals collected via aspiration are sometimes difficult to identify accurately. Smith et al. (2005) tested a panel of microsatellite markers with different Culex species and also noted that marker CxpGT51 produced one Cx. restuans-specific allele, but did not observe this phenomenon with a second marker (CxqGT4) as we did in the current study, perhaps because of their small sample size (N = 6).
Our results suggest that Cx. pipiens complex mosquitoes in the Chicago area primarily utilize American Robins and House Sparrows as hosts. A low frequency of f. pipiens – f. molestus hybrids was observed, and the presence of Cx. quinquefasciatus individuals and f. pipiens – Cx. quinquefasciatus hybrids suggests that the genetic composition of Cx. pipiens complex populations in Chicago could change over time.
Supplementary Material
Acknowledgments
We are grateful to the property owners in the Chicago area who granted us access to their property to collect specimens. Mark Delorey, statistician from CDC, Division of Vector-Borne Diseases, calculated the Manly index.
Footnotes
Supplementary Data
Supplementary data are available at Journal of Medical Entomology online.
References Cited
- Apperson CS, Hassan HK, Harrison BA, Savage HM, Aspen SE, Farajollahi A, Crans W, Daniels TJ, Falco RC, Benedict M, et al. 2004. Host feeding patterns of established and potential mosquito vectors of West Nile virus in the eastern United States. Vector Borne Zoonotic Dis. 4: 71–82. [DOI] [PMC free article] [PubMed] [Google Scholar]
- Barr AR 1957. The distribution of Culex p. pipiens and C.P. quinquefasciatus in North America. Am. J. Trop. Med. Hyg. 6: 153–165. [DOI] [PubMed] [Google Scholar]
- Bibby CJ, Burgess ND, Hill DA, and Mustoe SH. 2000. Bird census techniques. Academic Press, London, United Kingdom. [Google Scholar]
- Bickel P, and Doksum K. 2001. Mathematical statistics, vol. 1, 2nd ed. Prentice Hall, Inc., Upper Saddle River, NJ. [Google Scholar]
- Centers for Disease Control and Prevention. 2018. West Nile virus statistics and maps. Available from https://www.cdc.gov/westnile/statsmaps/cumMapsData.html; accessed 12 September 2019.
- Ciota AT, Chin PA, and Kramer LD. 2013. The effect of hybridization of Culex pipiens complex mosquitoes on transmission of West Nile virus. Parasit. Vectors. 6: 305. [DOI] [PMC free article] [PubMed] [Google Scholar]
- Cornel A, Lee Y, Fryxell RT, Siefert S, Nieman C, and Lanzaro G. 2012. Culex pipiens sensu lato in California: a complex within a complex? J. Am. Mosq. Control Assoc. 28: 113–121. [DOI] [PubMed] [Google Scholar]
- Crabtree MB, Kading RC, Mutebi JP, Lutwama JJ, and Miller BR. 2013. Identification of host blood from engorged mosquitoes collected in western Uganda using cytochrome oxidase I gene sequences. J. Wildl. Dis. 49: 611–626. [DOI] [PubMed] [Google Scholar]
- Darsie RF Jr. and Ward RA. 2005. Identification and geographical distribution of the mosquitoes of North America, North of Mexico. University Press of Florida, Gainesville, FL. [Google Scholar]
- Davis LE, DeBiasi R, Goade DE, Haaland KY, Harrington JA, Harnar JB, Pergam SA, King MK, DeMasters BK, and Tyler KL. 2006. West Nile virus neuroinvasive disease. Ann. Neurol. 60: 286–300. [DOI] [PubMed] [Google Scholar]
- Edillo FE, Tripet F, McAbee RD, Foppa IM, Lanzaro GC, Cornel AJ, and Spielman A. 2007. A set of broadly applicable microsatellite markers for analyzing the structure of Culex pipiens (Diptera: Culicidae) populations. J. Med. Entomol. 44: 145–149. [DOI] [PubMed] [Google Scholar]
- Excoffier L, Laval G, and Schneider S. 2007. Arlequin (version 3.0): an integrated software package for population genetics data analysis. Evol. Bioinform. Online. 1: 47–50. [PMC free article] [PubMed] [Google Scholar]
- Fritz ML, Walker ED, Miller JR, Severson DW, and Dworkin I. 2015. Divergent host preferences of above- and below-ground Culex pipiens mosquitoes and their hybrid offspring. Med. Vet. Entomol. 29: 115–123. [DOI] [PubMed] [Google Scholar]
- Garvin MC, Austin AL, Stracker NH, Slowinski SP, Rutter JE, Butler M, Michel M, and Whelan RJ. 2018. Attraction of Culex pipiens to uropygial gland secretions does not explain feeding preference for American robins. J. Vector Ecol. 43: 110–116. [DOI] [PubMed] [Google Scholar]
- Glaubitz JC 2004. CONVERT: a user-friendly program to reformat diploid genotypic data for commonly used population genetic software packages. Mol. Ecol. Notes 4: 309–310. [Google Scholar]
- Hamer GL, Kitron UD, Brawn JD, Loss SR, Ruiz MO, Goldberg TL, and Walker ED. 2008. Culex pipiens (Diptera: Culicidae): a bridge vector of West Nile virus to humans. J. Med. Entomol. 45: 125–128. [DOI] [PubMed] [Google Scholar]
- Hamer GL, Kitron UD, Goldberg TL, Brawn JD, Loss SR, Ruiz MO, Hayes DB, and Walker ED. 2009. Host selection by Culex pipiens mosquitoes and West Nile virus amplification. Am. J. Trop. Med. Hyg. 80: 268–278. [PubMed] [Google Scholar]
- Hartl DL, and Clark AG. 1997. Principles of population genetics. Sinauer, Sunderland, MA. [Google Scholar]
- Huang S, Hamer GL, Molaei G, Walker ED, Goldberg TL, Kitron UD, and Andreadis TG. 2009. Genetic variation associated with mammalian feeding in Culex pipiens from a West Nile virus epidemic region in Chicago, Illinois. Vector Borne Zoonotic Dis. 9: 637–642. [DOI] [PubMed] [Google Scholar]
- Huang S, Molaei G, and Andreadis TG. 2008. Genetic insights into the population structure of Culex pipiens (Diptera: Culicidae) in the Northeastern United States by using microsatellite analysis. Am. J. Trop. Med. Hyg. 79: 518–527. [PubMed] [Google Scholar]
- Ivanova NV, Zemlak TS, Hanner RH, and Hebert PDN. 2007. Universal primer cocktails for fish DNA barcoding. Mol. Ecol. Notes 7: 544–548. [Google Scholar]
- Joyce AL, Melese E, Ha PT, and Inman A. 2018. Population genetic structure of the Culex pipiens (Diptera: Culicidae) complex, vectors of West Nile virus, in five habitats. Parasit. Vectors. 11: 10. [DOI] [PMC free article] [PubMed] [Google Scholar]
- Kent RJ 2009. Molecular methods for arthropod bloodmeal identification and applications to ecological and vector-borne disease studies. Mol. Ecol. Resour. 9: 4–18. [DOI] [PubMed] [Google Scholar]
- Kent RJ, Harrington LC, and Norris DE. 2007. Genetic differences between Culex pipiens f. molestus and Culex pipiens pipiens (Diptera: Culicidae) in New York. J. Med. Entomol. 44: 50–59. [DOI] [PMC free article] [PubMed] [Google Scholar]
- Keyghobadi N, Matrone MA, Ebel GD, Kramer LD, and Fonseca DM. 2004. Microsatellite loci from the northern house mosquito (Culex pipiens), a principal vector of West Nile virus in North America. Mol. Ecol. Notes 4: 20–22. [Google Scholar]
- Kilpatrick AM, Kramer LD, Campbell SR, Alleyne EO, Dobson AP, and Daszak P. 2005. West Nile virus risk assessment and the bridge vector paradigm. Emerg. Infect. Dis. 11: 425–429. [DOI] [PMC free article] [PubMed] [Google Scholar]
- Kothera L, Zimmerman EM, Richards CM, and Savage HM. 2009. Microsatellite characterization of subspecies and their hybrids in Culex pipiens complex (Diptera: Culicidae) mosquitoes along a north-south transect in the central United States. J. Med. Entomol. 46: 236–248. [DOI] [PubMed] [Google Scholar]
- Kothera L, Godsey M, Mutebi JP, and Savage HM. 2010. A comparison of aboveground and belowground populations of Culex pipiens (Diptera: Culicidae) mosquitoes in Chicago, Illinois, and New York City, New York, using microsatellites. J. Med. Entomol. 47: 805–813. [DOI] [PubMed] [Google Scholar]
- Kothera L, Godsey MS Jr, Doyle MS, and Savage HM. 2012. Characterization of Culex pipiens complex (Diptera: Culicidae) populations in Colorado, USA using microsatellites. Plos One. 7: e47602. [DOI] [PMC free article] [PubMed] [Google Scholar]
- Kothera L, Nelms BM, Reisen WK, and Savage HM. 2013. Population genetic and admixture analyses of Culex pipiens complex (Diptera: Culicidae) populations in California, United States. Am. J. Trop. Med. Hyg. 89: 1154–1167. [DOI] [PMC free article] [PubMed] [Google Scholar]
- Lanciotti RS, Roehrig JT, Deubel V, Smith J, Parker M, Steele K, Crise B, Volpe KE, Crabtree MB, Scherret JH, et al. 1999. Origin of the West Nile virus responsible for an outbreak of encephalitis in the northeastern United States. Science 286: 2333–2337. [DOI] [PubMed] [Google Scholar]
- Manly BF, McDonald LL, Thomas DL, McDonald TL, and Erickson WP. 2002. Resource selection by animals: statistical design and analysis for field studies. Kluwer Academic Publishers, Dordrecht, The Netherlands. [Google Scholar]
- McAbee RD, Kang KD, Stanich MA, Christiansen JA, Wheelock CE, Inman AD, Hammock BD, and Cornel AJ. 2004. Pyrethroid tolerance in Culex pipiens pipiens var molestus from Marin County, California. Pest Manag. Sci. 60: 359–368. [DOI] [PubMed] [Google Scholar]
- Messing J 1983. New M13 vectors for cloning. Methods Enzymol. 101: 20–78. [DOI] [PubMed] [Google Scholar]
- Molaei G, Andreadis TG, Armstrong PM, Anderson JF, and Vossbrinck CR. 2006. Host feeding patterns of Culex mosquitoes and West Nile virus transmission, northeastern United States. Emerg. Infect. Dis. 12: 468–474. [DOI] [PMC free article] [PubMed] [Google Scholar]
- Molecular Ecology Resources Primer Development Consortium, Abreu AG, Albaina A, Alpermann TJ, Apkenas VE, Bankhead-Dronnet S, Bergek S, Berumen MS, Cho C-H, Clobert J, Coulon A, et al. 2012. Permanent genetic resources added to the Molecular Ecology Resources Database 1 October 2011– 30 November 2011. Mol. Ecol. Resour. 12: 374–376. [DOI] [PMC free article] [PubMed] [Google Scholar]
- Montgomery MJ, Thiemann T, Macedo P, Brown DA, and Scott TW. 2011. Blood-feeding patterns of the Culex pipiens complex in Sacramento and Yolo Counties, California. J. Med. Entomol. 48: 398–404. [DOI] [PubMed] [Google Scholar]
- Mutebi JP, and Savage HM. 2009. Discovery of Culex pipiens pipiens form molestus in Chicago. J. Am. Mosq. Control Assoc. 25: 500–503. [DOI] [PubMed] [Google Scholar]
- Nasci R 1981. A lightweight battery-powered aspirator for collecting resting mosquitoes in the field. Mosq. News 41: 808–811. [Google Scholar]
- Nelms BM, Kothera L, Thiemann T, Macedo PA, Savage HM, and Reisen WK. 2013. Phenotypic variation among Culex pipiens complex (Diptera: Culicidae) populations from the Sacramento Valley, California: horizontal and vertical transmission of West Nile virus, diapause potential, autogeny, and host selection. Am. J. Trop. Med. Hyg. 89: 1168–1178. [DOI] [PMC free article] [PubMed] [Google Scholar]
- Pritchard JK, Stephens M, and Donnelly P. 2000. Inference of population structure using multilocus genotype data. Genetics. 155: 945–959. [DOI] [PMC free article] [PubMed] [Google Scholar]
- Ratnasingham S, and Hebert PD. 2007. BOLD: the barcode of life data system (http://www.barcodinglife.org). Mol. Ecol. Notes 7: 355–364; accessed 12 September 2019. [DOI] [PMC free article] [PubMed] [Google Scholar]
- Savage HM, Aggarwal D, Apperson CS, Katholi CR, Gordon E, Hassan HK, Anderson M, Charnetzky D, McMillen L, Unnasch EA, et al. 2007. Host choice and West Nile virus infection rates in blood-fed mosquitoes, including members of the Culex pipiens complex, from Memphis and Shelby County, Tennessee, 2002–2003. Vector Borne Zoonotic Dis. 7: 365–386. [DOI] [PMC free article] [PubMed] [Google Scholar]
- Simpson JE, Folsom-O’Keefe CM, Childs JE, Simons LE, Andreadis TG, and Diuk-Wasser MA. 2009. Avian host-selection by Culex pipiens in experimental trials. Plos One. 4: e7861. [DOI] [PMC free article] [PubMed] [Google Scholar]
- Smith J, Keyghobadi N, Matrone MA, Escher RL, and Fonseca DM. 2005. Crossspecies comparison of microsatellite loci in the Culex pipiens complex and beyond. Mol. Ecol. Notes 5: 697–700. [Google Scholar]
- Spielman A 1957. The inheritance of autogeny in the Culex pipiens complex of mosquitoes. Am. J. Hyg. 65: 404–425. [DOI] [PubMed] [Google Scholar]
- Vähä J-P, and Primmer CR. 2006. Efficiency of model-based Bayesian methods for detecting hybrid individuals under different hybridization scenarios and with different numbers of loci. Mol. Ecol. 15: 63–72. [DOI] [PubMed] [Google Scholar]
- Wray FC 1946. Six generations of Culex pipiens without a blood meal. Mosq. News. 6: 71. [PubMed] [Google Scholar]
Associated Data
This section collects any data citations, data availability statements, or supplementary materials included in this article.