Abstract
The peptide nucleic acid (PNA)-directed PCR clamping technique was modified and applied to the detection of mitochondrial DNA mutations with low heteroplasmy. This method is extremely specific, eliminating false positives in the absence of mutant molecules, and highly sensitive, being capable of detecting mutations at the level of 0.1% of total molecules. Moreover, the reaction can be multiplexed to identify more than one mutation per reaction. Using this technique, the levels of three point mutations, the tRNALeu(UUA) 3243 mutation causing mitochondrial encephalopathy, lactic acidosis and stroke-like episodes (MELAS); the tRNALys 8344 mutation causing myoclonic epilepsy and ragged red fibers (MERRF); and the nucleotide position 414 mutation adjacent to the control region promoters, were evaluated in human brain and muscle from individuals of various ages. While none of the mutations were detected in brain samples from individuals ranging in age from 23 to 93, the 414 mutation could be detected in muscle from individuals 30 years and older. These data demonstrate that the 3243 and 8344 mutations do not accumulate with age to levels greater than 0.1% in brain and muscle. By contrast, the 414 mutation accumulates with age in normal human muscle, though not in brain. The reason for the striking absence of the 414 mutation in aging brain is unknown.
INTRODUCTION
Inherited mitochondrial DNA (mtDNA) mutations have been shown to cause a variety of degenerative diseases (1,2). Over 100 different disease-causing mtDNA point mutations have been described to date (see MitoMap, http://www.gen.emory.edu/mitomap.html ). In addition, over 1000 different polymorphisms have been described to occur in mtDNA, with the greatest level of polymorphism occurring in the hypervariable 1100 bp non-coding control region. Detection of mutations in mtDNA is complicated by the fact that each cell contains hundreds to thousands of mtDNAs and a mutant cell can contain any proportion of mutant or wild-type molecules, a condition known as heteroplasmy. In addition, the ratio of mutant to wild-type mtDNAs is variable between tissues. As a result, it is often difficult to detect low proportions of mutant mtDNAs in maternal relatives of patients with a mitochondrial disease or in available tissues of patients with suspected mitochondrial disease.
The presence of somatic mtDNA mutations has been observed in a variety of postmitotic tissues of older individuals. The age-related accumulation of the 4977 bp deletion as well as other mtDNA deletions has been demonstrated in a variety of tissues by various PCR-based techniques (3–14). Hence, the accumulation of somatic mtDNA rearrangements is now generally agreed to be a biomarker of aging. A number of reports have suggested that mtDNA base substitution mutations also accumulate with age. Several studies have reported that the pathogenic mtDNA tRNALeu(UUA) A3243G mutation causing mitochondrial encephalopathy, lactic acidosis and stroke-like episodes (MELAS) and the mtDNA tRNALys A8344G mutation causing myoclonic epilepsy and ragged red fibers (MERRF) disease, accumulates with age in various tissues in healthy individuals (15–18). However, the validity of these results has been questioned (19). Base substitution mutations in the mtDNA control region have been detected in brain samples by denaturing gradient gel electrophoresis (DGGE) (20). Using a similar technique, several control region mtDNA mutations were detected in the skin fibroblasts from aging individuals (21). One mutation, T414G, adjacent to the transcriptional start sites of the mtDNA showed a striking age-related accumulation, reaching a level of 50% of all mtDNAs in some cell lines (21). However, sequencing of the control regions of mtDNAs recovered from human and mouse brain by fusion of synaptosomes to mtDNA-deficient (ρ0) cell lines failed to reveal base substitution mutations, including the T414G mutation (22). Hence, the nature and tissue distribution of age-related somatic mtDNA mutations remain unclear.
To more efficiently screen for somatic mtDNA base substitutions, we set out to devise a new procedure that would be both highly specific and extremely sensitive. This objective has been achieved by adapting the peptide nucleic acid (PNA)-directed PCR clamping technique (23). PNAs consist of nitrogenous bases (i.e. A, T, C, G) linked through peptide bonds. Since the PNA backbone lacks a 3′-OH, it cannot act as a primer for DNA synthesis (24). Furthermore, since PNA molecules lack the negative charge of the sugar–phosphate backbone, they bind to DNA with high affinity and specificity. The resulting enhanced discrimination of base pair mismatches can permit detection of rare point mutations by selective binding, thus inhibiting PCR amplification of wild-type, but not mutant, DNAs.
We have adapted the PNA-directed PCR clamping method to detect the pathogenic A8344G and A3243G tRNA mutations, as well as the control region T414G mutation. This procedure was then used to test human skeletal muscle and brain samples for the accumulation of these mutations with age.
MATERIALS AND METHODS
Creation of control plasmids
pA3243A and pA3243G. The region surrounding mtDNA nucleotide position (np) 3243 was amplified from heteroplasmic MELAS patient DNA using primers 2981.for (5′-ACG ACC TCG ATG TTG GAT CAG GAC ATC CC-3′) and 3412.rev (5′-CTA TAT ACA ACT ACG CAA AG-3′). The resulting PCR product was cloned into vector pCR2.1 using the TA kit (Invitrogen). Positive colonies were picked and analyzed by PCR amplification and digestion with HaeIII, which cuts wild-type product twice and mutant product three times. Plasmids pA3243A, which contains the wild-type A at np 3243, and pA3243G, which contains the MELAS mutation G at np 3243, were used for PNA clamping reconstruction experiments.
pA8344A and pA8344G. The region surrounding mtDNA np 8344 was amplified from heteroplasmic MERRF patient DNA using primers 7889.for (5′-CCT TGA CGT TGA CAA TCG AG-3′) and 8474.rev (5′-CAC AAA CTA CCA CCT ACC TCC CT-3′) and cloned as described above. Plasmids pA8344A, which contains the wild-type A at np 8344, and pA8344G, which contains the MELAS mutation G at np 8344, were obtained.
pT414T and pT414G. pT414T was created by cloning a PCR product containing np 414 of the mtDNA into pCR2.1 as described above. pT414G was created by amplification of mtDNA from a normal individual using trick primer t414g.for (5′-CCA GAT TTC AAA TTT TAT CTT TTG GCG GGA TG-3′) resulting in a product with a G instead of the wild-type T at np 414.
PNA clamping PCR
The PNA molecules A3243A (H-TTA CCG GGC TCT GCC-NH2) and A8344A (H-GTG TTG GTT CTC TTA-CONH2) were obtained from Perseptive Biosystems. PNA T414T (H-TTG GCG GTA TGC ACT-CONH2) was purchased from PE Biosystems. PCR amplifications were carried out in a 50 µl volume containing 0.2 mM dNTPs, 1.0 µM primers, 1× PCR buffer (10 mM Tris–HCl, 1.5 mM MgCl2, 50 mM KCl, pH 8.3), 0.5 U Taq polymerase (Boehringer Mannheim) and 40–60 ng total genomic DNA or 1 ng plasmid DNA as template. Reaction conditions were 94°C for 2 min and 25 cycles of 94°C for 30 s, 69°C for 30 s, 56°C for 30 s and 72°C for 30 s.
DNA extractions
DNA was extracted from fresh human brain autopsy tissues using the Puregene DNA isolation kit (Gentra Systems) (25). Muscle DNA was extracted from biopsy material from normal individuals by homogenization and lysis with SDS (26).
Comparative quantitation of mtDNA
Relative quantities of mtDNA were measured using competitive PCR. A fragment of the mtDNA was amplified from 1 ng total genomic DNA in the presence of varying known concentrations of competitive plasmid pA3243G. Since the plasmid pA3243G contains a restriction fragment length polymorphism at np 3243, the PCR product amplified from the sample mtDNA was distinguished from product amplified from plasmid DNA by digestion with HaeIII. When the amounts of the PCR products from plasmid and sample were comparable, the sample template amount was assumed to equal the known added plasmid level.
RESULTS
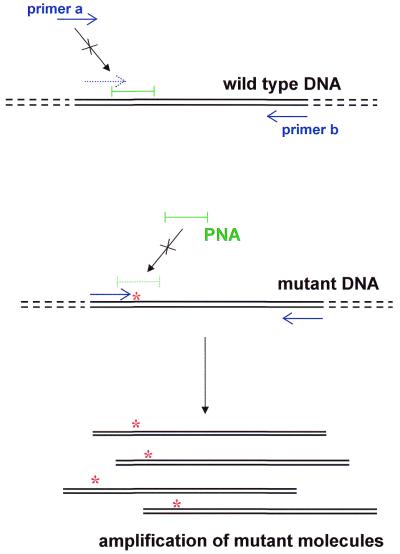
To determine if PNA-directed PCR clamping could be adapted to identify point mutations in mtDNA, reconstruction experiments were performed using plasmids. Plasmids containing the MERRF A8344G, MELAS A3243G and control region T414G mutations and their wild-type counterparts were mixed in varying proportions. PNAs of 15 bases with sequences identical to the wild-type DNA sequence were then added. The PNAs bind to the wild-type sequence and block (clamp) its ability to be amplified by overlapping oligonucleotide primers (Fig. 1). Primers were designed such that one oligonucleotide (primer a) binds immediately upstream of the base in question and its 3′-end overlaps with the first seven bases of the PNA. As a result, the binding of this primer to the wild-type sequence is blocked by the PNA. This primer does not encompass the mutant base, thus guaranteeing that a mutation in any PCR product is derived from the template and not the primer. When mutant and wild-type plasmids were used as template for PCR amplification, the PNA molecules specifically blocked the amplification of wild-type DNA, while the mutant template remained free of the PNA and was amplified (Fig. 2).
Figure 1.
PNA-directed PCR clamping methodology. Blue arrows, primers for PCR; green bar, PNA; red asterisks, mutated nucleotide in mtDNA.
Figure 2.
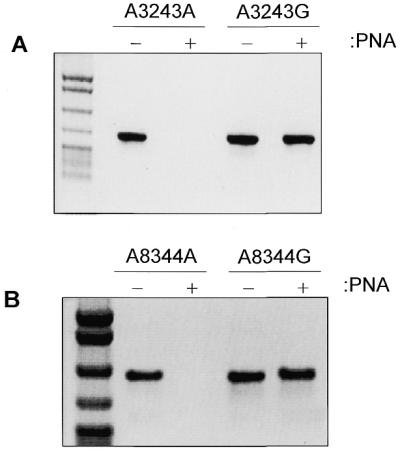
PNA-clamping blocks wild-type, but not mutant, molecule amplification. Amplification from wild-type or mutant plasmid was performed in the presence (+ lanes) or absence (– lanes) of PNA. Negative images of ethidium bromide stained gels loaded with 10 µl of PCR product are shown. DNA size standard on left is pBR322 digested with MspI. (A) Specific blocking of amplification of DNA containing wild-type 3243 nucleotide. (B) Specific blocking of amplification of DNA containing wild-type 8344 nucleotide.
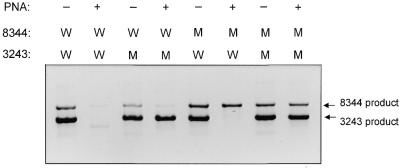
This system can be multiplexed by simultaneously including the template DNAs, PNAs and primers for both the A8344G and A3243G reactions (Fig. 3). Since the addition of PNA allows amplification of only mutant DNA template, the presence of a product in a PNA-clamped reaction indicates that template carrying the mutation is present in the DNA sample. By varying the size of the PCR products for each region, the different mutations can be identified; in this case, the 8344 reaction amplifies a 305 bp product and the 3243 reaction amplifies a product of 489 bp (Fig. 3). Without the PNA (– lanes), both wild-type and mutant molecules are amplified (Fig. 3, lanes 1, 3, 5 and 7). When PNAs are added, only the mutant molecules are amplified (Fig. 3, lanes 4, 6 and 8). Therefore, PNA-clamped reactions can be multiplexed to allow simple and efficient identification of multiple mtDNA mutations in diagnosis of mtDNA disease.
Figure 3.
PNA-clamped PCR can be multiplexed to detect multiple point mutations in one reaction tube. Product was amplified in the presence (+ lanes) or absence (– lanes) of PNA from a mixture of wild-type (W) or mutant (M) 8344 and 3243 plasmids [for example, the template for the product in lane 4 (reading lanes numbered left to right) was mutant 3243 plasmid and wild-type 8344 plasmid]. Ten microliters of one PCR reaction was loaded per lane and the negative image of the ethidium bromide stained gel is shown.
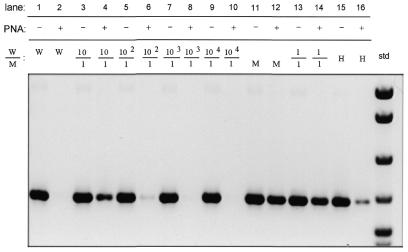
The sensitivity of PNA-directed PCR clamping for detecting low levels of heteroplasmy was tested by mixing wild-type and mutant plasmids containing the 3243, 8344 and 414 regions at ratios ranging from 1:1 to 1000:1 (wild-type:mutant). Results for the three mutations were similar and representative results using pA3243A and pA3243G plasmids are shown here. Amplification of wild-type DNA (W) is completely blocked by addition of PNA (Fig. 4, lane 1 versus lane 2), while amplification of mutant DNA is unaffected (Fig. 4, lane 11 versus lane 12). In mixing experiments, amplification of mutant DNA could be detected at ratios of wild-type to mutant plasmid that ranged from 1:1 (lanes 13 and 14) to 100:1 (lanes 5 and 6). In addition, the A3243G mutation could be detected in a heteroplasmic MELAS patient (Fig. 4, lanes 15 and 16). The mutant DNA could not be detected at a ratio of 1000:1 or 10 000:1 using a single round of amplification (lanes 8 and 10).
Figure 4.
PNA-clamped PCR allows detection of a point mutation at a ratio of 1:100. Amplification in the presence (+ lanes) or absence (– lanes) of PNA was performed from mixed ratios of wild-type and mutant 3243 plasmid DNA. Lanes labeled W or M contain products amplified from wild-type or mutant plasmid, respectively. Lanes labeled H contain products amplified from heteroplasmic MELAS patient DNA. The negative image of the ethidium bromide stained gel is shown. DNA size standard (std) on the right is pBR322 digested with MspI.
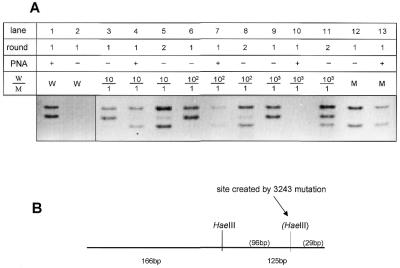
To increase the sensitivity of the PNA-clamped reaction, we performed a second round of PCR on diluted product from the first reaction. The second amplification used one-hundredth of the original product as template for a second identical amplification. PNA was not added to the second amplification reaction because detection from the second reaction was found to be more sensitive in the absence of PNA. Therefore, wild-type DNA amplification products were distinguished from mutant products by restriction enzyme digestion. The A3243G mutation creates a new HaeIII restriction site such that wild-type molecules are cut once to yield 166 and 125 bp products, while mutant molecules are cut twice and yield 166, 96 and 29 bp products (Fig. 5B). When template plasmids were in a ratio of 100:1, amplification without PNA showed only wild-type molecules (Fig. 5A, lane 6). When PNA was added, however, a small amount of mutant product could be seen (lane 7). When this product was reamplified without PNA, both the wild-type and a stronger mutant band could be seen (lane 8). When a ratio of 1000:1 was used as template without PNA (lane 9), only wild-type product was seen. When PNA was added, no amplification product could be seen after one round of PCR (lane 10). However, after a second round of PCR without additional PNA, some mutant product was detected as determined by digestion with HaeIII (lane 11). Therefore, additional rounds of amplification improved the detection of mutant molecules, allowing detection of these molecules at a ratio of at least 1000:1.
Figure 5.
A second round of PCR enhances the sensitivity of point mutation detection to 1000:1. (A) Amplification products from PCR of ratios of wild-type and mutant 3243 plasmids as described in Figure 4, digested with HaeIII. Lanes labeled round 1 contain primary PCR products amplified directly from plasmids. Lanes labeled round 2 contain DNA bands reamplified from 1 µl of round 1 product. (B) Diagram of restriction fragment length polymorphism created by A3243G mutation. Digestion of wild-type PCR product with HaeIII yields bands of 166 and 125 bp. The A3243G mutation creates another HaeIII site and digestion of mutant PCR product yields bands of 166, 96 and 29 bp.
The ability to detect very low levels of point mutations in mtDNA by PNA-directed PCR clamping allowed us to analyze the presence or absence of the A8344G, A3253G and T414G point mutations in tissues from individuals of varying ages. DNA was extracted from autopsy-derived brain samples from 14 individuals, ranging in age from 23 to 93 years (Table 1) and tested for the three mutations by PNA-directed PCR clamping. While a product was strongly amplified from all brain samples in the absence of PNA, no mutant product was seen when PNA was added. To increase the sensitivity of the assay, a second round of PCR was performed. Again, no product was seen, suggesting that the 3243 mutation did not occur at a level higher than 1000:1 in brain from young or old individuals. Similar results were obtained with one and two rounds of reactions testing for the 8344 and 414 mutations (Table 1). These results suggest that the A3243G, A8344G and T414G point mutations do not accumulate within the human brain at a level >1/1000 molecules.
Table 1. Sources of brain DNA.
| Individual | Age | Sex | Region | A3243G | A8344G | T414G |
|---|---|---|---|---|---|---|
| 1 | 23 | M | Cb, FC, Pt | – | – | – |
| 2 | 32 | F | Cb, FC, Pt | – | – | – |
| 3 | 37 | F | Cb, FC, Pt | – | – | – |
| 4 | 41 | M | Cb, C, EC, FC, SN | – | – | – |
| 5 | 44 | M | Cb, FC, Pt | – | – | – |
| 6 | 51 | M | Cb, EC, FC, Pt, SN | – | – | – |
| 7 | 54 | M | Cb, C, EC, FC, SN | – | – | – |
| 8 | 63 | M | Cb, C, EC, FC, SN | – | – | – |
| 9 | 64 | F | Cb, C, EC, FC, SN | – | – | – |
| 10 | 68 | F | Cb, Pt, TC | – | – | – |
| 11 | 69 | F | Cb, C, EC, FC, SN | – | – | – |
| 12 | 72 | M | Cb, C, EC, FC, SN | – | – | – |
| 13 | 74 | F | Cb, FC, Pt | – | – | – |
| 14 | 79 | F | Cb, C, EC, FC | – | – | – |
| 15 | 82 | F | Cb, FC, Pt | – | – | – |
| 16 | 93 | F | Cb, C, EC, FC, SN | – | – | – |
C, caudate; Cb, cerebellum; EC, entorhinal cortex; FC, frontal cortex; Pt, putamen; SN, substantia nigra; TC, temporal cortex.
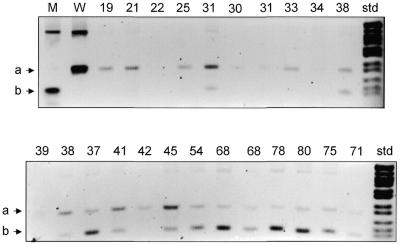
The presence of the A3243G, A8344G and T414G mutations was also evaluated in muscle by the PNA-directed PCR clamping technique. DNA was prepared from muscle biopsy samples from 23 normal volunteers ranging in age from 19 to 80 years. In reactions testing for the A3243G and A8344G mutations, strong amplification products appeared in the absence of PNA, but no amplification of mutant molecules was detected in the presence of PNA, even with two rounds of PCR. Thus, these two point mutations do not occur at a level >1000:1 in muscle. By contrast, testing for the T414G mutations gave robust amplification of mutant molecules from multiple samples from older individuals in the presence of the PNA414 (Fig. 6) with one round of PCR. In the PNA-clamped reactions using template DNA from nine individuals between the ages of 19 and 34, mutant molecules were detected in only one individual. By contrast, testing of individuals between 38 and 80 in the presence of PNA414 revealed mutant molecules in 12 out of 14 individuals. Thus, the T414G mtDNA mutation accumulates with age in muscle, but not brain.
Figure 6.
PNA-clamped PCR detects the T414G mutation in muscle DNA from older individuals. PCR product from the np 414 region of mtDNA was amplified in the absence of PNA from plasmid DNA (lanes M and W) or in the presence of PNA from DNA prepared from normal muscle biopsy (lanes labeled with age of individual). All products were digested with FokI, which cuts wild-type product to yield band labeled a (lane W) and mutant product to yield band labeled b (lane M). DNA size standard (std) on right is pBR322 digested with MspI.
DISCUSSION
Using an adaptation of the PNA-directed PCR clamping method, we have demonstrated that the mtDNA control region mutation T414G, discovered in the mtDNA of skin fibroblasts from older human subjects, also accumulates in skeletal muscle after age 35 years. Surprisingly, however, the T414G mutation could not be detected in any human brain sample, even from subjects as old as 93 years. The absence of this control region mutation in human brain samples is consistent with our previous observation that mtDNAs recovered from human and mouse brains by creation of synaptosome cybrids were devoid of control region base substitution mutations (22). In addition, the presence of this mutation in muscle, but not brain, is consistent with reports that control region mutations have higher levels of heteroplasmy in muscle than in brain (27). Taken together, these results suggest that the T414G mutation accumulates in a tissue-specific fashion with age.
The presence of pathogenic MELAS tRNALeu(UUA) A3243G and MERRF tRNALys A8344G mutations was also investigated in muscle and brain. These mutations have been reported to accumulate with age in muscle and other tissues when detected by allele specific-PCR (AS-PCR) (15–18). However, we were unable to detect these mutations in any of the muscle or brain samples using the PNA-directed PCR clamping method. Our results are consistent with the observation of others who were unable to detect coding region mutations by direct mtDNA sequencing (28,29) or by DGGE (20). The reason for the discrepancy in the two groups of results is unclear. It is possible that AS-PCR is more sensitive than the PNA-directed PCR clamping method at detecting rare somatic mutations. However, our reconstruction experiments indicate that the PNA-directed PCR clamping method was capable of detecting mutations at 1000:1 molecules and previous reports had suggested that these mutations accumulate to levels of 0.1% of total muscle mtDNAs (17). Alternatively, AS-PCR might lack specificity, resulting in the inadvertent amplification of wild-type molecules. Since we were able to eliminate this type of artifact with PNA-clamped PCR, the accumulated data suggest that the A3243G and A8344G mutations do not accumulate to significant levels (>0.1%) in post-mitotic muscle or brain.
Our results present two paradoxes. Why would the control region T414G mutation accumulate in skeletal muscle, but not in brain; and why would control region mutations accumulate, but not coding region mutations? The accumulation of the T414G mutation in muscle, but not brain, could either indicate that the T414G mutation does not arise at detectable levels in the brain or that the mutation arises in both muscle and brain, but is preferentially eliminated from the brain. It is possible that brain mtDNAs have an unusually low base substitution rate, although mtDNA rearrangement mutations have consistently been observed in several of the same brain regions analyzed here (10,11,14). Perhaps the two types of mutations arise by different mechanisms and thus appear at different rates. Alternatively, it is possible that somatic base substitutions do arise in the brain, but that they are preferentially eliminated. This elimination could occur at the cellular level by apoptosis or at the organelle level by the selective autophagy of mutant mitochondria. The selective elimination of the T414G mutation from brain would imply that the T414G mutation is deleterious in brain mitochondria and that this mutation is removed from brain, but not muscle tissue.
The reason why the T414G control region mutation, but not the MELAS A3243G and MERRF A8344G tRNA mutations, accumulates in muscle is also unclear. It is possible that the control region simply has a much higher mutation rate (20,21). It is also possible that the MELAS and MERRF mutations are preferentially eliminated. This seems unlikely, since MELAS and MERRF patients maintain high levels of mutant mtDNA in their muscle.
The high level of the 414 mutation in muscle and fibroblasts might be explained by its location in the control region, in close proximity to both the transcriptional promoters and the origin of heavy strand replication (30). Possibly, T414G mutations result in preferential amplification of mtDNA molecules in muscle and fibroblasts. Evaluation of the phenotypic effect of the T414G mutation will be necessary to evaluate this possibility.
The sensitivity and specificity of the PNA-directed PCR clamping method make it ideal for detecting heteroplasmy in patient samples and somatic mutations in post-mitotic tissues. This system may also be advantageous for detecting somatic mtDNA mutations that accumulate in cancer cells (31–34).
Overall, it is clear that both base substitution and rearrangement mutations do accumulate in mtDNA of certain post-mitotic tissues with age. However, the mechanisms of their origin and the kinetics of their elimination or amplification remain to be elucidated.
Acknowledgments
ACKNOWLEDGEMENTS
This work was supported by a J. Worley Brown fellowship to D.G.M., NIH grants (AG13154, NS21328, HL64017, HL45572) to D.C.W. and an Ellison Medical Foundation grant awarded to D.C.W.
REFERENCES
- 1.Wallace D.C. (2000) Am. Heart J., 139, S70–S85. [DOI] [PubMed] [Google Scholar]
- 2.Wallace D.C. (1999) Science, 283, 1482–1488. [DOI] [PubMed] [Google Scholar]
- 3.Cortopassi G.A. and Arnheim,N. (1990) Nucleic Acids Res., 18, 6927–6933. [DOI] [PMC free article] [PubMed] [Google Scholar]
- 4.Cortopassi G.A., Shibata,D., Soong,N.W. and Arnheim,N. (1992) Proc. Natl Acad. Sci. USA, 89, 7370–7374. [DOI] [PMC free article] [PubMed] [Google Scholar]
- 5.Esposito L.A., Melov,S., Panov,A., Cottrell,B.A. and Wallace,D.C. (1999) Proc. Natl Acad. Sci. USA, 96, 4820–4825. [DOI] [PMC free article] [PubMed] [Google Scholar]
- 6.Horton T.M., Graham,B.H., Corral-Debrinski,M., Shoffner,J.M., Kaufman,A.E., Beal,B.F. and Wallace,D.C. (1995) Neurology, 45, 1879–1883. [DOI] [PubMed] [Google Scholar]
- 7.Linnane A.W., Baumer,A., Maxwell,R.J., Preston,H., Zhang,C.F. and Marzuki,S. (1990) Biochem. Int., 22, 1067–1076. [PubMed] [Google Scholar]
- 8.Melov S., Shoffner,J.M., Kaufman,A. and Wallace,D.C. (1995) Nucleic Acids Res., 23, 4122–4126. [DOI] [PMC free article] [PubMed] [Google Scholar]
- 9.Pikó L., Hougham,A.J. and Bulpitt,K.J. (1988) Mech. Ageing Dev., 43, 279–293. [DOI] [PubMed] [Google Scholar]
- 10.Soong N.W., Hinton,D.R., Cortopassi,G. and Arnheim,N. (1992) Nature Genet., 2, 318–323. [DOI] [PubMed] [Google Scholar]
- 11.Zhang C., Baumer,A., Maxwell,R.J., Linnane,A.W. and Nagley,P. (1992) FEBS Lett., 297, 34–38. [DOI] [PubMed] [Google Scholar]
- 12.Corral-Debrinski M., Stepien,G., Shoffner,J.M., Lott,M.T., Kanter,K. and Wallace,D.C. (1991) J. Am. Med. Assoc., 266, 1812–1816. [PubMed] [Google Scholar]
- 13.Corral-Debrinski M., Shoffner,J.M., Lott,M.T. and Wallace,D.C. (1992) Mutat. Res., 275, 169–180. [DOI] [PubMed] [Google Scholar]
- 14.Corral-Debrinski M., Horton,T., Lott,M.T., Shoffner,J.M., Beal,M.F. and Wallace,D.C. (1992) Nature Genet., 2, 324–329. [DOI] [PubMed] [Google Scholar]
- 15.Liu V.W., Zhang,C. and Nagley,P. (1998) Nucleic Acids Res., 26, 1268–1275. [DOI] [PMC free article] [PubMed] [Google Scholar]
- 16.Münscher C., Müller-Höcker,J. and Kadenbach,B. (1993) Biol. Chem. Hoppe Seyler, 374, 1099–1104. [DOI] [PubMed] [Google Scholar]
- 17.Münscher C., Rieger,T., Müller-Höcker,J. and Kadenbach,B. (1993) FEBS Lett., 317, 27–30. [DOI] [PubMed] [Google Scholar]
- 18.Zhang C., Linnane,A.W. and Nagley,P. (1993) Biochem. Biophys. Res. Commun., 195, 1104–1110. [DOI] [PubMed] [Google Scholar]
- 19.Pallotti F., Chen,X., Bonilla,E. and Schon,E.A. (1996) Am. J. Hum. Genet., 59, 591–602. [PMC free article] [PubMed] [Google Scholar]
- 20.Jazin E.E., Cavelier,L., Eriksson,I., Oreland,L. and Gyllensten,U. (1996) Proc. Natl Acad. Sci. USA, 93, 12382–12387. [DOI] [PMC free article] [PubMed] [Google Scholar]
- 21.Michikawa Y., Mazzucchelli,F., Bresolin,N., Scarlato,G. and Attardi,G. (1999) Science, 286, 774–779. [DOI] [PubMed] [Google Scholar]
- 22.Trounce I., Schmiedel,J., Yen,H.C., Hosseini,S., Brown,M.D., Olson,J.J. and Wallace,D.C. (2000) Nucleic Acids Res., 28, 2164–2170. [DOI] [PMC free article] [PubMed] [Google Scholar]
- 23.Orum H., Nielsen,P.E., Egholm,M., Berg,R.H., Buchardt,O. and Stanley,C. (1993) Nucleic Acids Res., 21, 5332–5336. [DOI] [PMC free article] [PubMed] [Google Scholar]
- 24.Egholm M., Buchardt,O., Christensen,L., Behrens,C., Freier,S.M., Driver,D.A., Berg,R.H., Kim,S.K., Norden,B. and Nielsen,P.E. (1993) Nature, 365, 566–568. [DOI] [PubMed] [Google Scholar]
- 25.Melov S., Schneider,J.A., Coskun,P.E., Bennett,D.A. and Wallace,D.C. (1999) Neurobiol. Aging, 20, 565–571. [DOI] [PubMed] [Google Scholar]
- 26.Shoffner J.M., Lott,M.T., Lezza,A.M., Seibel,P., Ballinger,S.W. and Wallace,D.C. (1990) Cell, 61, 931–937. [DOI] [PubMed] [Google Scholar]
- 27.Calloway C.D., Reynolds,R.L., Herrin,G.L.,Jr and Anderson,W.W. (2000) Am. J. Hum. Genet., 66, 1384–1397. [DOI] [PMC free article] [PubMed] [Google Scholar]
- 28.Monnat R.J.J. and Loeb,L.A. (1985) Proc. Natl Acad. Sci. USA, 82, 2895–2899. [DOI] [PMC free article] [PubMed] [Google Scholar]
- 29.Monnat R.J.J., Maxwell,C.L. and Loeb,L.A. (1985) Cancer Res., 45, 1809–1814. [PubMed] [Google Scholar]
- 30.Clayton D.A. (1992) Int. Rev. Cytol., 141, 217–232. [DOI] [PubMed] [Google Scholar]
- 31.Fliss M.S., Usadel,H., Caballero,O.L., Wu,L., Buta,M.R., Eleff,S.M., Jen,J. and Sidransky,D. (2000) Science, 287, 2017–2019. [DOI] [PubMed] [Google Scholar]
- 32.Habano W., Sugai,T., Yoshida,T. and Nakamura,S. (1999) Int. J. Cancer, 83, 625–629. [DOI] [PubMed] [Google Scholar]
- 33.Polyak K., Li,Y., Zhu,H., Lengauer,C., Willson,J.K., Markowitz,S.D., Trush,M.A., Kinzler,K.W. and Vogelstein,B. (1998) Nature Genet., 20, 291–293. [DOI] [PubMed] [Google Scholar]
- 34.Horton T.M., Petros,J.A., Heddi,A., Shoffner,J., Kaufman,A.E., Graham,S.D., Jr., Gramlich,T. and Wallace,D.C. (1996) Genes Chromosom. Cancer, 15, 95–101. [DOI] [PubMed] [Google Scholar]


