Abstract
Programmed cell death (PCD) is a process that eliminates infected, damaged, or possibly neoplastic cells to sustain homeostatic multicellular organisms. Although long noncoding RNAs (lncRNAs) are involved in various types of PCD and regulate tumor growth, invasion, and migration, the role of PCD-related lncRNAs in bladder cancer still lacks systematic exploration. In this research, we integrated multiple types of PCD as pan-PCD and identified eight pan-PCD-related lncRNAs (LINC00174, HCP5, HCG27, UCA1, SNHG15, GHRLOS, CYB561D2, and AGAP11). Then, we generated a pan-PCD-related lncRNA prognostic signature (PPlncPS) with excellent predictive power and reliability, which performed equally well in the E-MTAB-4321 cohort. In comparison with the low-PPlncPS score group, the high-PPlncPS score group had remarkably higher levels of angiogenesis, matrix, cancer-associated fibroblasts, myeloid cell traffic, and protumor cytokine signatures. In addition, the low-PPlncPS score group was positively correlated with relatively abundant immune cell infiltration, upregulated expression levels of immune checkpoints, and high tumor mutation burden (TMB). Immunogenomic profiles revealed that patients with both low PPlncPS scores and high TMB had the best prognosis and may benefit from immune checkpoint inhibitors. Furthermore, for patients with high PPlncPS scores, docetaxel, staurosporine, and luminespib were screened as potential therapeutic candidates. In conclusion, we generated a pan-PCD-related lncRNA signature, providing precise and individualized prediction for clinical prognosis and some new insights into chemotherapy and immune checkpoint inhibitor therapy for bladder cancer.
Keywords: PCD, lncRNA, Signature, TMB, Immunotherapy, Chemotherapy
Subject terms: Cancer, Immunology, Biomarkers, Urology
Introduction
Bladder cancer (BCa) is a common malignancy of the genitourinary system and is often pathologically diagnosed as urothelial carcinoma. The global prevalence of bladder cancer has risen substantially over the past 30 years1. According to the latest GLOBOCAN data, BCa is the sixth most common and the ninth most fatal neoplasm worldwide in men2. According to the invasive depth, BCa is divided into non-muscle invasive bladder cancer (NMIBC) and muscle-invasive bladder cancer (MIBC)3. The tumor stage, and the corresponding treatment and prognosis of NMIBC and MIBC are different4. In addition to regular local therapy, chemotherapy and immunotherapy are frequently administered for bladder cancer4,5; drugs available including pembrolizumab, atezolizumab, and dulvalumab for immunotherapy and gemcitabine and cisplatin for chemotherapy4. However, it is extremely difficult to predict clinical outcomes due to the disparity in personal signatures. Not every patient could benefit from immunotherapy, and which drug the patient is more sensitive to needs to be determined individually. Hence, personalized and precise prediction, diagnosis, and treatment of bladder cancer are urgently needed.
Programmed cell death (PCD) is committed to eliminating infected, functionally dispensable, or possibly neoplastic cells to sustain homeostatic multicellular organisms. The main modes of PCD include cuproptosis, ferroptosis, necroptosis, autophagy, pyroptosis, apoptosis, and other forms of programmed cell death. Apoptosis and other manners of death are important mechanisms of resistance to cancer. For instance, increased apoptosis level enhances sensitivity to chemotherapy6, and resistance to ferroptosis promotes tumor metastasis in BCa7. The intracellular induction of ferroptosis is associated with increased PGE2 release, regulating tumor immune escape8. Many chemotherapies work well by inducing different forms of programmed cell death9,10. Nevertheless, a comprehensive study is still lacking to display the landscape of PCD in BCa.
Long noncoding RNAs (lncRNAs) refer to transcripts that are over 200 nt but can’t encode proteins. lncRNA modulates the stemness phenotype of bladder cancer cells11, regulates its progression12, and adjusts cancer aggression and migration13– lncRNA is a crucial factor in bladder cancer pathological process. Furthermore, several lncRNAs regulate PCD in tumors, affecting the clinical characteristics and prognosis of patients. For instance, lncRNA ADAMTS9-AS1 restrains autophagy and apoptosis by the PI3K/AKT/mTOR axis, enhancing the invasion and migration of tumor cells14. Due to the wide participation of lncRNAs in biological processes, making a prognostic model consisting of PCD-related lncRNAs for bladder cancer is a good option.
In this study, we integrated various types of PCD, called “pan-PCD”15, and then constructed a pan-PCD-related lncRNA prognostic signature (PPlncPS) in patients with BCa. The immunogenomic profile and treatment options were subsequently characterized in both the low- and high-PPlncPS groups. The signature provides a precise and individualized prediction of clinical prognosis for patients with BCa.
Methods and materials
Clinical tissue specimens
Seven pairs of bladder cancer and adjacent normal bladder samples were acquired from surgical tumor resections performed at the Department of Urology, the Second Xiangya Hospital of Central South University (Hunan, China) between Oct 20th, 2022 and Nov 15th, 2022. All patients were diagnosed as NMIBC by two practiced pathologists. The details were displayed in Table S1. The collected samples were stored in a − 80℃ refrigerator for RNA extraction. Surgical operations on each patient were performed with written informed consent.
Data source
The transcriptional data and corresponding clinicopathological characteristics of bladder cancer were collected from the Cancer Genome Atlas (TCGA) database. In total, 409 tumor samples and 19 control specimens were involved in the study. Only 2 of the 409 patients were diagnosed as NMIBC. As presented in Table S2, 6 cuproptosis-related genes, 60 ferroptosis-related genes, 51 pyroptosis-related genes, 67 necroptosis-related genes, 87 apoptosis-related genes, and 698 autophagy-related genes were involved in our project as gene sets. After the removal of duplicated genes, 818 PCD-related genes were obtained for further analysis. TIMER2.0 (http://timer.compgenomics.org/) was utilized to evaluate the tumor-infiltrating immune cells in TCGA-BLCA. IMvigor210, a multicenter, phase II clinical trial, was used to estimate the safety and efficacy of atezolizumab (one of the anti-PD-L1 monoclonal antibodies) to treat metastatic urothelial carcinoma16. Hence, the IMvigor210 cohort was used to ensure the prognostic value of a pan-PCD-related lncRNA signature for bladder cancer immunotherapy. We also downloaded clinical features and RNA-seq data of 476 early urothelial carcinoma patients (E-MTAB-4321) from the ArrayExpress database (https://www.ebi.ac.uk/arrayexpress/). All bladder cancer patients from the E-MTAB-4321 cohort were NMIBC. Taking into consideration the individual variations in gene expression, the E-MTAB-4321 cohort was utilized as the external validation set for our prognosis model.
Differentially expressed PCD-related (DE-PCD) gene identification
The count data of PCD-related genes were extracted. We selected the DE-PCD genes between bladder cancer and adjacent normal samples through the “DESeq2” R package17 with an adjusted p-value < 0.05 and log2|fold change|> 1. The volcano plot of PCD-related genes was drawn by the “ggplot2” R package18. The heatmap was visualized using the “pheatmap” R package19.
Functional analysis of DE-PCD genes
Biological process, molecular function, cellular component, and biological signaling pathways were detected by gene ontology (GO) and Kyoto Encyclopedia of Genes and Genomes (KEGG) analysis and were performed with the “clusterProfiler”20 and “DOSE” R packages21 for all the DE-PCD genes. A p-value < 0.05 was considered significant.
Identification of pan-PCD-related lncRNAs
Correlation analysis was carried out with an absolute value of the correlation coefficient greater than 0.3 and a p-value less than 0.05 between DE-PCD genes and all lncRNAs, and pan-PCD-related lncRNAs were obtained. The intersection of the E-MTAB-4321 cohort, IMVigor210 cohort, and TCGA-BLCA cohort was carried out to identify conserved pan-PCD-related lncRNAs for further analysis.
Construction of a pan-PCD-related lncRNA prognostic signature (PPlncPS)
To identify prognostic lncRNAs, univariate Cox regression analysis was conducted in the TCGA-BLCA cohort, and then multivariate Cox analysis was performed to screen independent prognostic lncRNAs. Subsequently, the pan-PCD-related lncRNA prognostic model was generated based on independent prognostic lncRNAs. Kaplan–Meier (KM) curves were plotted to compare the prognosis of overall survival between the low- and high-PPlncPS score groups. We utilized the E-MTAB-4321 cohort as the external validation cohort for our prognostic model. Based on the calculated PPlncPS score, the receiver operating characteristic (ROC) curve was visualized. The areas under the curves (AUCs) for 1 year, 3 years, and 5 years were calculated to estimate the corresponding overall survival (OS) probability.
Correlations between clinical features and PPlncPS
The PPlncPS score of each patient was calculated via the established model. Both univariate and multivariable Cox regression analyses were conducted to screen independent prognostic factors from the clinical characteristics. The results were displayed in forest plots using the “forestplot” R package22.
Nomogram and decision curve analysis (DCA)
Combining PPlncPS with independent clinical prognostic factors, a predictive model was visualized by a nomogram to predict the overall survival (OS) potential of individuals with bladder cancer using the “regplot” R package. The establishment of clinical decision curves based on the clinical features, PPlncPS score, and the combined clinical-PPlncPS score models contributed to the selection of factors for clinical application by the “ggDCA” R package.
Gene set enrichment analysis
To estimate the overall gene expression level of relevant signaling pathways, the differentially expressed genes were obtained with a p-value < 0.05 and |logFC|> 2 between the low- and high-PPlncPS score groups using the “limma” R package23. The “gseKEGG” function of the “clusterProfiler” package was performed with “minGSSize = 10” and “pvalueCutoff = 0.05”.
Characteristics comparison of the immune landscape
The heterogeneity of the immune landscape in each patient with BCa was associated with treatment response. The enrichment scores of tumor-infiltrating immune cells were calculated according to 7 types of algorithms: MCPCOUNTER, EPIC, CIBERSORT, CIBERSORT-ABS, XCELL, QUANTISEQ, and TIMER. In addition, the “ssGSEA” method was performed to evaluate 29 signatures of the tumor microenvironment using the “GSVA” R package24. Furthermore, the expression levels of 47 checkpoint molecules were compared between the low-PPlncPS score group and the high-PPlncPS score group.
Comparison of tumor mutation burden between the low- and high-PPlncPS score groups
The somatic mutation data from bladder cancer samples were harvested from UCSC Xena (https://api.gdc.cancer.gov/data/0e239d8f-47b0-4e47-9716-e9ecc87605b9). The tumor mutation burden (TMB) data were extracted by the “Maftools” R package25. The immunogenomic profile was displayed, and the total TMB per megabase was compared based on different PPlncPS score groups. Combined with PPlncPS, the survival probability of patients with different TMB statuses was further investigated.
Prognostic value of PPlncPS in patients receiving immunotherapy
The gene expression data and survival information from the IMvigor210 cohort were accessed to calculate the PPlncPS score and then estimate the prognostic value of PPlncPS in patients with urothelial carcinoma receiving an anti-PD-L1 monoclonal antibody. The KM curve was utilized to evaluate overall survival (OS).
Prediction of chemotherapy drugs
The Genomics of Drug Sensitivity in Cancer (GDSC) is a pharmacogenomics database (https://www.cancerrxgene.org/), and the chemotherapy response of each sample was predicted by referring to the GDSC. Eighteen anti-cancer sensitive drugs were evaluated. The prediction calculation was carried out via the “oncoPredict” R package26. The IC50 value was used as a parameter to estimate drug sensitivity of each sample, and the differences in IC50 value between the low- and high-PPlncPS score groups were compared and analyzed using the “Wilcox” statistical method.
Real-time polymerase chain reaction (real-time PCR)
Total RNA of bladder cancer and adjacent normal bladder tissues was extracted using TRIzol reagent (Invitrogen, Thermo Fisher Scientific, Inc.) according to the manufacturer’s instructions. Real-time PCR was subsequently performed by using TB Green Premix Ex Taq™ II (Takara Bio, Inc.). The sequences of primers are listed in Table S3. The expression data of each gene were transformed by normalization to ACTB expression and calculated as 2-[(Ct of GENES)– (Ct of ACTB)].
Statistical analysis
GraphPad Prism 9.0.0 was used for data analysis and visualization. Real-time PCR data are presented as the mean ± SEM. The differences between two groups were analyzed by Student’s t-test. For our analyses, we considered p < 0.05 to indicate a significant difference.
Ethical approval
This study complied with the ethical principles of the Declaration of Helsinki and was accepted by the Institutional Ethical Review Board of the Second Xiangya Hospital of Central South University. Committee approval number: 2022205.
Results
Screening of differentially expressed PCD (DE-PCD) genes in bladder cancer
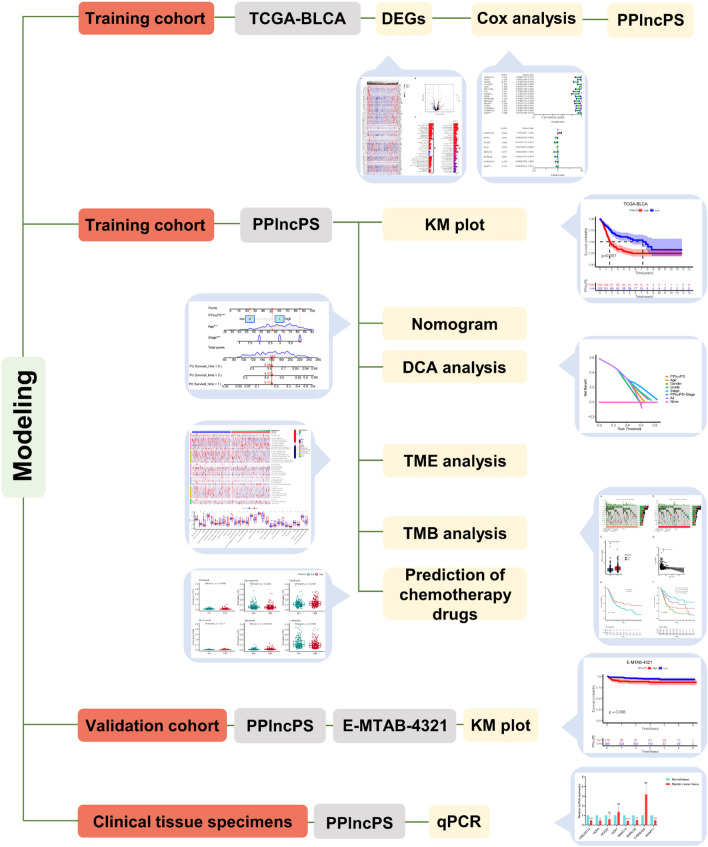
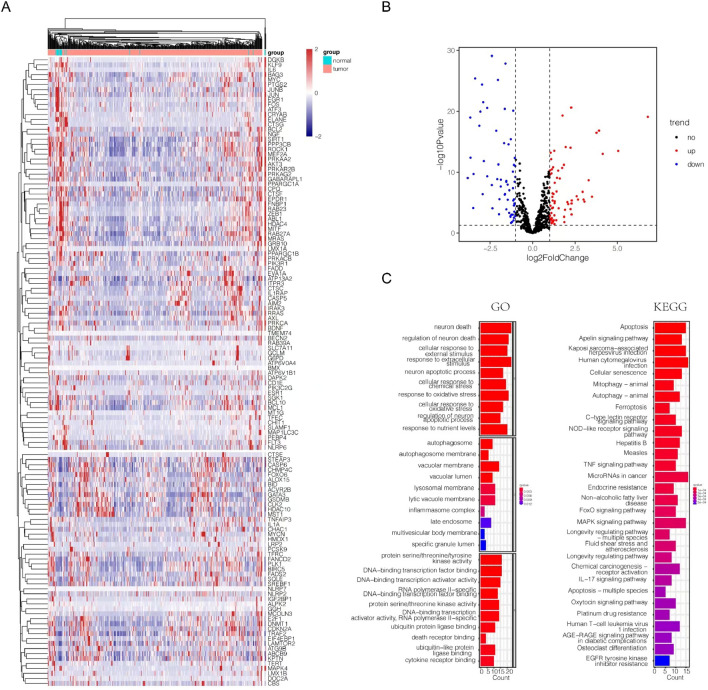
We utilized a flowchart to show the analysis process in our study (Fig. 1). A total of 818 PCD genes were utilized to compare cancer and adjacent normal bladder tissues (Fig. 2a). As a result, 62 genes were downregulated and 64 genes were upregulated in malignant samples (Fig. 2b). Subsequently, we utilized these DE-PCD genes to obtain pan-PCD-related lncRNAs for further analysis (Table S4).
Figure 1.
Flowchart showing the analysis process in our study. DEGs: differentially expressed genes; PPlncPS: pan-PCD-related lncRNA prognostic signature; KM plot: Kaplan–Meier plot; DCA: decision curve analysis; TME: tumor microenvironment; TMB: tumor mutation burden.
Figure 2.
Identification of DE-PCD genes in the TCGA-BLCA cohort and DE-PCD genes related signaling pathways enriched in GO and KEGG analysis. (a) Heatmap revealing the expression levels of 818 PCD genes between bladder cancer and adjacent normal bladder samples. (b) The volcano plot displayed DE-PCD genes discovered in tumor tissue. 64 genes showed significantly higher expression (red dots), while 62 genes showed significantly lower expression (blue dots) in bladder cancer. DE-PCD genes: differentially expressed programmed cell death-related genes; lncRNAs: long noncoding RNAs. (c) The enrichment of GO and KEGG signaling pathways. GO: gene ontology; KEGG: Kyoto Encyclopedia of Genes and Genomes; PCD: programmed cell death; DEGs: differentially expressed genes.
Functional analysis of DE-PCD genes
GO and KEGG analyses were used to investigate the function of DE-PCD genes. The top 10 signaling pathways were displayed in Fig. 2c. The DE-PCD genes revealed significant enrichment in biological processes including neuron death, cellular response to external and extracellular stimulus, neuron apoptotic process, etc. The cellular component of the DE-PCD genes in GO was mainly autophagosome, autophagosome membrane, vacuolar membrane, and vacuolar lumen. The molecular functions of the DE-PCD genes included cytokine receptor binding and death receptor binding. KEGG analysis showed that DE-PCD genes were largely related to apoptosis. In addition, autophagy, ferroptosis, and TNF signaling pathways were significantly enriched.
Development of a pan-PCD-related lncRNA prognostic signature (PPlncPS)
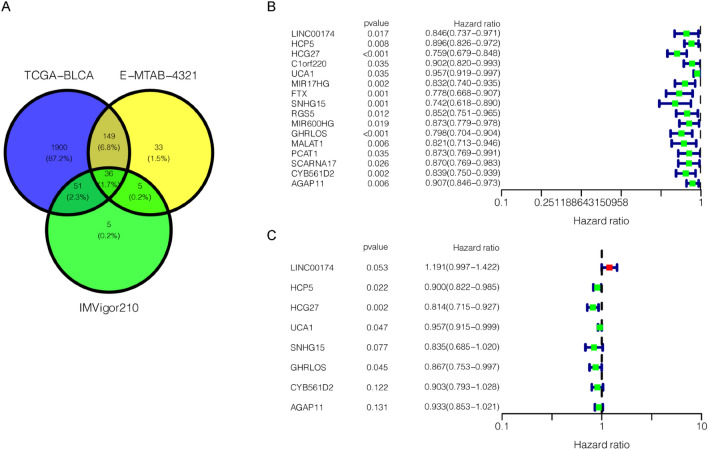
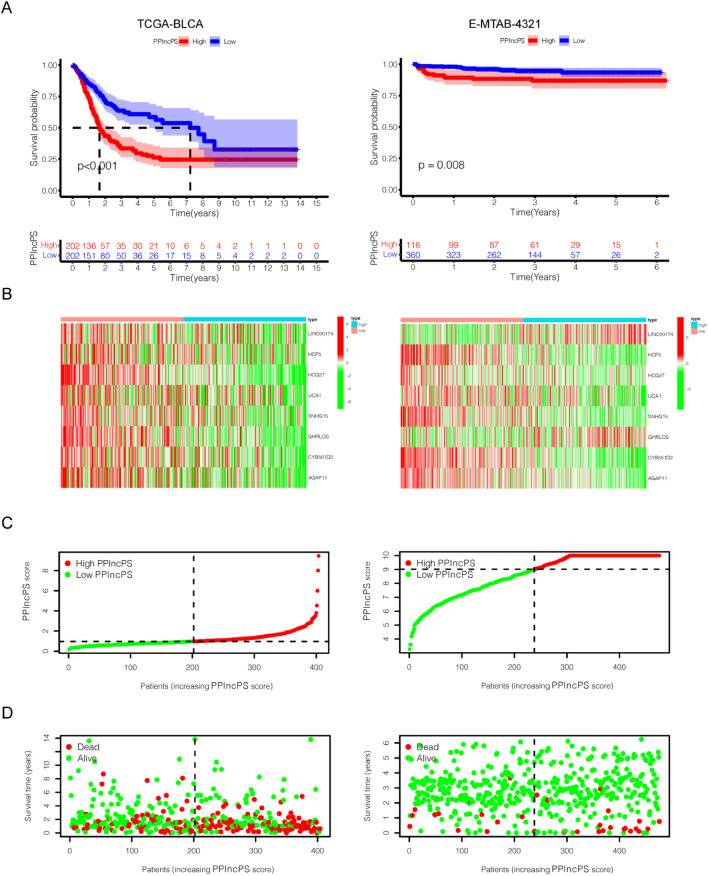
We intersected lncRNAs in the IMVigor210 cohort, E-MTAB-4321 cohort, and TCGA-BLCA cohort to identify 36 lncRNA candidates for further analysis (Fig. 3a). Among them, univariate Cox regression analysis showed 16 pan-PCD-related lncRNAs with significant prognostic value (p < 0.05) (Fig. 3b). Subsequently, multivariate Cox regression analysis was conducted, and 8 lncRNAs (LINC00174, HCP5, HCG27, UCA1, SNHG15, GHRLOS, CYB561D2, and AGAP11) were identified to generate a PPlncPS model in the TCGA-BLCA cohort (Fig. 3c). Seven pan-PCD-related lncRNAs were protective lncRNAs with a hazard ratio (HR) < 1. The formula is LINC00174*(0.175) + HCP5*(− 0.105) + HCG27*(− 0.205) + UCA1*(− 0.044) + SNHG15*(− 0.180) + GHRLOS*(− 0.143) + CYB561D2*(− 0.102) + AGAP11*(− 0.069). Based on PPlncPS, patients were classified into two groups with the median PPlncPS score as a cutoff value: the low-PPlncPS score group and the high-PPlncPS score group. The Kaplan–Meier plot showed that there was significantly higher OS in the low-PPlncPS score group of TCGA-BLCA cohort (p < 0.001), which was consistent with the E-MTAB-4321 cohort (p = 0.008) (Fig. 4a). Except LINC00174 and GHRLOS, six of the eight selected lncRNAs were expressed at low levels in the high-PPlncPS score group in both the TCGA-BLCA cohort and the E-MTAB-4321 cohort (Fig. 4b). The distributions of PPlncPS scores (Fig. 4c) and survival status (Fig. 4d) are shown. The PPlncPS performed equally well in both cohorts, suggesting that our signature was suitable for NMIBC and MIBC.
Figure 3.
Univariate and multivariate Cox regression analyses identifying independent prognostic lncRNAs. (a) Pan-PCD-related lncRNAs of bladder cancer from the overlap of the IMVigor210 cohort, E-MTAB-4321 cohort, and TCGA-BLCA cohort. (b) Univariate Cox regression analysis of pan-PCD-related lncRNAs. (c) Multivariate Cox regression analysis of pan-PCD-related lncRNAs.
Figure 4.
PPlncPS construction in bladder cancer. The results of the TCGA-BLCA cohort were presented in the left column, and the results of the E-MTAB-4321 cohort were presented in the right column. (a) Kaplan–Meier curve revealed that the patients in the low-PPlncPS score group had a better prognosis than those in the high-PPlncPS score group (p < 0.001, p = 0.008). (b) The heatmap showed that the expression patterns of LINC00174, HCP5, HCG27, UCA1, SNHG15, GHRLOS, CYB561D2, and AGAP11 between the two groups were different in both cohorts. (c,d) Distribution of patients in the TCGA-BLCA cohort and E-MTAB-4321 cohort and survival information of each patient. PPlncPS: pan-PCD-related lncRNA prognostic signature.
Prognostic value evaluation of PPlncPS
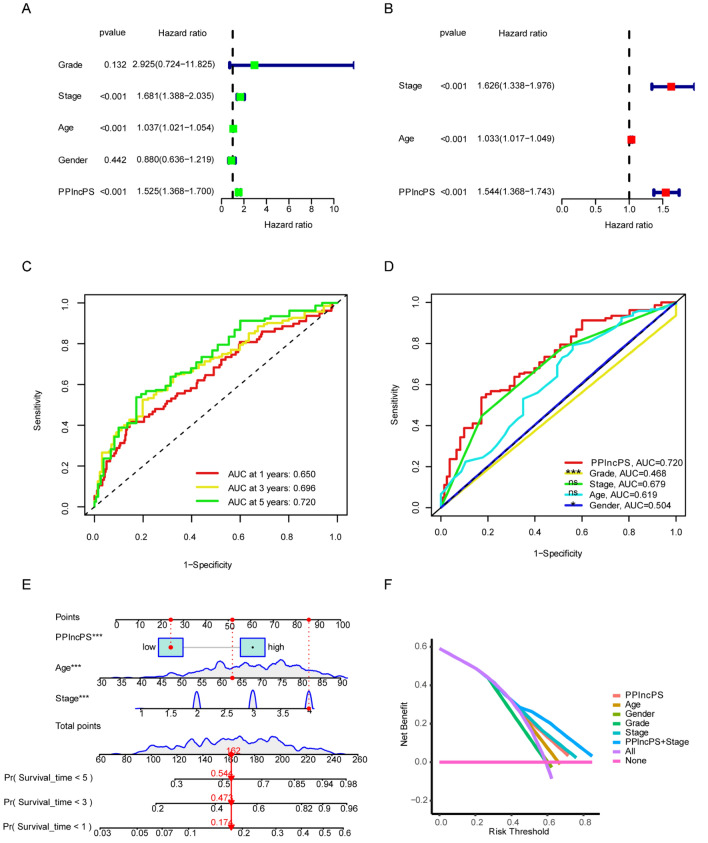
During evaluation of the prognostic value, univariate and multivariate Cox analyses indicated that stage, age, and PPlncPS score were independent prognostic factors (Fig. 5a,b). After evaluating the sensitivity and specificity of PPlncPS, ROCs at 1 year, 3 years, and 5 years were plotted, and AUCs were 0.650, 0.696, and 0.720, respectively (Fig. 5c). To estimate the accuracy, reliability, and efficiency of the prognostic model, the AUC for each clinical feature and PPlncPS score was evaluated. The AUC of the PPlncPS score at 5 years was 0.720, outweighed stage (0.679), grade (0.468), sex (0.504), and age (0.619) (Fig. 5d). We compared PPlncPS with each clinical feature as prognostic biomarkers. The results showed that PPlncPS, as well as stage and age, had better predictive effectiveness than grade and gender.
Figure 5.
Identification of independent prognostic factors based on PPlncPS score and clinical characteristics. (a,b) Prognostic analysis using univariate and multivariate Cox analyses. (c) Time-dependent ROC curves at 1, 3, and 5 years. (d) ROC curves at 5 years with the PPlncPS score and clinical features. *p < 0.05, ***p < 0.001, ns: not significant. (e) Nomogram to predict the survival probabilities at 1 year, 3 years, and 5 years. (f) Decision curve analysis (DCA) of the prognostic model predicting the net income increment risk of bladder cancer development. ROC curve: receiver operator characteristic curve.
A nomogram was generated to visualize clinical characteristics and the PPlncPS score to predict OS at 1 year, 3 years, and 5 years (Fig. 5e). Clinical decision curve analysis (DCA) suggested that the PPlncPS score combined with stage can improve the signature’s predictive accuracy (Fig. 5f).
Clinical features and signaling pathways based on PPlncPS
The heatmap of the 8 pan-PCD-related lncRNAs in our signature is shown in Fig. S1a, with clinical characteristics including clinical stage, TNM stage, grade, sex, and age. Further biological signaling pathways were analyzed by GSEA. The enrichment of chemical carcinogenesis-DNA adducts, drug-metabolism-cytochrome P450, linoleic acid metabolism, retinol metabolism and steroid hormone biosynthesis was significant in the low-PPlncPS score group. Meanwhile, adherens junction, ECM-receptor interaction, focal adhesion, microRNAs in cancer, p53 signaling pathway, proteoglycans in cancer, and the PI3K-Akt signaling pathway were involved in the high-PPlncPS score group (Fig. S1b). The outcomes above demonstrated that extracellular matrix and tumor development participated in the regulation of biological processes in the high-PPlncPS score group of BCa, while pathways related to altering metabolic status were enriched in the low-PPlncPS score group (Table S5).
Characterization of the immune landscape of patients with BCa
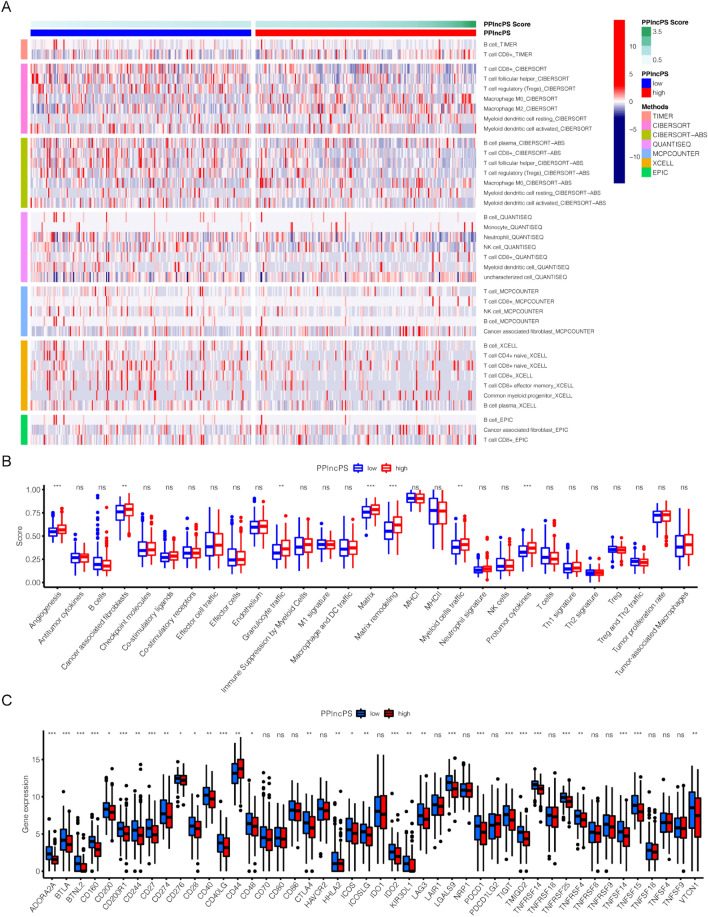
After calculating the immune infiltration score, multiple types of immune cells in the tumor microenvironment showed significantly different distributions between the low- and high-PPlncPS score groups. A variety of types of immune cells were enriched in the low-PPlncPS score group, with different colors representing different algorithm results on the left side (Fig. 6a). The detailed distribution of immune cells is summarized in Fig. S2. For instance, M0 macrophages were more recruited to the intratumor area in the high-PPlncPS score group. In addition, more cancer-associated fibroblasts were significantly involved in the high-PPlncPS score group through MCPCOUNTER and EPIC calculations (Fig. 6a). In contrast, lower infiltration of plasma B cells, CD8+ T cells, Tfh cells, Treg cells, and NK cells was observed in the high-PPlncPS score group.
Figure 6.
The immune cells, immune checkpoints, and tumor microenvironment in the low- and high-PPlncPS score groups. (a) Heatmap revealing the tumor-infiltrating immune cells in both PPlncPS score groups. (b) Twenty-nine TME signatures in the two PPlncPS score groups. (c) Expression levels of immune checkpoints between the low- and high-PPlncPS score groups. *p < 0.05, **p < 0.01, ***p < 0.001, ns: not significant. PPlncPS: pan-PCD-related lncRNA prognostic signature; TME: tumor microenvironment.
To estimate the specific effect of the tumor microenvironment (TME), 29 TME-related signatures were displayed in Fig. 6b. The scores below were remarkably elevated in the high-PPlncPS score group: angiogenesis, cancer-associated fibroblasts, granulocyte traffic, matrix, matrix remodeling, myeloid cell traffic, and protumor cytokines.
Immune checkpoints play important roles in guiding cancer therapy, so it is necessary to clarify the situational differences between the two PPlncPS score groups (Fig. 6c). In the high-PPlncPS score group, CD44 was upregulated, while other inhibitory immune checkpoints, such as CD274, CD276, CTLA4, HHLA2, PDCD1, TIGIT, and VTCN1, were downregulated. The blockade of immune checkpoints may benefit patients with low PPlncPS scores, while CD44 could be the major target of immunotherapy for patients with high PPlncPS scores.
Mutation landscape in bladder cancer patients based on the PPlncPS score
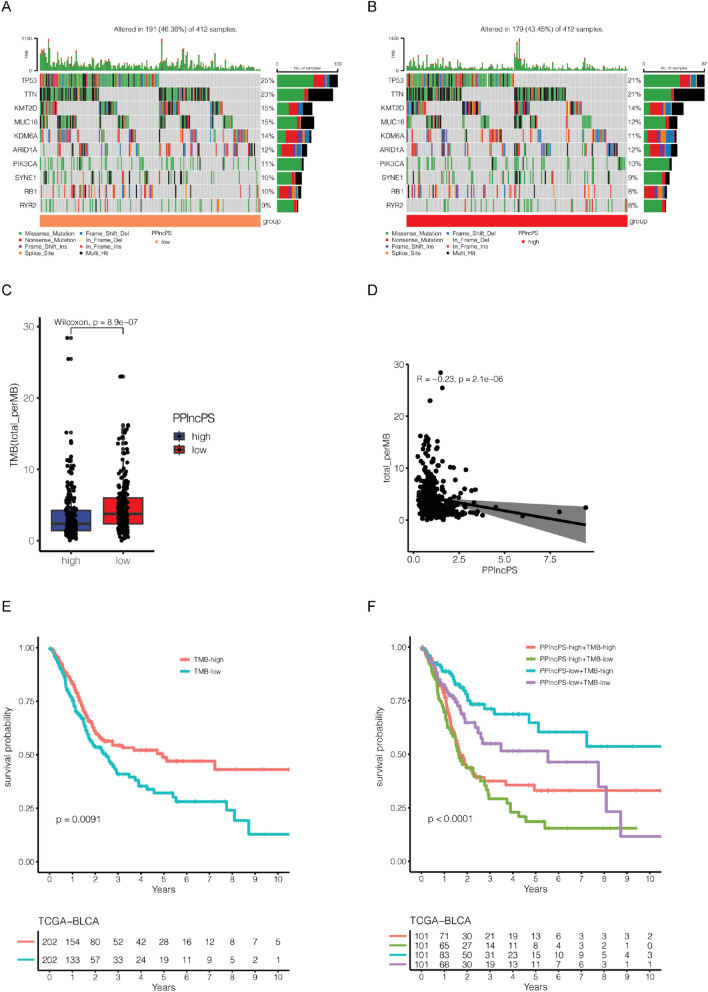
Previous studies have reported that high tumor mutation burden (TMB) predicts a good response to immunotherapy27. The mutated genes have an important effect on the processes of tumorigenesis and immune evasion. The mutation landscapes of the two PPlncPS score groups were evaluated. TP53, TTN, KMT2D, MUC16, KDM6A, ARID1A, PIK3CA, SYNE1, RB1, and RYR2 were the top 10 mutated genes with high frequency in both the low- and high-PPlncPS score groups (Fig. 7a,b). Furthermore, we used somatic mutation data and found that the low-PPlncPS group had a higher TMB level (p = 8.9e-07) (Fig. 7c). There was a negative correlation between TMB and PPlncPS score (R = − 0.23, p = 2.1e-06) (Fig. 7d). Bladder cancer patients with high TMB had a better prognosis (p = 0.0091) (Fig. 7e). Nevertheless, both the high- and low-TMB groups had heterogeneity of the PPlncPS score. We subsequently found that patients with both high TMB and low PPlncPS score had the best survival probability, while those with both low TMB and high PPlncPS score had the worst overall survival (p < 0.0001) (Fig. 7f).
Figure 7.
Mutation landscape in BLCA samples. (a) Top 10 mutated genes in the low-PPlncPS score group. (b) Top 10 mutated genes in the high-PPlncPS score group. (c) The TMB difference between the low- and high-PPlncPS score samples. (d) The correlation between PPlncPS and TMB. (e) Kaplan–Meier analysis indicated survival probability based on different levels of TMB. (f) Kaplan–Meier analysis indicated survival probability based on different levels of TMB and PPlncPS score. TMB: tumor mutation burden; PPlncPS: pan-PCD-related lncRNA prognostic signature.
The low-PPlncPS score group tended to have better clinical outcomes
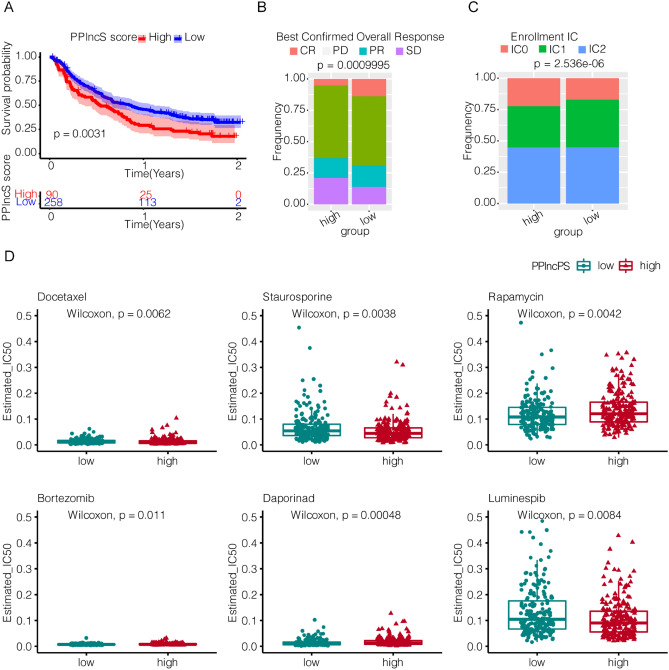
With distinct different immune landscapes between the two PPlncPS score groups, it is reasonable to evaluate the effects of immunotherapy on different PPlncPS score groups of urothelial carcinoma. The visualized results showed that after blockade of PD-L1, patients with low PPlncPS scores tended to obtain better clinical outcomes (p = 0.0031) (Fig. 8a–c). Although immunotherapy can be a potential treatment for the low-PPlncPS score patients, other treatments are required for urothelial carcinoma patients with a high PPlncPS score.
Figure 8.
Prognostic value of PPlncPS for immunotherapy in bladder cancer patients and the application of the PPlncPS model to chemotherapeutic agent options. (a) Kaplan–Meier curves revealed that the patients in the high-PPlncPS score group had a worse prognosis than those in the low-PPlncPS score group after anti-PD-L1 monoclonal antibody treatment (p = 0.0031). PPlncPS: pan-PCD-related lncRNA prognostic signature. (b) Overall response assessment of the high- and low-PPlncPS score groups to anti-PD-L1 monoclonal antibody. CR: complete response; PD: disease progression; PR: partial response; SD: stable disease. (c) Assessment of PD-L1 positive immune cell rate in the high- and low-PPlncPS score groups. (d) The IC50 values were compared between the high- and low-PPlncPS score groups. PPlncPS: pan-PCD-related lncRNA prognostic signature.
Predicting chemotherapeutic agents of priority for patients with high PPlncPS scores
Evidence suggests that certain chemotherapeutic drugs could upregulate damage-associated molecular patterns of cancer cells. Antigen-presenting cells, such as macrophages, uptake and present tumor antigens to effector cells to elicit antitumor immunity and enhance the sensitivity of malignancy to immunotherapy28. We calculated the IC50 values of 18 chemical drugs in patients treated in the TCGA-BLCA dataset. The data in Fig. 8d show that the high-PPlncPS score group was more sensitive to low doses of docetaxel (p = 0.0062), staurosporine (p = 0.0038), and luminespib (p = 0.0084). However, rapamycin (p = 0.0042), bortezomib (p = 0.011), and daporinad (p = 0.00048) were less effective in the high-PPlncPS score group. Therefore, it is demonstrated that patients with high PPlncPS scores could prefer docetaxel, staurosporine, and luminespib.
Expression pattern validation of 8 pan-PCD-related lncRNAs
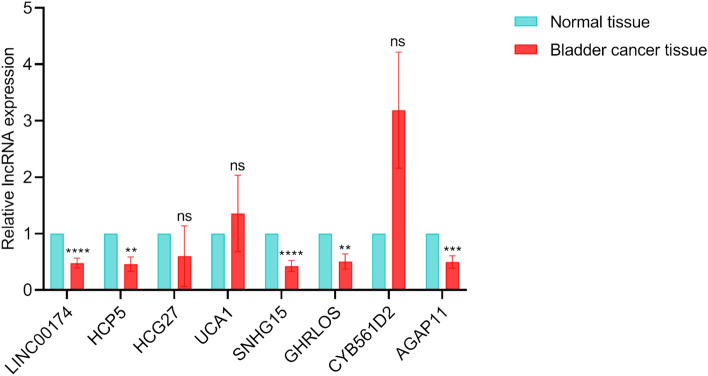
We validated the expression of LINC00174, HCP5, HCG27, UCA1, SNHG15, GHRLOS, CYB561D2, and AGAP11 in bladder cancer tissues and adjacent normal tissues by RT‒qPCR. The results showed that most lncRNAs were significantly downregulated in bladder cancer tissues apart from HCG27, UCA1, and CYB561D2 (Fig. 9).
Figure 9.
Expression patterns of 8 pan-PCD-related lncRNAs in bladder cancer and adjacent normal bladder. **p < 0.01, ***p < 0.001, ****p < 0.0001, ns: not significant; PCD: programmed cell death.
Discussion
In our study, we utilized LINC00174, HCP5, HCG27, UCA1, SNHG15, GHRLOS, CYB561D2, and AGAP11 to generate a PPlncPS, which independently distinguished patients into the low- or high-PPlncPS groups. The intrinsic cell death signature in the two groups of patients directly impacted their prognosis: the high-PPlncPS score group had significantly worse clinical outcomes and shorter OS time. The high-PPlncPS score group benefited less from immunotherapy, which was consistent with the level of immune cell infiltration and the expression patterns of immune checkpoint molecules. Hence, we explored suitable and effective chemotherapy for the two groups and found 3 potential drugs for high-PPlncPS score patients.
Many lncRNAs regulate pan-PCD in cancer, affecting the clinical characteristics and prognosis of patients. For instance, LINC00174 exerts an oncogenic effect in thymic epithelial tumors29 by suppressing cell apoptosis, promoting migration and regulating lipid metabolism. Multiple studies have revealed that HCP5 facilitates the malignant biological behavior of tumor cells by inducing proliferation and reducing apoptosis in acute myeloid leukemia30 and gastric cancer (GC)31, while another study found that HCP5 plays an opposite role in GC; it is downregulated significantly in GC tissues compared with adjacent normal tissues32. LncRNA UCA1 is overexpressed in various human cancers, including GC33, renal cancer34, and colorectal cancer35, reducing apoptosis and promoting the development and progression of these tumors. UCA1 is also involved in GC cell immune escape by protecting PD-L1 expression against the repression of miRNAs36. Combined utilization of anti-PD-1 and anti-UCA1 treatment exhibits distinct antitumor effects in bladder cancer37. In addition, UCA1 modulates autophagy38, cancer stem cell differentiation and self-renewal39. Therefore, all 8 lncRNAs are important regulators in cancer, and our study highlighted their value in the accurate prediction of prognosis for bladder cancer patients.
Signaling pathway analysis shed some light on the mechanism of tumorigenesis in the different PPlncPS groups. Retinol participates in the production of IL-10 by lymphoid cells40, the activation of natural killer lymphocytes, protein glycosylation, cellular adhesion, and cellular differentiation41. Thus, it is unsurprising that retinol metabolism was enriched in the low-PPlncPS group by modulating the immune response and oncogenesis. Furthermore, the tumor suppressor p53 is known for tumor prevention and is crucial for normal cell growth42. p53 mediates biological processes including DNA repair43, cell cycle arrest, apoptosis, senescence44,45, autophagy, and ferroptosis46,47. Moreover, p53 alters the tumor immune landscape by changing chemokine/cytokine secretion48 and modulating tumor-infiltrating T-cell and myeloid cell populations such as tumor-associated macrophages (TAMs)49 and Treg cells50. It also demonstrates that immune responses are involved in the process of programmed cell death of tumors.
Immune cells are widely involved in tumorigenesis and tumor progression. APCs, cytotoxic CD8+ cells, and NK effector cells are essential for the immune elimination of tumor cells51. Moreover, cancer cells upregulate inhibitory immune checkpoints and produce lactate to metabolically support regulatory populations for immune evasion52. lncRNAs also play a role in immune evasion53; the interaction between lncRNAs and tumor microenvironment components is tight. The tumor microenvironment (TME) contains complex components of malignant and nonmalignant cells54, and the TME plays a vital role in the immune response to immunotherapy55. According to our results, the immune landscape showed significant heterogeneity in different PPlncPS score groups, and the constructed PPlncPS is an effective tool to predict the prognosis of patients with BCa. In the high-PPlncPS score group, increased infiltration of cancer-associated fibroblasts enhanced tumor matrix remodeling, and a combination of cancer-associated fibroblast activation and tumor matrix remodeling led to poor immune infiltration. Low immune cell infiltration and low expression of immune checkpoint molecules might explain why patients with high PPlncPS scores tended to benefit less from anti-PD-L1 monoclonal antibody therapy. TGF-β is one of the fibrogenic growth factors. Suppressing TGF-β ameliorates matrix remodeling in tumors. Inhibiting PD-L1 and TGF-β simultaneously may result in superior survival in bladder cancer patients with a high PPlncPS score56. Moreover, we combined the PPlncPS score and TMB, and patients with a low PPlncPS score and high TMB may benefit the most from immunotherapy.
In addition, other treatments aside from immunotherapy were required for patients with a high PPlncPS score. Chemotherapy works by inducing different programmed cell death pathways for antitumor defense9,10. Our results also demonstrated that the utilization of staurosporine, docetaxel, and luminespib is effective in the high-PPlncPS score group. Our results are indicative for individual patients to guide subsequent therapy based on their PPlncPS scores.
Nevertheless, there are some limitations in this study. More patients are further required for validation and the recommended treatment based on PPlncPS needs to be investigated in the clinical work.
Conclusions
In summary, we constructed and validated the PPlncPS to provide a prognostic prediction for bladder cancer and characterized the immunogenomic profile. Our study provides some clues on individualized, precise diagnosis and treatment for patients with bladder cancer.
Supplementary Information
Author contributions
MP and HTW designed the study. MP analyzed and interpreted the data. JY carried out experiments and wrote the manuscript. LSZ and BZ reviewed and edited the manuscript. All authors read and approved the manuscript.
Funding
This study was supported by The Science and Technology Innovation Program of Hunan Province (2021SK53507), and Natural Science Foundation of Hunan Province (2021JJ30984, 2022JJ30831), and Health Research Project of Hunan Provincial Health Commission (W20243110).
Data availability
The datasets used and analyzed during the current study are available from the corresponding author on reasonable request.
Competing interests
The authors declare no competing interests.
Footnotes
Publisher's note
Springer Nature remains neutral with regard to jurisdictional claims in published maps and institutional affiliations.
Contributor Information
Hongtao Wu, Email: wht168@csu.edu.cn.
Mou Peng, Email: pengmou@csu.edu.cn.
Supplementary Information
The online version contains supplementary material available at 10.1038/s41598-024-68859-w.
References
- 1.Zi, H. et al. Global, regional, and national burden of kidney, bladder, and prostate cancers and their attributable risk factors, 1990–2019. Mil. Med. Res.8, 60. 10.1186/s40779-021-00354-z (2021). 10.1186/s40779-021-00354-z [DOI] [PMC free article] [PubMed] [Google Scholar]
- 2.Sung, H. et al. Global Cancer Statistics 2020: GLOBOCAN Estimates of Incidence and Mortality Worldwide for 36 Cancers in 185 Countries. CA Cancer J. Clin.71, 209–249. 10.3322/caac.21660 (2021). 10.3322/caac.21660 [DOI] [PubMed] [Google Scholar]
- 3.Moch, H., Cubilla, A. L., Humphrey, P. A., Reuter, V. E. & Ulbright, T. M. The 2016 WHO Classification of Tumours of the Urinary System and Male Genital Organs-Part A: Renal, Penile, and Testicular Tumours. Eur. Urol.70, 93–105. 10.1016/j.eururo.2016.02.029 (2016). 10.1016/j.eururo.2016.02.029 [DOI] [PubMed] [Google Scholar]
- 4.Lenis, A. T., Lec, P. M., Chamie, K. & Mshs, M. D. Bladder Cancer: A review. JAMA324, 1980–1991. 10.1001/jama.2020.17598 (2020). 10.1001/jama.2020.17598 [DOI] [PubMed] [Google Scholar]
- 5.Jin, Y. H. et al. Treatment and surveillance for non-muscle-invasive bladder cancer: a clinical practice guideline. Mil. Med. Res.10.1186/s40779-022-00406-y (2022). 10.1186/s40779-022-00406-y [DOI] [PMC free article] [PubMed] [Google Scholar]
- 6.Shi, Z. D. et al. Targeting HNRNPU to overcome cisplatin resistance in bladder cancer. Mol. Cancer21, 37. 10.1186/s12943-022-01517-9 (2022). 10.1186/s12943-022-01517-9 [DOI] [PMC free article] [PubMed] [Google Scholar]
- 7.Liu, S. et al. Loss of EMP1 promotes the metastasis of human bladder cancer cells by promoting migration and conferring resistance to ferroptosis through activation of PPAR gamma signaling. Free Radic. Biol. Med.189, 42–57. 10.1016/j.freeradbiomed.2022.06.247 (2022). 10.1016/j.freeradbiomed.2022.06.247 [DOI] [PubMed] [Google Scholar]
- 8.Liao, P. et al. CD8(+) T cells and fatty acids orchestrate tumor ferroptosis and immunity via ACSL4. Cancer Cell10.1016/j.ccell.2022.02.003 (2022). 10.1016/j.ccell.2022.02.003 [DOI] [PMC free article] [PubMed] [Google Scholar]
- 9.Yu, B., Choi, B., Li, W. & Kim, D. H. Magnetic field boosted ferroptosis-like cell death and responsive MRI using hybrid vesicles for cancer immunotherapy. Nat. Commun.11, 3637. 10.1038/s41467-020-17380-5 (2020). 10.1038/s41467-020-17380-5 [DOI] [PMC free article] [PubMed] [Google Scholar]
- 10.Ye, L., Jin, F., Kumar, S. K. & Dai, Y. The mechanisms and therapeutic targets of ferroptosis in cancer. Expert Opin. Ther. Targets25, 965–986. 10.1080/14728222.2021.2011206 (2021). 10.1080/14728222.2021.2011206 [DOI] [PubMed] [Google Scholar]
- 11.Zhan, Y. et al. Long non-coding RNA SOX2OT promotes the stemness phenotype of bladder cancer cells by modulating SOX2. Mol. Cancer19, 25. 10.1186/s12943-020-1143-7 (2020). 10.1186/s12943-020-1143-7 [DOI] [PMC free article] [PubMed] [Google Scholar]
- 12.Zheng, R. et al. Exosome-transmitted long non-coding RNA PTENP1 suppresses bladder cancer progression. Mol. Cancer17, 143. 10.1186/s12943-018-0880-3 (2018). 10.1186/s12943-018-0880-3 [DOI] [PMC free article] [PubMed] [Google Scholar]
- 13.Huang, C. S. et al. Long Noncoding RNA LINC02470 Sponges MicroRNA-143–3p and Enhances SMAD3-Mediated Epithelial-to-Mesenchymal Transition to Promote the Aggressive Properties of Bladder Cancer. Cancers (Basel)10.3390/cancers14040968 (2022). 10.3390/cancers14040968 [DOI] [PMC free article] [PubMed] [Google Scholar]
- 14.Yang, G., Li, Z., Dong, L. & Zhou, F. lncRNA ADAMTS9-AS1 promotes bladder cancer cell invasion, migration, and inhibits apoptosis and autophagy through PI3K/AKT/mTOR signaling pathway. Int. J. Biochem. Cell Biol.10.1016/j.biocel.2021.106069 (2021). 10.1016/j.biocel.2021.106069 [DOI] [PubMed] [Google Scholar]
- 15.Zhang, L. & Peng, M. Integrated bioinformatic analysis identified a novel prognostic pan-programmed cell death signature for bladder cancer. Front Immunol.13, 1030097. 10.3389/fimmu.2022.1030097 (2022). 10.3389/fimmu.2022.1030097 [DOI] [PMC free article] [PubMed] [Google Scholar]
- 16.Balar, A. V. et al. Atezolizumab as first-line treatment in cisplatin-ineligible patients with locally advanced and metastatic urothelial carcinoma: a single-arm, multicentre, phase 2 trial. Lancet389, 67–76. 10.1016/S0140-6736(16)32455-2 (2017). 10.1016/S0140-6736(16)32455-2 [DOI] [PMC free article] [PubMed] [Google Scholar]
- 17.Love, M. I., Huber, W. & Anders, S. Moderated estimation of fold change and dispersion for RNA-seq data with DESeq2. Genome Biol.15, 550. 10.1186/s13059-014-0550-8 (2014). 10.1186/s13059-014-0550-8 [DOI] [PMC free article] [PubMed] [Google Scholar]
- 18.Wickham, H. ggplot2: Elegant Graphics for Data Analysis (Springer, 2016). [Google Scholar]
- 19.Kolde, R. Pheatmap: pretty heatmaps. R. Package Vers.1(2), 726 (2019). [Google Scholar]
- 20.Wu, T. et al. clusterProfiler 4.0: A universal enrichment tool for interpreting omics data. Innovation (Camb)10.1016/j.xinn.2021.100141 (2021). 10.1016/j.xinn.2021.100141 [DOI] [PMC free article] [PubMed] [Google Scholar]
- 21.Yu, G., Wang, L. G., Yan, G. R. & He, Q. Y. DOSE: an R/Bioconductor package for disease ontology semantic and enrichment analysis. Bioinformatics31, 608–609. 10.1093/bioinformatics/btu684 (2015). 10.1093/bioinformatics/btu684 [DOI] [PubMed] [Google Scholar]
- 22.ForestPlots.net, et al. Taking the pulse of Earth’s tropical forests using networks of highly distributed plots. Biol. Conserv.10.1016/j.biocon.2020.108849 (2021). 10.1016/j.biocon.2020.108849 [DOI] [Google Scholar]
- 23.Ritchie, M. E. et al. limma powers differential expression analyses for RNA-sequencing and microarray studies. Nucleic Acids Res.43, e47. 10.1093/nar/gkv007 (2015). 10.1093/nar/gkv007 [DOI] [PMC free article] [PubMed] [Google Scholar]
- 24.Hanzelmann, S., Castelo, R. & Guinney, J. GSVA: gene set variation analysis for microarray and RNA-seq data. BMC Bioinform.14, 7. 10.1186/1471-2105-14-7 (2013). 10.1186/1471-2105-14-7 [DOI] [PMC free article] [PubMed] [Google Scholar]
- 25.Mayakonda, A., Lin, D. C., Assenov, Y., Plass, C. & Koeffler, H. P. Maftools: Efficient and comprehensive analysis of somatic variants in cancer. Genome Res.28, 1747–1756. 10.1101/gr.239244.118 (2018). 10.1101/gr.239244.118 [DOI] [PMC free article] [PubMed] [Google Scholar]
- 26.Maeser, D., Gruener, R. F. & Huang, R. S. oncoPredict: an R package for predicting in vivo or cancer patient drug response and biomarkers from cell line screening data. Brief. Bioinform.10.1093/bib/bbab260 (2021). 10.1093/bib/bbab260 [DOI] [PMC free article] [PubMed] [Google Scholar]
- 27.Zheng, M. Tumor mutation burden for predicting immune checkpoint blockade response: the more, the better. J. Immunother. Cancer10.1136/jitc-2021-003087 (2022). 10.1136/jitc-2021-003087 [DOI] [PMC free article] [PubMed] [Google Scholar]
- 28.Meric-Bernstam, F., Larkin, J., Tabernero, J. & Bonini, C. Enhancing anti-tumour efficacy with immunotherapy combinations. Lancet397, 1010–1022. 10.1016/s0140-6736(20)32598-8 (2021). 10.1016/s0140-6736(20)32598-8 [DOI] [PubMed] [Google Scholar]
- 29.Tito, C. et al. LINC00174 is a novel prognostic factor in thymic epithelial tumors involved in cell migration and lipid metabolism. Cell. Death Dis.11, 959. 10.1038/s41419-020-03171-9 (2020). 10.1038/s41419-020-03171-9 [DOI] [PMC free article] [PubMed] [Google Scholar]
- 30.Liu, Y., Jing, X. B., Wang, Z. C. & Han, Q. K. HCP5, as the sponge of miR-1291, facilitates AML cell proliferation and restrains apoptosis via increasing PIK3R5 expression. Hum. Genom.15, 38. 10.1186/s40246-021-00340-5 (2021). 10.1186/s40246-021-00340-5 [DOI] [PMC free article] [PubMed] [Google Scholar]
- 31.Yin, D. & Lu, X. Silencing of long non-coding RNA HCP5 inhibits proliferation, invasion, migration, and promotes apoptosis via regulation of miR-299-3p/SMAD5 axis in gastric cancer cells. Bioengineered12, 225–239. 10.1080/21655979.2020.1863619 (2021). 10.1080/21655979.2020.1863619 [DOI] [PMC free article] [PubMed] [Google Scholar]
- 32.Chen, W. et al. MEF2A-mediated lncRNA HCP5 Inhibits Gastric Cancer Progression via MiR-106b-5p/p21 Axis. Int. J. Biol. Sci.17, 623–634. 10.7150/ijbs.55020 (2021). 10.7150/ijbs.55020 [DOI] [PMC free article] [PubMed] [Google Scholar]
- 33.Yang, A. et al. LncRNA UCA1 promotes development of gastric cancer via the miR-145/MYO6 axis. Cell. Mol. Biol. Lett.26, 33. 10.1186/s11658-021-00275-8 (2021). 10.1186/s11658-021-00275-8 [DOI] [PMC free article] [PubMed] [Google Scholar]
- 34.Wang, W. et al. Long non-coding RNA UCA1 promotes malignant phenotypes of renal cancer cells by modulating the miR-182–5p/DLL4 axis as a ceRNA. Mol. Cancer10.1186/s12943-020-1132-x (2020). 10.1186/s12943-020-1132-x [DOI] [PMC free article] [PubMed] [Google Scholar]
- 35.Jin, Y. et al. Endoplasmic reticulum-resident protein Sec62 drives colorectal cancer metastasis via MAPK/ATF2/UCA1 axis. Cell Prolif.10.1111/cpr.13253 (2022). 10.1111/cpr.13253 [DOI] [PMC free article] [PubMed] [Google Scholar]
- 36.Wang, C. J. et al. The lncRNA UCA1 promotes proliferation, migration, immune escape and inhibits apoptosis in gastric cancer by sponging anti-tumor miRNAs. Mol. Cancer18, 115. 10.1186/s12943-019-1032-0 (2019). 10.1186/s12943-019-1032-0 [DOI] [PMC free article] [PubMed] [Google Scholar]
- 37.Zhen, S., Lu, J., Chen, W., Zhao, L. & Li, X. Synergistic Antitumor Effect on Bladder Cancer by Rational Combination of Programmed Cell Death 1 Blockade and CRISPR-Cas9-Mediated Long Non-Coding RNA Urothelial Carcinoma Associated 1 Knockout. Hum. Gene. Ther.29, 1352–1363. 10.1089/hum.2018.048 (2018). 10.1089/hum.2018.048 [DOI] [PubMed] [Google Scholar]
- 38.Li, J. J. et al. Long non-coding RNA UCA1 promotes autophagy by targeting miR-96-5p in acute myeloid leukaemia. Clin. Exp. Pharmacol. Physiol.47, 877–885. 10.1111/1440-1681.13259 (2020). 10.1111/1440-1681.13259 [DOI] [PubMed] [Google Scholar]
- 39.Gao, Z. et al. Exosomal lncRNA UCA1 modulates cervical cancer stem cell self-renewal and differentiation through microRNA-122–5p/SOX2 axis. J. Trans. Med.10.1186/s12967-021-02872-9 (2021). 10.1186/s12967-021-02872-9 [DOI] [PMC free article] [PubMed] [Google Scholar]
- 40.Golebski, K. et al. Induction of IL-10-producing type 2 innate lymphoid cells by allergen immunotherapy is associated with clinical response. Immunity10.1016/j.immuni.2020.12.013 (2021). 10.1016/j.immuni.2020.12.013 [DOI] [PubMed] [Google Scholar]
- 41.Melis, M., Tang, X. H., Trasino, S. E. & Gudas, L. J. Retinoids in the Pathogenesis and Treatment of Liver Diseases. Nutrients10.3390/nu14071456 (2022). 10.3390/nu14071456 [DOI] [PMC free article] [PubMed] [Google Scholar]
- 42.Boutelle, A. M. & Attardi, L. D. p53 and Tumor Suppression: It takes a network. Trends. Cell Biol.31, 298–310. 10.1016/j.tcb.2020.12.011 (2021). 10.1016/j.tcb.2020.12.011 [DOI] [PMC free article] [PubMed] [Google Scholar]
- 43.Wang, Y. H. et al. Rapid recruitment of p53 to DNA damage sites directs DNA repair choice and integrity. Proc. Natl. Acad. Sci. U S A10.1073/pnas.2113233119 (2022). 10.1073/pnas.2113233119 [DOI] [PMC free article] [PubMed] [Google Scholar]
- 44.Engeland, K. Cell cycle regulation: p53–p21-RB signaling. Cell Death Differ.29, 946–960. 10.1038/s41418-022-00988-z (2022). 10.1038/s41418-022-00988-z [DOI] [PMC free article] [PubMed] [Google Scholar]
- 45.Peng, Y. et al. Mechano-signaling via Piezo1 prevents activation and p53-mediated senescence of muscle stem cells. Redox Biol.10.1016/j.redox.2022.102309 (2022). 10.1016/j.redox.2022.102309 [DOI] [PMC free article] [PubMed] [Google Scholar]
- 46.Ma, Z. et al. p53/microRNA-214/ULK1 axis impairs renal tubular autophagy in diabetic kidney disease. J. Clin. Invest.130, 5011–5026. 10.1172/JCI135536 (2020). 10.1172/JCI135536 [DOI] [PMC free article] [PubMed] [Google Scholar]
- 47.Li, Y. et al. Inhibitor of apoptosis-stimulating protein of p53 inhibits ferroptosis and alleviates intestinal ischemia/reperfusion-induced acute lung injury. Cell Death Differ.27, 2635–2650. 10.1038/s41418-020-0528-x (2020). 10.1038/s41418-020-0528-x [DOI] [PMC free article] [PubMed] [Google Scholar]
- 48.Ghosh, M. et al. Mutant p53 suppresses innate immune signaling to promote tumorigenesis. Cancer Cell39, 494-508.e495. 10.1016/j.ccell.2021.01.003 (2021). 10.1016/j.ccell.2021.01.003 [DOI] [PMC free article] [PubMed] [Google Scholar]
- 49.Walton, J. et al. CRISPR/Cas9-Mediated Trp53 and Brca2 Knockout to Generate Improved Murine Models of Ovarian High-Grade Serous Carcinoma. Cancer Res.76, 6118–6129. 10.1158/0008-5472.CAN-16-1272 (2016). 10.1158/0008-5472.CAN-16-1272 [DOI] [PMC free article] [PubMed] [Google Scholar]
- 50.Togashi, Y., Shitara, K. & Nishikawa, H. Regulatory T cells in cancer immunosuppression—Implications for anticancer therapy. Nat. Rev. Clin. Oncol.16, 356–371. 10.1038/s41571-019-0175-7 (2019). 10.1038/s41571-019-0175-7 [DOI] [PubMed] [Google Scholar]
- 51.Mellman, I., Coukos, G. & Dranoff, G. Cancer immunotherapy comes of age. Nature480, 480–489. 10.1038/nature10673 (2011). 10.1038/nature10673 [DOI] [PMC free article] [PubMed] [Google Scholar]
- 52.Watson, M. J. et al. Metabolic support of tumour-infiltrating regulatory T cells by lactic acid. Nature591, 645–651. 10.1038/s41586-020-03045-2 (2021). 10.1038/s41586-020-03045-2 [DOI] [PMC free article] [PubMed] [Google Scholar]
- 53.Shi, L. et al. LncRNA IFITM4P promotes immune escape by up-regulating PD-L1 via dual mechanism in oral carcinogenesis. Mol. Ther.30, 1564–1577. 10.1016/j.ymthe.2022.01.003 (2022). 10.1016/j.ymthe.2022.01.003 [DOI] [PMC free article] [PubMed] [Google Scholar]
- 54.DeBerardinis, R. J. Tumor Microenvironment, Metabolism, and Immunotherapy. N. Engl. J. Med.382, 869–871. 10.1056/NEJMcibr1914890 (2020). 10.1056/NEJMcibr1914890 [DOI] [PubMed] [Google Scholar]
- 55.Bagaev, A. et al. Conserved pan-cancer microenvironment subtypes predict response to immunotherapy. Cancer Cell10.1016/j.ccell.2021.04.014 (2021). 10.1016/j.ccell.2021.04.014 [DOI] [PubMed] [Google Scholar]
- 56.Lan, Y. et al. Simultaneous targeting of TGF-beta/PD-L1 synergizes with radiotherapy by reprogramming the tumor microenvironment to overcome immune evasion. Cancer Cell10.1016/j.ccell.2021.08.008 (2021). 10.1016/j.ccell.2021.08.008 [DOI] [PubMed] [Google Scholar]
Associated Data
This section collects any data citations, data availability statements, or supplementary materials included in this article.
Supplementary Materials
Data Availability Statement
The datasets used and analyzed during the current study are available from the corresponding author on reasonable request.


