

Abstract
Background
Infections caused by multi-drug resistant Gram-negative pathogens are associated with worse clinical outcomes in critically ill patients. We evaluated hospital outcomes based on adequacy of overall and newer antibacterial therapy for Enterobacterales (ENT) and Pseudomonas aeruginosa (PsA) in US patients.
Methods
Hospitalized adults ≥ 18 years old with facility-reported antibiotic susceptibility from 2018–2022 across 161 facilities in the BD Insights Research Database were identified as ENT- or PsA-positive. Generalized linear mixed models were used to evaluate the impact of inadequate empiric therapy (IET) and time to initiate newer antibacterials (ceftazidime-avibactam; ceftolozane-tazobactam; cefiderocol; meropenem-vaborbactam; eravacycline; and imipenem-cilcastatin-relebactam) on hospital mortality and post-culture length of stay (LOS).
Results
Among 229,320 ENT and 36,027 PsA susceptibility results, 1.7% and 16.8% were carbapenem non-susceptible (carb-NS), respectively. Median time to first susceptibility result was longer for carb-NS vs. carb susceptible in ENT (64 h vs. 48 h) and PsA (67 h vs. 60 h). For ENT, IET was associated with significantly higher mortality (odds ratio [OR],1.29 [95% CI, 1.16–1.43, P < 0.0001]) and longer hospital LOS (14.8 vs. 13.3, P < 0.0001). Delayed start to newer antibacterial therapy was associated with significantly greater hospital mortality for ENT (P = 0.0182) and PsA (P = 0.0249) and significantly longer post-culture LOS for ENT (P < 0.0001) and PsA (P < 0.0001).
Conclusions
Overall, IET and delayed use of newer antibacterials are associated with significantly worse hospital outcomes. More rapid identification of high-risk patients can facilitate adequate therapy and timely use of newer antibacterials developed for resistant Gram-negative pathogens.
Supplementary Information
The online version contains supplementary material available at 10.1186/s12879-024-09700-7.
Keywords: Newer antibacterial therapy, Empiric therapy, Enterobacterales, Outcomes, Pseudomonas aeruginosa, Timing
Background
Antibacterial resistance continues to be a serious threat to public health, accounting for nearly 5 million deaths worldwide annually [1]. Notably, infections caused by multi-drug resistant (MDR) Gram-negative pathogens have become increasingly problematic in healthcare settings and are associated with worse clinical outcomes in critically ill patients [2, 3].
Among these pathogens, carbapenem-resistant Enterobacterales (CRE) is classified as an “urgent threat” by the US Centers for Disease Control and Prevention (CDC) and was responsible for an estimated 1100 deaths among more than 13,000 cases in 2017 [4]. Importantly, the World Health Organization (WHO) has designated several carbapenem-resistant Gram-negative pathogens as highest priorities for development of new antibacterials, including Enterobacterales and Pseudomonas aeruginosa [5].
Rates of inadequate empiric therapy (IET), defined as antibacterial therapy not active against the identified bacterial pathogen, are high in patients infected with antibacterial resistant (ABR) or multi-drug resistance (MDR) pathogens. IET could also occur more often or for longer periods of time in MDR, since newer treatment options for resistant pathogens are often started only when diagnostic results are available or when patients do not respond to other therapies [6–8]. For example, in a recent analysis from July 2019 through October 2021 of nearly 300,000 US hospital admissions with positive bacteria cultures, higher IET rates were found in subgroups of patients with ABR or MDR infections compared with the overall cohort [6]. While IET occurred at higher rates in ABR and MDR subgroups for all pathogens, rates for Enterobacterales and P. aeruginosa were markedly higher versus the overall population. For Enterobacterales, IET rates were 14.1% for the overall cohort, 27.8% for the ABR-positive group, and 40% for the MDR-positive group while IET rates for P. aeruginosa were 36.8% for the overall cohort, 46.6% for ABR, and 57.1% for MDR [6].
IET is associated with increased mortality, hospitalization, and hospital readmission rates, as well as longer length of stay (LOS), greater incidence of treatment failure, additional antibiotic prescriptions, and higher costs [9–14]. Moreover, delays in appropriate antibacterial therapy have also been associated with poor outcomes [15–17].
Although several newer antibacterials known to be effective against CRE and carbapenem-resistant P. aeruginosa are available, clinical trial data for these agents are derived from non-inferiority trials [18]. Further, real-world evidence to demonstrate how to best utilize most of these therapies are lacking. Therefore, in this study, we sought to evaluate hospital outcomes based on the adequacy of overall and newer antibacterial therapy for Enterobacterales (ENT) and P. aeruginosa (PsA) in adult patients.
Methods
Design and patients
This study was a multicenter, retrospective cohort analysis of data from 161 US medical facilities in the BD Insights Research Database (Becton, Dickinson & Company, Franklin Lakes, NJ), which includes medical care facilities throughout the US [19]. The retrospective, de-identified data set was approved and informed consent requirements were waived by the New England Institutional Review Board (Wellesley, MA, USA; IRB No. 120180023).
Eligible patients included hospitalized adults (≥ 18 years old) with 1 to 365 days inpatient stay, ≥ 24 h of antibacterial therapy, and a record of discharge or death between March 1, 2018, and December 31, 2022. Bacterial culture sites included respiratory, blood, urine, intra-abdominal, and other specimens. Microbiology results likely associated with surveillance cultures (eg, nasal or rectal swabs) and environmental cultures were excluded by previously described methodology that uses source, time of collection, microorganism type, and number of microorganisms in a culture to flag likely contaminated samples [20].
Study outcomes
The major outcomes of interest were impact of IET, turnaround time (TAT) for first culture susceptibility result, and time to start of newer antibacterials on hospital outcomes (mortality and post-culture length of stay [LOS]) in hospitalized adult patients with a non-contaminant positive culture for ENT (Escherichia coli, Klebsiella pneumoniae, Klebsiella oxytoca, Enterobacter aerogenes, Enterobacter cloacae, Serratia marcescens, Citrobacter freundii, Proteus mirabilis, Providencia stuartii and Morganella morganii) or PsA.
IET was defined as antibacterial therapy prescribed within 48 h prior to culture collection until first susceptibility results that did not cover the pathogen bacteria or to which the pathogen bacteria were subsequently reported as non-susceptible (NS; laboratory result of intermediate resistance or resistant). Patients who were not prescribed empiric therapy but were prescribed definitive therapy within 48 h of receiving pathogen susceptibility results were included in the IET group. The designation of IET was restricted to patients with no adequate antibacterial agent prescribed from 48 h prior to culture collection to the first susceptibility result of a positive culture. A patient who received multiple antibacterials with at least one active therapy was not categorized as IET. Culture TAT was defined as the date/time of first susceptibility results minus the date/time of culture collection. Time to newer antibacterial therapy was defined as time from index culture collection to start of the first newer antibacterial therapy, which included ceftazidime-avibactam; ceftolozane-tazobactam; cefiderocol; meropenem-vaborbactam (ENT only); eravacycline (ENT only); imipenem-cilcastatin-relebactam.
Statistical analyses
Statistical analyses were conducted separately for ENT and PsA study cohorts. For each analysis, the analytical objectives were to evaluate the impact of IET on hospital mortality and post-culture LOS and to evaluate the effect of time to newer antibacterial therapy.
Covariates considered included patient demographics, COVID-19 testing status, and multiple clinical factors, including culture sources; carbapenem susceptibility status; turnaround time from culture collection to first susceptibility result; intensive care unit admission status; onset period (admission, hospital), poly-pathogen status (ENT, PsA, Acinetobacter baumannii); prior 90-day hospitalization, and comorbidities at index culture collection (renal insufficiency, liver dysfunction, heart failure, immunocompromised, cytokine storm, and lactic acid) [10].
Descriptive tables of study outcomes by IET status and time to newer antibacterial therapy explored the relationship of each outcome with IET and time to newer antibacterial therapy. The generalized estimating equation method was used to model hospital mortality and assess IET impact. Odds ratios of IET versus appropriate empiric therapy (AET) are reported with adjustment for covariates. To assess the effect of IET on post-culture LOS, we used the generalized linear mixed models method with gamma distribution and the logarithm link function for handling right-skewed LOS data. Model-estimated hospital LOS by IET status was reported with statistical comparisons. All analyses were conducted using SAS version 9.4 (SAS Institute, Cary, NC, USA).
Results
The majority (83.2%) of the 161 hospitals evaluated were in urban locations and 62.7% were non-teaching hospitals (Supplementary Table 1). Of 229,320 ENT culture-positive susceptibility results, 1.7% (3956) were carbapenem-NS (carb-NS) and among 36,027 PsA culture-positive susceptibility results, 16.8% (6057) were carb-NS (Table 1). The median TAT was 48 h for ENT, 64 h for carb-NS, and 48 h for carb-S. The median TAT for PsA was 61 h, 67 h for carb-NS, and 60 h for carb-S. Nearly twice the number of cultures were collected in the hospital-onset setting (36%) for the PsA cohort versus the ENT cohort (17%).
Table 1.
Clinical characteristics and outcomes: Observed data by ENT and PsA status
| ENT Cohort | PsA Cohort | ||||||||
|---|---|---|---|---|---|---|---|---|---|
|
Hospital Mortality |
Post-Culture LOS |
Hospital Mortality |
Post-Culture LOS | ||||||
| Characteristic | n (%) | n | Events (%) | Mean ± SD (IQR range; median) |
n (%) | n | Events (%) | Mean ± SD (IQR range; median) |
|
| Overall population |
229,320 (100) |
97,941 |
4963 (5.1) |
9.2 ± 11.8 (4–10; 6) |
36,027 (100) |
14,625 | 1542 (10.5) | 11.5 ± 17.3 (5–13; 8) | |
| COVID-19 | Not tested |
131,110 (57.17) |
28,777 |
953 (3.3) |
8.5 ± 9.42 (4–9; 6) |
19,639 (54.51) |
3513 | 255 (7.3) | 10.3 ± 12.8 (5–12; 7) |
| Negative |
88,208 (38.47 |
61,767 | 2850 (4.6) | 9.9 ± 14 (5–11; 7) | 14,331 (39.78) | 9583 | 853 (8.9) | 12.5 ± 21.5 (5–14; 8) | |
| Positive |
10,002 (4.36) |
7397 |
1160 (15.7) |
13.3 ± 16.7 (5–15; 9) | 2057 (5.71) | 1529 | 434 (28.4) | 15.0 ± 20.4 (5–17; 9) | |
| AMR (Carb-NS) | S |
225,364 (8.27) |
96,292 | 4745 (4.9) | 9.1 ± 11.2 (4–10; 6) |
29,970 (83.19) |
12,302 | 1213 (9.9) | 10.4 ± 14.9 (5–12; 7) |
| NS |
3956 (1.73) |
1649 |
218 (13.2) |
16.1 ± 29.3 (5–17; 9) | 6057 (16.81) | 2323 |
329 (14.2) |
16.8 ± 25.4 (6–18; 10) | |
| Empiric therapy | IET |
55,112 (24.03) |
22,018 | 1404 (6.4) | 10.5 ± 15.7 (5–12; 7) | 16,609 (46.1) | 6756 | 690 (10.2) | 11.4 ± 18.3 (4–12; 7) |
| AET |
174,208 (75.97) |
75,923 | 3559 (4.7) | 8.8 ± 10.2 (4–10; 6) | 19,418 (53.9) | 7869 | 852 (10.8) | 11.5 ± 16.4 (5–13; 8) | |
| Age group (years) | 18–49 | 31,475 (13.73) | 14,053 | 441 (3.1) | 9.5 ± 17.5 (4–9; 5) | 4705 (13.06) | 1883 | 176 (9.3) | 15.0 ± 31.8 (5–15; 8) |
| 50–64 | 48,251 (21.04) | 20,954 | 1213 (5.8) | 10.4 ± 15.1 (4–11; 7) | 8206 (22.78) | 3349 | 405 (21.1) | 13.2 ± 19.9 (5–14; 8) | |
| 65–75 |
60,242 (26.27) |
26,554 | 1475 (5.6) | 9.4 ± 9.9 (5–11; 7) | 10,005 (27.77) | 4122 | 472 (11.5) | 11.0 ± 12.3 (5–13; 8) | |
| > 75 |
89,352 (38.96) |
36,380 | 1834 (5.0) | 8.4 ± 7.6 (5–10; 6) | 13,111 (36.39) | 5271 | 489 (9.3) | 9.4 ± 9.2 (5–11; 7) | |
| Sex | Female |
147,308 (64.24) |
63,221 | 2487 (3.9) | 8.6 ± 9.7 (4–10; 6) | 15,214 (42.23) | 6162 | 620 (10.1) | 11.0 ± 14.5 (5–12; 7) |
| Male |
82,012 (35.76) |
34,720 | 2476 (7.1) | 10.4 ± 14.7 (5–11; 7) | 20,813 (57.77) | 8463 | 922 (10.9) | 11.9 ± 19.1 (5–13; 8) | |
| ICU | No |
165,417 (72.13) |
71,650 | 924 (1.3) | 7.5 ± 7.4 (4–8; 6) | 21,069 (58.48) | 8410 | 201 (2.4) | 8.4 ± 8.3 (4–10; 6) |
| Yes |
63,903 (27.87) |
26,291 | 4039 (15.4) | 13.7 ± 18.1 (6–16; 9) | 14,958 (41.52) | 6215 | 1341 (21.6) | 15.9 ± 24.3 (6–18; 10) | |
| Sources | Urine |
168,857 (73.63) |
71,600 | 2268 (3.2) | 8.5 ± 9.7 (4–9; 6) | 16,943 (47.03) | 6920 | 336 (4.9) | 9.9 ± 11.6 (5–11; 7) |
| Respiratory | 18,730 (8.17) | 8147 | 1665 (20.4) | 14.9 ± 24.0 (5–17; 9) | 13,668 (37.94) | 5428 | 963 (17.7) | 13.7 ± 23.7 (5–15; 8) | |
| Blood | 29,570 (12.89) | 12,807 | 834 (6.5) | 9.8 ± 10.7 (5–11; 7) | 2917 (8.1) | 1235 | 181 (14.7) | 11.3 ± 10.8 (6–13; 8) | |
| Other | 12,163 (5.3) | 5387 | 196 (3.6) | 9.3 ± 10.3 (4–11; 6) | 2499 (6.94) | 1042 | 62 (6.0) | 10.4 ± 12.1 (4–12; 7) | |
| Setting | Admission-onset | 189,583 (82.67) | 80,693 | 2830 (3.5) | 8.2 ± 7.6 (4–9; 6) | 23,092 (64.1) | 8998 | 524 (5.8) | 9.4 ± 9.0 (5–11; 7) |
| Hospital-onset | 39,737 (17.33) | 17,248 | 2133 (12.4) | 14.0 ± 22.3 (5–16; 9) | 12,935 (35.9) | 5627 | 1018 (18.1) | 15.1 ± 25.8 (5–17; 9) | |
| Multipathogen (ENT/PsA/ACB) | No | 215,608 (94.02) | 92,299 | 4577 (5.0) | 9.2 ± 11.7 (4–10; 6) | 36,027 (100) | 14,625 | 1542 (10.5) | 11.5 ± 17.3 (5–13; 8) |
| Yes | 13,712 (5.98) | 5642 | 386 (6.8) | 10.4 ± 13.7 (5–12; 7) | 0 (0) | 0 | 0 (0) | ‒ | |
| Prior 90-day admission | No | 177,826 (77.54) | 79,310 | 3800 (4.8) | 9.1 ± 11.8 (4–10; 6) | 24,243 (67.29) | 10,399 | 1122 (10.8) | 11.6 ± 18.4 (5–13; 7) |
| Yes | 51,494 (22.46) | 18,631 | 1163 (6.2) | 9.7 ± 11.7 (5–11; 7) | 11,784 (32.71) | 4226 | 420 (9.9) | 11.2 ± 14.8 (5–13; 8) | |
| Turnaround time (hrs) by quartiles (ENT/PsA) |
< 40 (ENT) < 45 (PsA) |
55,311 (24.12) | 19,747 | 800 (4.1) | 8.9 ± 10.5 (4–10; 6) | 9065 (25.16) | 3560 | 352 (9.9) | 11.4 ± 15.9 (5–13; 8) |
|
40–48 (ENT) 45–60 (PsA) |
59,376 (25.89) | 27,032 | 1107 (4.1) | 8.9 ± 10.7 (4–10; 6) | 9101 (25.26) | 3547 | 364 (10.3) | 11.1 ± 18.2 (5–12; 7) | |
|
48–63 (ENT) 61–75 (PsA) |
57,186 (24.94) | 24,085 | 1224 (5.1) | 9.1 ± 11.9 (4–10; 6) | 8938 (24.81) | 3864 | 447 (11.6) | 11.6 ± 17.5 (5–13; 8) | |
|
> 63 (ENT) > 75 (PsA) |
57,447 (25.05) | 27,077 | 1832 (6.8) | 10.0 ± 13.7 (5–11; 7) | 8923 (24.77) | 3654 | 379 (10.4) | 11.8 ± 17.5 (5–13; 8) | |
| Time to first new drug (hrs) by quartiles (ENT/PsA)a | Missing/NA | 227,718 (99.3) | 97,238 | 4828 (5.0) | 9.1 ± 11.1 (4–10; 6) | 34,554 (95.91) | 14,022 | 1425 (10.2) | 10.8 ± 15.0 (5–12; 7) |
|
< 26 (ENT) < 22 (PsA) |
405 (0.18) | 165 | 24 (14.5) | 16.9 ± 26 (6–18; 10) | 368 (1.02) | 139 | 21 (15.1) | 19.3 ± 48.5 (6–18; 10) | |
|
26–87 (ENT) 23–84 (PsA) |
397 (0.17) | 171 | 30 (17.5) | 16.1 ± 13 (9–18; 12) | 371 (1.03) | 146 | 26 (17.8) | 18.6 ± 9.8 (8–20; 13) | |
|
87–210 (ENT) 85–158 (PsA) |
400 (0.17) | 194 | 36 (18.6) | 22.1 ± 23.2 (11–24; 16) | 366 (1.02) | 160 | 31 (19.4) | 21.3 ± 20.0 (11–23; 15) | |
|
> 210 (ENT) > 158 (PsA) |
400 (0.17) | 173 | 45 (26.0) | 63.2 ± 74.5 (25.5–71; 41) | 368 (1.02) | 158 | 39 (24.7) | 52.4 ± 54.2 (21.5–58; 36) | |
| All new ABXS | 1602 | 703 | 135 (19.2) | ‒ | 1473 | 603 | 117 (19.4) | ‒ | |
| Lactic acid | No | 211,569 (92.26) | 90,103 | 3808 (4.2) | 9.1 ± 11.9 (4–10; 6) | 33,500 (92.99) | 13,572 | 1271 (9.4) | 11.5 ± 17.7 (5–13; 8) |
| Yes | 17,751 (7.74) | 7838 | 1155 (14.7) | 10.3 ± 10.4 (5–12; 7) | 2527 (7.01) | 1053 | 271 (25.7) | 10.6 ± 10.4 (5–13; 8) | |
| Renal insufficiency | No | 187,229 (81.65) | 80,401 | 3091 (3.8) | 8.9 ± 1.7 (4–10; 6) | 29,231 (81.14) | 11,830 | 989 (8.4) | 11.1 ± 17.6 (5–12; 7) |
| Yes | 42,091 (18.35) | 17,540 | 1872 (10.7) | 10.8 ± 12.1 (5–12; 8) | 6796 (18.86) | 2795 | 553 (19.8) | 12.9 ± 16.0 (5–15; 9) | |
| Heart failure | No | 202,651 (88.37) | 86,222 | 3852 (4.5) | 9.0 ± 11.8 (4–10; 6) | 31,223 (86.67) | 12,569 | 1213 (9.7) | 11.3 ± 17.4 (5–12; 7) |
| Yes | 26,669 (11.63) | 11,719 | 1111 (9.5) | 10.7 ± 11.9 (5–12; 8) | 4804 (13.33) | 2056 | 329 (16.0) | 12.6 ± 16.3 (5–14; 9) | |
| Liver dysfunction | No | 125,452 (54.71) | 53,539 | 1358 (2.5) | 8.4 ± 11.2 (4–9; 6) | 17,871 (49.6) | 7123 | 427 (6.0) | 10.4 ± 16.5 (4–11; 7) |
| Yes | 103,868 (45.29) | 44,402 | 3605 (8.1) | 10.3 ± 12.4 (5–12; 7) | 18,156 (50.4) | 7502 | 1115 (14.9) | 12.5 ± 17.9 (5–14; 8) | |
| Cytokine storm | No | 214,781 (93.66) | 90,228 | 39.46 (4.4) | 9.1 ± 11.9 (4–10; 6) | 33,381 (92.66) | 13,213 | 1214 (9.2) | 11.4 ± 17.5 (5–13; 8) |
| Yes | 14,539 (6.34) | 7713 |
1017 (13.2) |
10.6 ± 10.5 (5–12; 7) | 2646 (7.34) | 1412 | 328 (23.2) | 12.2 ± 14.6 (5–14; 8) | |
| Immuno-compromised | No | 147,698 (64.41) | 61,951 | 2381 (3.8) | 9.1 ± 12.3 (4–10; 6) | 22,095 (61.33) | 8807 | 711 (8.1) | 11.7 ± 19.3 (5–13; 7) |
| Yes | 81,622 (35.59) | 35,990 | 2582 (7.2) | 9.4 ± 10.8 (5–11; 7) | 13,932 (38.67) | 5818 | 831 (14.3) | 11.1 ± 13.4 (5–13; 8) | |
| Any of the 6 comorbiditiesb | No | 72,553 (31.64) | 30,084 | 471 (1.6) | 8.3 ± 12.0 (4–9; 6) | 9969 (27.67) | 3831 | 155 (4.0) | 10.5 ± 18.6 (4–11; 7) |
| Yes | 156,767 (68.36) | 67,857 | 4492 (6.6) | 9.7 ± 11.7 (5–11; 7) | 26,058 (72.33) | 10,794 | 1387 (12.8) | 11.8 ± 16.7 (5–13; 8) | |
Abbreviations: ABXS Antibacterials, ACB Acinetobacter baumannii, AET Adequate empiric therapy, AMR Antimicrobial resistance, Carb Carbapenem, ENT Enterobacterales, ICU Intensive care unit, IET Inadequate empiric therapy, IQR interquartile range, LOS Length of stay, NA Not applicable, NS Non-susceptible, PsA Pseudomonas aeruginosa; S Susceptible
aCeftazidime-avibactam; ceftolozane-tazobactam; cefiderocol, meropenem-vaborbactam (ENT only); eravacycline (ENT only); imipenem-cilcastatin; and relebactam
bThe 6 comorbidities included the presence of lactic acid, renal sufficiency, heart failure, liver dysfunction, cytokine storm, and immunocompromised status at index culture collection [10]
Urine was the most common culture source for both ENT (73.6%) and PsA (47.0%) (Table 1). More cultures in the PsA cohort were respiratory compared to the ENT cohort (38% vs 8%). A higher percentage of cultures were sourced from patients with prior 90-day hospital admission in the PsA cohort (32.7%) versus the ENT cohort (22.5%).
ENT outcomes
In the ENT cohort, IET was prescribed in 24% of hospital admissions. Hospital mortality was 5.1% overall, 6.4% with IET, and 4.7% with AET (Table 1). Hospital mortality was also higher for carb-NS versus carb-S (13.2% vs. 4.9%). Similarly, median post-culture hospital LOS was longer with IET versus AET (7 days vs. 6 days) and carb-NS versus carb-S (9 days versus 6 days).
In the multivariate analysis, hospital mortality was significantly higher with IET versus AET overall (OR, 1.29 [95% CI 1.16–1.43, P < 0.0001), (Fig. 1) and with carb-NS versus carb-S (OR, 1.35 [1.13–1.60], P < 0.0001) (Table 2). Mortality rate also increased with longer TAT. Compared to TAT in the 1st quartile (i.e., the shortest duration), mortality was significantly higher in both the 3rd (OR, 1.13 [95% CI 1.02–1.25], P = 0.0226) and 4th quartiles (OR, 1.17 [95% CI [1.06–1.29] P = 0.0016]), which represent the longest durations (Table 2). The correlation between increased mortality and longer TAT is also evident from the finding that mortality was higher for any TAT that exceeded the median of 48 h. With respect to culture source, hospital mortality was significantly higher for blood (OR, 1.38 (95% CI, 1.23–1.54], P < 0.0001) and respiratory source (OR, 2.12 [95% CI 1.93–2.32], P < 0.0001) compared to urine (Table 2).
Fig. 1.
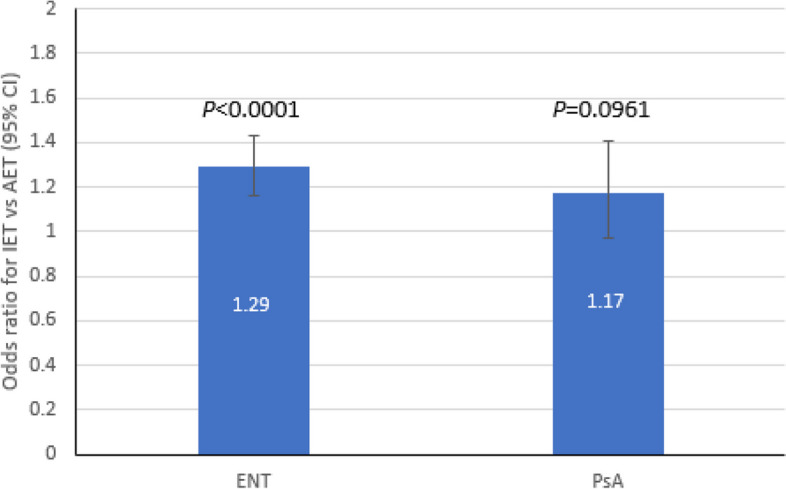
Multivariate association between IET and post-culture mortality in culture-positive ENT (N = 97,928) and PsA (N = 14,624). AET, adequate empiric therapy; CI, confidence interval; ENT, Enterobacterales; IET, inadequate empiric therapy; PsA; Pseudomonas aeruginosa
Table 2.
Multivariate model for hospital mortality
| ENT Cohort (N = 97,941) | PsA Cohort (N = 14,625) | ||||
|---|---|---|---|---|---|
| Variable | Effect to Assess (Reference Category) |
Estimated OR (95% CI) |
P Value |
Estimated OR (95% CI) |
P Value |
| Source | Blood (urine) | 1.38 (1.16–1.43) | < 0.0001 | 2.25 (1.79–2.84) | < 0.0001 |
| Respiratory (urine) | 2.12 (1.93–2.32) | < 0.0001 | 1.82 (1.57–2.12) | < 0.0001 | |
| Other (urine) | 0.94 (0.79–1.13) | 0.6521 | 1.04 (0.78–1.40) | 0.5212 | |
| Carbapenem | NS (S) | 1.35 (1.13–1.60) | 0.0009 | 1.26 (1.08–1.47) | 0.0038 |
| Onset | Hospital (Admission) | 1.67 (1.55–1.81) | < 0.0001 | 1.91 (1.67–2.19) | < 0.0001 |
| Turnaround time (hrs) | 2nd quartile: 40–48 (< 40a) | 0.93 (0.84–1.03) | 0.1592 | ‒b | ‒b |
| 3rd quartile: 49–63 (< 40a) | 1.13 (1.02–1.25) | 0.0226 | ‒ b | ‒b | |
| 4th quartile: > 63 (< 40a) | 1.17 (1.06–1.29) | 0.0016 | ‒b | ‒b | |
Other significant factors predicting mortality in the ENT cohort not shown in the table include IET status, ICU admission, COVID-19 positivity, older age, the presence of multiple pathogens, and comorbidities (Supplementary Table 2)
Abbreviations: ENT Enterobacterales, NS Non-susceptible, OR Odds ratio, PsA Pseudomonas aeruginosa, S Susceptible
a1st quartile
bThe factor was not included in the final model for this study population due to statistical insignificance
IET and TAT also had similar impacts on hospital LOS. In the multivariate models, post-culture hospital LOS was significantly longer with IET vs. AET (14.8 days vs. 13.3 days, P < 0.0001) (Fig. 2) and for carb-NS versus carb-S (15.8 days vs. 12.4 days, P < 0.0001) (Table 3). Compared to TAT in the 1st quartile, post-culture LOS was significantly shorter for the 2nd quartile (13.7 days vs. 14.0 days, P < 0.001) but significantly longer for the 4th quartile (14.4. days vs. 14.0 days, P < 0.001) (Table 3).
Fig. 2.
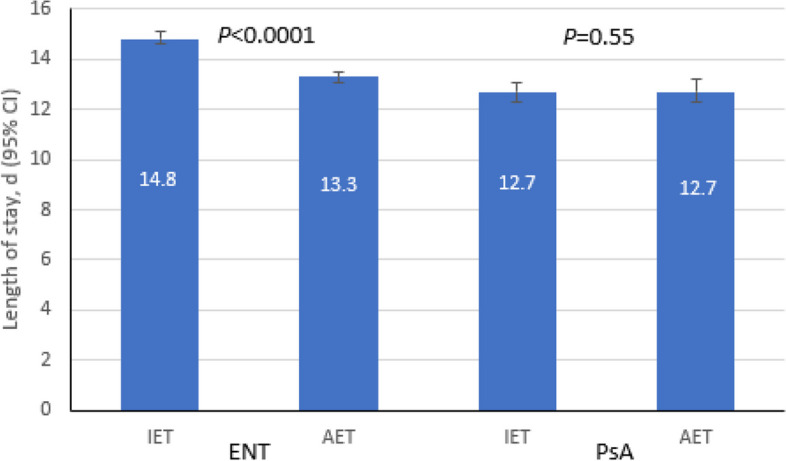
Multivariate association between IET and post-culture LOS in culture-positive ENT (N = 229,320) and PsA (N = 36,027). CI, confidence interval; ENT, Enterobacterales; IET, inadequate empiric therapy; LOS, length of stay; PsA, Pseudomonas aeruginosa
Table 3.
Multivariate association of post-culture LOS and IET
| ENT Cohort (N = 229,320) | PsA Cohort N = 36,027) | ||||
|---|---|---|---|---|---|
| Variable | Category of Variable |
Estimated LOS, days (95% CI) |
P Value |
Estimated LOS, days (95% CI) |
P Value |
| Source | Blood | 14.5 (14.2–14.7) | < 0.0001 | 12.8 (12.3–13.3) | < 0.0076 |
| Respiratory | 14.6 (14.4–14.9) | < 0.0001 | 14.2 (13.7–14.6) | < 0.0001 | |
| Other | 13.1 (12.9–13.3) | < 0.0001 | 11.6 (11.2–12.1) | 0.0005 | |
| Urine | 14.0 (13.8–14.2) | Reference | 12.3 (11.9–12.7) | Reference | |
| Carbapenem | NS | 15.8 (15.5–16.2) | < 0.0001 | 15.2 (14.7–15.7) | < 0.0001 |
| S | 12.4 (12.3–12.6) | Reference | 10.6 (10.3–10.9) | Reference | |
| IET effect with Carb-NS | IET | -a | -a | 15.6 (15.0–16.2) | 0.0098 |
| AET | -a | -a | 14.8 (14.2–15.5) | ref | |
| IET effect with Carb-S | IET | -a | -a | 10.3 (10.0–10.6) | < .0001 |
| AET | -a | -a | 11.0 (10.6–11.3) | ref | |
| Setting (onset time) | Hospital-onset (≥ 3 days from admission) | 16.3 (16.0–16.5) | < 0.0001 | -a | -a |
| Admission-onset (< 3 days from admission) | 12.1 (11.9–12.3) | Reference | -a | -a | |
| Turnaround time (hrs) | 2nd quartile: 40–48 | 13.7 (13.5–13.9) | < 0.0001 | ‒a | ‒a |
| 3rd quartile: 49–63 | 14.1 (13.9–14.3) | 0.0861 | ‒a | ‒a | |
| 4th quartile: > 63 | 14.4 (14.2–14.6) | < 0.0001 | ‒a | ‒a | |
| 1st quartile: < 40 | 14.0 (13.8–14.2) | Reference | ‒a | ‒a | |
Other significant factors predicting post-culture LOS in the ENT cohort not shown in the table include IET status, ICU admission, COVID-19 positivity, older age, male gender, the presence of multiple pathogens,, prior 90-day hospitalization, and comorbidities (Supplementary Tables 3 and 4)
Abbreviations: AET Adequate empiric therapy, ENT Enterobacterales, IET Inadequate empiric therapy, NA Not applicable, NS Non-susceptible, PsA Pseudomonas aeruginosa, S Susceptible
aThe factor was not included in the final model for this study population due to statistical insignificance and/or because it did not improve model fit
PsA outcomes
In the PsA cohort, IET was prescribed in 46.1% of admissions. Hospital mortality was 10.5% overall, 10.2% with IET and 10.8% with AET (Table 1). In addition, hospital mortality was higher with carb-NS compared to carb-S (14.2% vs. 9.9%).
Similar to the ENT cohort, the multivariate analysis showed that hospital mortality was significantly higher with carb-NS vs. carb-S (OR, 1.26 [1.08–1.47], P = 0.0038), and compared to urine, hospital mortality was significantly higher for blood (OR, 2.25 (95% CI, 1.79–2.84], P < 0.0001) and respiratory source (OR, 1.82 [95% CI 1.57–2.12], P < 0.0001) (Table 2). Although mortality was numerically higher with IET versus AET, this difference was not statistically significant (OR, 1.17 [95% CI 0.97–1.41, P = 0.0961) (Fig. 1).
Median post-culture hospital LOS was longer with AET versus IET (8 days vs. 7 days) and carb-NS versus carb-S (10 days vs. 7 days). In the multivariate analysis, there was no difference in post-culture LOS with IET versus AET (12.7 days vs. 12.7 days, P = 0.5466) (Fig. 2), but carb-NS was associated with a significantly higher post-culture LOS compared to carb-S (15.2 days vs. 10.6 days, P < 0.0001) (Table 3). Interestingly, post-culture LOS was significantly longer with IET vs. AET (15.6 days vs. 14.8 days, P = 0.0098) within the carb-NS group and significantly longer with AET vs. IET within the carb-S group (11.0 days vs. 10.3 days, P < 0.0001).
Newer antibacterial therapy outcomes
Newer antibacterial therapy was prescribed for 703 ENT admissions and 603 PsA admissions, and among these, ceftazidime-avibactam was the most commonly prescribed agent (ENT: n = 404; PsA: n = 350). Median time to start newer antibacterials was 87 h for ENT and 84 h for PsA. Compared with overall admissions, hospital mortality was higher in those prescribed newer antibacterials for both ENT (19.2% vs. 5.0%) and PsA (19.4% vs. 10.2%) (Table 1).
In patients who received newer antibacterials in either cohort, hospital mortality was greater in patients who were prescribed therapy later. In the ENT cohort, hospital mortality was 26.0% among patients who started therapy after 210 h (> 8 days; 4th quartile) and 14.5% among those who started therapy within 26 h (1st quartile). In the PsA cohort, hospital mortality was 24.7% among those starting therapy after 158 h (> 6.5 days; 4th quartile) and 15.1% among those starting therapy within 22 h (1st quartile) (Table 1). The multivariate analysis confirmed that a delayed start of newer antibacterial therapy was associated with significantly greater hospital mortality. Hospital mortality was significantly higher when newer antibacterials were prescribed for ENT in the 4th quartile vs. 1st quartile of time to prescription (OR, 1.96 [95% CI, 1.12–3.42], P = 0.0182) and when prescribed for PsA in the 4th quartile vs. 1st quartile of time to prescription (OR, 1.84 [95% CI 1.02–3.32], P = 0.0423) (Fig. 3A and B).
Fig. 3.
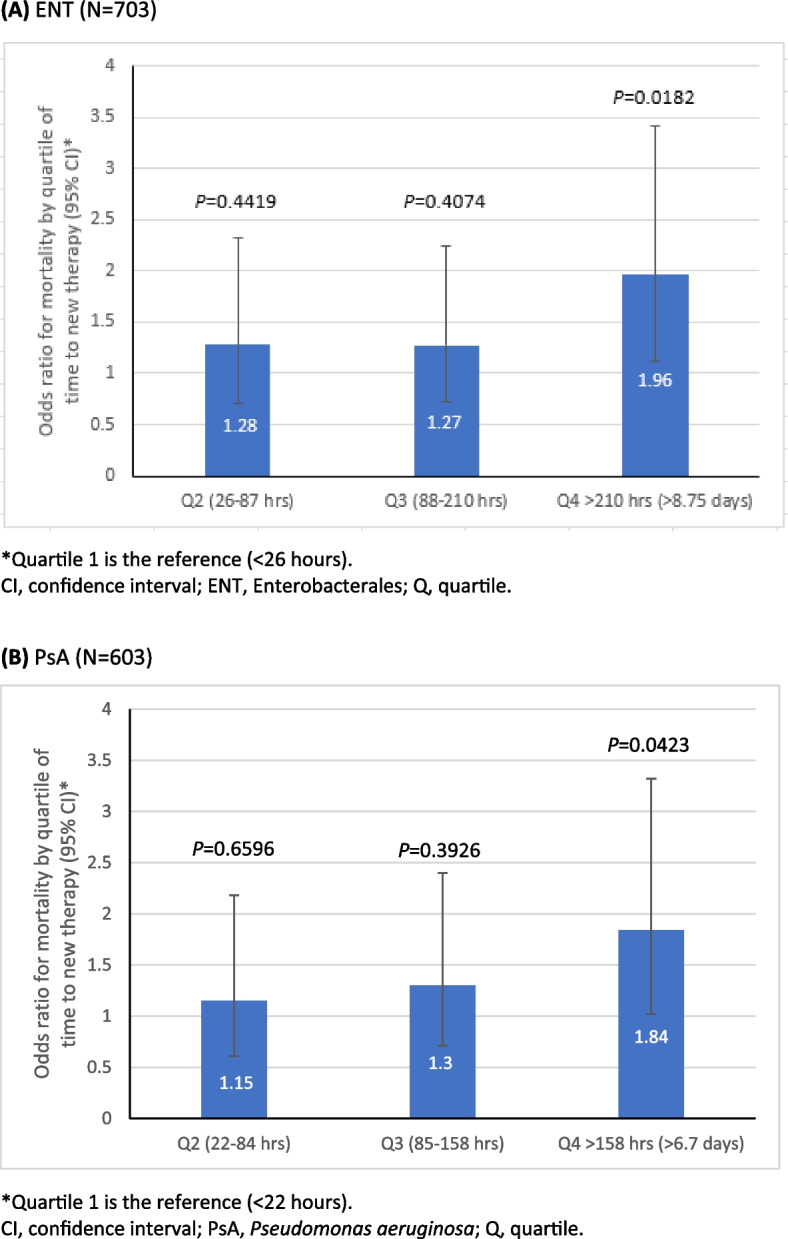
Multivariate association between hospital mortality and time to newer antibacterial therapy in culture-positive ENT (A) and PsA (B). A ENT (N = 703). B PsA (N = 603)
Compared to the 1st quartile of time to the start of newer antibacterials, median post-culture hospital LOS was higher for the 4th quartile in both the ENT (41 days vs. 10 days) and PsA (36 days vs. 10 days) cohorts in the univariate analysis (Table 1). In addition, starting newer antibacterials in the 4th quartile was associated with significantly longer post-culture LOS than the 1st quartile in ENT (35.4 vs. 11.1 days, P < 0.0001) and PsA (30.9 vs. 12.5 days, P < 0.0001) in multivariate analyses, as shown in Fig. 4A and B.
Fig. 4.
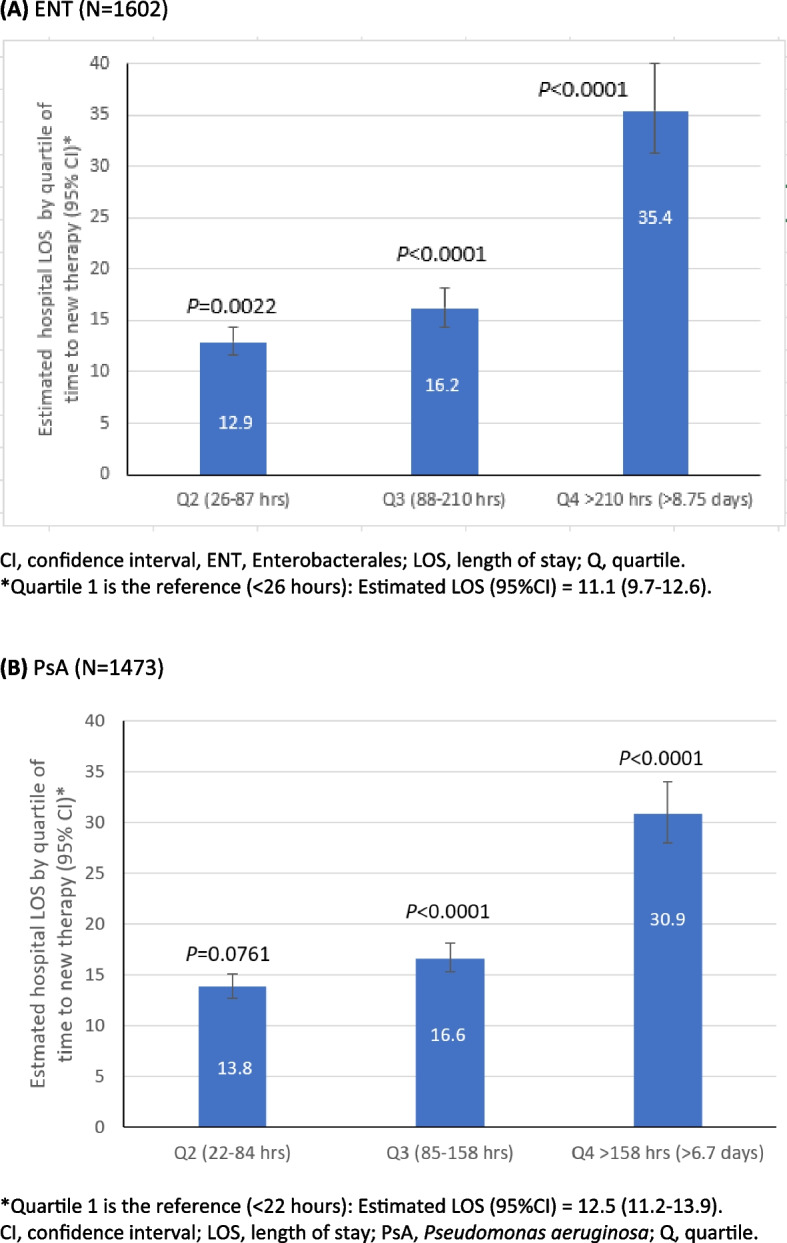
Multivariate association between hospital LOS and time to newer antibacterial therapy in culture-positive ENT (A) and PsA (B). A ENT (N = 1602). B PsA (N = 1473)
A subset analysis of ceftazidime-avibactam (one of the newer antibacterials) in ENT and PsA admissions showed similar results. For time to starting ceftazidime-avibactam, there was a significantly higher mortality for ENT in the 4th quartile compared to the 1st quartile (OR, 2.18 [95% CI, 1.10–4.32], P = 0.0249) and a non-significant higher mortality for PsA in the 4th quartile vs. 1st quartile (OR, 1.81 [95% CI 0.85–3.88], P = 0.1240) (Supplemental Figs. 1A and 1B). The subset analysis also showed that a significantly longer post-culture LOS was associated with the 2nd, 3rd, and 4th quartiles in both ENT and PsA. For ENT admissions, compared to the 1st quartile (10.9 days) of starting ceftazidime-avibactam from culture collection, the 2nd (12.9 days, P = 0.0022), 3rd (16.2 days, P < 0.0001), and 4th quartile (35.1 days, P < 0.001) were associated with significantly longer post-culture LOS (Supplemental Fig. 2A). Similarly, for PsA admissions, compared to the 1st quartile (11.2 days) of starting ceftazidime-avibactam from culture collection, the 2nd (13.9 days, P = 0.0104), 3rd (17.7 days, P < 0.0001), and 4th quartiles (36.7 days, P < 0.0001) were associated with significantly longer post-culture LOS (Supplemental Fig. 2B).
Discussion
Initiation of timely appropriate antibacterial therapy and time to culture result are important determinants of outcomes in patients with serious bacterial infections, including those attributed to ENT and PsA. A unique characteristic of our study is that IET was measured as antibacterial therapy prescribed from within 48 h prior to culture collection until the first susceptibility result, enabling us to look at the impact of TAT on patient outcomes. Our results confirm those of previous studies showing that IET and carbapenem resistance are major contributing factors to poor outcomes for patients with serious infections [10–12, 17, 21–25]. We observed that high rates of IET for both ENT (24%) and PsA (46%) infections in hospitalized adults and IET were associated with significantly higher mortality and longer hospital LOS for ENT-positive cultures and a higher, non-significant mortality for PsA-positive cultures. Further, carbapenem resistance was associated with significantly greater mortality in both cohorts. For ENT infections in particular, delayed appropriate antibacterial therapy has been shown to have a greater deleterious impact on outcomes than carbapenem resistance; however, these two factors may be synergistic [17], as use of IET is generally higher in ABR infections [6]. Even after adjusting for IET, carbapenem resistance was independently associated with greater mortality in both ENT and PsA.
Carbapenem-resistant infections are often difficult to treat given the limited number of therapeutic options. Newer antibacterial therapies are also commonly prescribed in carbapenem-resistant infections, which underscores the importance of determining if therapeutic timing impacts outcomes. A key finding of this study is that delayed initiation of newer antibacterial therapy is associated with higher mortality rates and longer post-culture hospital LOS. While starting antibacterial therapy earlier was associated with better outcomes, more rapid diagnostic tests are often needed for resistant infections when newer antibiotics are prescribed. This is evident from our observation that carbapenem-resistant infections had a longer TAT than carbapenem-susceptible infections for both ENT and PsA.
Given the importance of timely initiation of newer antibacterial therapy in carbapenem-resistant and MDR infections, prompt identification of these infections is critical. Understanding the risk factors for carbapenem-resistant and MDR infections, which include previous use of broad-spectrum antibiotics carbapenems, mechanical ventilation, urinary catheterization, prior ICU stay, carbapenem colonization, and length of stay in a hospital, may help clinicians more efficiently identify patients at the greatest risk for these infections [26–28].
To our knowledge, this is the first published study to investigate early versus delayed use of newer antibacterials in the real-world setting. Although real-world data are useful, generating these data for newer antibacterial therapies is challenging given the frequent delay in uptake following market availability [29]. In fact, an analysis of US hospitals in 2018–2019 found that new antibacterials were used to treat only 35% of CRE infections when they were expected to be used first line [30]. In addition, non-inferiority data from clinical trials do not fully inform real-world use of newer antibiotics. As a result, new agents are frequently used as salvage therapy [7, 8], which can make it difficult to demonstrate the benefit of real-world use to inform management decisions. Despite these limitations, our findings indicate that delayed therapy is associated with greater mortality. Post-culture hospital LOS is also longer when these therapies are started later, which has important implications for cost-effectiveness analyses. While the cost of newer antibacterials is higher, the pharmacoeconomic value of these agents cannot be based on this factor alone; the impact of a longer hospital LOS due to delayed initiation of newer antibacterial treatment may also increase costs.
Newer antibacterials are often reserved for patients with more severe infections. This aligns with our observation that for ENT and PsA infections, overall mortality rates were higher for patients who received newer antibacterials versus those who did not, and these rates rose exponentially with longer time to the first new drug start. The fact that median time to start of newer antibacterials (87 h for ENT; 84 h for PsA) was markedly longer than median TAT for susceptibility results in carbapenem-resistant infections (64 h for ENT; 67 h for PsA) in the overall population provides further evidence for the need to use newer antibacterials earlier in sicker patients.
Our study has several limitations. Antibacterial susceptibility tests were performed at individual facilities rather than a central laboratory; therefore, different testing systems and susceptibility breakpoints may have affected carbapenem susceptibility results. Patients with positive bacterial cultures may not have had a confirmed bacterial infection, including the large number of patients in our sample with positive urine samples. The testing algorithm utilized in this study was designed to eliminate hospital admissions with contaminating bacteria, but it is possible some bacteria may have been colonizers. Moreover, information on outpatient antibacterial exposure was not available. Antimicrobial therapy timing was determined based on the time of the medication order. Lastly, several geographic regions (e.g., Mountain and New England) were underrepresented in the database.
Conclusions
In conclusion, our study demonstrates that obtaining more rapid antibacterial susceptibility results may improve overall adequacy of empiric therapy and facilitate appropriate and timely use of newer antibacterials. Given the importance of rapid diagnostics, the integration of key diagnostic tests with antibacterial stewardship programs should be considered [31]. Due to the association between IET and negative outcomes, combining efforts to improve timely susceptibility results with diagnostic and antibiotic stewardship has the potential to improve outcomes in patients with MDR infections.
Supplementary Information
Additional file 1: Supplementary Table 1. Hospital demographics.
Additional file 2: Supplementary Table 2. Mortality models.
Additional file 3: Supplementary Table 3. LOS models.
Additional file 4: Supplementary Table 4. ICU LOS models.
Additional file 5: Supplementary Figure 1. Multivariate association between hospital mortality and time to CAZ-AVI use in culture-positive ENT (A) and PsA (B).
Additional file 6: Supplementary Figure 2. Multivariate association between post-culture hospital LOS and time to CAZ-AVI use in culture-positive ENT (A) and PsA (B).
Acknowledgements
We thank Nicole Cooper and the HealthCare Alliance Group, LLC, for providing manuscript support with funding from Becton, Dickinson & Company
Abbreviations
- ABXS
Antibacterials
- ACB
Acinetobacter baumannii
- AET
Appropriate empiric therapy
- AVI
Avibactam
- Carb
Carbapenem
- CAZ
Ceftazidime
- CDC
Centers for Disease Control and Prevention
- CI
Confidence interval
- CRE
Carbapemen-resistant Enterobacterales
- ENT
Enterobacterales
- ICU
Intensive care unit
- IET
Inadequate empiric therapy
- IQR
Interquartile range
- LOS
Length of stay
- MDR
Multi-drug resistant
- NS
Non-susceptible
- OR
Odds ratio
- PsA
Pseudomonas aeruginosa
- Q
Quartile
- S
Susceptible
- TAT
Turnaround time
- US
United States
- WHO
World Health Organization
Authors’ contributions
Study concept and design: All authors; acquisition, analysis, or interpretation of data: all authors; drafting of the manuscript: TR, JL, VG; critical revision of the manuscript for important intellectual content: all authors; statistical analysis: GY, VG; obtained funding: TR, VG; administrative, technical, or material support: TR, GY, CA, SG, VG; and supervision: TR, GY, VG. All authors read and approved the final manuscript.
Funding
This work was supported by a grant from AbbVie Inc., Florham Park, NJ.
Availability of data and materials
The datasets used and/or analyzed during the current study are available from the corresponding author on reasonable request.
Declarations
Ethics approval and consent to participate
The retrospective, de-identified data set was approved and informed consent requirements were waived by the New England Institutional Review Board (Wellesley, MA, USA; IRB No. 120180023).
Consent for publication
Not applicable.
Competing interests
T.R. and J.L. are employees of and own stock in AbbVie Inc., Florham Park, NJ. K.C.Y., C.A., and S.G. are employees of Becton, Dickinson & Company, which was contracted by AbbVie Inc., Florham Park, NJ. K.C.Y. owns stock in Becton, Dickson & Company. G.Y. and V.G. were employees of Becton, Dickinson & Company at the time of the analysis.
Footnotes
Publisher’s Note
Springer Nature remains neutral with regard to jurisdictional claims in published maps and institutional affiliations.
References
- 1.Antimicrobial Resistance Collaborators. Global burden of bacterial antimicrobial resistance in 2019: a systematic analysis. Lancet. 2022;399:629–55. 10.1016/S0140-6736(21)02724-0 [DOI] [PMC free article] [PubMed] [Google Scholar]
- 2.Nagvekar V, Sawant S, Amey S. Prevalence of multidrug-resistant Gram-negative bacteria cases at admission in a multispeciality hospital. J Glob Antimicrob Res. 2020;22:457–61. 10.1016/j.jgar.2020.02.030 [DOI] [PubMed] [Google Scholar]
- 3.Jarrell AS, Kruer RM, Berescu LD, Pronovost PJ, Trivedi JB. Factors associated with in-hospital mortality among critically ill surgical patients with multidrug-resistant Gram-negative infections. J Crit Care. 2018;43:321–6. 10.1016/j.jcrc.2017.10.035 [DOI] [PubMed] [Google Scholar]
- 4.Centers for Disease Control and Prevention. Antibiotic Resistance Threats in the United States: 2019. Available at: https://www.cdc.gov/drugresistance/pdf/threats-report/2019-ar-threats-report-508.pdf. Accessed 27 July 2023.
- 5.Abadi ATB, Rizvanov AA, Haertlé T, Blatt NL. World Health organization report: current crisis of antibiotic resistance. BioNanoScience. 2019;9:778–88. 10.1007/s12668-019-00658-4 [DOI] [Google Scholar]
- 6.Bauer KA, Puzniak LA, Yu KC, et al. Association of SARS-CoV-2 status and antibiotic-resistant bacteria with inadequate empiric therapy in hospitalized patients: a US multicenter cohort evaluation (July 2019 - October 2021). BMC Infect Dis. 2023;23:490. 10.1186/s12879-023-08453-z. 10.1186/s12879-023-08453-z [DOI] [PMC free article] [PubMed] [Google Scholar]
- 7.Castón JJ, De la Torre Á, Ruiz-Camps I, Sorlí ML, Torres V, Torre-Cisneros J. Salvage therapy with ceftolozane-tazobactam for multidrug-resistant Pseudomonas aeruginosa infections. Antimicrob Agents Chemother. 2017;61:e02136–16. 10.1128/AAC.02136-16. [DOI] [PMC free article] [PubMed]
- 8.Temkin E, Torre-Cisneros J, Beovic B, et al. Ceftazidime-avibactam as salvage therapy for infections caused by carbapenem-resistant organisms. Antimicrob Agents Chemother. 2017;61:e01964–16. 10.1128/AAC.01964-16. [DOI] [PMC free article] [PubMed]
- 9.Kadri SS, Lai YL, Warner S, et al. Inappropriate empirical antibiotic therapy for bloodstream infections based on discordant in-vitro susceptibilities: A retrospective cohort analysis of prevalence, predictors, and mortality risk in US hospitals. Lancet Infect Dis. 2021;21(2):241–51. 10.1016/S1473-3099(20)30477-1 [DOI] [PMC free article] [PubMed] [Google Scholar]
- 10.Puzniak L, Bauer KA, Yu KC, et al. Effect of inadequate empiric antibacterial therapy on hospital outcomes in SARS-CoV-2-positive bacterial culture: a multicenter evaluation from March to November 2020. Open Forum Infect Dis. 2021;8(6):ofab232. 10.1093/ofid/ofab232 [DOI] [PMC free article] [PubMed] [Google Scholar]
- 11.Ohnuma T, Chihara S, Costin B, et al. Association of appropriate empirical antimicrobial therapy with in-hospital mortality in patients with bloodstream infections in the US. JAMA Netw Open. 2023;6(1):e2249353. 10.1001/jamanetworkopen.2022.49353 [DOI] [PMC free article] [PubMed] [Google Scholar]
- 12.Bassetti M, Rello J, Blasi F, Goossens H, Sotgiu G, Tavoschi L, Zasowski EJ, Arber MR, McCool R, Patterson JV, Longshaw CM, Lopes S, Manissero D, Nguyen ST, Tone K, Aliberti S. Systematic review of the impact of appropriate versus inappropriate initial antibiotic therapy on outcomes of patients with severe bacterial infections. Int J Antimicrob Agents. 2020;56(6):106184. 10.1016/j.ijantimicag.2020.106184. (Epub 2020 Oct 9). 10.1016/j.ijantimicag.2020.106184 [DOI] [PubMed] [Google Scholar]
- 13.Raman G, Avendano E, Berger S, Menon V. Appropriate initial antibiotic therapy in hospitalized patients with gram-negative infections: systematic review and meta-analysis. BMC Infect Dis. 2015;15:395. 10.1186/s12879-015-1123-5. 10.1186/s12879-015-1123-5 [DOI] [PMC free article] [PubMed] [Google Scholar]
- 14.Zilberberg MD, Nathanson BH, Sulham K, Fan W, Shorr AF. Carbapenem resistance, inappropriate empiric treatment and outcomes among patients hospitalized with Enterobacteriaceae urinary tract infection, pneumonia and sepsis. BMC Infect Dis. 2017;17:279. 10.1186/s12879-017-2383-z. 10.1186/s12879-017-2383-z [DOI] [PMC free article] [PubMed] [Google Scholar]
- 15.Van Heuverswyn J, Valik JK, Desirée van der Werff S, Hedberg P, Giske C, Nauclér P. Association between time to appropriate antimicrobial treatment and 30-day mortality in patients with bloodstream infections: A retrospective cohort study. Clin Infect Dis. 2023;76(3):469–78. 10.1093/cid/ciac727. [DOI] [PMC free article] [PubMed]
- 16.Bonine NG, Berger A, Altincatal A, et al. Impact of delayed appropriate antibiotic therapy on patient outcomes by antibiotic resistance status from serious Gram-negative bacterial infections. Am J MedSci. 2019;357:103–10. [DOI] [PubMed] [Google Scholar]
- 17.Lodise P, Berger A, Altincatal A, et al. Antimicrobial Resistance or Delayed Appropriate Therapy—Does One Influence Outcomes More Than the Other Among Patients With Serious Infections Due to Carbapenem-Resistant Versus Carbapenem-Susceptible Enterobacteriaceae?, Open Forum Infect Dis. 2019;6:ofz194, 10.1093/ofid/ofz194. [DOI] [PMC free article] [PubMed]
- 18.Mitra-Majumdar M, Powers JH III, Brown BL, Kesselheim AS. Evidence at time of regulatory approval and cost of new antibiotics in 2016–2019: cohort study of FDA approved drugs. BMJ Med. 2022;1:e000227. 10.1136/bmjmed-2022-000227. 10.1136/bmjmed-2022-000227 [DOI] [PMC free article] [PubMed] [Google Scholar]
- 19.Puzniak L, Bauer KA, Yu K, Watts J, ChinEn A, Gupta V. A multicenter evaluation of antibacterial use in hospitalized patients through the SARS-Cov-2 pandemic waves. BMC Infect Dis. 2023;23:117. 10.1186/s12879-023-08042-0. 10.1186/s12879-023-08042-0 [DOI] [PMC free article] [PubMed] [Google Scholar]
- 20.Brossette SE, Hacek DM, Gavin PJ, et al. A laboratory-based, hospital-wide, electronic marker for nosocomial infection: the future of infection control surveillance? Am J Clin Pathol. 2006;125(1):34–9. 10.1309/502AUPR8VE67MBDE [DOI] [PubMed] [Google Scholar]
- 21.Martin A, Fahrbach K, Zhao Q Lodise T, Association between carbapenem resistance and mortality among adult, hospitalized patients with serious infections due to Enterobacteriaceae: Results of a systematic literature review and meta-analysis, Open Forum Infect Dis. 2018;5:ofy150. 10.1093/ofid/ofy150. [DOI] [PMC free article] [PubMed]
- 22.Zhou R, Fang X, Zhang J, Zheng X, et al. Impact of carbapenem resistance on mortality in patients infected with Enterobacteriaceae: a systematic review and meta-analysis. BMJ Open. 2021;11(12):e054971. 10.1136/bmjopen-2021-054971. 10.1136/bmjopen-2021-054971 [DOI] [PMC free article] [PubMed] [Google Scholar]
- 23.Kohler PP, Volling C, Green K, Uleryk EM, Shah PS, McGeer A. Carbapenem resistance, initial antibiotic therapy, and mortality in Klebsiella pneumoniae bacteremia: A systematic review and meta-analysis. Infect Control Hosp Epidemiol. 2017;38(11):1319–28. 10.1017/ice.2017.197. (Epub 2017 Sep 27). 10.1017/ice.2017.197 [DOI] [PubMed] [Google Scholar]
- 24.Rivera-Villegas HO, Martinez-Guerra BA, Garcia-Couturier R, et al. Predictors of mortality in patients with infections due to carbapenem-resistant Gram-negative bacteria. Antibiotics (Basel). 2023;12(7):1130. 10.3390/antibiotics12071130. 10.3390/antibiotics12071130 [DOI] [PMC free article] [PubMed] [Google Scholar]
- 25.Zasowski EJ, Bassetti M, Blasi F, et al. A systematic review of the effect of delayed appropriate antibiotic treatment on the outcomes of patients with severe bacterial infections. Chest. 2020;158(3):929–38. 10.1016/j.chest.2020.03.087. (Epub 2020 May 22). 10.1016/j.chest.2020.03.087 [DOI] [PubMed] [Google Scholar]
- 26.Bulens SN, Reses HE, Ansari UA, et al. Carbapenem-resistant enterobacterales in individuals with and without health care risk factors–Emerging infections program, United States, 2012–2015. Am J Infect Control. 2023;51(1):70–7. 10.1016/j.ajic.2022.04.003 [DOI] [PMC free article] [PubMed] [Google Scholar]
- 27.Palacios-Baena ZR, Giannella M, Manissero D, et al. Risk factors for carbapenem-resistant Gram-negative bacterial infections: a systematic review. Clin Microbiol Infect. 2021;27(2):228–35. 10.1016/j.cmi.2020.10.016 [DOI] [PubMed] [Google Scholar]
- 28.Pérez-Galera S, Bravo-Ferrer JM, Paniagua M, et al. Risk factors for infections caused by carbapenem-resistant Enterobacterales: an international matched case-control-control study (EURECA). EClinicalMedicine. 2023;57:101871. 10.1016/j.eclinm.2023.101871 [DOI] [PMC free article] [PubMed] [Google Scholar]
- 29.Schulz LT, Kim SK, Hartsell A, Rose WE. Antimicrobial stewardship during a time of rapid antimicrobial development: Potential impact on industry for future investment. Diagn Microbiol Infect Dis. 2019;95: 114857. 10.1016/j.diagmicrobio.2019.06.009. (Epub 2019). 10.1016/j.diagmicrobio.2019.06.009 [DOI] [PubMed] [Google Scholar]
- 30.Clancy CJ, Potoski BA, Buehrle D, Nguyen MH. Estimating the treatment of carbapenem-resistant Enterobacteriaceae infections in the United States Using antibiotic prescription data. Open Forum Infect Dis.2019;6(8):ofz344. 10.1093/ofid/ofz344. [DOI] [PMC free article] [PubMed]
- 31.Fabre V, Davis A, Diekema D, et al. Principles of diagnostic stewardship: A practical guide from the Society for Healthcare Epidemiology of America Diagnostic Stewardship Task Force. Infect Control Hosp Epidemiol. 2023;44:178–85. 10.1017/ice.2023.5 [DOI] [PubMed] [Google Scholar]
Associated Data
This section collects any data citations, data availability statements, or supplementary materials included in this article.
Supplementary Materials
Additional file 1: Supplementary Table 1. Hospital demographics.
Additional file 2: Supplementary Table 2. Mortality models.
Additional file 3: Supplementary Table 3. LOS models.
Additional file 4: Supplementary Table 4. ICU LOS models.
Additional file 5: Supplementary Figure 1. Multivariate association between hospital mortality and time to CAZ-AVI use in culture-positive ENT (A) and PsA (B).
Additional file 6: Supplementary Figure 2. Multivariate association between post-culture hospital LOS and time to CAZ-AVI use in culture-positive ENT (A) and PsA (B).
Data Availability Statement
The datasets used and/or analyzed during the current study are available from the corresponding author on reasonable request.