


Abstract
We describe a method to generate in vivo collections of mutants orders of magnitude larger than previously possible. The method favors accumulation of mutations in the target gene, rather than in the host chromosome. This is achieved by propagating the target gene on a plasmid, in Escherichia coli cells, within the region preferentially replicated by DNA polymerase I (Pol I), which replicates only a minor fraction of the chromosome. Mutagenesis is enhanced by a conjunction of a Pol I variant that has a low replication fidelity and the absence of the mutHLS system that corrects replication errors. The method was tested with two reporter genes, encoding lactose repressor or lipase. The proportion of mutants in the collection was estimated to reach 1% after one cycle of growth and 10% upon prolonged cell cultivation, resulting in collections of 1012–1013 mutants per liter of cell culture. The extended cultivation did not affect growth properties of the cells. We suggest that our method is well suited for generating protein variants too rare to be present in the collections established by methods used previously and for isolating the genes that encode such variants by submitting the cells of the collections to appropriate selection protocols.
INTRODUCTION
DNA mutagenesis provides a powerful strategy for analyzing protein functions and/or isolating variants of desired characteristics (for reviews, see 1,2). Two types of approaches can be distinguished. One is site-specific mutagenesis, which can be applied to a relatively small class of proteins for which a model of structure–function relationship has been established. Its efficiency depends on the precision of the model. The other is random mutagenesis, which can be applied to an overwhelming majority of less-characterized proteins for which a structure–function relationship model does not exist. Analysis of the protein variants obtained by random mutagenesis can lead to the establishment of the model and to the isolation of variants with desired properties.
One of the limitations of random mutagenesis is the size of the collection of protein variants that can practically be established. Clearly, the greater the size is, the more likely useful variants will be present in the collection. Two types of approaches have been used to obtain collections of large size, based on mutagenesis either in vivo or in vitro. The first relies on incubation of cells with chemical reagents or on propagation of cells carrying mutator genes (2,3). It should allow the obtaining of very large variant collections, provided that a high enough number of cells is treated. However, the size of collections rarely approaches 108–109 variants, mostly because the proportion of mutants among treated cells is relatively low (≤10–3), even under conditions of heavy mutagenesis, and it becomes impractical to handle very large cell numbers that would be required to exceed this size. Furthermore, since the mutagenesis does not target the protein under study, the host becomes genetically altered. Accumulation of mutations can eventually affect essential host genes that, in turn, cause a reduction in genetic stability and cell viability (a phenomenon termed error catastrophe; 4). For instance, simultaneous lack of three genetic systems in Escherichia coli, dnaQ [affecting the fidelity of the DNA polymerase III (Pol III) which replicates the chromosome], mutHLS (correcting the replication errors) and mutT (preventing the mutagenic incorporation of 8-oxoguanosine triphosphate into the genome), a combination proposed for in vivo mutagenesis (3), tends to lead to such genetic instability, which effectively limits accumulation of the desired variants. Host alteration may also lead to phenotypic changes which may interfere with screening of mutagenized cells, required to identify the useful protein variants.
The second approach, in vitro mutagenesis, is attractive in several respects. It is targeted to a protein under study and yields collections that contain a very high proportion of variants (close to 100%), with an almost unconstrained spectrum of mutations (5–7). However, the size of collections that can be obtained by this approach is still limited to ∼109 variants, essentially because the genes mutated in vitro have to be introduced for propagation and analysis into appropriate host cells by insertion in various cloning vectors and DNA transformation. These steps are not efficient, despite the development of improved sub-cloning techniques (8).
Here we describe a novel in vivo random mutagenesis method, which can be used to generate collections orders of magnitude larger than before. Its main feature is to favor accumulation of mutations in the target gene, rather than in the host chromosome. This is achieved by propagating the target gene in Escherichia coli on a plasmid, within the region that is preferentially replicated by a repair polymerase, the DNA polymerase I (Pol I), rather than the main replicative polymerase, Pol III. Mutagenesis is enhanced by the use of a Pol I variant, which has lower replication fidelity but does not significantly alter the growth properties of the host, even in the absence of the mutHLS correction system. The proportion of mutants in the collection can be estimated to reach 1% after one cycle of growth, and 10% upon prolonged cultivation of the cells. The mutated genes carry substitutions scattered over an ∼1 kb region. The procedure may find direct application in the generation of a large collection of protein variants for which improved or new properties may be selected.
MATERIALS AND METHODS
Media
Minimal (M63) and rich (Luria–Bertani, LB) media, solidified with agar (1.5%) when required, were standard recipes (9). Antibiotics were added as follows: 30 µg/ml chloramphenicol (Cm), 50 µg/ml kanamycin (Kn), 25 µg/ml tetracyclin (Tc), 60 µ/ml spectinomycin (Spc) and 50 µg/ml rifampicin (Rif). LacI– and LacI+ transformants were counted on M63 plates containing glucose (0.4%), thymine (5 × 10⁻³%), 5-bromo-4-chloro-3-indolyl-β-d-galactopyranoside (X-Gal, 40 µg/ml) and Spc. Lipase mutants were scored on LB plates including rhodamine B (8 × 10⁻⁴%, from Sigma), olive oil (1/40 volume, from Sigma) and Spc (10). The LB–rhodamineB–olive oil mix was sonicated at maximal power for ∼1 min, then Spc was added before pouring the plates.
Strains
The E.coli strains used in this study are listed in Table 1. They were grown at 37°C. They were all derived from the JJC99 strain and were constructed by P1 transduction and/or F′ conjugation as described (9). GMEc4 was obtained after excision of the KnR cassette from the cystein locus of GMEc3, restoring cystein prototrophy. For this, a GMEc3 culture was grown in non-selective LBT, 2 ml of culture were centrifuged, washed in M63 and re-suspended in 1 ml of M63 before plating on M63 containing 0.4% glucose as carbon source and supplemented or not with cystein (0.2%). The frequency of cys+ KnR cells was ~10–8. At each step of strain construction, the MutHLS– phenotype was controlled by measuring the frequency of RifR colonies, due to mutations at the chromosomal rpoB marker, determined by plating cultures overnight on LB plates supplemented or not by Rif. Values are averages of at least six independent cultures. The ΔpolA::Kn, polA(D355A, E357A) (designated polA*) and dnaE915 genotypes of GMEc5, GMEc6 and GMEc7 were verified by sequencing. A portion of the polA gene was amplified by PCR (primers 5′-CCAGCCGCGAAGCCACAGGAAACC-3′ at positions 910–933, and 5′-GCCGTAGTTCGCCAGAATACCGCG-3′ at positions 1273–1296, numbering begins at the polA start codon) to yield a 387 bp fragment containing the GAT→GCT (D355A) and GAA→GCA (E357A) mutations. The PCR product was treated with exonuclease I and shrimp alkaline phosphatase (from Amersham) for direct sequencing, using the Applied Biosystems PRISM BigDye terminator sequencing kit, the Perkin Elmer 9600 thermal cycler and the Applied Biosystems 377 DNA sequencer. In a similar way, a 1205 bp fragment of the dnaE915 gene was PCR-amplified (primers 5′-CCGCGTGCTGGGGCATCCGTACGGC-3′ at positions 1337–1362 and 5′-CCTCAATCGGACCTTCACCGACCCC-3′ at positions 2518–2542 from the dnaE start codon) and sequenced to confirm the presence of the GCG→ACG mutation (A498T). Oligonucleotides were synthesized with a Beckman DNA Oligo 1000 synthesizer.
Table 1. Bacterial strains.
| Strain | Genotype [derivation]a | Main phenotype | Reference or source |
|---|---|---|---|
| JJC99 | deo A21 | WT | Laboratory stock |
| JJC672 | polA::KnR F′(polA(D355A, E357A) CmR) KL241 | Pol I* | 17 |
| JJC731 | mutS3 cys::Tn10Kan (KnR) trp | MutHLS– | Laboratory stock |
| JJC592 | mutL218::Tn10 (TcR) recF332::Tn3 | MutHLS– | Laboratory stock |
| JJC724 | dnaE915 zae502::Tn10 (TcR) | DnaE915 | 23 |
| GMEc1 | GMEc2, but ΔpolA::KnR [P1(JJC672)→KnR] | Pol I* | This work |
| GMEc2 | JJC99, but polA* [F′(polA(D355A, E357A) CmR)] | Pol I, Pol I* | This work |
| GMEc3 | GMEc2, but mutS cys::Tn10Kn [P1(JJC731)→KnR] | Pol I, Pol I*, MutHLS– | This work |
| GMEc4 | GMEc3, but cys+ [→KnS] | Pol I, Pol I*, MutHLS– | This work |
| GMEc5 | GMEc1, but mutL::Tn10 [P1(JJC592)→TcR] | Pol I*, MutHLS– | This work |
| GMEc6 | GMEc4, but ΔpolA::KnR [P1(JJC672)→KnR] | Pol I*, MutHLS– | This work |
| GMEc7 | GMEc6, but dnaE915 [P1(JJC724)→TcR] | Pol I*, MutHLS–, DnaE915 | This work |
| GMEc11 | JJC99, but mutS cys::Tn10Kn [P1(JJC731)→KnR] | Pol I, MutHLS– | This work |
aDerivation [in brackets] denotes the P1 donor used to construct the strain, the arrow pointing toward the selected marker. dnaE915 is an hypo-mutator allele of the dnaE gene.
Plasmids
Plasmids were pBluescript II KS+ (Stratagene), pIC156 (11), pMTL500E (12) and the Lipolase® encoding vector pKN3-Lip2 (KTH,S). The reporter-bearing plasmids are represented in Figure 1. They are derived from pBluescript and contain lacI at +165 bp (site of the start codon of the gene), +700 bp or +2000 bp (denoted close, mid or far position, respectively), counting from the initiation site of DNA replication at the ColE1 replication origin. The gene encoding Lipolase® was inserted at +230 bp, (denoted close position). Orientation of the genes was in all cases such that the transcription was co-directional with plasmid replication.
Figure 1.
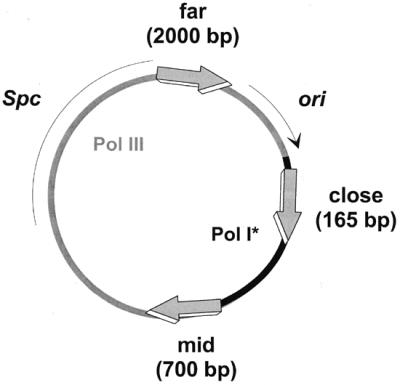
Schematic representation of reporter-containing plasmids. The reporter genes (big arrows) at close, mid and far positions and the spectinomycin-resistant determinant (thin line) are indicated. The ColE1-type origin is represented by a thin arrow (ori). Replication is initiated by Pol I at the tip of the arrow and progresses clockwise. The areas replicated by Pol I and Pol III are indicated by black and grey lines respectively, the region of Pol I/Pol III transition being arbitrarily localized.
Enzymes
Restriction and other enzymes used for DNA manipulations were purchased from commercial sources and were used as recommended by the manufacturers.
Mutagenesis
To determine mutant frequency, strains were transformed with a reporter-bearing plasmid by the CaCl2 method (9). Isolated SpcR colonies were inoculated into 2 ml of LB medium supplemented with Spc and grown for 20 h (∼30 generations) with agitation. Plasmids were then extracted from each culture using an alkaline lysis method, and used to transform the wild-type E.coli JJC99 strain by electroporation with a Bio-Rad apparatus in accordance with the manufacturer’s recommendations. In the case of the lacI reporter gene, aliquots of appropriate cell dilutions were plated on selective X-Gal and LB plates to determine mutant (blue colonies) and total cell counts, respectively (9). Mutant frequencies were based in most cases on an average of 30 independent cultures. The mutagenesis of the lipase gene was carried out in a similar way, except that mutants (white colonies) were identified among wild-type clones (red colonies) on rhodamine B plates (10) (olive oil degraded by the active lipase generates free fatty acids which in turn react with rhodamine B and form a colored complex).
RESULTS AND DISCUSSION
Experimental system
DNA polymerase. In E.coli, Pol III is responsible for the bulk of chromosomal synthesis, and Pol I replicates <1% of the chromosome by acting in completion of Okazaki fragments and in DNA repair (for review, see 13). In ColE1-type plasmids, Pol I is essential for the initiation of DNA replication (13). It initiates leading-strand synthesis and generates replication intermediates that contain a D-loop structure of several hundred nucleotides. Pol I is then replaced by Pol III, which completes the replication of the molecule. The detailed mechanism and the location of the switch from the initiating to the elongating polymerase are not known. However, several reports suggest that the region replicated by Pol I can be as long as 1–2 kb (for review, see 14). This preferential replication of a gene-sized sequence located downstream of the origin of ColE1-type plasmids by Pol I provides the basis of our system.
Like many polymerases, Pol I is an accurate enzyme with a rate of misincorporation of ∼10–5–10–6 (for reviews, see 15,16). The greatest contribution to fidelity (10–4–10–5) are the geometrical and electrostatic barriers found within the active site, which reduce incorporation of inappropriate nucleotides. Another factor, responsible for a 10–100-fold increase in the polymerase accuracy, is its proofreading activity. An error-prone derivative of Pol I (designated Pol I* hereafter), mutated in the proofreading domain (D355A, E357A), has been constructed. It displays almost no proofreading activity but has normal polymerase activity (17). We used this enzyme to enhance mutation frequency of the target genes.
Fixation of mutations. The mismatch repair proteins MutHLS, in conjunction with the helicase UvrD, constitute an important replication-associated correction system that prevents fixation of replication errors (for reviews, see 18). The system recognizes mismatches, discriminates between the old and new strand by recognizing the methylation state of a short sequence, excises mismatched bases from the newly synthesized strand and then restores the correct sequence by repair synthesis. Escherichia coli strains with a disabled mismatch repair system were used here to enhance fixation of the polymerase errors.
Reporter genes and plasmid vector. The E.coli lacI gene and the Humicola lanuginosa lipase gene were used as reporters to assay efficiency of mutagenesis (9,10). The genes were carried on an E.coli vector containing a ColE1-type replicon and were inserted at different distances from the replication origin (Fig. 1, the large arrows indicate the position and orientation of the reporter genes), in order to assess mutation frequency due to Pol I- or Pol III-dependent replication.
Determination of mutation frequency. Mutagenesis was carried out by propagation of reporter-containing plasmids for about 30 generations in the mutagenic strain. To assess the mutation frequency plasmids were extracted and used to transform an indicator strain on plates allowing discrimination of parental and mutant genes by a colored assay (LB + X-Gal or LB + rhodamine B + olive oil for LacI or lipase phenotypes, respectively. See Materials and Methods for more details; 9,10). In the case of LacI, as the indicator strain carries a wild-type copy of the reporter gene, the screen only detects transdominant negative mutations (LacI–d phenotype; 9). These mutations abolish the binding of LacI to the operator by alteration in the DNA binding domain, and prevent that of the wild-type LacI through formation of inactive heterotetramers (9). The screen only selects for mutations in the first 180 nucleotides of lacI gene which encode the DNA binding domain. In contrast, the lipase assay allows detection of mutations scattered all along the gene.
High mutagenesis in the plasmid origin region
The proportion of LacI mutants in strains encoding Pol I* and lacking the mismatch repair system (GMEc5 and GMEc6) was about 1 in 1000 for the gene inserted close to the plasmid origin (Table 2; the difference between mutL and mutS strains is not significant). Such a high value is due to the conjunction of Pol I and mut mutations, as deduced from the following observations.
Table 2. Frequencies of LacI–d and RifR mutants in different strains.
| Pol Ia | Mutb | Lac I–d (×10–6) | RifR (×10–6) | ||
|---|---|---|---|---|---|
| Close | Far | ||||
| GMEc5 | * | L | 2140 ± 590 | 114 ± 35 | 3.3 ± 1 |
| GMEc6 | * | S | 1060 ± 295 | 160 ± 15 | 8 ± 1 |
| GMEc11 | WT | S | 320 ± 78 | ND | ND |
| GMEc1 | * | WT | 57 ± 10 | 10 ± 2 | 0.01 ± 0.006 |
The lacI-containing plasmid was propagated for approximately 30 generations in the mutagenic strains before analysis for mutation frequency (see Materials and Methods). Values are medians from five to more than 50 independent experiments ± SEM. WT, wild-type; ND, not determined.
aAsterisks denote mutations in the proofreading domain of Pol I (D355A, E357A; 17).
bThe inactivated protein is indicated.
The role of the mutagenic Pol I is first illustrated by the fact that the mutations in the gene carried close to the origin, likely replicated by Pol I, were 6–20-fold more frequent than in the gene carried far from the origin, likely replicated by Pol III (Table 2). A gene inserted at the mid position accumulated mutations with an intermediate rate (270 37 × 10–6) in the GMEc6 strain. Furthermore, in the strain GMEc7, carrying mutation dnaE915, which increases the fidelity of Pol III by a factor two to five (19), the frequency of mutants remained unchanged at the close position (1453 290 × 10–6) whereas it decreased ∼2-fold at the far position (82 17 × 10–6). Finally, mutant frequency was 3–6-fold lower in a strain encoding wild-type Pol I than in the strain encoding Pol I* (Table 2, compare GMEc5 and 6 with GMEc11).
The role of the mismatch repair system is illustrated by the fact that the mutant frequency was higher in the mut than in the wild-type strains (compare GMEc5 and 6 with GMEc1; Table 2). However, the effect of the mut system was stronger in the chromosome (300–800-fold, RifR; Table 2) than in the plasmid, either for the close (20–40-fold) or the far position (10–20-fold). The lower efficiency of the mismatch correction system on the plasmid-carried genes is not understood at present.
Only a particular class of mutations in the lacI gene, likely to be confined to the first 60 amino-acid of the protein, can be detected in our system (see above). In order to estimate the efficiency of mutagenesis with a larger target, we used the lip gene (encoding a lipase) of 870 nt. Inactivating mutations should occur all along this gene, which was cloned in the close position. The frequency of lip mutants was 5180 × 10–6, up to 5-fold higher than that of lacI mutants. Since only ∼25% of mutations in any gene lead to complete inactivation (4,20,21) and our test would detect only this class of mutations, the proportion of mutants is probably >1%.
The proportion of mutants in a culture should increase upon strain propagation, due to the increase in the number of mutagenic replication cycles, provided that the genetic instability of the strain is not so high as to lead to the so-called error catastrophe (4). Since the combination of Pol I* and Mut deficiency had only a limited effect on the mutation frequency of a chromosomal gene (Table 2, rpoB gene) and had no adverse effects on growth rate upon prolonged cultivation of the strain (see below), such catastrophe should not take place in our system. The frequency of mutants for the lacI gene carried on a plasmid in the close position and propagated in the GMEc6 strain increased indeed ∼10-fold after 150 generations (Fig. 2). The plasmids did not accumulate gross changes, such as deletions, during prolonged growth, as judged from the size of their DNA analyzed by gel electrophoresis (data not shown). The increase in mutant frequency was not due to enrichment of LacI– cells, as shown in a competition experiment. In the experiment, ‘old’ LacI– (blue) GMEc6 cells isolated after the prolonged growth (150 generations) were mixed in a 50:50 ratio to ‘fresh’ transformants of GMEc6 harboring the LacI+ (white) plasmid. After 40 generations, the mixed population was plated on LBT+X-Gal medium for measurement of the proportion of blue/white colonies. Six independent old blue colonies were tested in this competition assay. No change in the white/blue ratio was observed. This shows that the blue cells detected after 150 generations do not have any growth advantage over fresh white cells, thus ruling out the possibility that the increased proportion of LacI– cells after prolonged growth results from enrichment of mutant cells (which would be revealed by the increased proportion of old cells). It also illustrates that prolonged cultivation of the cells has no adverse effect on their growth rate, which would result in the increase of the proportion of fresh cells.
Figure 2.

Prolonged growth and mutant frequency. The plasmid containing lacI at the close position was propagated in GMEc6 (Pol I* MutHLS–) for 150 generations using serial dilutions to obtained successive cycles of growth, and was analyzed for mutation frequency. The relative frequency of lacI mutants is given as a function of the generation number. Results of two independent experiments are considered.
Mutation profiles
To analyze the mutation profiles at the close position, 20 LacI and 24 lipase mutants were sequenced. Results show that the mutations are scattered over an ∼1 kb region (Fig. 3). As expected, lacI mutations were mainly located in the LacI/operator binding domain, corresponding to the first 60 residues of LacI protein (LacI–d phenotype; 9). The mutation spectrum was as described previously for Pol I (22), as we observed 56% of transitions (39% of A→G and 17% of T→C), 9% of transversions (7% of G→T and 2% of G→C) and 35% of frameshifts, which were mainly detected at two nucleotide stretches (six A and six C) within the lipase gene (two hotspots). The proportion of double mutants was 4%.
Figure 3.

Mutation distribution downstream of the plasmid origin. Twenty LacI– and 24 Lipase– independent mutants isolated from GMEc6 (Pol I* MutHLS–) were sequenced. The thin line represents plasmid sequences, the bent arrow, the initiation site of DNA replication at ori and the bold lines, the reporter genes. Dots denote positions of mutations. In lacI, 14 different mutated bases were observed, one occurred seven times and another twice.
CONCLUSIONS
We describe a simple and fast procedure to generate random mutations within a defined region of DNA in E.coli cells. Its main advantage is to provide mutant collections orders of magnitude larger than conventional methods, in an E.coli strain, which is, for practical purposes, genetically stable. The size of the collection can be estimated as follows. A liter of E.coli culture grown in a shaking flask in standard rich medium contains about 1012 cells and 1014 plasmids of the type we used. Since the mutant frequency is close to 10–2 after a single cycle of growth, and can be increased 10-fold in about 150 generations, the collection should contain 1012–1013 mutants. This compares favorably with a value of 109, which is close to the limit of the previously used methods, and still far from the theoretical number of single mutant proteins of 300–600 amino acids long (≥10400). It is evident that the larger the collection is, the higher is the probability of finding the interesting variants, and better is the gene mutant coverage. Use of more efficient cultivation methods (richer broth or fermentors) could further improve the collection size 10–100 times. This makes the procedure very well suited for generating protein variants too rare to be present in the collections established until now. Such variants could be isolated by submitting the cells that contain them to appropriate selection protocols.
Acknowledgments
ACKNOWLEDGEMENTS
We thank Catherine Joyce for the gift of an E.coli strain encoding the error-prone form of Pol I. We are especially grateful to Bénédicte Michel for the gift of numerous strains, helpful discussions and critical reading of the manuscript. This work was supported, in part, by a grant from the EEC (BIO4-CT96-0493). L.J. is on the CNRS research staff.
REFERENCES
- 1.Smith M. (1985) Annu. Rev. Genet., 19, 423–462. [DOI] [PubMed] [Google Scholar]
- 2.Botstein D. and Shortle,D. (1985) Science, 229, 1193–1201. [DOI] [PubMed] [Google Scholar]
- 3.Greener A., Callahan,M. and Jerpseth,B. (1996) In Trower,M.K. (ed.), In VitroMutagenesis Protocols. Humana Press, NJ, pp. 375–385. [Google Scholar]
- 4.Fijalkowska I.J. and Schaaper,R.M. (1996) Proc. Natl Acad. Sci. USA, 93, 2856–2861. [DOI] [PMC free article] [PubMed] [Google Scholar]
- 5.Lehtovaara P.M., Koivula,A.K., Bamford,J. and Knowles,J.K.C. (1988) Protein Eng., 2, 63–68. [DOI] [PubMed] [Google Scholar]
- 6.Loeb D.D., Swanstrom,R., Everitt,L., Manchester,M., Stamper,S.E. and HutchisonC.A.,III (1989) Nature, 340, 397–400. [DOI] [PubMed] [Google Scholar]
- 7.Cadwell R.C. and Joyce,G.F. (1992) PCR Methods Appl., 2, 28–33. [DOI] [PubMed] [Google Scholar]
- 8.Melnikov A. and Yougman,P.J. (1999) Nucleic Acids Res., 27, 1056–1062. [DOI] [PMC free article] [PubMed] [Google Scholar]
- 9.Miller J.H. (1992) A Short Course In Bacterial Genetics : A Laboratory Manual And Handbook For Escherichia coli And Related Bacteria. Cold Spring Harbor Laboratory Press, Cold Spring Harbor, New York.
- 10.Gaskin D.J., Bovagnet,A.H., Turner,N.A. and Vulfson,E.N. (1997) Biochem. Soc. Trans., 25, 15S. [DOI] [PubMed] [Google Scholar]
- 11.Steinmetz M. and Richter,R. (1984) Gene, 142, 79–83. [DOI] [PubMed] [Google Scholar]
- 12.Oultram J.D., Loughlin,M., Swinfield,T.-J., Brehm,J.K., Thompson,D.E. and Minton,N.P. (1988) FEMS Microbiol. Lett., 56, 83–88. [Google Scholar]
- 13.Kornberg A. and Baker,T. (1992) DNA replication, 2nd edn. W.H. Freeman and Co., New York, NY.
- 14.Espinosa M., Cohen,S., Couturier,M., Del Solar,G., Diaz-Orejas,R., Giraldo,R., Jannière,L., Miller,C., Osborn,M. and Thomas,C.M. (2000) In Thomas,C.M. (ed.), The Horizontal Gene Pool. Harwood Academic Publishers, London, pp. 1–47.
- 15.Kunkel T.A. (1992) J. Biol. Chem., 267, 18251–18254. [PubMed] [Google Scholar]
- 16.Goodman M.F. (1997) Proc. Natl Acad. Sci. USA, 94, 10493–10495. [DOI] [PMC free article] [PubMed] [Google Scholar]
- 17.Derbyshire V., Grindley,N.D.F. and Joyce,C.M. (1991) EMBO J., 10, 17–24. [DOI] [PMC free article] [PubMed] [Google Scholar]
- 18.Modrich P. (1991) Annu. Rev. Genet., 25, 229–253. [DOI] [PubMed] [Google Scholar]
- 19.Fijalkowska I.J., Dunn,R.L. and Schaaper,R.M. (1993) Genetics, 134, 1023–1030. [DOI] [PMC free article] [PubMed] [Google Scholar]
- 20.Markiewicz P., Kleina,L.G., Cruz,C., Ehret,S. and Miller,J.H. (1994) J. Mol. Biol., 240, 421–433. [DOI] [PubMed] [Google Scholar]
- 21.Shafikhani S., Siegel,R.A., Ferrari,E. and Schellenberger,V. (1997) Biotechniques, 23, 304–310. [DOI] [PubMed] [Google Scholar]
- 22.Bell J.B., Eckert,K.A., Joyce,C.M. and Kunkel,T.A. (1997) J. Biol. Chem., 272, 7345–7351. [DOI] [PubMed] [Google Scholar]
- 23.Fijalkowska I.J. and Schaaper,R.M. (1993) Genetics, 134, 1039–1044. [DOI] [PMC free article] [PubMed] [Google Scholar]