Abstract
The heart is an excitable medium which is excited by membrane potential depolarization and propagation. Membrane potential depolarization brings in calcium (Ca) through the Ca channels to trigger intracellular Ca release for contraction of the heart. Ca also affects voltage via Ca-dependent ionic currents, and thus, voltage and Ca are bidirectionally coupled. It has been shown that the voltage subsystem or the Ca subsystem can generate its own dynamical instabilities which are affected by their bidirectional couplings, leading to complex dynamics of action potential and Ca cycling. Moreover, the dynamics become spatiotemporal in tissue in which cells are diffusively coupled through voltage. A widely investigated spatiotemporal dynamics is spatially discordant alternans (SDA) in which action potential duration (APD) or Ca amplitude exhibits temporally period-2 and spatially out-of-phase patterns, i.e., APD-SDA and Ca-SDA patterns, respectively. However, the mechanisms of formation, stability, and synchronization of APD-SDA and Ca-SDA patterns remain incompletely understood. In this paper, we use cardiac tissue models described by an amplitude equation, coupled iterated maps, and reaction-diffusion equations with detailed physiology (the ionic model) to perform analytical and computational investigations. We show that, when the Ca subsystem is stable, the Ca-SDA pattern always follows the APD-SDA pattern, and thus, they are always synchronized. When the Ca subsystem is unstable, synchronization of APD-SDA and Ca-SDA patterns depends on the stabilities of both subsystems, their coupling strengths, and the spatial scales of the initial Ca-SDA patterns. Spontaneous (initial condition-independent) synchronization is promoted by enhancing APD instability and reducing Ca instability as well as stronger Ca-to-APD and APD-to-Ca coupling, a pattern formation caused by dynamical instabilities. When Ca is more unstable and APD is less unstable or APD-to-Ca coupling is weak, synchronization of APD-SDA and Ca-SDA patterns is promoted by larger initially synchronized Ca-SDA clusters, i.e., initial condition-dependent synchronization. The synchronized APD-SDA and Ca-SDA patterns can be locked in-phase, antiphase, or quasiperiodic depending on the coupling relationship between APD and Ca. These theoretical and simulation results provide mechanistic insights into the APD-SDA and Ca-SDA dynamics observed in experimental studies.
I. INTRODUCTION
The function of the heart is to pump blood via mechanical contraction and relaxation. Contraction and relaxation of the heart are regulated by intracellular calcium (Ca) which rises and decays following the membrane potential depolarization and repolarization cycle. This process is called excitation-contraction coupling [1]. On the other hand, the membrane potential or voltage is also affected by Ca via Ca-dependent ionic currents, and thus, Ca and voltage are bidirectionally coupled. Complex action potential duration (APD) and Ca cycling dynamics can occur due to instabilities originating from the voltage subsystem (voltage driven) or the Ca subsystem (Ca driven), as well as their bidirectional couplings [2]. Alternans, a period-2 behavior, is the most widely investigated nonlinear dynamics in cardiac systems, including animal experiments and clinical settings [3–12]. Theoretical and simulation studies have shown that alternans can arise from instabilities originating from voltage [6,7,13] or Ca cycling [14–20], which can be potentiated or attenuated by the bidirectional couplings of the two [21–23]. Both voltage- and Ca-driven alternans have been demonstrated in experimental studies [6,24–30]. Since voltage and Ca are coupled, voltage-driven alternans can result in Ca alternans, and Ca-driven alternans can result in APD alternans. Clinically, alternans manifests in the hearts as either pulsus (mechanical) alternans or T-wave (electrical) alternans. Pulsus and T-wave alternans are widely known as precursors of lethal ventricular arrhythmias and sudden cardiac death [3,4,9,10,12]. A potential mechanism linking alternans to arrhythmias is spatially discordant alternans (SDA) [31–37] in which APD or Ca exhibits a temporally period-2 but spatially out-of-phase (or antiphase) behavior (see Fig. 1), referred to as APD-SDA and Ca-SDA in this paper, respectively. APD-SDA results in large APD gradients, making the tissue susceptible to conduction block and formation of spiral waves [31,33] or generation of arrhythmia triggers [38]. Therefore, understanding the mechanisms of SDA can provide insights into the understanding of cardiac arrhythmogenesis.
FIG. 1.
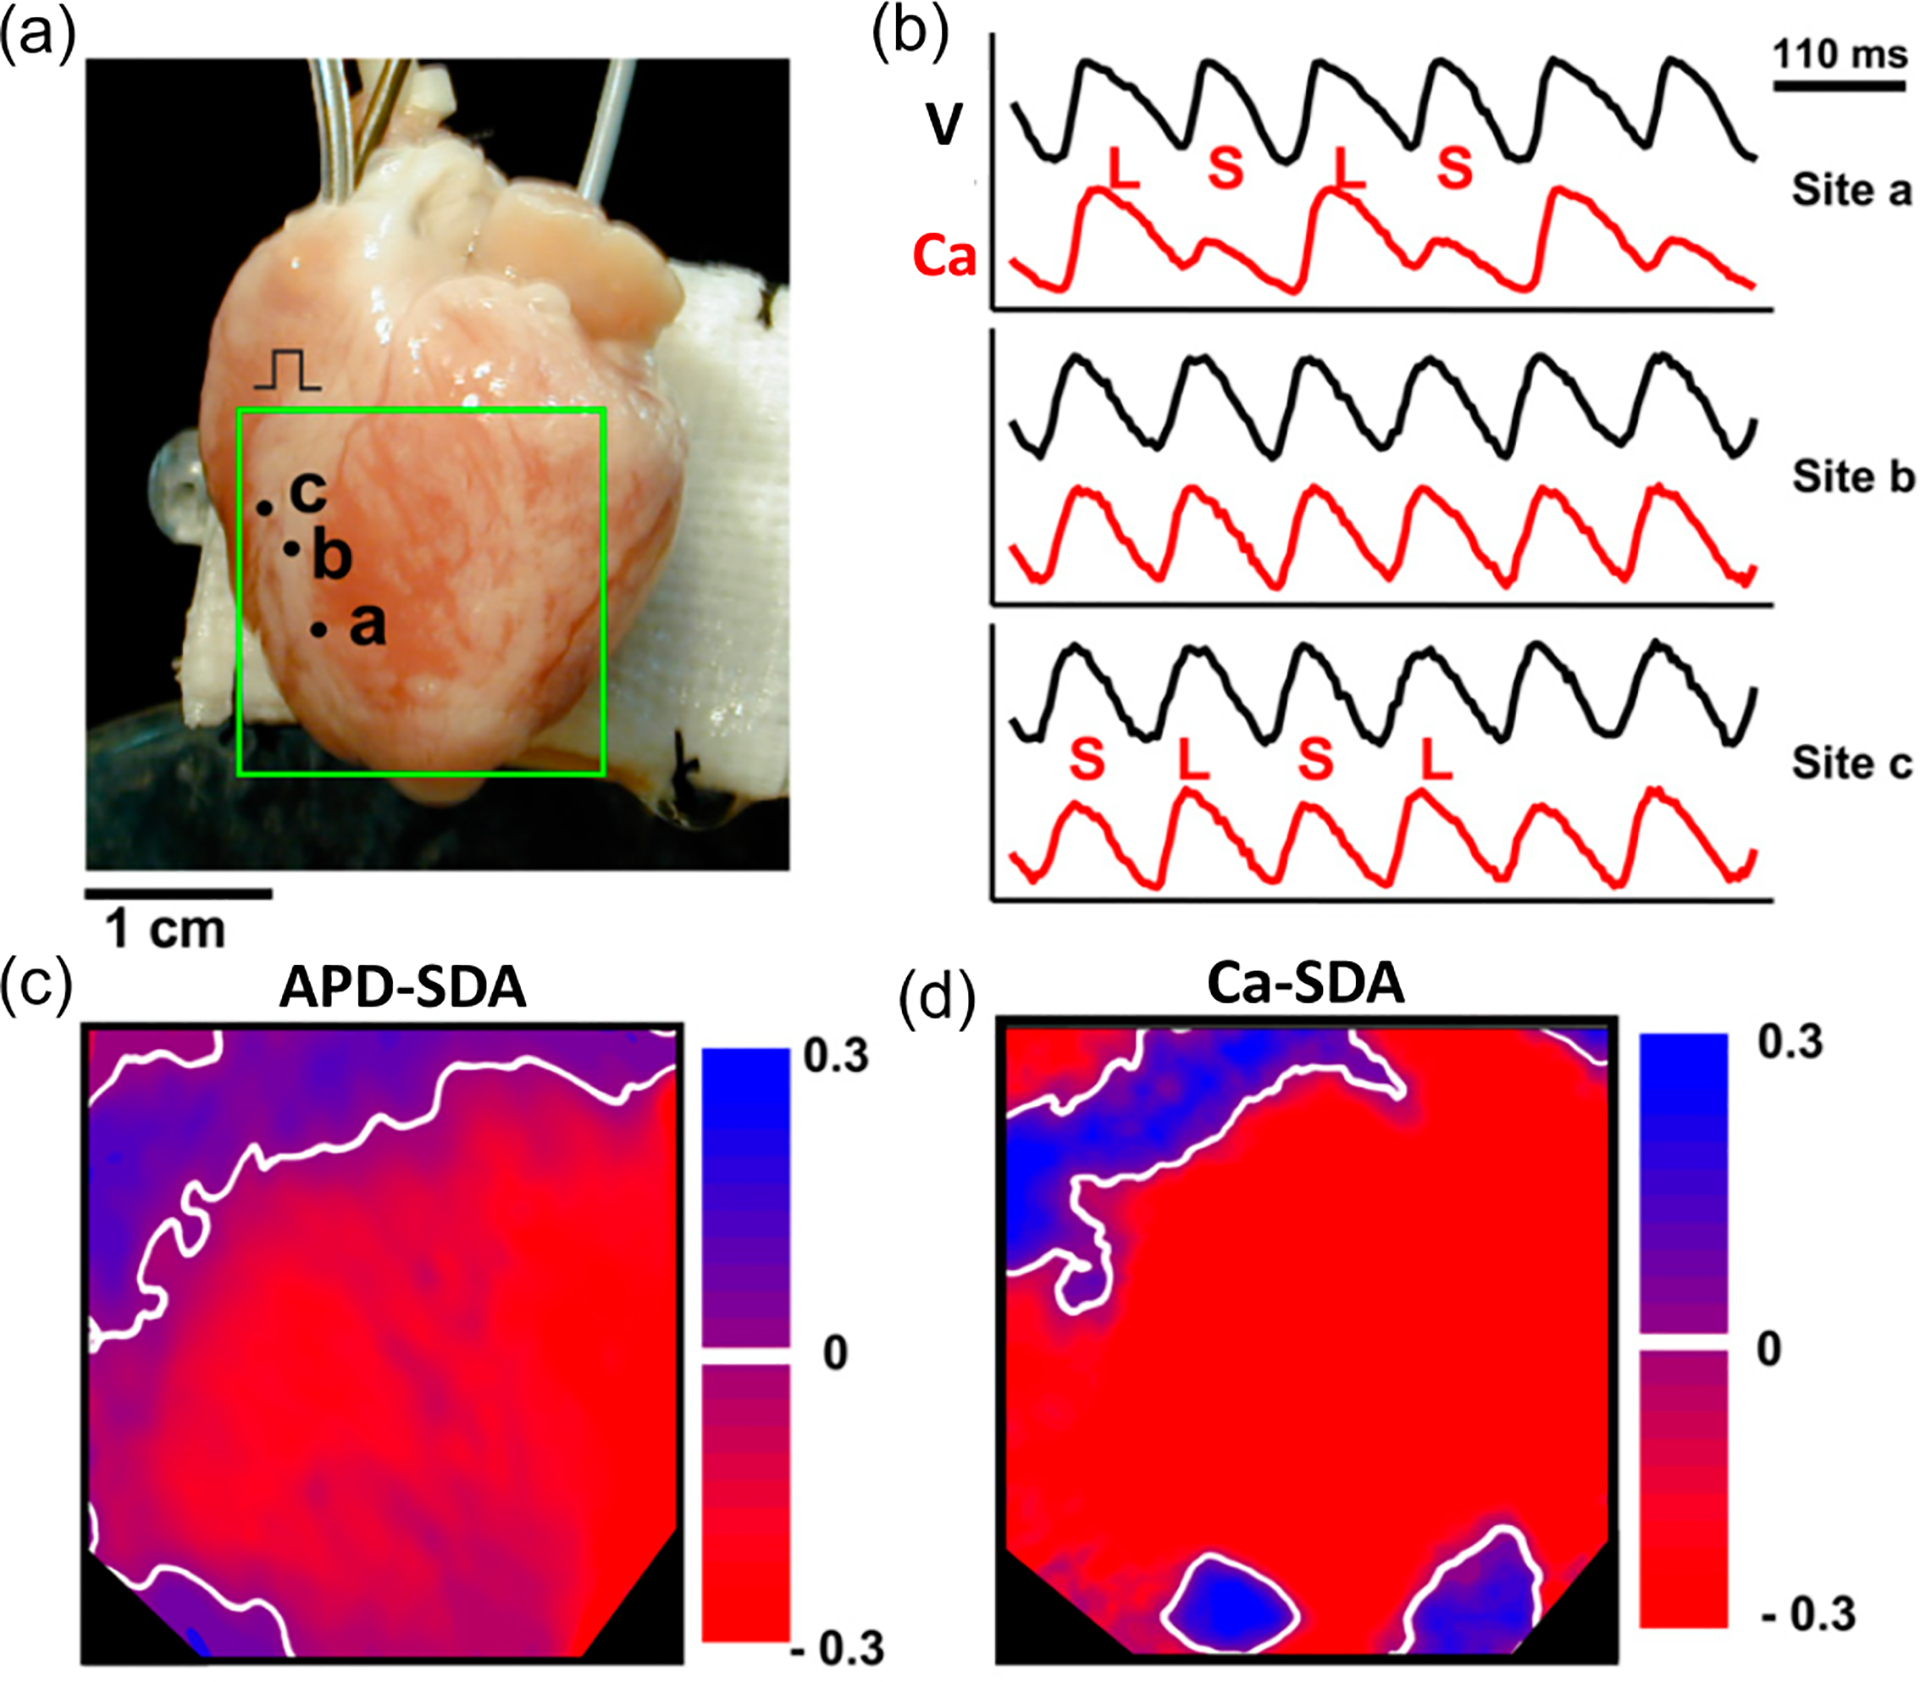
Spatially discordant action potential duration (APD) and Ca alternans in a rabbit heart. (a) An image of a rabbit heart and the optical mapping area. (b) Simultaneous recordings of voltage and Ca from three different sites marked in (a). (c) Nodal lines (white) in APD alternans map. (d) Nodal lines (white) in the Ca alternans map. Modified from Hayashi et al. [44].
The genesis of APD-SDA has been widely investigated in previous studies [33,39–41], which mainly focus on the role of conduction velocity (CV) restitution (CVR). CVR is an action potential conduction property in which CV changes as the diastolic interval (DI) changes due to incomplete recovery of the sodium current or changes in excitability [32,33,42,43]. The role of CVR in APD-SDA is supported by some experiments [24,44–47] but not by others [47–49]. In recent simulation and theoretical studies [50,51], we performed systematic analyses on the roles of CVR, tissue heterogeneities, convection due to conduction, and nodal line curvature in the genesis and dynamics of APD-SDA, which provide additional theoretical insights for those experiments that do not support the mechanism of CVR-indued APD-SDA. However, these theoretical studies do not consider the condition when Ca-driven alternans is also present. Since Ca and voltage are bidirectionally coupled, when APD alternans becomes spatially discordant, Ca alternans may also be spatially discordant, or vice versa. Experimental studies [44,48,49,52] have shown that during SDA, the nodal lines of APD-SDA may or may not colocalize with those of the Ca-SDA, i.e., the APD-SDA and Ca-SDA may or may not synchronize with each other. Figure 1 shows such an example from optical mapping experiments in a rabbit heart by Hayashi et al. [44]. In this example, the APD-SDA nodal lines colocalize with the Ca-SDA nodal lines in the upper region of the mapping area but not in the lower region. In the lower region, there are Ca-SDA nodal rings without corresponding APD-SDA nodal rings. This indicates that, in the upper region, the Ca-SDA pattern is synchronized with the APD-SDA pattern but not in the lower region. Therefore, there is a key question to be addressed: when and how are APD-SDA patterns and Ca-SDA patterns synchronized in cardiac tissue?
Answering this question is important for understanding cardiac arrhythmogenesis [53]. Since a critical APD gradient is needed for reentry initiation [54–57], synchronization of Ca-SDA and APD-SDA patterns is needed for the Ca-driven alternans to result in a large enough APD gradient. In other words, since Ca is not directly coupled between cells [Fig. 2(a)], it can alternate out-of-phase in space. If Ca is not synchronized in space with APD, its effect on APD will be averaged out in space since voltage is diffusively coupled between cells. Previous simulation studies have investigated the formation of SDA in the presence of Ca-driven alternans [44,58–60], but they have not addressed the question of when and how APD-SDA and Ca-SDA patterns can be synchronized. In this paper, we perform a systematic theoretical study combined with computer simulations to understand the formation and stability of SDA patterns in the presence of both voltage-driven instability (or voltage-driven alternans) and Ca-driven instability (or Ca-driven alternans), particularly synchronization of the APD-SDA pattern with the Ca-SDA pattern. We use three types of mathematical models of different complexity and physiological details, i.e., the amplitude equation (AE) model with generic kinetics, the coupled map lattice (CML) model incorporating certain physiological properties, and the ionic model (i.e., the rabbit ventricular myocyte model by Mahajan et al. [61]) describing the detailed physiological processes. Spatiotemporal APD and Ca dynamics in both one-dimensional (1D) cable and two-dimensional (2D) tissue models are investigated. Through theoretical analyses and computer simulations of these models, we reveal the conditions and mechanisms for the formation and synchronization of APD-SDA and Ca-SDA patterns, which provides mechanistic insights into the formation and synchronization of the APD-SDA and Ca-SDA patterns observed in experimental studies.
FIG. 2.
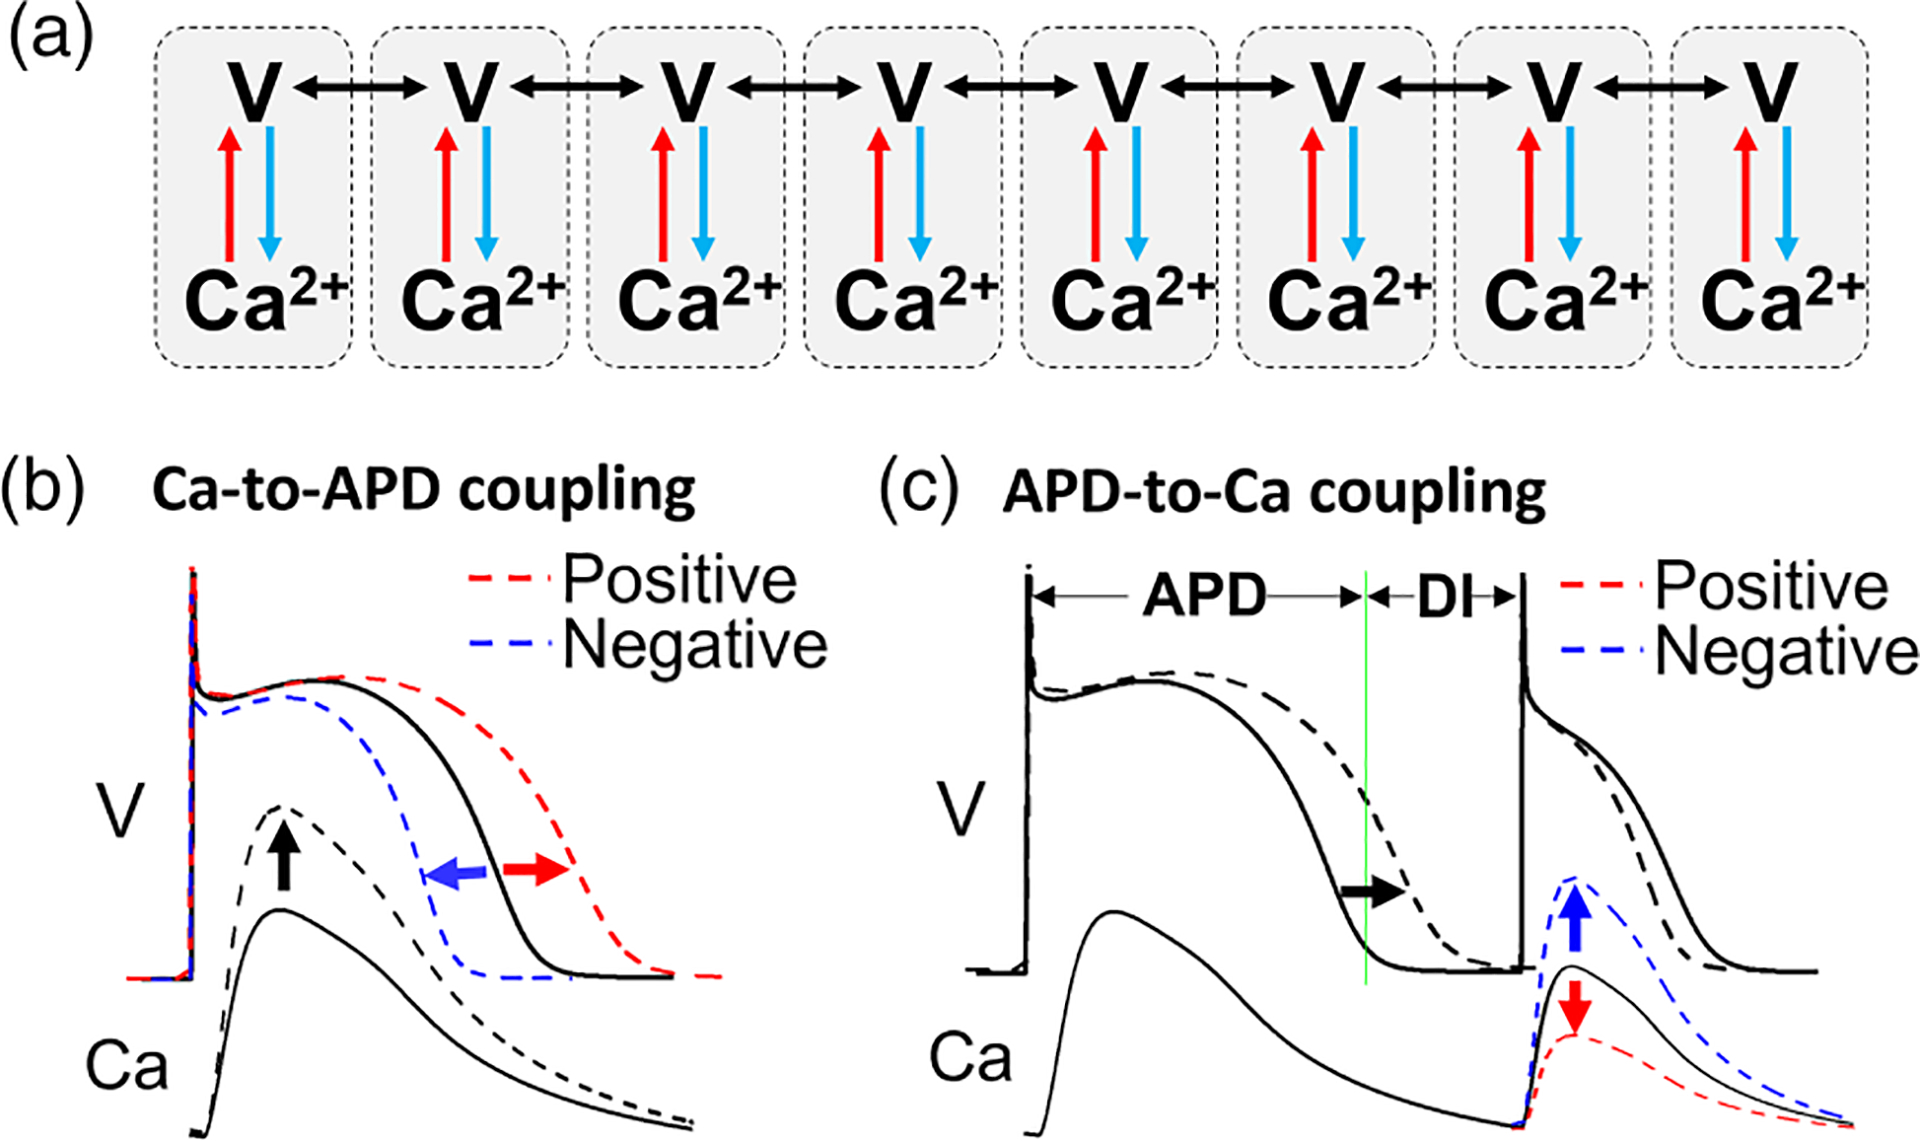
Schematic diagrams of cell-to-cell coupling and Ca and voltage coupling. (a) A schematic diagram of coupling between cells and coupling between voltage and Ca in a chain of cardiac cells. (b) Ca–to–action potential duration (APD) coupling. Increasing Ca (black dashed) can either lengthen APD (positive Ca-to-APD coupling) or shorten APD (negative Ca-to-APD coupling). (c) APD-to-Ca coupling. Lengthening APD in the first beat causes shortening of diastolic interval (DI), which may result in either a smaller Ca (positive APD-to-Ca coupling) or a larger Ca (negative APD-to-Ca coupling) in the second beat. See main text for more detailed description.
II. METHODS AND MATERIALS
A. Mathematical models
The AE model is described in the corresponding section in the Results. Details of the CML and ionic models are described in the Appendix.
B. Voltage and Ca coupling
Figure 2(a) is a schematic plot for voltage and Ca coupling and cell-to-cell coupling in cardiac tissue. In cardiac tissue, the cells are electrically coupled via ion channels called gap junctions. When one cell depolarizes, the voltage differences between this cell and its neighbors result in current flows to its neighbors, causing the neighboring cells to depolarize. Although Ca may also pass through the gap junction to cause cell-to-cell Ca coupling [62], it is believed that this coupling is very weak, which is omitted in computational cardiac tissue models. Here, we also assume that there is no cell-to-cell Ca coupling, and the cells are coupled only via voltage.
Ca and voltage are bidirectionally coupled within a cell via the Ca-dependent ionic currents as well as Ca-dependent signaling. We refer to the couplings as Ca-to-APD coupling and APD-to-Ca coupling, as detailed below.
1. Ca-to-APD coupling
Ca affects APD via Ca-dependent ionic currents or Ca-dependent signaling which then regulates ionic currents. For example, increasing Ca increases Na-Ca exchange current (INCX), which is an inward current, prolonging APD. Increasing Ca enhances Ca-dependent inactivation of the L-type Ca current (ICa,L), shortening APD. Increasing Ca also increases the slow component of the delayed rectifier potassium current (IKs) and the Ca-activated small conductance potassium current (ISK) [63,64], which are outward currents activated by Ca , shortening APD. Therefore, increasing Ca can either lengthen or shorten APD [Fig. 2(b)], which results in positive Ca-to-APD coupling or negative Ca-to-APD coupling, respectively.
2. APD-to-Ca coupling
APD affects Ca mainly in two ways. First, lengthening APD affects Ca entry and extrusion via changing ICa,L and INCX, which change the Ca load for the next beat. The amount of Ca released is larger for a higher sarcoplasmic reticulum (SR) Ca load, and this property is called the refractional release relationship [65,66]. Second, lengthening APD shortens DI preceding the next beat, reducing the availability of L-type Ca channels as well as that of the Ca release channels, called ryanodine receptors, for opening due to incomplete recovery. Furthermore, the SR Ca load may also be affected by DI due to refilling from the previous release. These effects together give rise to a property called Ca release restitution [67–69]. Therefore, lengthening APD in the present beat can either enhance Ca release or reduce Ca release in the following beat [Fig. 2(c)], resulting in positive APD-to-Ca coupling or negative APD-to-Ca coupling, respectively.
C. Spatially and electromechanically concordant and discordant alternans
When APD (or Ca) alternates in phase in the whole tissue, it is called spatially concordant alternans (SCA). When APD (or Ca) alternates out-of-phase in space, it is called SDA (Fig. 3). During alternans, APD and Ca may alternate either in-phase or in antiphase. In the in-phase mode, a large Ca corresponds to a long APD, and vice versa, which is called electromechanically concordant alternans. In the antiphase mode, a large Ca corresponds to a short APD, and vice versa, which is called electromechanically discordant alternans. The electromechanically concordant alternans occurs when the Ca-to-APD coupling is positive, and electromechanically discordant alternans occurs when the Ca-to-APD coupling is negative.
FIG. 3.
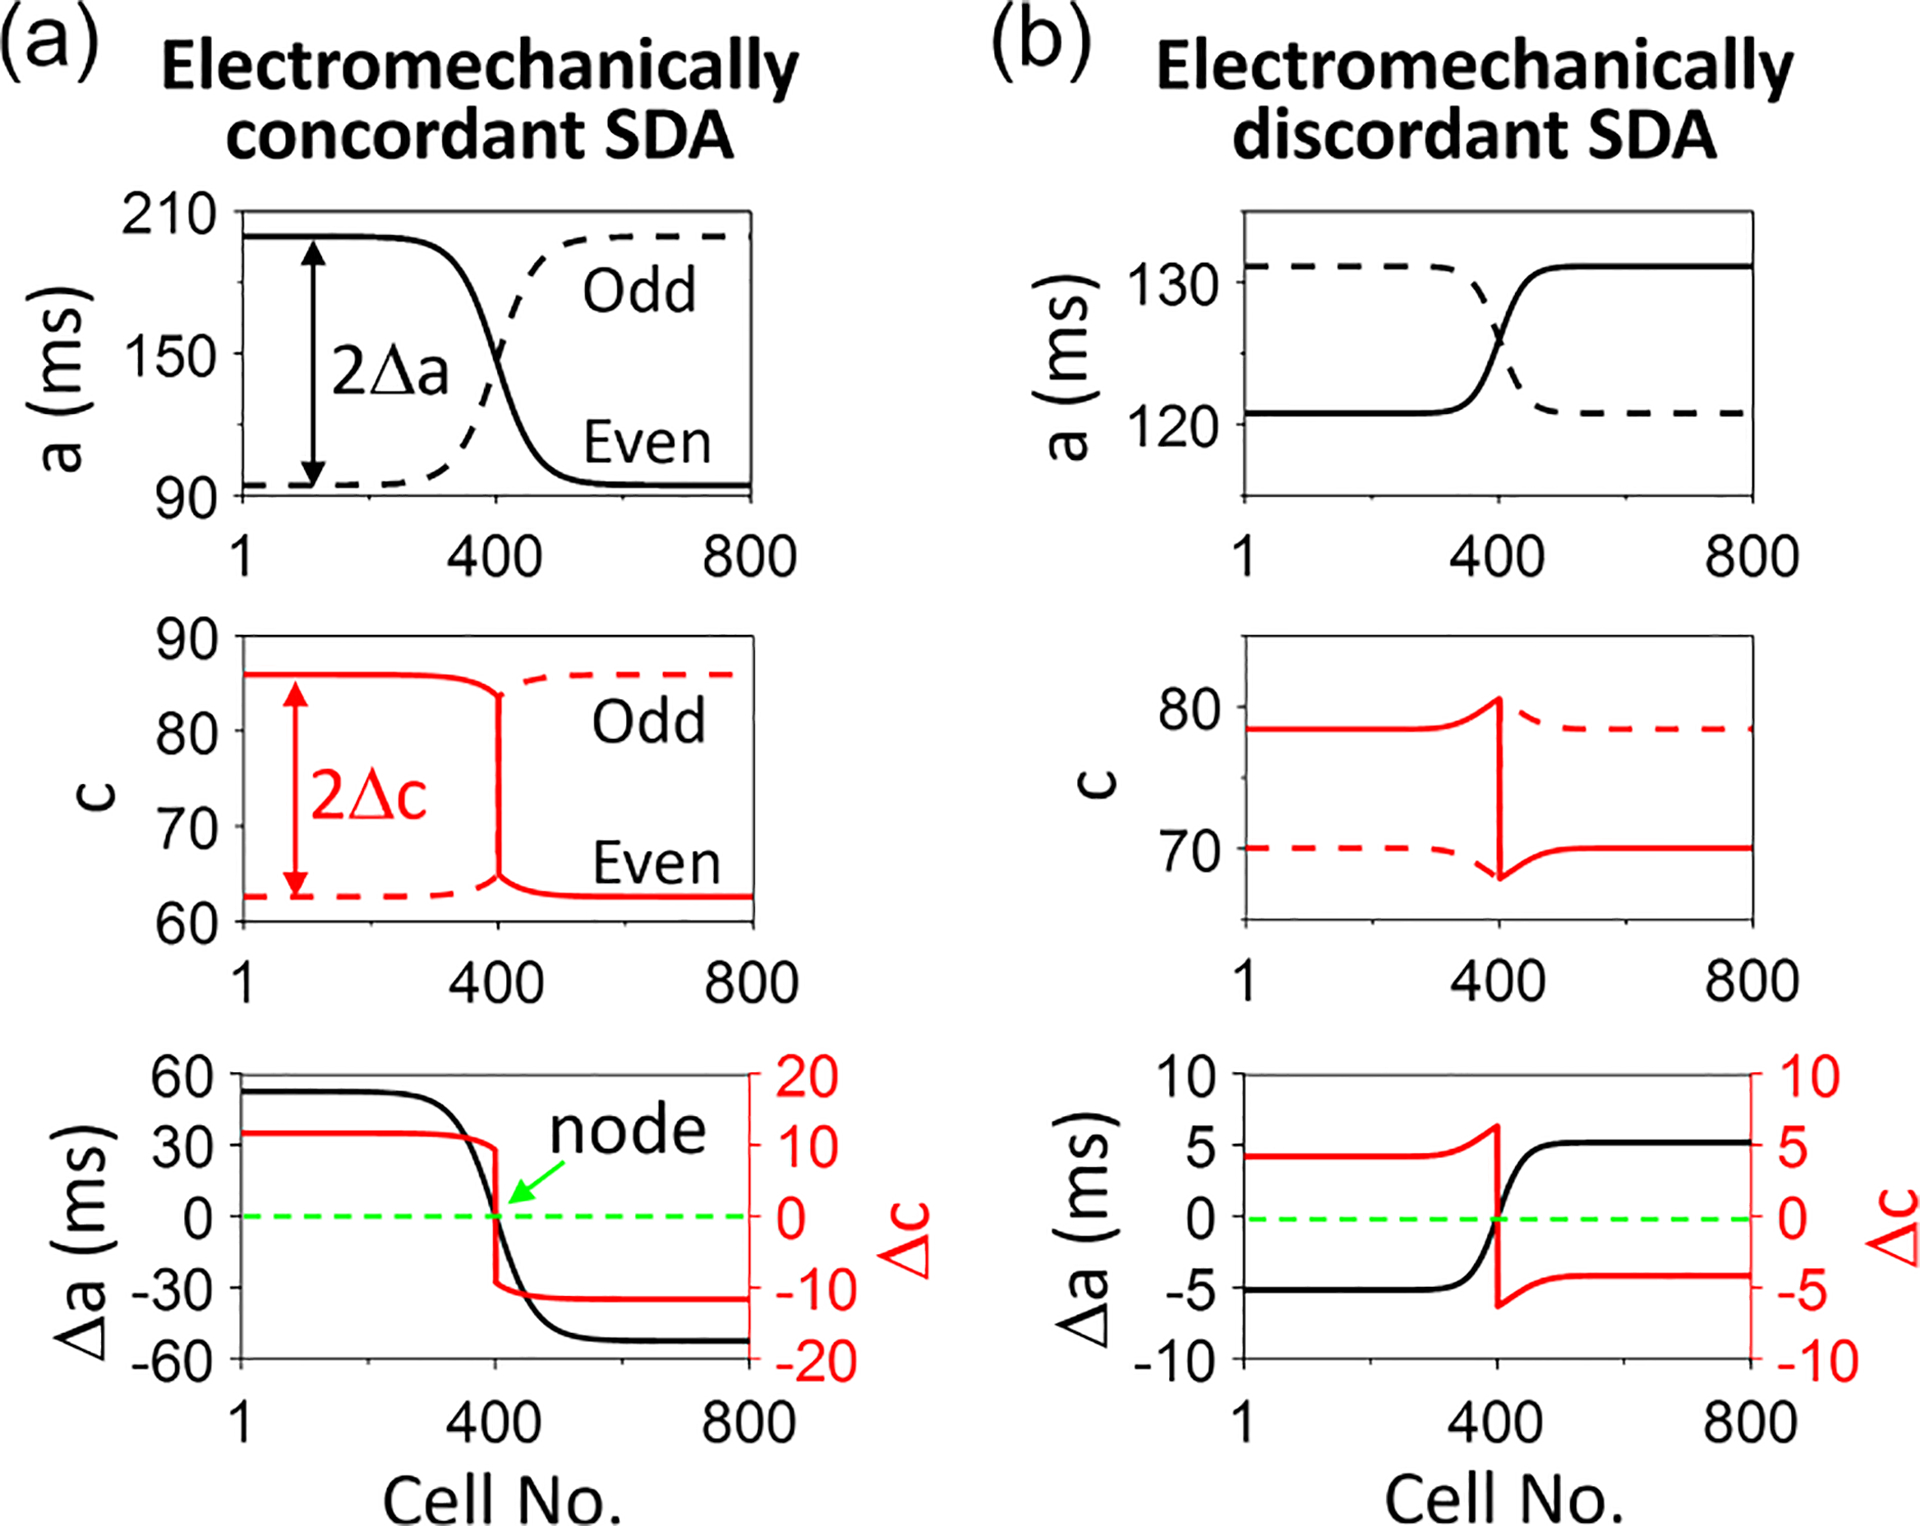
Electromechanically concordant and discordant spatially discordant alternans (SDA). (a) An example of an electromechanically concordant SDA in which action potential duration (APD) and Ca alternate in-phase. Top: APD vs cell no. for two consecutive beats. Middle: Peak Ca vs cell no. for the same two consecutive beats. Bottom: Alternans amplitude of APD () and calculated from the two beats. (b) Same as (a) but for an electromechanically discordant SDA in which APD and Ca alternate in antiphase. (a) and (b) are simulation results of the coupled map lattice (CML) model (see the Appendix) with the following parameters: , and for (a) and , and for (b).
In the AE model, the variables are the amplitudes of APD and Ca alternans. Furthermore, in the CML and ionic models, we present most of the results using the alternans amplitudes. The APD alternans amplitude is defined as
| (1) |
in which is the APD of the th beat. The prefactor maintains the sign of during alternans. In other words, the term changes sign in a beat-to-beat manner during alternans, and the prefactor keeps either positive or negative, unchanged from beat to beat. In a SCA, keeps either positive or negative in the whole spatial domain. In a steady-state SDA, the sign of remains unchanged in time but changes in space. Here, corresponds to the SDA node. Similarly, one defines the Ca alternans amplitude as
| (2) |
where is the peak value of the Ca concentration of the th beat. In the real cardiac myocytes, the intracellular Ca concentration is on the order of . For simplicity, we use an arbitrary unit for and but use the real unit milliseconds for and in the AE and CML models. The bottom panels of Fig. 3 plot the steady-state patterns of and from the SDA shown in the top and middle panels. The SDA in Fig. 3(a) is electromechanically concordant in which the signs of and are the same, i.e., a positive corresponds to a positive , and a negative corresponds to a negative . Figure 3(b) shows an SDA of electromechanically discordant alternans in which the signs of and are opposite, i.e., a positive corresponds to a negative , and vice versa.
D. Pacing protocol
In this paper, we pace all cells in the tissue simultaneously, i.e., a global pacing protocol, and thus, there is no action potential conduction. As we clarified previously [50,51], this protocol is not only physiologically realistic but also a simplified setting that can be helpful for understanding the SDA dynamics in the presence of conduction. We will investigate in a future study the effects of conduction on the SDA dynamics in the presence of Ca alternans using local pacing protocols.
E. Computer simulation methods
Computer simulations are carried out for all three types of models. Numerical simulations of 1D cable and 2D tissue are carried out using a forward Euler method with cm and . Here, for the AE model, and for the ionic model are used. Simulations are carried out by GPU (NVIDIA GeForce RTX 3090) accelerated computing with CUDA C++.
III. RESULTS
A. SDA formation and synchronization in the AE model—Theoretical analyses
The advantage of the AE model is that it is relatively simple so that we can perform analytical treatments, such as stability analysis and theoretical solutions [40,51,70]. An AE model describing voltage-driven SDA dynamics in a 1D cable was derived by Echebarria and Karma [40,70]. A similar AE model was developed to describe the effects of voltage and Ca coupling on subcellular Ca alternans in single myocytes by Shiferaw and Karma [71]. In a recent study [51], we used the AE model to investigate the voltage-driven SDA dynamics in tissue models under different conditions, such as repolarization and coupling heterogeneities. Here, we extend the AE model to describe the SDA dynamics in the presence of Ca-driven alternans by phenomenologically adding an AE describing the amplitude of Ca alternans and the bidirectional coupling effects. Using this AE model, we can perform stability analyses for both SCA and SDA in cardiac tissue and investigate the conditions for synchronization of the APD-SDA and Ca-SDA patterns. The theoretical predictions are then examined using both the CML and ionic models which have more physiological parameters and details.
1. AE model
Under global pacing, the AE model is described by the following coupled partial differential equations:
| (3) |
| (4) |
where is the pacing period, and , with being the beat number of pacing. In the AE model, the alternans amplitude of APD is treated as a time and space continuous variable, i.e., . Here, and , which are related to the slope of the APD restitution curve [40,70], are the parameters determining the stability and amplitude of the APD alternans in the absence of Ca-driven alternans. In other words, in the absence of Ca-driven alternans (or when Ca and APD are decoupled), when , no APD alternans occurs. When , APD alternans occurs with the steady-state alternans amplitude . Similarly, and are parameters determining the stability and amplitude of the Ca alternans. Without APD-to-Ca coupling, when , no Ca alternans occurs. When , Ca alternans occurs with the steady-state alternans amplitude . In this paper, we fix but vary and for stability and alternans.
Here, in Eq. (3) describes the Ca alternans to APD alternans coupling, and in Eq. (4) describes the APD alternans–to–Ca alternans coupling, with both couplings assumed to be linear. Note that couplings in Eqs. (3) and (4) are those for Ca and APD alternans amplitudes (i.e., and ), not the Ca-to-APD coupling and the APD-to-Ca coupling. However, as illustrated in Fig. 2(b), for a positive Ca-to-APD coupling, an increase in Ca amplitude lengthens APD, which shortens the APD in the following beat due to a shorter DI, increasing the APD alternans amplitude (). The increase in Ca amplitude also increases the Ca alternans amplitude . Therefore, a positive Ca-to-APD coupling is equivalent to a positive in Eq. (3). Similarly, a negative Ca-to-APD coupling corresponds to a negative . For the same argument, a positive APD-to-Ca coupling corresponds to a positive in Eq. (4), and a negative APD-to-Ca coupling corresponds to a negative .
To understand the roles of Ca and APD coupling in the genesis of the spatiotemporal dynamics, we first perform a linear stability analysis with the following linearized equations:
| (5) |
| (6) |
Inserting into Eqs. (5) and (6), one obtains the following Jacobian:
| (7) |
whose eigenvalues are
| (8) |
As indicated in Eq. (8), depends on . We discuss the three coupling cases (, and ) in the sections below.
2. Synchronization of APD-SDA and Ca-SDA patterns when
We first deal with a special condition, i.e., . This condition is satisfied when Ca and APD are either completely decoupled ( and ) or one-way coupled ( and or and ). However, if , the eigenvalues in Eq. (8) are decoupled into a voltage-dependent one and a Ca-dependent one, i.e.,
| (9) |
Note that is independent of , which is because Ca is not coupled between cells [Fig. 2(a)]. Since the case of and (APD and Ca are completely decoupled) is trivial, we discuss the other two cases in detail below.
a. and .
In this case, the APD is not affected by Ca, but Ca is affected by APD. This condition can be satisfied when the Ca-dependent inward and outward currents are properly balanced so that changing Ca does not change APD, i.e., . Although this condition may be difficult to be satisfied in the real system, it still gives us insights for the condition when the Ca-to-APD coupling is weak, i.e., when is small. When , Eqs. (3) and (4) become
| (10) |
| (11) |
One can categorize the system into four conditions:
When both the APD and the Ca subsystems are stable ( and ), there is no alternans and thus no SDA patterns.
When the APD subsystem is stable and the Ca subsystem is unstable ( and ), there is no APD alternans, and thus, ; the Ca-SDA pattern can be any pattern determined by the initial condition.
When the APD subsystem is unstable and the Ca subsystem is stable ( and ), the Ca-SDA pattern passively follows the APD-SDA pattern.
- When both subsystems are unstable ( and ), the Ca-SDA pattern can be dyssynchronous or synchronized to the APD-SDA pattern, which can be understood as follows. Under this condition, the steady-state Ca-SDA pattern is determined by the solutions of , in which
Here, can exhibit either three real solutions or one real solution [Fig. 4(a)], and the transition occurs when or in another form:(12)
in which and are the steady-state alternans amplitudes of a single cell. Note that Eq. (13) is valid only for since for . When has one real solution, otherwise, there are three real solutions. When there are three solutions, of a cell can be either the positive or negative solution depending on the initial condition. Under this condition, the Ca-SDA pattern can be arbitrary, independent of the APD-SDA pattern and determined solely by the initial condition [left panel in Fig. 4(b)]. When there is only one solution, follows the same sign of , and thus, the Ca-SDA pattern synchronizes to the APD-SDA pattern [right panel in Fig. 4(b)]. Note that, in the nodal region, still varies from cell to cell, which is because is too small to synchronize , as indicated by Eq. (13). Therefore, when , synchronization of the Ca-SDA pattern to the APD-SDA pattern occurs, except in the nodal region where is small.(13)
FIG. 4.
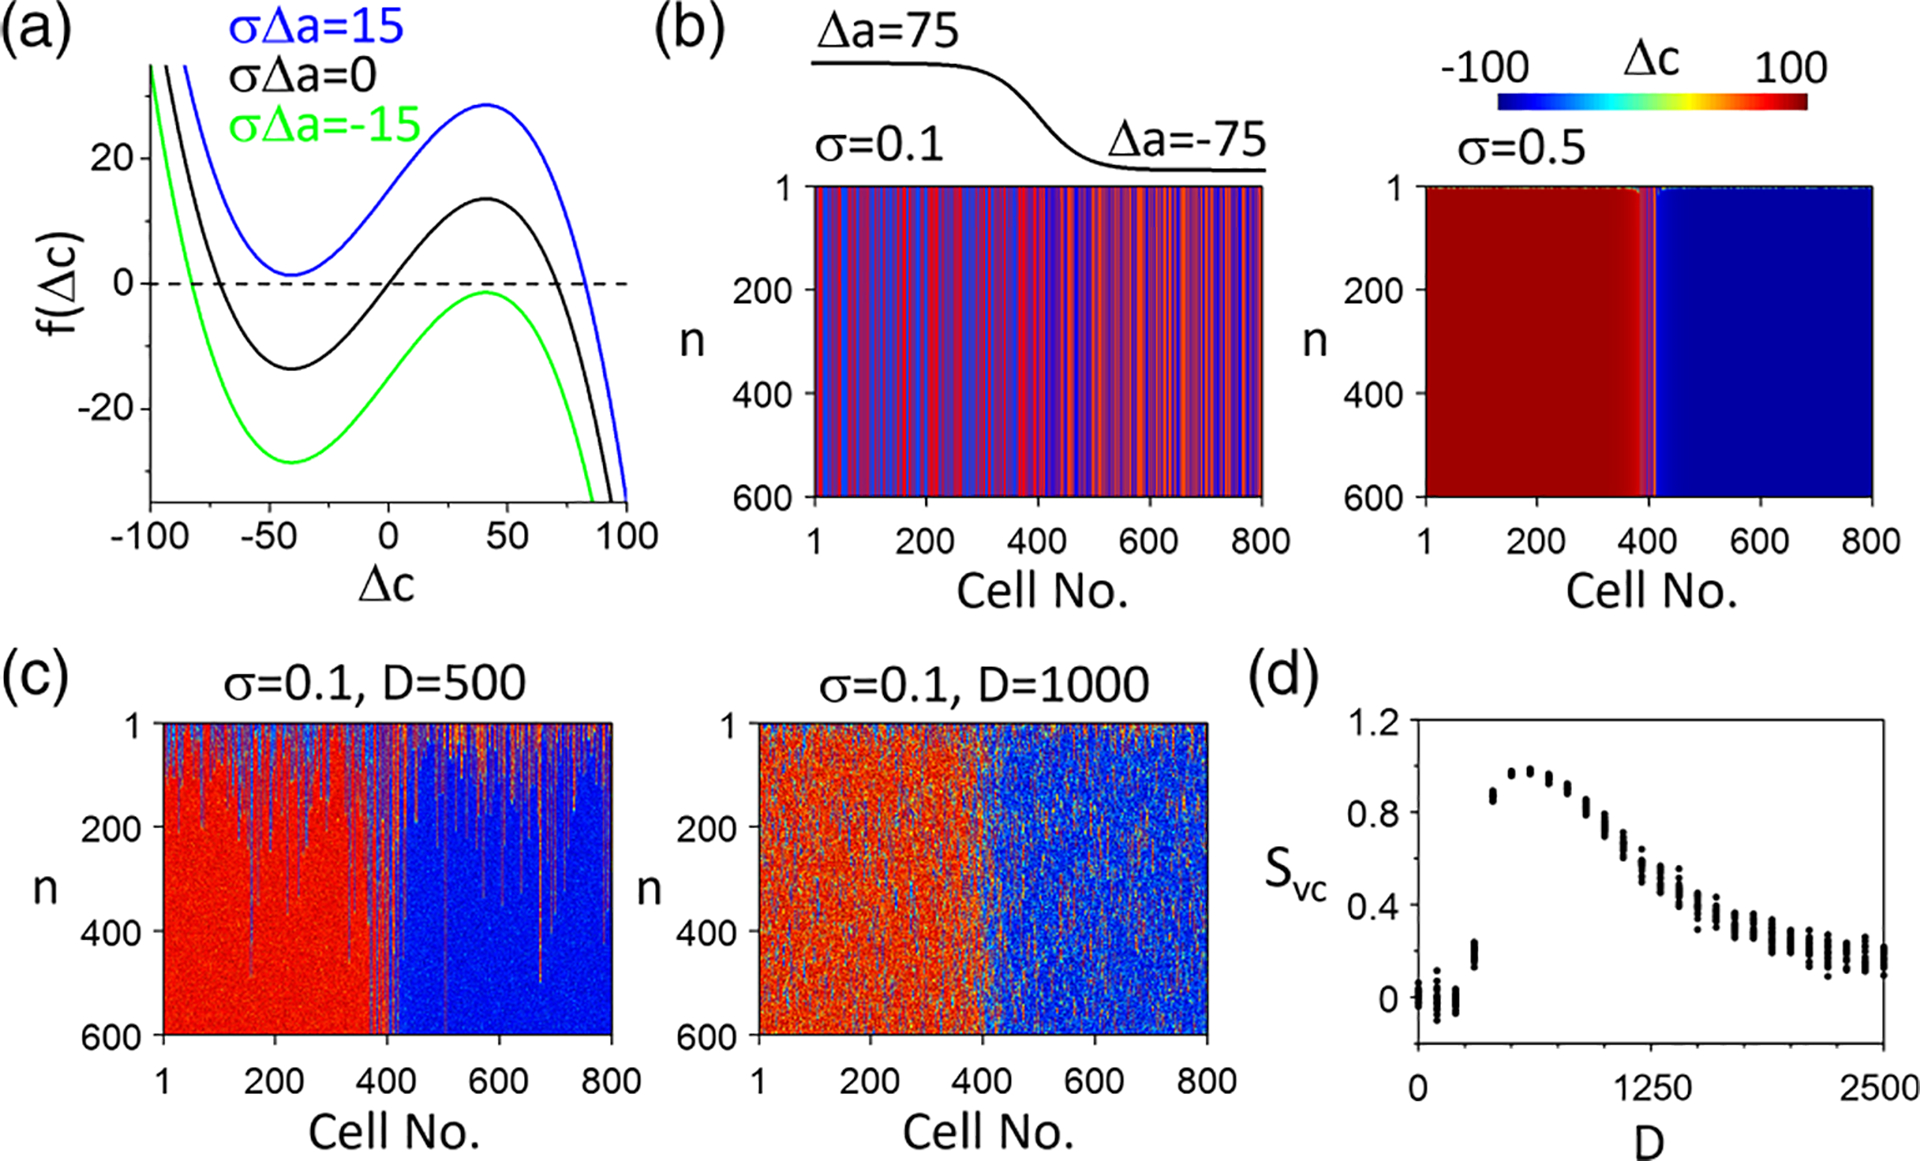
Synchronization of Ca–spatially discordant alternans (SDA) to action potential duration (APD)-SDA patterns in the amplitude equation (AE) model without Ca-to-APD coupling . (a) Plots of function [Eq. (12)] for different values. (b) Space-time plots of for (left) and (right) for a one-node APD-SDA as indicated. (c) Space-time plots of for with two noise strengths: (left) and (right). (d) vs noise strength . For each , 20 simulations with different random initial conditions are carried out with the corresponding plotted. In the simulations in (b)-(d), the initial conditions for Ca-SDA are spatially random in which is a binary number, randomly chosen as either −100 or 100. is a one-node SDA as indicated in (b). and .
In cardiac myocytes, stochastic opening of ion channels causes random fluctuations in both APD and Ca. However, due to the cell-to-cell coupling, the fluctuations in APD become small in cardiac tissue [72]. On the other hand, the random fluctuations in Ca can be very large [73–77] due to criticality [17,78]. We hypothesize that the random noise can lower the threshold of synchronization, i.e., the noise in Ca can promote synchronization of to . We demonstrate this by adding noise to the system. Since the random fluctuation in APD is small, we only add noise to Ca, i.e., we add noise to Eq. (11) but not Eq. (10). Furthermore, for simplicity, we add Gaussian white noise to Eq. (11), i.e.,
| (14) |
where is the Gaussian white noise satisfying and . Here, is the noise strength. The corresponding Fokker-Planck equation describing the probability of is . The steady-state solution of the Fokker-Planck equation is expressed as [79]
| (15) |
in which is a double-well potential. When , the probability distribution is symmetric for the two potential wells. When , one potential well is higher than the other, which causes the transition of from the higher to the lower potential well, synchronizing the Ca-SDA pattern to the APD-SDA pattern. For example, for the case of in Fig. 4(b), adding noise causes the Ca-SDA pattern to synchronize to the one-node APD-SDA pattern [Fig. 4(c)].
To quantify the degree of synchronization between the APD-SDA pattern and the Ca-SDA pattern, we define a synchronization index as follows:
| (16) |
where is the length of the cable (the total number of cells). A perfectly synchronized Ca-SDA pattern with an APD-SDA pattern gives rise to for electromechanically concordant SDA and for electromechanically discordant SDA. Figure 4(d) plots vs the noise strength, showing that, when the noise is weak, no synchronization occurs, but once the noise is strong enough, synchronization occurs. However, the synchronization weakens as the noise strength increases due to the increased probability of the transitions from the lower potential well to the higher one.
and .
In this case, Ca is not affected by APD, but APD is affected by Ca. This condition can be more easily satisfied in the real system. For example, this condition can be satisfied at slow pacing rates since the Ca channels, ryanodine receptors, and SR Ca load are all recovered before the next beat so that Ca is not affected by the change of APD in the previous beat. Under this condition, Eqs. (3) and (4) are then reduced to:
| (17) |
When the Ca subsystem is stable , i.e., there is no Ca-driven alternans, then ; Eq. (17) exhibits a front solution in an infinite spatial domain as [51]
| (18) |
In this case, the node dynamics is determined solely by voltage, predicted by , which has been investigated in detail in our previous analysis [51]. When the Ca subsystem is unstable , Eq. (17) cannot be solved analytically in general. We first consider a special case in which we assume that the Ca alternans is spatially concordant, i.e., is a constant. Then Eq. (17) has the following solution in an infinite spatial domain:
| (19) |
in which is the front (or node) velocity as a function of . The velocity is positive if is positive or vice versa. This implies that, if the Ca alternans is spatially concordant (i.e., Ca-SCA), an initial node in APD alternans will eventually drift off the tissue, resulting in an APD-SCA pattern. In other words, if Ca alternans is spatially concordant, APD alternans must be spatially concordant.
However, when the Ca alternans is spatially discordant (i.e., Ca-SDA), the APD-SDA patterns are more complex, i.e., the APD-SDA can be either synchronized or desynchronized to the Ca-SDA pattern depending on the spatial scale of the Ca-SDA pattern and the coupling strength . As shown in our previous analysis [51], in homogeneous tissue without Ca-driven alternans, the stability of the APD-SDA node is neutral. However, in the presence of Ca-driven alternans, the APD-SDA node in homogeneous tissue may become stable or anchored to the Ca-SDA node, as explained in Fig. 5(a). We assume a Ca-SDA pattern with a single node [red curve in Fig. 5(a)]. If the initial node of the APD-SDA is in the left of the Ca-SDA node, based on Eq. (19), the APD-SDA node will drift toward the right since . If the initial APD-SDA node is in the right of the Ca-SDA node, then it will drift toward the left since . The final APD-SDA state is that its node is completely aligned with the Ca-SDA node, synchronizing to the Ca-SDA pattern. The theoretical scenario is demonstrated in simulations of the AE model as an example shown in Fig. 5(b). However, the synchronization of the APD-SDA pattern to the Ca-SDA pattern depends on the coupling strength and the spatial scale of the Ca-SDA pattern, i.e., the size of the synchronized clusters in Ca-SDA pattern. When the spatial scale of the Ca-SDA pattern is large, APD-SDA synchronizes to the Ca-SDA [e.g., Fig. 5(c)], but when the spatial scale is small, they do not synchronize [e.g., Fig. 5(d)]. Figure 5(e) plots vs the spatial scale of the given Ca-SDA patterns, showing that the degree of synchronization increases with the increase of the spatial scale of Ca-SDA.
FIG. 5.
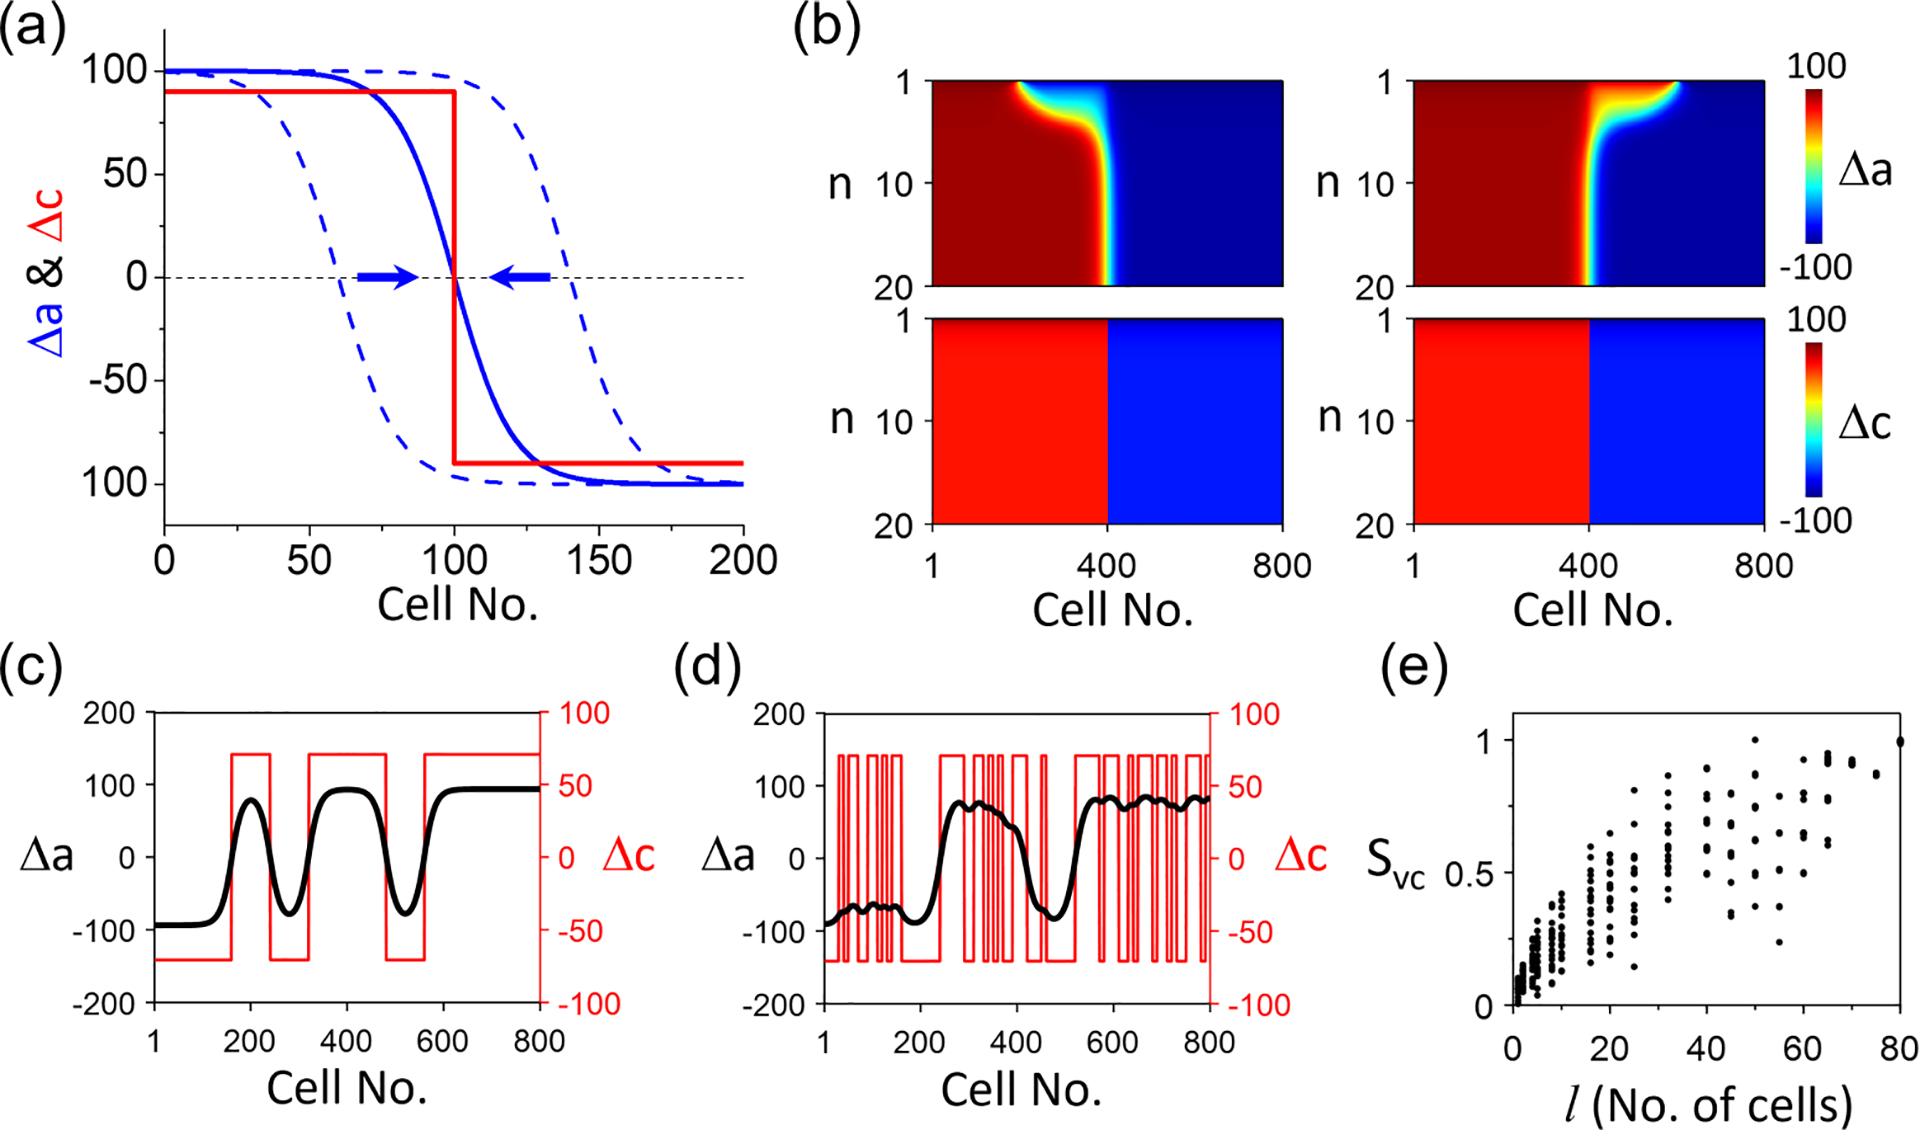
Synchronization of action potential duration (APD)–spatially discordant alternans (SDA) to Ca-SDA in the amplitude equation (AE) model without APD-to-Ca coupling . (a) Schematic plot of synchronization of an APD-SDA (blue) to a Ca-SDA (red). Arrows indicate that an initial APD-SDA node away from the Ca-SDA node drifts toward the Ca-SDA node. (b) Simulation of the AE model showing the scenarios in (a). (c) Synchronization of APD-SDA to a Ca-SDA pattern when the spatial scale of Ca-SDA pattern is large. (d) Same as (c) but the spatial scale of Ca-SDA pattern is small. (e) vs the spatial scale of the Ca-SDA pattern. , and . In the simulations in (c)-(e), the initial conditions are spatially random SDAs in which and are binary numbers, randomly chosen as either −100 or 100 with spatial segmentation length cells for (c), and cells for (d). In (e), 20 random initial conditions are used for each .
The case shown in Fig. 5 is for , but the results still hold for . The difference is that, for , the SDA patterns are electromechanically concordant, but for , the SDA patterns are electromechanically discordant. Moreover, the results will also hold for periodic boundary conditions. Note that the number of nodes can be either even or odd under open boundary conditions, but it must be even for periodic boundary conditions due to the required symmetry [i.e., Ca (or APD) must be equal at the two boundaries]. Like the case of open boundary conditions, if there is no Ca-SDA, then the APD-SDA nodes are unstable, which will disappear by drifting toward each other and annihilate, leading to APD-SCA. When Ca alternans is discordant, then the APD-SDA will synchronize or desynchronize to the Ca-SDA the same ways as shown in Fig. 5.
3. Synchronization of APD-SDA and Ca-SDA patterns when
This condition is satisfied when and or and . Since , the eigenvalues in Eq. (8) are always real. As changes to , a pitchfork bifurcation occurs, leading to alternans. Figure 6(a) plots the stability boundaries [ for the larger of the two eigenvalues of Eq. (8)] for different values. The spatial modes are unstable above (or to the right of) the boundaries. As increases, the stability boundary moves uprightward, indicating that high spatial modes are more stable. As , the boundary becomes vertical at , which indicates that, for , all modes are unstable. Therefore, for , the number of nodes of a cable is largely determined by the mode stability, as investigated in detail in our previous study [51]. For , i.e., the Ca subsystem is unstable, since all the linear modes are unstable, any pattern is possible. However, due to the coupling between cells and between APD and Ca, as well as nonlinear interactions, the spatial patterns cannot be completely arbitrary, which depend on the stabilities of the APD and Ca subsystems, the coupling strength, and the initial conditions.
FIG. 6.
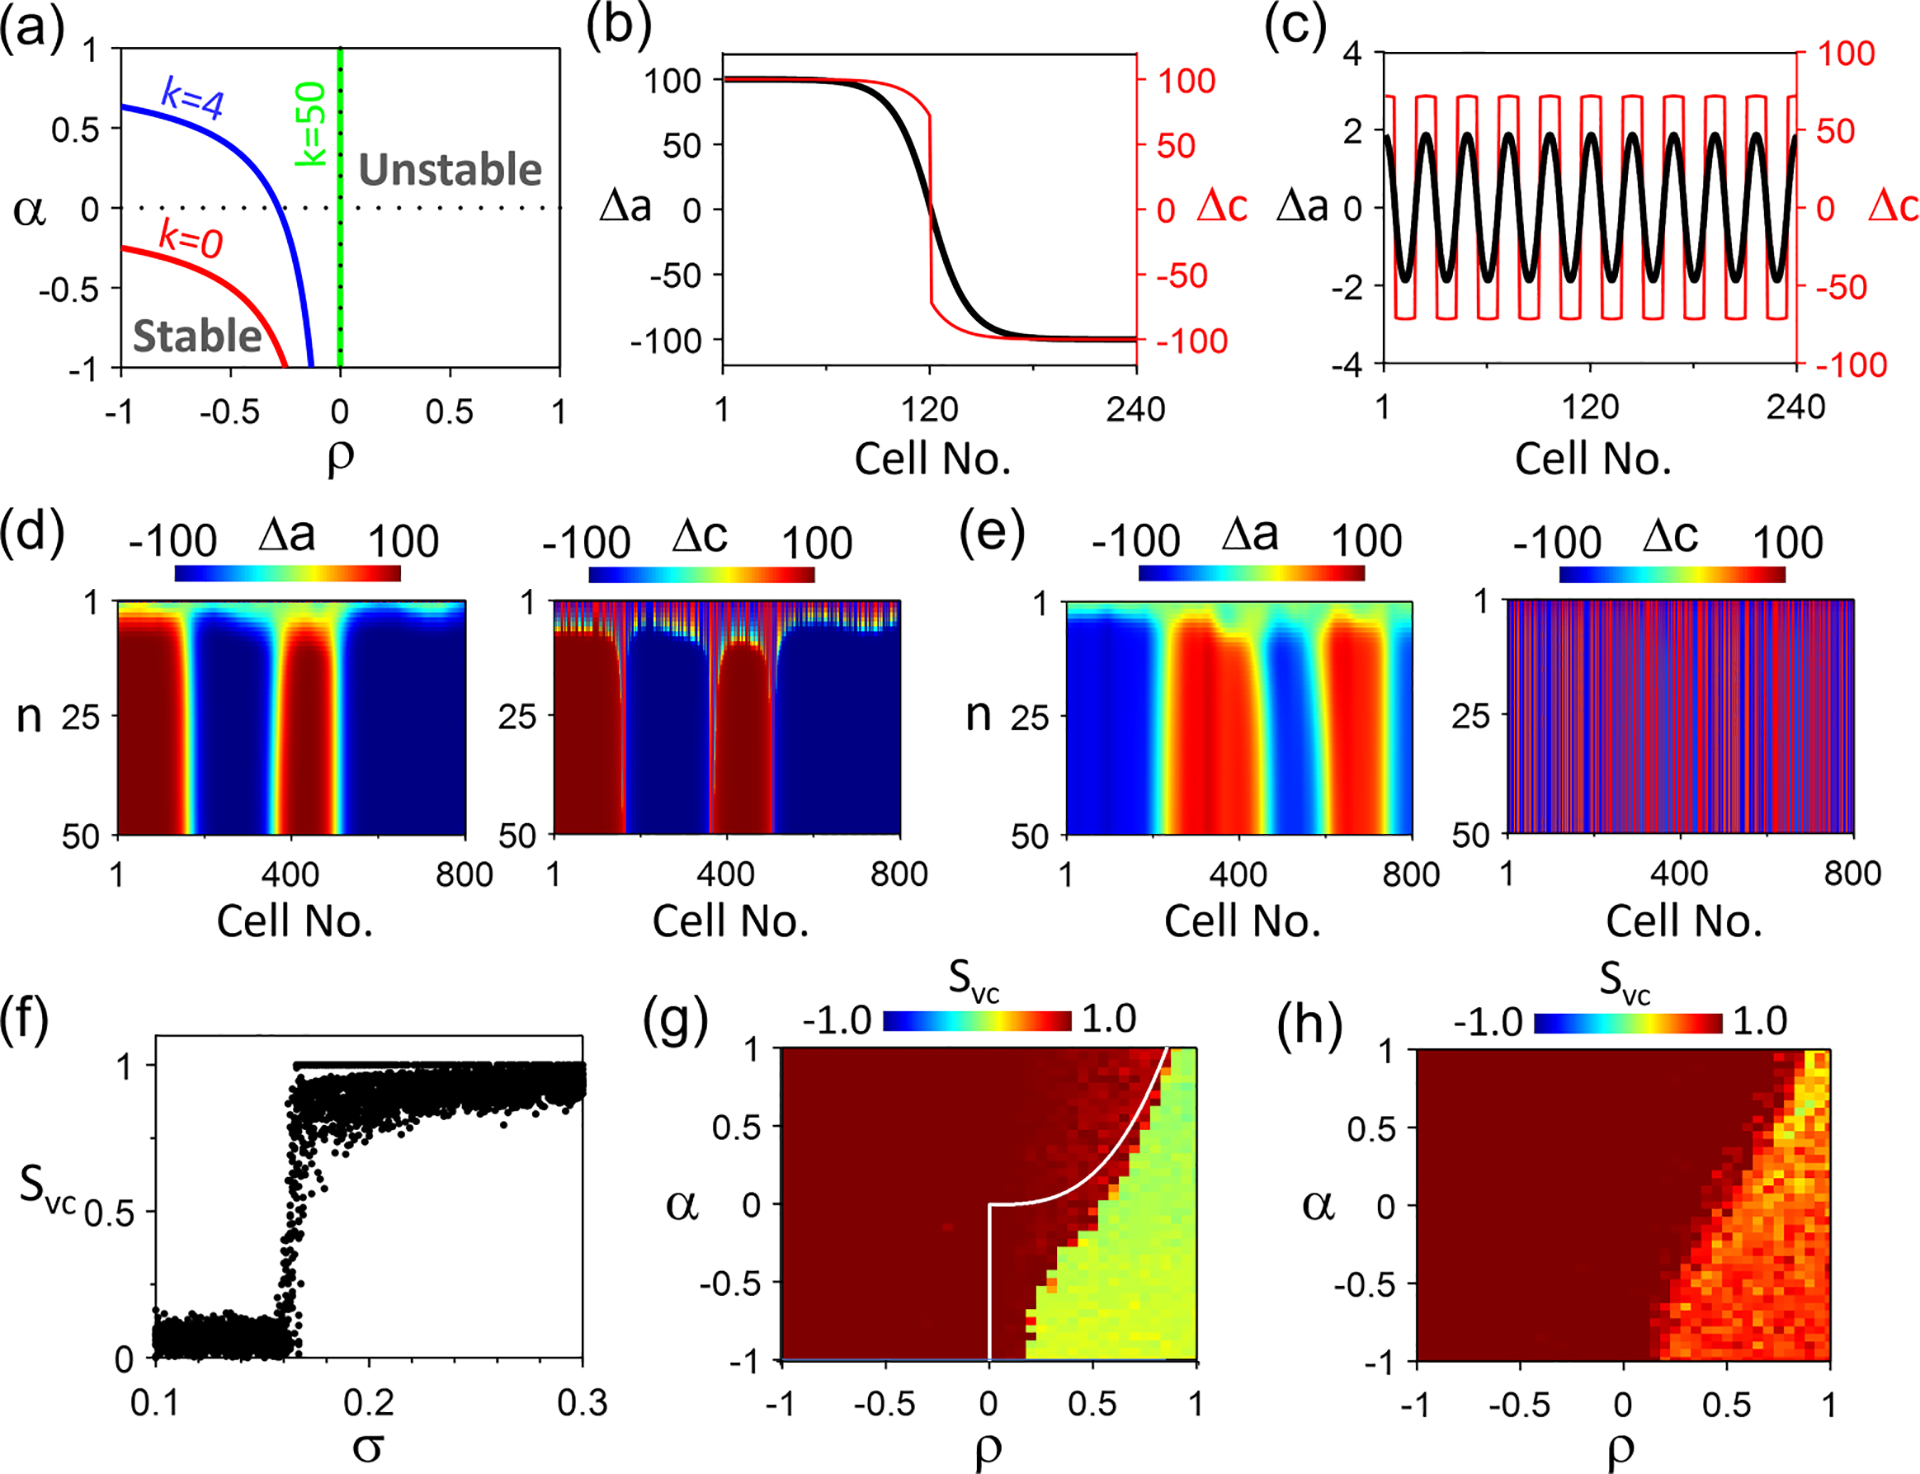
Spatiotemporal Ca and action potential duration (APD) dynamics in the amplitude equation (AE) model for . (a) Stability boundaries (colored lines) in the plane for different spatial modes of the linear stability analysis of the steady state. Shown are the boundary for (red), 4 (blue), and 50 (green). and . (b) Steady-state (black) and (red) in space for beat no. 100 with 1 node in both and . (c) Same as (b) but with 20 nodes in both and . (d) Space-time plots of and with an initial condition of and random in which is a binary number, uniformly chosen as either −100 or 100. and . (e) Same as (d) but with . (f) vs . For each values from different initial conditions as in (c) and (d) are plotted. . (g) Color map of vs and . For each set of and , one random initial condition (spatial scale cell) is simulated. and . The white line is the synchronization boundary predicted by Eq. (13) under , showing that positive Ca-to-APD coupling () enhances spontaneous synchronization. (h) Same as (g) but with a larger spatial scale of the initial conditions: cells.
Figures 6(b)–6(e) show some representative steady-state SDA patterns for the same set of and values (). Figures 6(b) and 6(c) show a single-node and a high spatial periodicity SDA using spatially periodic initial conditions, respectively. As the number of nodes increases, the magnitudes of APD alternans are attenuated. Figures 6(d) and 6(e) show SDA from random initial conditions with strong and weak APD-to-Ca coupling, respectively. Under strong coupling, synchronous APD-SDA and Ca-SDA patterns form spontaneously although the initial conditions are purely random. When the coupling is weak, APD-SDA and Ca-SDA becomes dyssynchronous. The mechanisms of pattern formation and synchronization of the SDA patterns can be understood based on the simple cases of (Fig. 4) and (Fig. 5). An APD-SDA pattern forms first because of the heterogeneous initial condition and spatial mode instability, which then synchronizes the Ca-SDA pattern via the mechanism described in Fig. 4. Once they are synchronized, the Ca-SDA pattern stabilizes the nodes via the mechanism described in Fig. 5.
Figure 6(f) shows vs from simulations done the same way as in Figs. 6(d) and 6(e). Synchronization occurs when is greater than a certain value, as predicted by Eq. (13). Note that Eq. (13) is only valid for , which predicts for the and values used. Since in Fig. 6(f), the value for synchronization is smaller, indicating that positive Ca-to-APD coupling enhances synchronization [see also the comparison of the boundary for (white line) with the boundary from the simulation for in Fig. 6(g)]. As indicated by Eq. (13), the synchronization of APD-SDA and Ca-SDA depends on and [Fig. 6(g)], i.e., the stabilities of the voltage and Ca subsystems. When , i.e., the Ca subsystem is stable, Ca-SDA and APD-SDA are always synchronized. When , i.e., the Ca subsystem is unstable, spontaneous synchronization is promoted by increasing and/or decreasing . In other words, larger APD alternans and/or smaller Ca alternans potentiates synchronization, which is implied in Eq. (13) . In the region where spontaneous synchronization fails [green region in Fig. 6(g)], synchronization can be enhanced by increasing the spatial scale of the initial Ca-SDA pattern [Fig. 6(h)] via the mechanism as shown in Fig. 5.
The same applies to the condition of and except that the SDA patterns are electromechanically discordant.
4. SDA dynamics when
In this case, Ca-to-APD coupling is negative, and APD-to-Ca coupling is positive ( and ), or vice versa ( and ). Since , the eigenvalues in Eq. (8) can be either real or a pair of complex conjugates, and thus, the system can undergo a pitchfork bifurcation or a Hopf bifurcation. A pitchfork bifurcation leads to alternans, and a Hopf bifurcation leads to quasiperiodic behavior. Figure 7(a) shows the stability boundaries in the plane for different spatial modes ( values) of the steady state. The arc lines are the pitchfork bifurcations, and the straight ones are the Hopf bifurcations which are determined by and . The stability boundary for is the same as for the single cell, which has been investigated in the previous studies [21,22]. It has been shown that the alternans can be electromechanically concordant in which APD and Ca alternate with their phases locked in-phase, electromechanically discordant in which APD and Ca alternate with their phases locked antiphase, or electromechanically quasiperiodic in which APD and Ca alternate with their phases changing quasiperiodically.
FIG. 7.
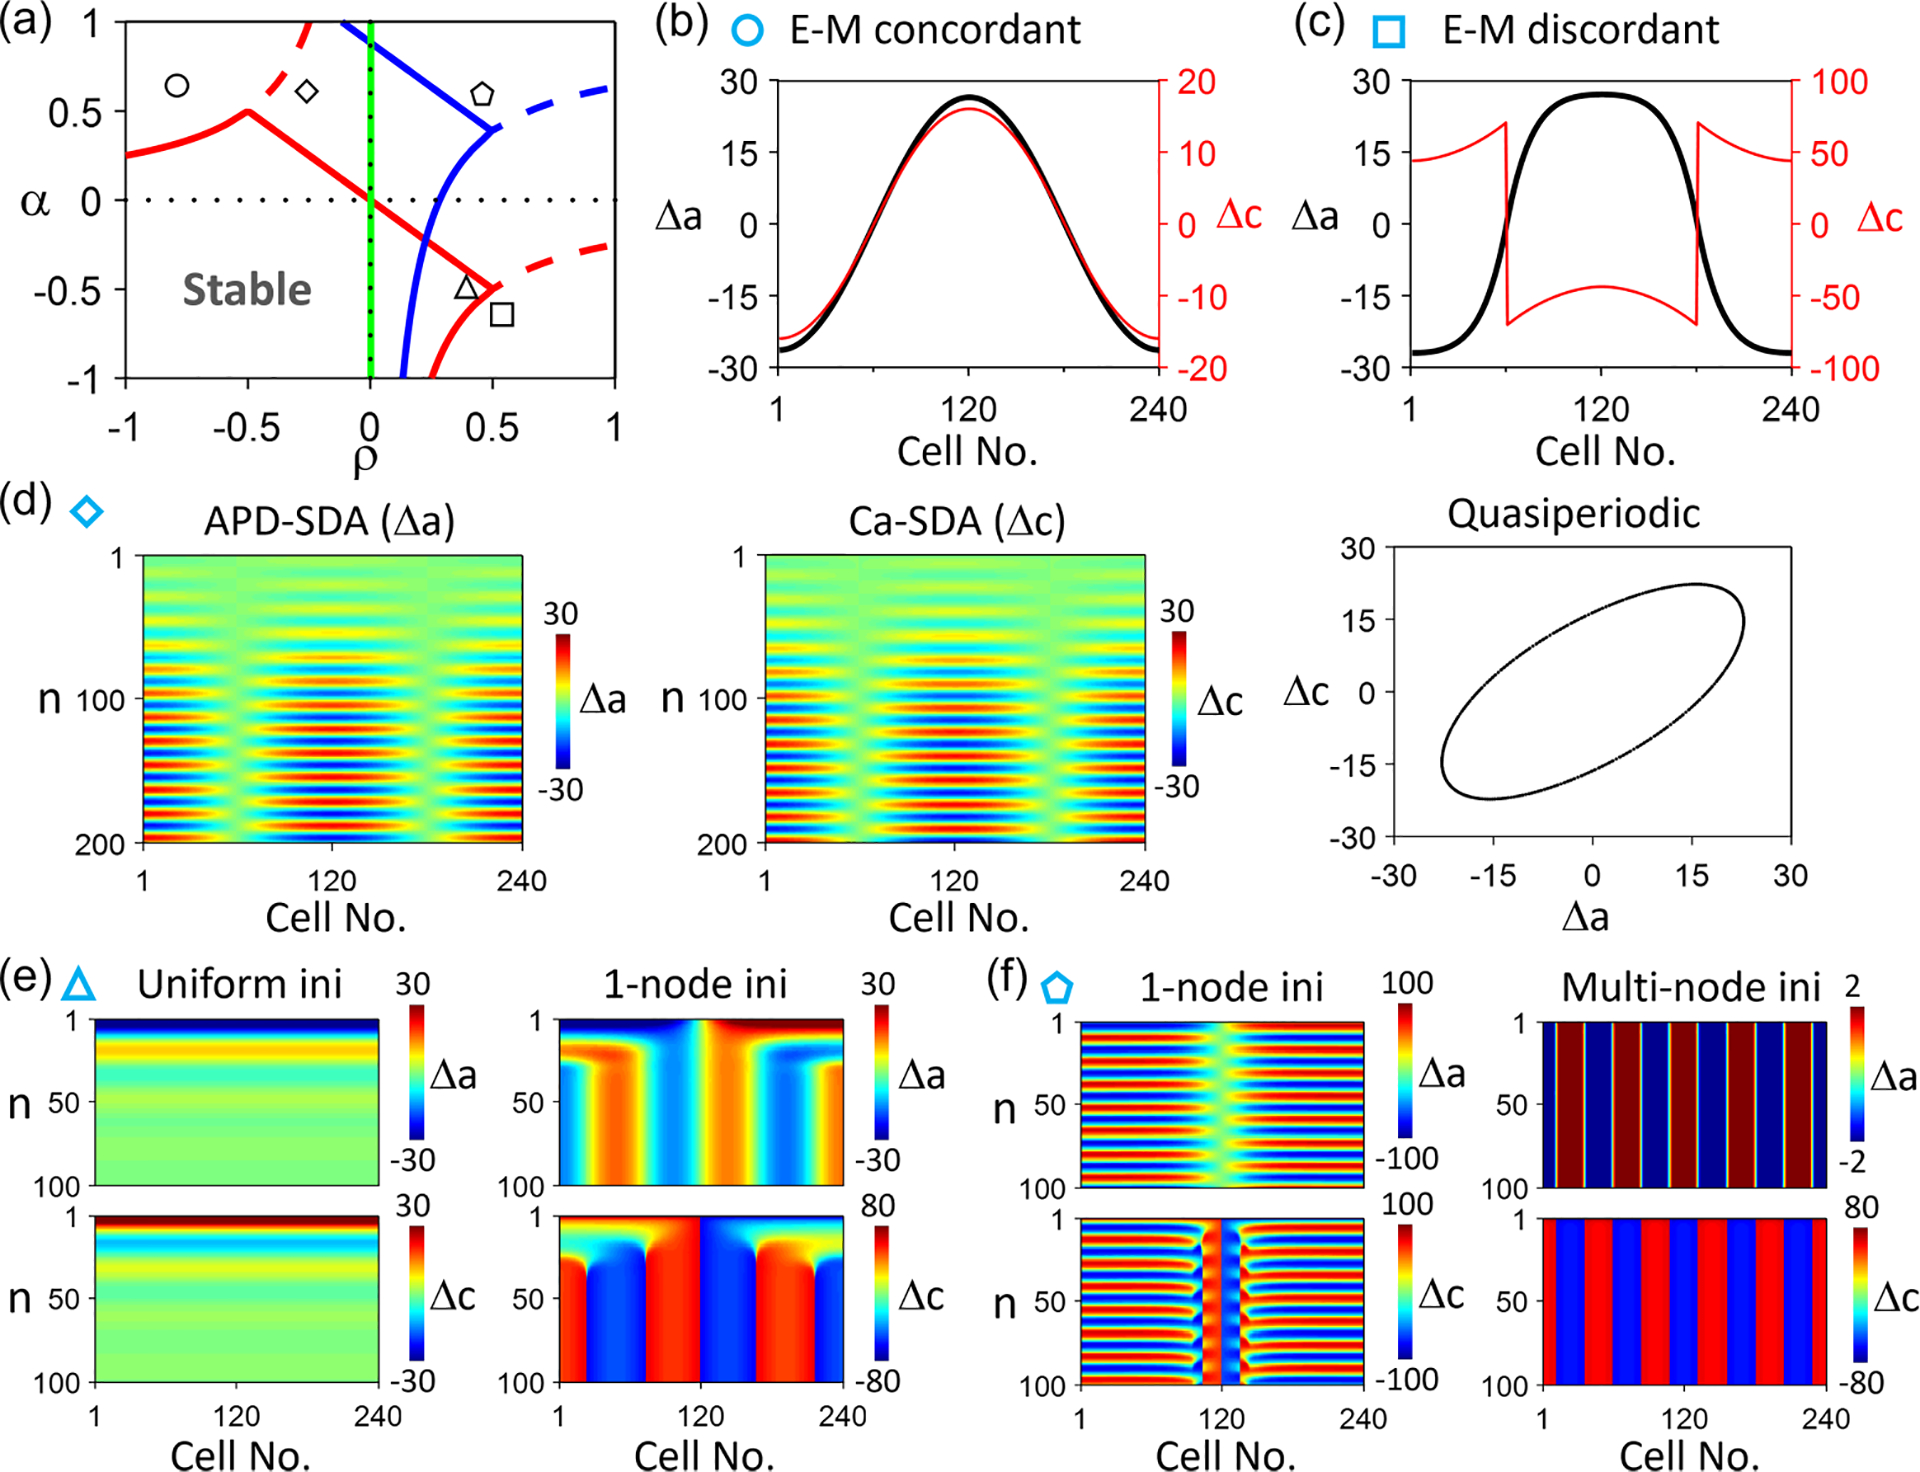
Spatiotemporal Ca and action potential duration (APD) dynamics in the amplitude equation (AE) model for . (a) Stability boundaries (colored lines) in the plane for different spatial modes of the linear stability analysis of the steady state. Shown are the boundaries for (red), 4 (blue), and 50 (green). The spatial mode is stable inside (in the lower-left direction of) the solid lines. and . (b) Steady-state (black) and (red) showing an electromechanically concordant spatially discordant alternans (SDA) in which and are in-phase. and , marked by the circle in (a). (c) Steady-state (black) and (red) showing an electromechanically discordant SDA in which and are antiphase. and , marked by the square in (a). (d) Space-time color-scale plots of (left) and (middle) showing a quasiperiodic SDA in which and are not phase-locked but quasiperiodic (right). and , marked by the diamond in (a). (e) A uniform initial condition leads to a stable steady state (left, no alternans), but a nonuniform (one-node) initial condition leads to multinode electromechanically discordant SDA (right). and , marked by the triangle in (a). (f) A one-node initial condition leads to a quasiperiodic SDA (left), but a multinode initial condition leads to a multinode electromechanically discordant SDA. and , marked by the pentagon in (a). In (e) and (f), the upper panels are color-scale plots of , and the lower panels are those of .
Because of the complex cellular alternans dynamics, the spatiotemporal dynamics in tissue become more complex. Figures 7(b)–7(d) show three characteristic SDA patterns: electromechanically concordant, discordant, and quasiperiodic alternans in the 1D cable. However, the stability boundary shifts upward and leftward as increases, resulting in intersections of the stability boundaries for different values. This differs from the case, in which there are no intersections of the stability boundaries for different values. The intersection of the stability boundaries results in more complex dynamics in the cable. For example, in the location marked by the triangle in Fig. 7(a), it predicts that the uniform mode is stable, but a nonuniform mode is unstable. Examples of this case are shown in Fig. 7(e) in which the homogeneous solution is stable (no alternans) but the inhomogeneous initial condition leads to a multiple-node and electromechanically discordant SDA. In the location marked by the black square, the low- modes are quasiperiodic, but the high- modes are stable. Figure 7(f) shows an example in which a single-node (low- mode) SDA is quasiperiodic, but a multiple-node (high- mode) pattern is stable. If one uses random initial conditions with different spatial scales, patterns of a mixture of quasiperiodic and stable alternans can coexist.
The results in Fig. 6 are for SDA dynamics vs and for positive coupling, and those in Fig. 7 are for negative coupling. Figure 8 shows in the plane for and for which both the APD subsystem and the Ca subsystem are unstable. Figure 8(a) is the color map of for pure random initial conditions, and Fig. 8(b) is that for a larger spatial scale of the initial conditions. When , APD-SDA and Ca-SDA are synchronized when , and the SDA patterns are electromechanically discordant when (lower-left quadral, ) and electromechanically concordant when (upper-right quadral, ). When , APD-SDA and Ca-SDA are synchronized but in quasiperiodic modes when . Because of this, the map (calculated at the last pacing beat) looks random since the APD-SDA and Ca-SDA are in different phases of quasiperiodicity at the last beat for different parameter sets. When , APD alternans exhibits no effects on Ca alternans; the synchrony between APD-SDA and Ca-SDA is poor. In this region, the synchrony is enhanced by increasing the spatial scale of the initial condition [Fig. 8(b)] via the mechanism of synchronization (due to APD-to-Ca coupling) shown in Fig. 5.
FIG. 8.
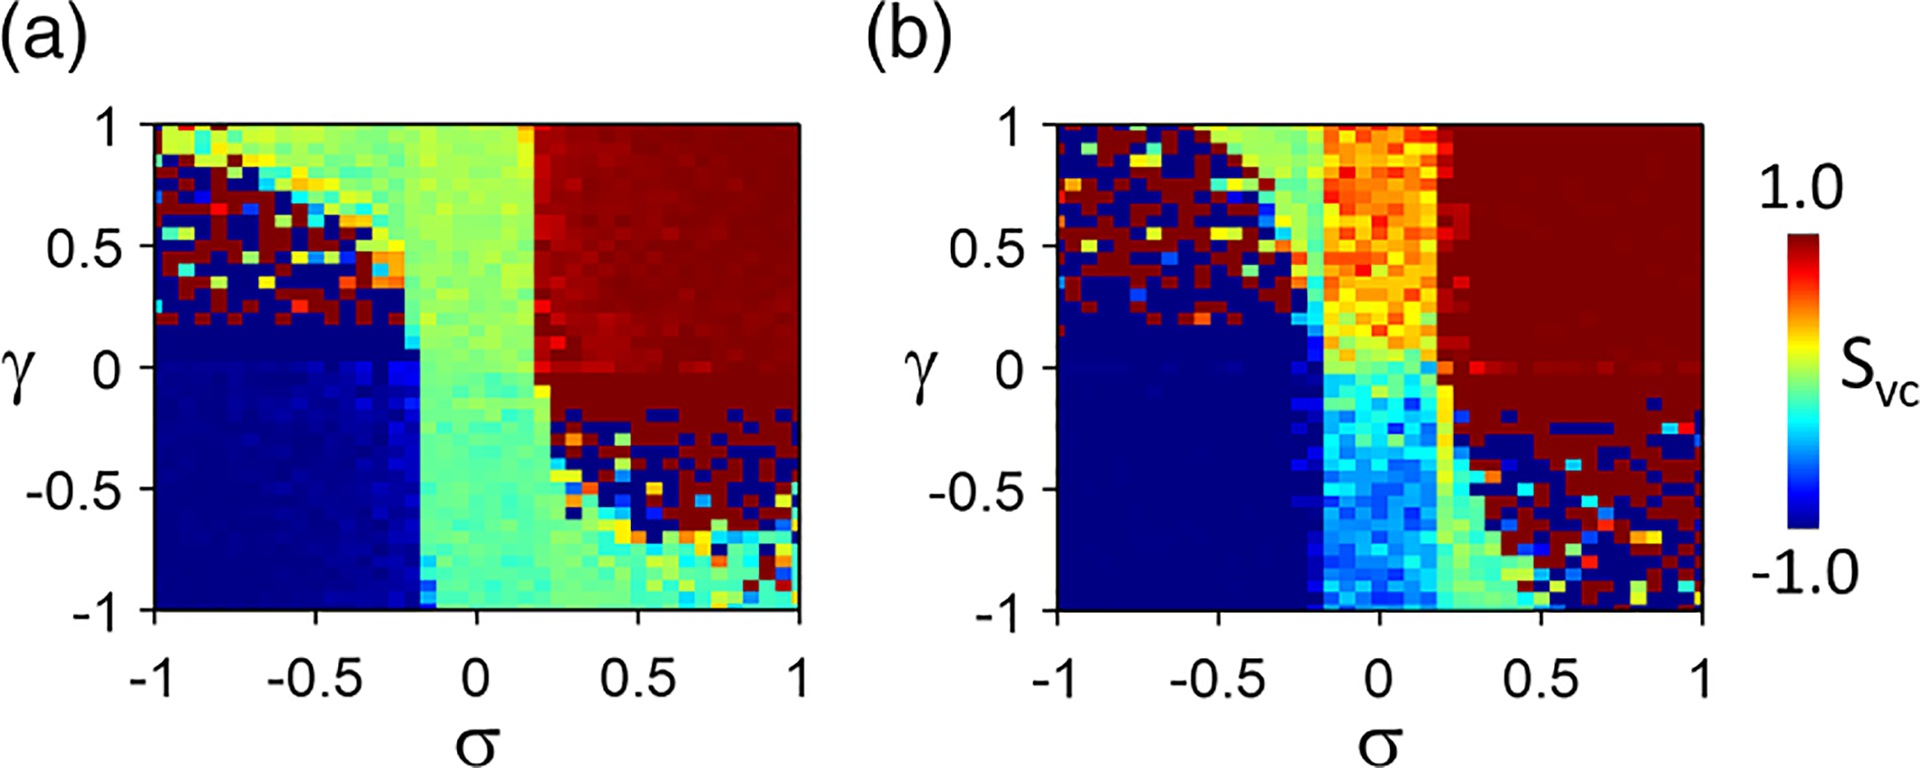
Color maps of vs and in the amplitude equation (AE) model. (a) Purely random initial conditions of and (spatial scale cell). (b) Random initial conditions with a spatial scale of cells. and . Note that in the upper-left and lower-right quadrals, , the spatially discordant alternans (SDA) dynamics is quasiperiodic, measured at the last beat depends on the status the SDA pattern, which varies from beat to beat. Therefore, the values in these two quadrals exhibit a randomlike pattern in the color map. In the upper-right (electromechanically concordant) and lower-left (electromechanically discordant) quadrals, the SDA patterns are phase-locked and stable.
In summary, the AE model demonstrates that there are two ways in which the APD-SDA and Ca-SDA patterns can be synchronized. The first one is spontaneous synchronization caused by strong APD-to-Ca coupling. In this mechanism of synchronization, the SDA patterns are selected by the APD-SDA patterns which are determined by the spatial mode instability and the initial conditions. This mechanism of synchronization is promoted by strong APD instability. The second one is the initial condition-dependent synchronization in which synchronization is promoted by increasing the spatial scale of the initial Ca-SDA patterns. This mechanism of synchronization is promoted by strong Ca instability. Once the system is synchronized, the APD-SDA and Ca-SDA may be locked into electromechanically concordant, discordant, and quasiperiodic patterns depending on the coupling relationships.
B. SDA dynamics in the 1D CML model
To examine the theoretical predictions of the AE model under more physiological conditions, we use a CML model formulated based on previous studies [51,80], described in detail in the Appendix. This model contains physiological parameters, such as APD restitution, fractional Ca release, and Ca release restitution, allowing us to directly link the dynamics to physiological parameters. We vary the following parameters: the slope of the APD restitution [controlled by in Eq. (A6)], the slope of the fractional release [controlled by in Eq. (A7)], and the APD and Ca coupling strengths and [see Eqs. (A1) and (A9)]. Note that determines the APD-to-Ca coupling in the CML model, which is equivalent to in the AE model but not identical since affects the stability of Ca in the CML model. As shown in Eq. (A9) , the APD-to-Ca coupling becomes weaker as the pacing period is longer. When is very long (and thus, is very large), ; APD-to-Ca coupling vanishes. Therefore, at slow pacing, changing APD (and thus DI) has little or no effect on Ca release, which corresponds to in the AE model. However, as the pacing period decreases ( becomes smaller), the term has a bigger effect, thus enhancing the APD-to-Ca coupling. In the CML model, the APD-to-Ca coupling is always positive since lengthening APD shortens DI, resulting in a smaller and thus a smaller Ca [see the definition of positive APD-to-Ca coupling in Fig. 2(c)]. Therefore, the sign of determines the coupling between APD and Ca.
For , the coupling is positive, corresponding to 0 in the AE model. Figure 9(a) shows the stability boundary in the plane for the single cell (or mode) for . The system is stable (no alternans) when both and are large. Figures 9(b) and 9(c) show two spatial patterns of alternans with a single node and multiple nodes, respectively. Figures 9(d) and 9(e) show SDA patterns from random initial conditions with strong and weak coupling, respectively. The APD-SDA and Ca-SDA are synchronized (except in the nodal region) when the APD-to-Ca coupling is strong [Fig. 9(d)] but not when the coupling is weak [Fig. 9(e)]. The case in Fig. 9(d) is like that in Fig. 6(d), in which the APD-SDA forms first and then synchronizes the Ca-SDA pattern to it. Figures 9(f) and 9(g) show vs and vs , respectively. Synchronization occurs when is greater than a critical value, agreeing with the AE model (Fig. 6). The dependence of synchronization on is more complex. Here, is low for , high for , low again for , and finally, high for 320 ms. This can be understood based on the insights for AE model as follows. Based on Eq. (13), , and thus, synchronization tends to occur when is small and is large for a fixed . For is relatively small, but is larger [Fig. 9(h)], and thus, the ability of APD-SDA to synchronize Ca-SDA is not strong enough. However, as increases, increases while decreases, and when is large enough [shaded region in Fig. 9(h)], is large enough to synchronize , causing spontaneous synchronization. As increases further, decreases again, which may be too small to synchronize . As , both APD and Ca are stable; the system always synchronizes. Note that, as in the AE model, when is small (or is short), spontaneous synchronization fails, but the APD-SDA and Ca-SDA patterns can still be synchronized if the spatial scale of the initial Ca-SDA pattern is large.
FIG. 9.
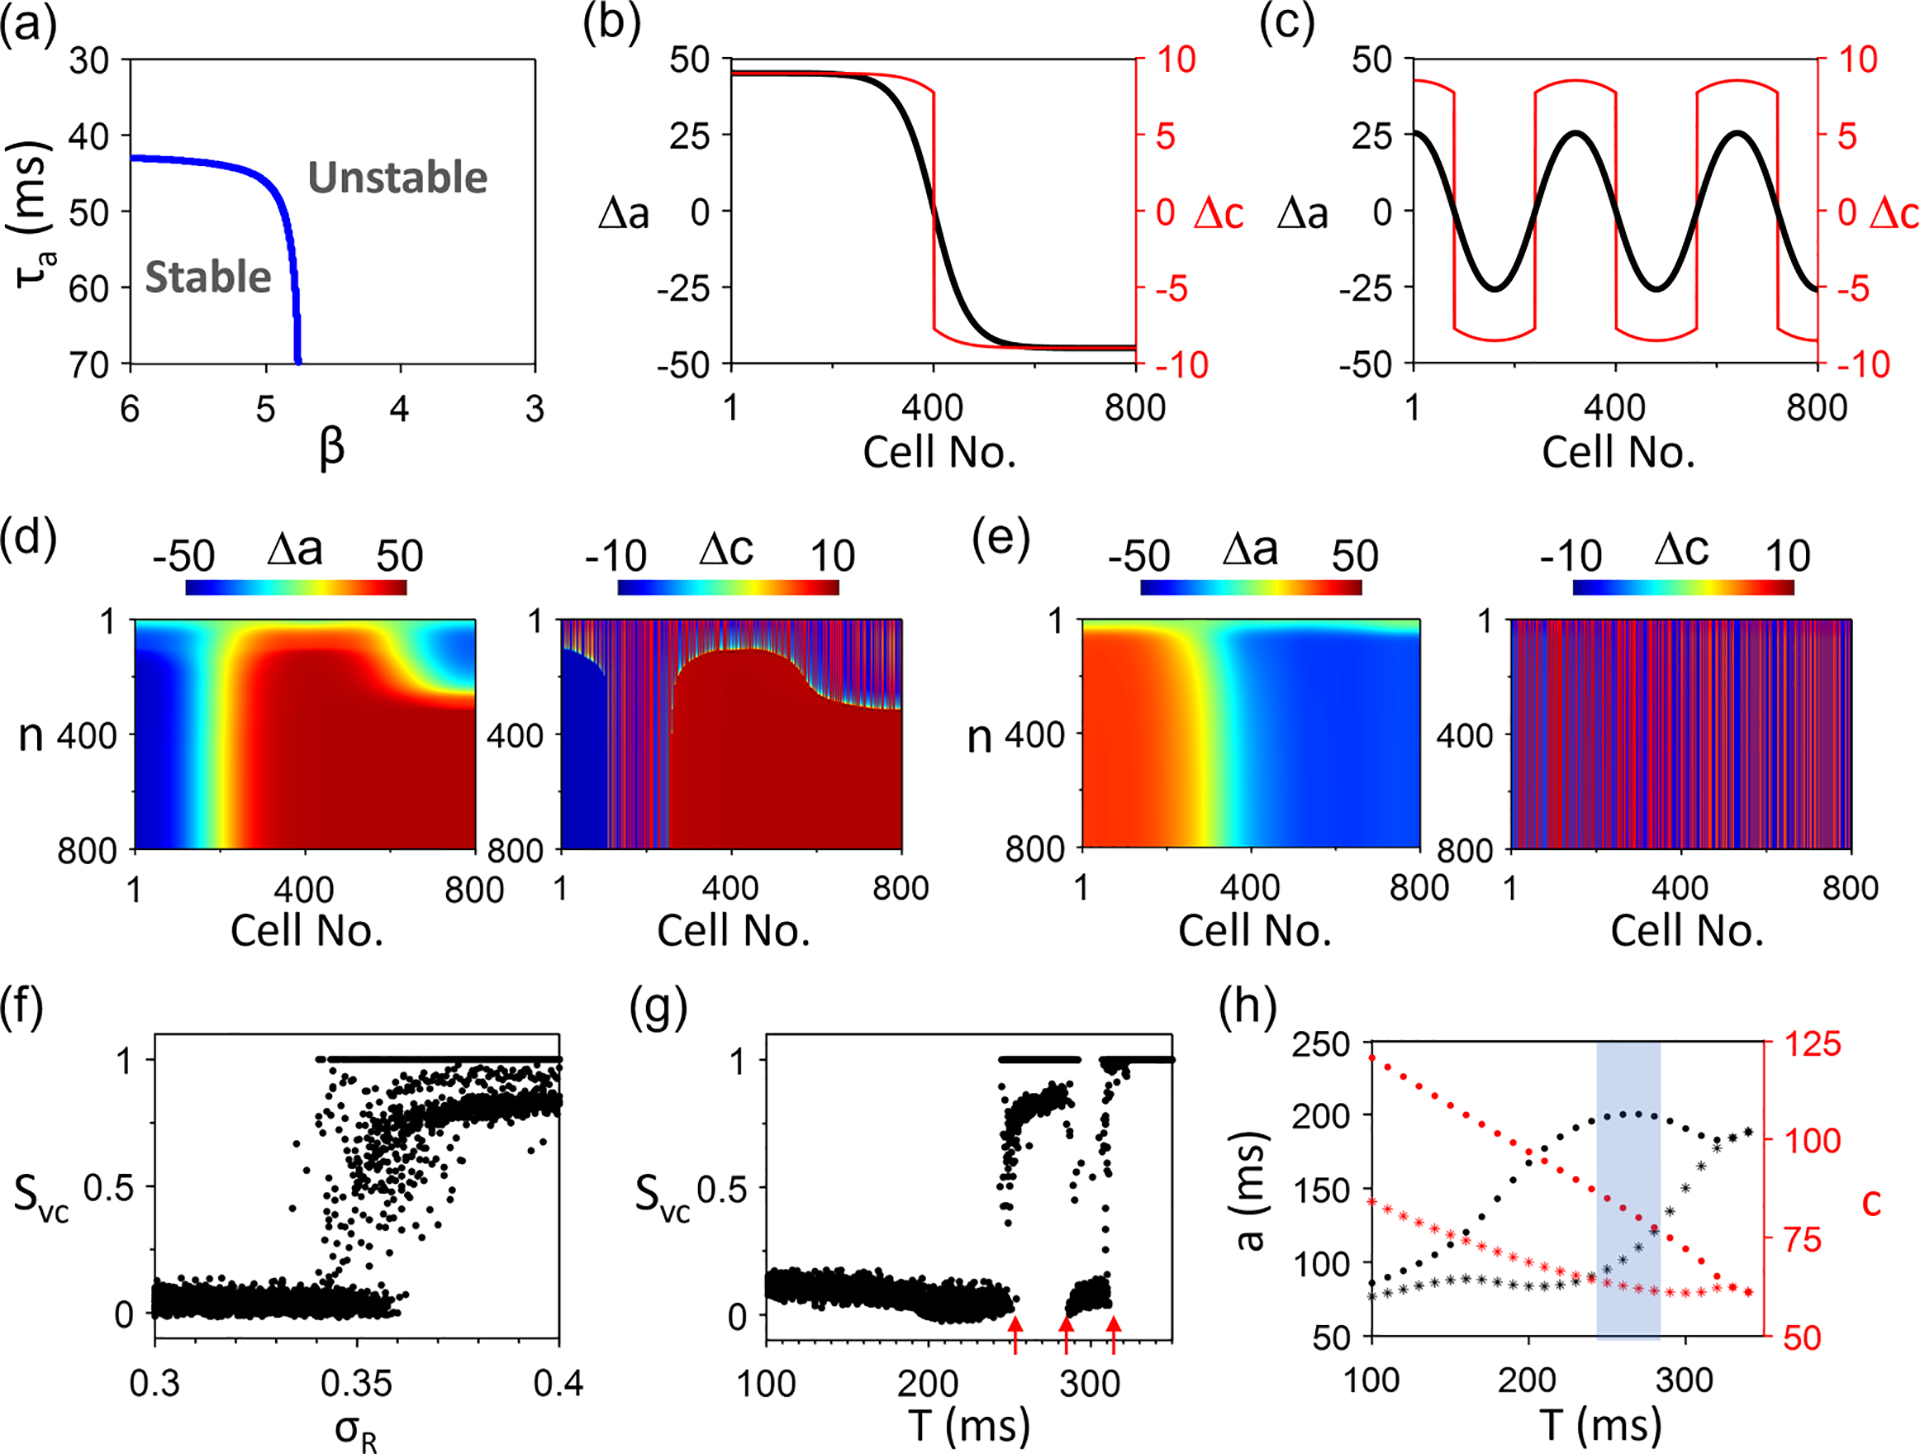
Spatiotemporal Ca and action potential duration (APD) dynamics in the coupled map lattice (CML) model for . (a) Stability boundary in the plane for (or a single cell). (b) and vs cell no. recorded from beat no. 999 and no. 1000 with a single node. (c) Same as (b) but with multiple nodes. (d) and vs with a random initial condition. (e) Same as (d) but with a weaker coupling, . (f) vs . 20 different random initial conditions are used for each . (g) vs random initial conditions are used for each . Arrows mark the for the transition between desynchronized and synchronized SDA patterns. In (f) and (g), the cases of correspond to SCA. (h) and vs for a single cell. The default parameters are , and .
For , the coupling is negative. Figure 10(a) shows the stability boundary in the plane for the single cell (or the mode) for . Unlike in the AE model in which one can calculate the stability boundaries easily for any , it becomes nontrivial for the CML model. We numerically determine the three regions of alternans behaviors for : the electromechanically concordant, discordant, and quasiperiodic alternans regions, which are marked by different colors. Figures 10(b)–10(f) show steady-state patterns or space-time plots for different initial conditions and different parameter sets marked by the symbols in Fig. 10(a). The behaviors are almost identical to those predicted by the AE model shown in Fig. 7.
FIG. 10.
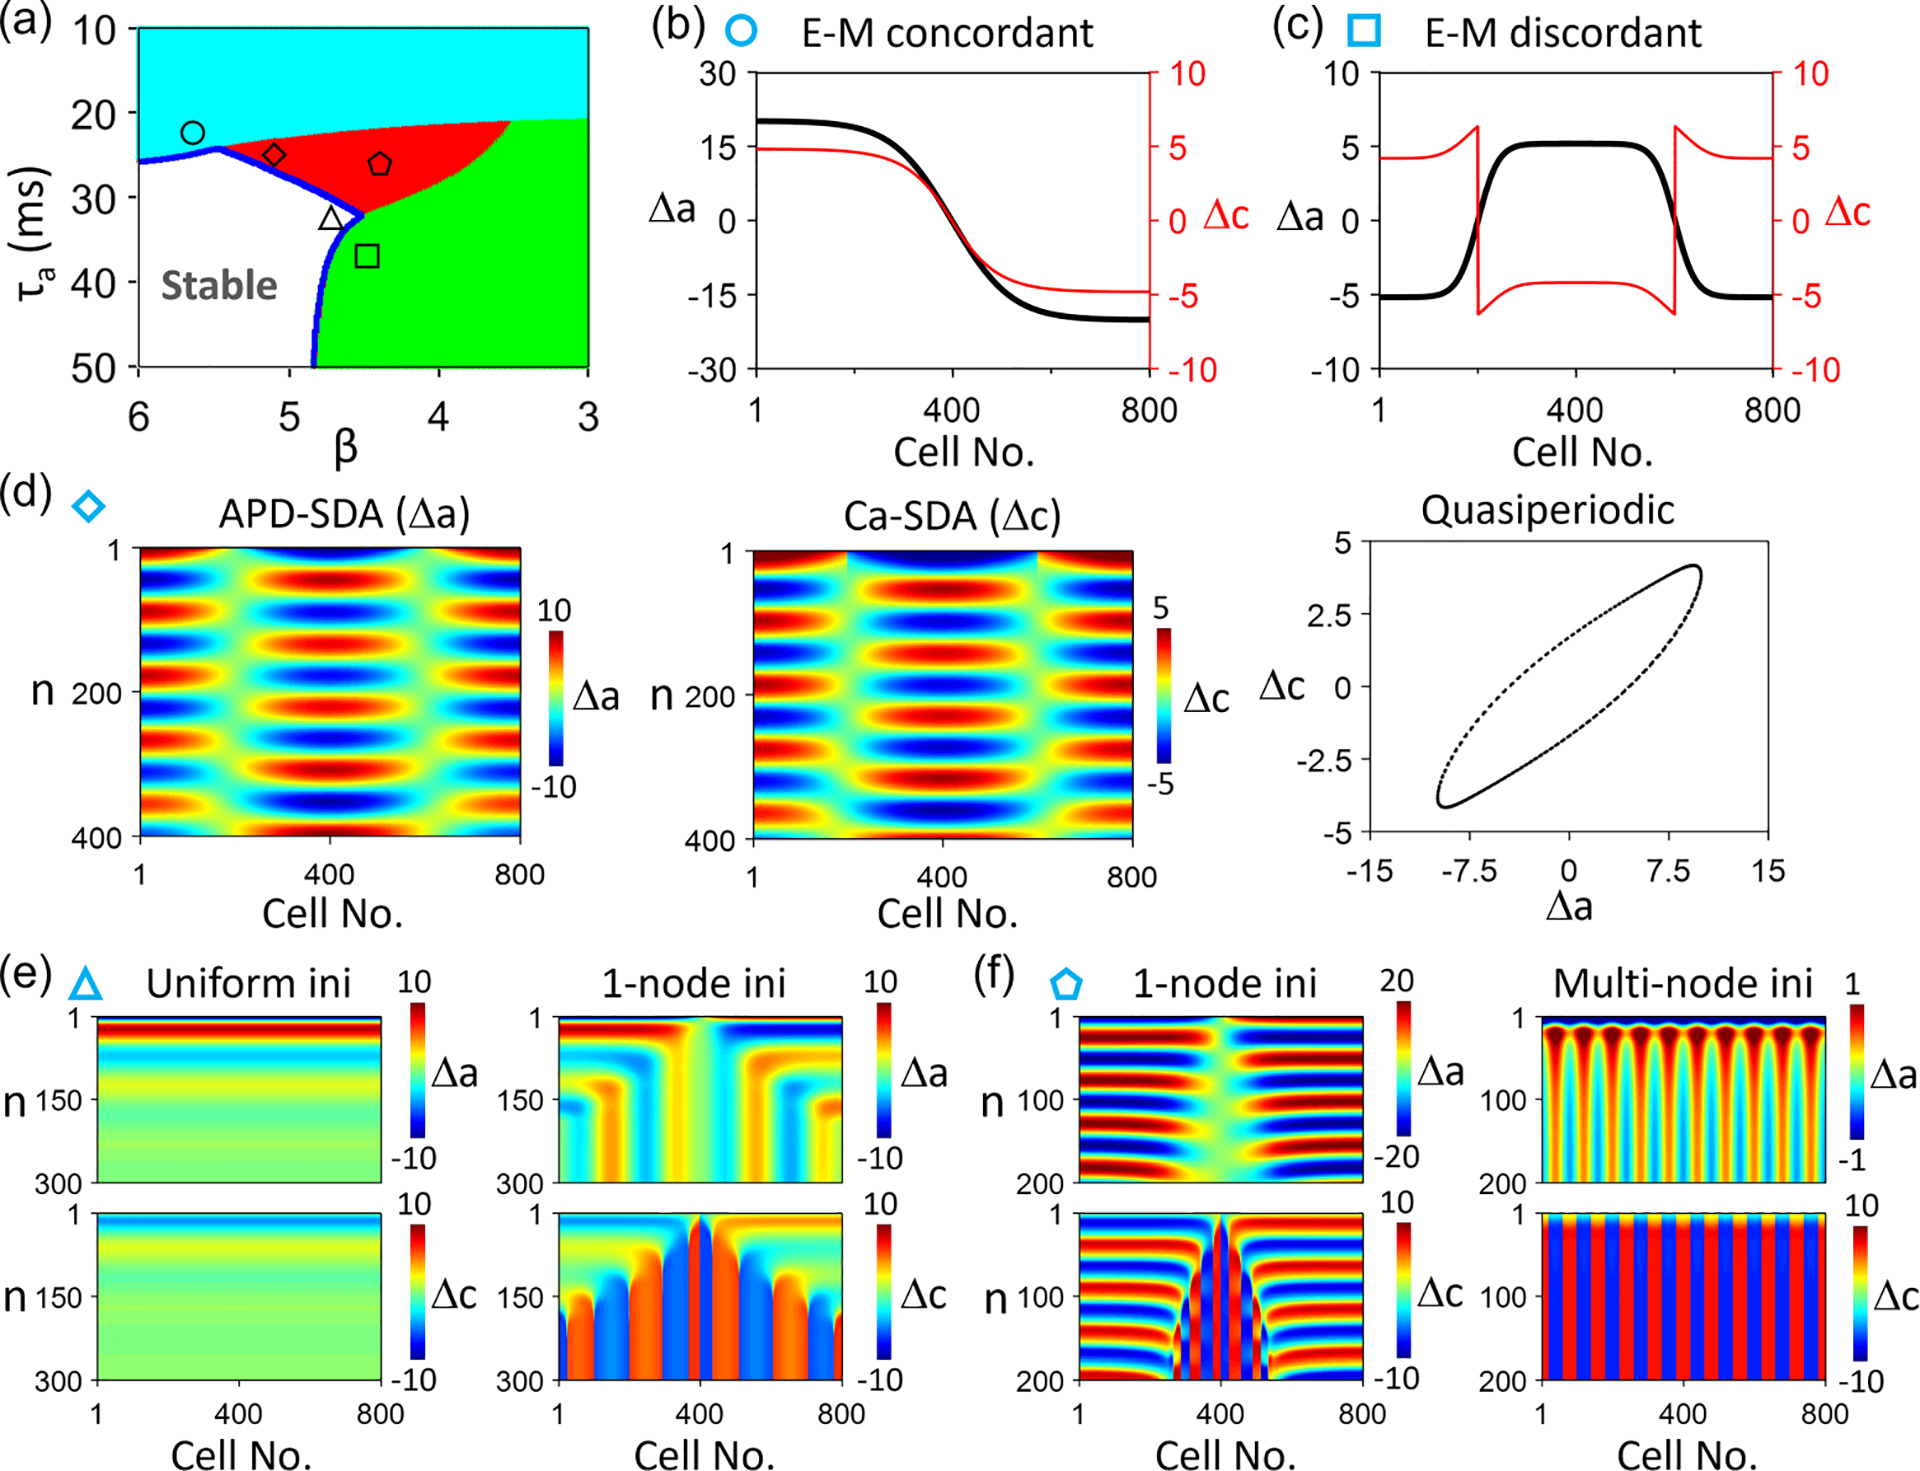
Spatiotemporal Ca and action potential duration (APD) dynamics in the coupled map lattice (CML) model for . (a) Phase diagram showing different Ca and APD dynamics vs and in a single cell. White: stable steady state; cyan: electromechanically concordant alternans; green: electromechanically discordant alternans; and red: quasiperiodicity. , and . (b) Steady-state (black) and (red) showing an electromechanically concordant spatially discordant alternans (SDA). and , marked by the circle in (a). (c) Steady-state (black) and (red) showing an electromechanically discordant SDA. and , marked by the square in (a). (d) Space-time color-scale plots of (left) and (middle) showing a quasiperiodic SDA (right). and , marked by the diamond in (a). (e) A uniform initial condition leads to a stable steady state (left, no alternans), but a nonuniform (one-node) initial condition leads to multinode electromechanically discordant SDA (right). and , marked by the triangle in (a). (f) A one-node initial condition leads to a quasiperiodic SDA (left), but a multinode initial condition leads to a multinode electromechanically discordant SDA. and , marked by the pentagon in (a). In (e) and (f), the upper panels are color-scale plots of , and the lower panels are those of .
C. SDA dynamics in a 1D cable of the rabbit ventricular myocyte model
To further examine the theoretical predictions in physiologically detailed ionic models, we carry out 1D cable simulations using the rabbit ventricular myocyte model by Mahajan et al. [61]. Figure 11(a) is a bifurcation diagram showing APD and peak Ca vs pacing period . Alternans occurs when . Figures 11(b)–11(f) show different SDA patterns resulting from different initial conditions for . In Figs. 11(b) and 11(c), the initial conditions are periodic. In Figs. 11(d)–11(f), the initial conditions are random with different spatial scales. In the cases of random SDA patterns, the Ca-SDA and APD-SDA patterns are synchronized when the spatial scale is large but become dyssynchronous when it is small. These features are the same as for the AE and CML models. Since the APD and Ca coupling is positive, we do not observe electromechanically discordant and quasiperiodic SDA patterns in this ionic model. We also do not observe spontaneous synchronization with pure random initial conditions, indicating that the voltage-driven instability in this model is either absent or not strong enough to promote spontaneous synchronization. The instability leading to alternans in the model is mainly Ca driven.
FIG. 11.
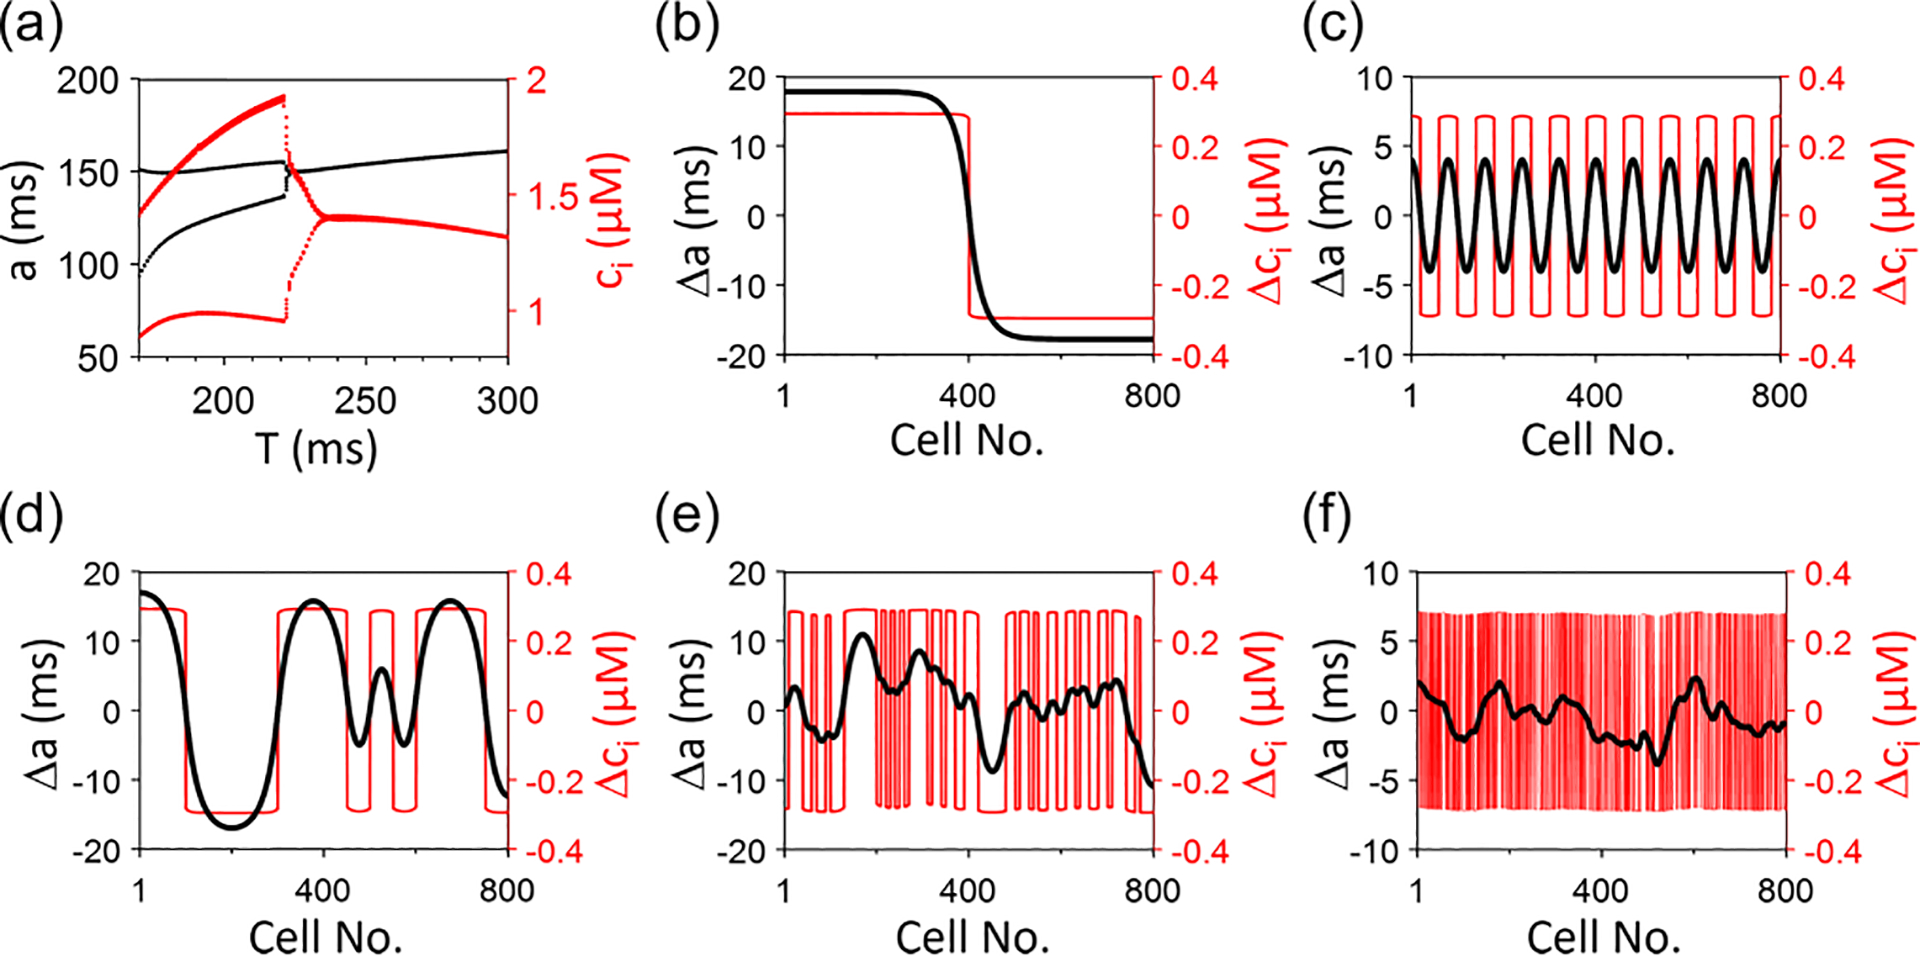
Action potential duration (APD)–spatially discordant alternans (SDA) and Ca-SDA patterns in a one-dimensional (1D) cable of the rabbit ventricular cell model. (a) Bifurcation diagrams showing and peak vs the pacing period . (b)-(f) Steady-state APD-SDA and Ca-SDA patterns for different initial conditions. The spatial scales of random initial conditions in (d)-(f) are cells, cells, and cell, respectively. . Random initiation conditions are set by random initial values of the sarcoplasmic reticulum (SR) Ca load.
D. Nodal line dynamics and SDA pattern synchronization in 2D tissue models
SDA nodes form nodal lines in 2D tissue. When the nodal lines are straight, they behave the same way as the SDA nodes in 1D cable. However, nodal lines can become curved in 2D tissue (such as the ones shown in Fig. 1), and a question arising is how the curvature affects the stability of the nodal lines and the SDA dynamics. As shown in our previous studies [50,51], in the absence of Ca alternans, the SDA nodes or nodal lines are marginally stable in homogeneous tissue. Curved nodal lines or nodal rings are unstable, which become straight or shrink and disappear unless the tissue is heterogeneous. Here, we investigate the effects of nodal line curvature on nodal line stability and synchronization of SDA patterns in 2D homogeneous tissue in the presence of Ca alternans. We extend the AE model into 2D tissue as
| (20) |
| (21) |
First, we consider the stability of a nodal ring, and for the purpose of theoretical argument, we consider a special case in which there is no APD-to-Ca coupling . We further simplify the condition by assuming that the Ca alternans is spatially concordant and in steady state, i.e., . We transform Eq. (20) into a polar coordinate system, which becomes
| (22) |
| (23) |
Assuming an initial APD-SDA nodal ring of radius , one can obtain an eikonal-curvature equation for the node speed as [51]
| (24) |
where is the velocity of the APD-SDA node, and the first term is caused by Ca-to-APD coupling and the second term by curvature. The sign of depends on the sign of . If , the effect of Ca-to-APD coupling and that of curvature are in synergy. If , the two effects compete, and there is a critical radius at which , which gives rise to
| (25) |
In other words, the drifting direction of the nodal ring depends on its radius. Now we consider that there is a nodal ring in Ca alternans. As depicted in Fig. 12(a), is positive on one side and negative on the other side of the node. Therefore, if the initial APD nodal ring is outside the Ca nodal ring, the force from the curvature and the one from the Ca alternans are in synergy, pulling the APD-SDA nodal ring toward the Ca-SDA nodal ring. If the initial APD nodal ring is smaller than the Ca nodal ring, then the two forces compete. Therefore, depending on the strength of the two forces, the APD-SDA nodal ring can either expand to move toward the Ca-SDA nodal ring and stabilize or shrink to disappear. Based on Eq. (24), when the APD-SDA nodal ring radius is larger than , it will synchronize to the Ca-SDA nodal ring if the Ca-SDA nodal ring is larger than . When the APD-SDA nodal ring radius is smaller than , it will shrink and disappear no matter what the Ca-SDA nodal ring radius is. However, in the presence of APD-to-Ca coupling (), the nodal ring dynamics becomes more complex, which is demonstrated in the AE and ionic models below.
FIG. 12.
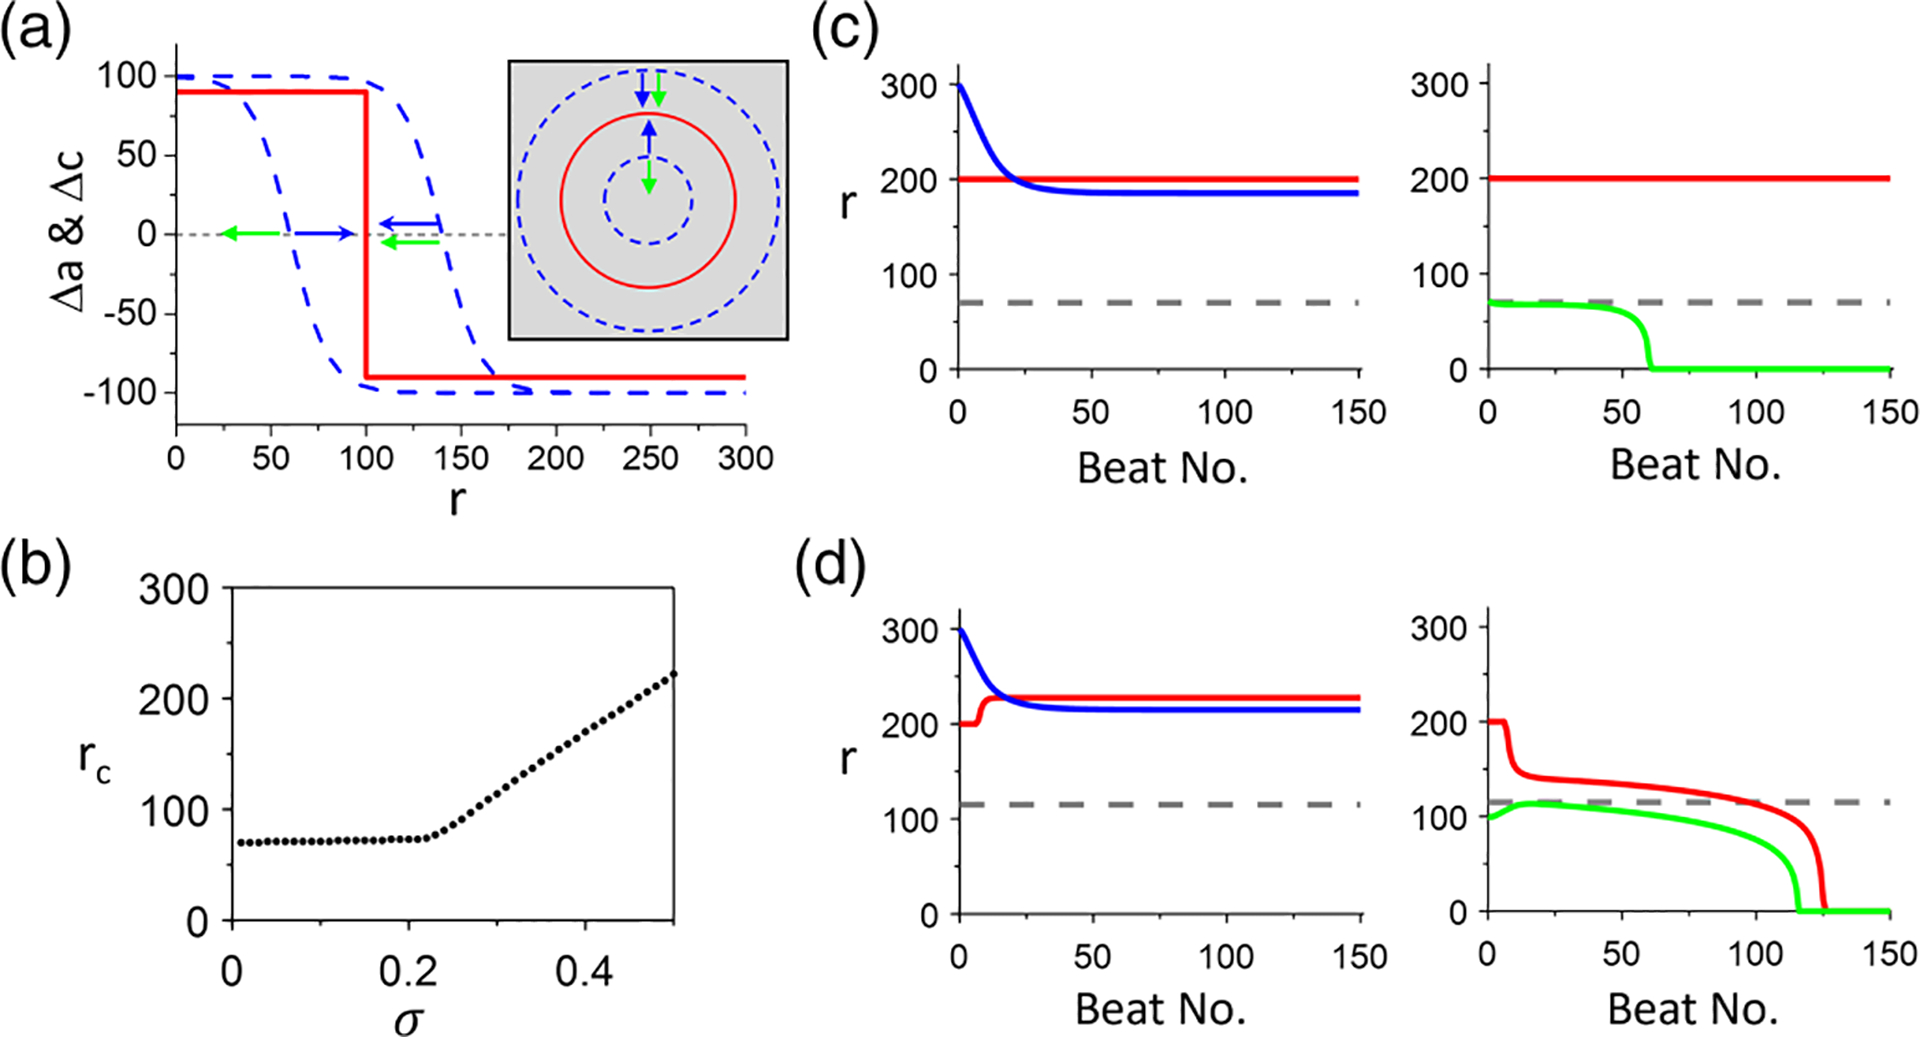
Action potential duration (APD)–spatially discordant alternans (SDA) and Ca-SDA nodal ring dynamics in two-dimensional (2D) tissue of the amplitude equation (AE) model. (a) Schematic plots to illustrate the effects of Ca-SDA nodal ring (red) and curvature on APD-SDA nodal ring (dashed blues). The blue arrows indicate the force of the Ca-SDA nodal ring, and the green arrows indicate the force of the curvature on the APD-SDA ring. (b) The critical ring radius vs determined via computer simulations of the AE model [Eqs. (20) and (21)]. , and . (c) Ring radius vs beat no. for different initial ring radius for . Left: The initial APD-SDA nodal ring (blue) radius . Right: The initial APD-SDA nodal ring (green) radius . (d) Ring radius vs beat no. for different initial ring radius for . Left: The initial APD-SDA nodal ring (blue) radius . Right: The initial APD-SDA nodal ring (green) radius . Simulations are done in a 2D tissue of 800 × 800 cells.
To verify the theoretical argument, we carry out numerical simulations of the AE model [Eqs. (20) and (21)]. Figure 12(b) shows vs obtained from the simulations. Here, remains unchanged for but then increases almost linearly with . When is smaller than the critical value, the APD-SDA nodal ring synchronizes with the Ca-SDA nodal ring if both ring radii are greater than or disappears when either the APD-SDA or Ca-SDA nodal ring radius is smaller than [Fig. 12(c)]. The Ca-SDA nodal ring can be any size larger than the critical size and remains unchanged in time. These behaviors are the same as predicted by the simplified condition [Fig. 12(a)]. When is greater than the critical value, APD-SDA and Ca-SDA nodal rings will synchronize if their radii are greater than , but the final ring radius depends on the initial ring sizes and the coupling strength. When either of their radii is smaller than , both nodal rings disappear [Fig. 12(d)]. Note that the critical value is the same as the one when Ca-SDA is synchronized to APD-SDA via APD-to-Ca coupling, which is determined by Eq. (13). Inserting , and into Eq. (13), one obtains , agreeing with the simulation results.
To further investigate the synchronization of APD-SDA and Ca-SDA patterns in 2D tissue, we carry out simulations of the AE model using random initial conditions with different block sizes of both and . Figure 13(a) shows vs for different spatial scales of the initial SDA pattern. When , APD-SDA and Ca-SDA become synchronized (), almost independent of the spatial scales of the initial pattern. Figure 13(b) shows an example of the synchronized SDA patterns in which the APD-SDA and Ca-SDA nodal lines colocalize and the nodal lines are stable and curved. Under this condition, no small nodal rings can exist, as predicted by the nodal ring results in Fig. 12. When , APD-SDA and Ca-SDA are either completely desynchronized () or partially synchronized . The degree of synchrony is better ( is larger) for a larger spatial scale of the initial SDA pattern. Figure 13(c) shows an example of a SDA pattern, in which the APD-SDA nodal lines colocalize with Ca-SDA nodal lines, but there are several other Ca-SDA nodal rings without corresponding APD-SDA nodal rings. This behavior is the same as in the rabbit heart experiments shown in Fig. 1.
FIG. 13.
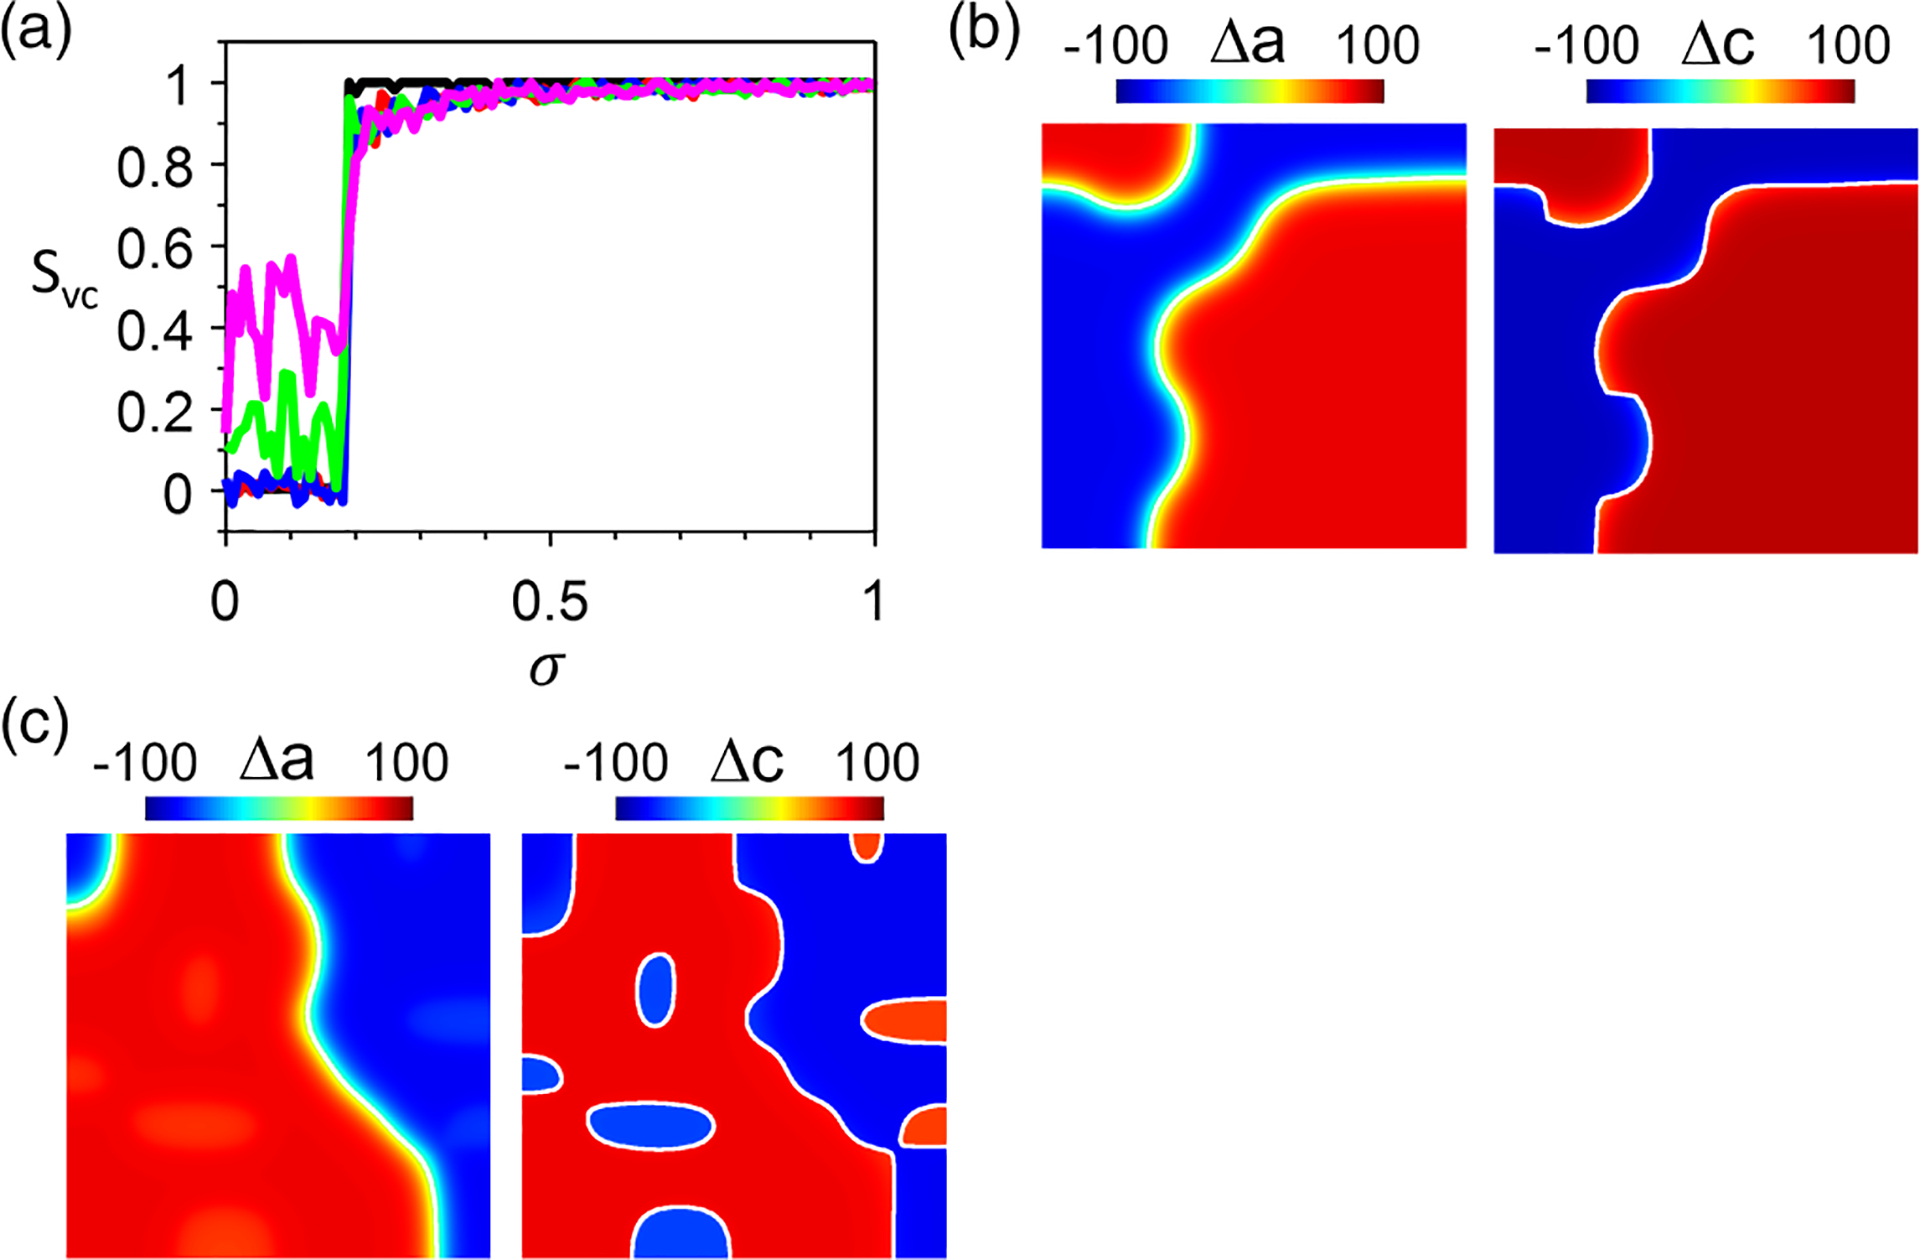
Synchronization of action potential duration (APD)–spatially discordant alternans (SDA) and Ca-SDA patterns when both APD and Ca are unstable. Simulations are done in the amplitude equation (AE) model with , and . Tissue size is 800 × 800 cells. (a) vs for different spatial scales of the initial condition with random block sizes: 1 × 1 cell (black), 10 × 10 cells (red), 20 × 20 cells (blue), 50 × 50 cells (green), and 100 × 100 cells (magenta). Note: Only one random initial condition is used for each for the calculation of . When depends strongly on the block size of the initial condition. (b) Example APD-SDA (left) and Ca-SDA (right) patterns for . The initial condition block size is 100 × 100 cells. The calculated synchronization index is . (c) Example APD-SDA (left) and Ca-SDA (right) patterns for . The initial condition block size is 100 × 100 cells. The calculated synchronization index is . In (b)-(c), the white lines are the nodal lines ( or ).
The results shown in Figs. 12 and 13 are for the condition in which both APD and Ca are unstable. If we use and for which the APD subsystem is stable and the Ca subsystem is unstable, then the nodal ring dynamics and APD-SDA and Ca-SDA synchronization differ from the case in Figs. 12 and 13. Figures 14(a) and 14(b) show the results in which two Ca-SDA nodal rings are set initially, but only one APD-SDA nodal ring can exist, which colocalizes with the large Ca-SDA nodal ring. This behavior is independent of the APD-to-Ca coupling strength. Figure 14(c) shows vs for different spatial scales of the initial SDA pattern, showing that the synchrony does not depend on but only on the spatial scale of the initial condition. Figures 14(d) and 14(e) show two examples of the SDA patterns resulting from two initial conditions, respectively. For the large spatial scale [Fig. 14(d)], the APD-SDA and Ca-SDA patterns are well synchronized. For the small spatial scale [Fig. 14(e)], however, the synchrony is much reduced because there are very small spatial scales in the Ca-SDA pattern but not in the APD-SDA pattern due to cell-to-cell coupling.
FIG. 14.
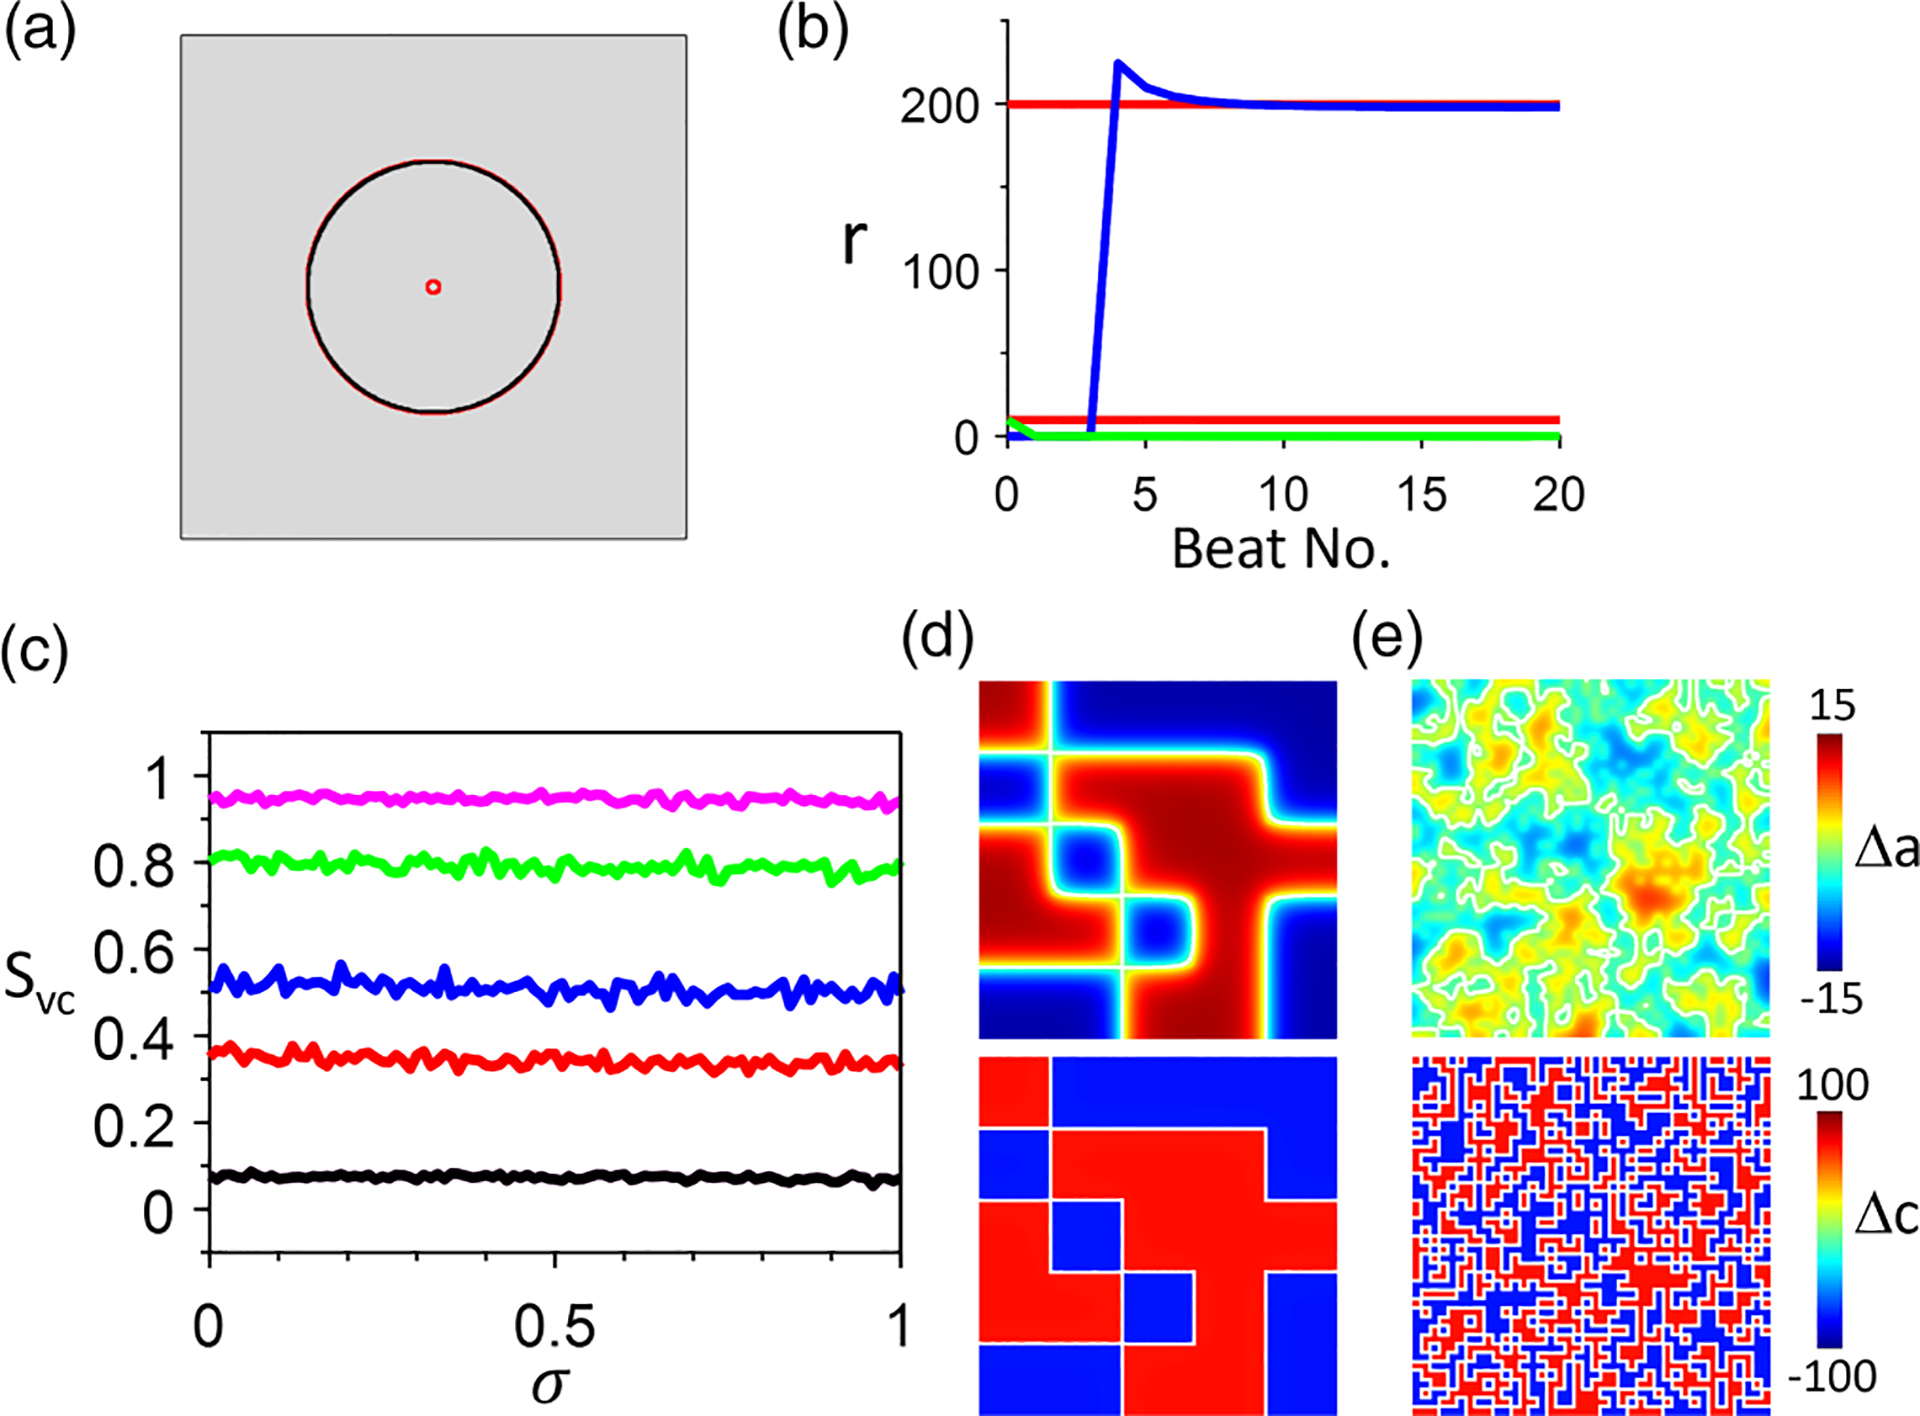
Action potential duration (APD)–spatially discordant alternans (SDA) and Ca-SDA dynamics in two-dimensional (2D) tissue when alternans is driven by Ca alone. Simulations are done in the amplitude equation (AE) model with , and . Tissue size is 800 × 800 cells. (a) Steady-state APD-SDA (black) and Ca-SDA (red) nodal rings. . (b) Ring radius vs beat no. showing the time evolution for the APD-SDA (blue and green) and Ca-SDA (red) nodal rings shown in (a). (c) vs for different spatial scales of the random initial condition. Block sizes: 1 × 1 cell (black), 10 × 10 cells (red), 20 × 20 cells (blue), 50 × 50 cells (green), and 100 × 100 cells (magenta). (d) Example APD-SDA (upper) and Ca-SDA (lower) patterns for . The initial condition block size is 160 × 160 cells. The calculated synchronization index is . (e) Example APD-SDA (upper) and Ca-SDA (lower) patterns for . The initial condition block size is 20 × 20 cells. The calculated synchronization index is . In (d) and (e), the white lines are the nodal lines ( or ).
We then carry out simulations of 2D tissue using the rabbit ventricular myocyte model. Figures 15(a) and 15(b) show the nodal ring behavior, which is identical to that shown in Fig. 14. Figures 15(c)–15(e) show example SDA patterns resulting from random initial patterns of different spatial scales, agreeing completely with those shown in Fig. 14, i.e., synchronization occurs when the spatial scales are large but not for the small ones. Moreover, the SDA patterns always remain the same as the initial Ca-SDA patterns (note that, in Figs. 14 and 15, the Ca-SDA patterns are composed of discretized square boxes that are the same as their initial conditions, while the APD-SDA patterns are smoothed due to cell-to-cell coupling). Agreeing with the 1D cable results in Fig. 11, the 2D results in Fig. 15 imply that, in the rabbit ventricular myocyte model, alternans is mainly caused by the Ca-driven instability.
FIG. 15.
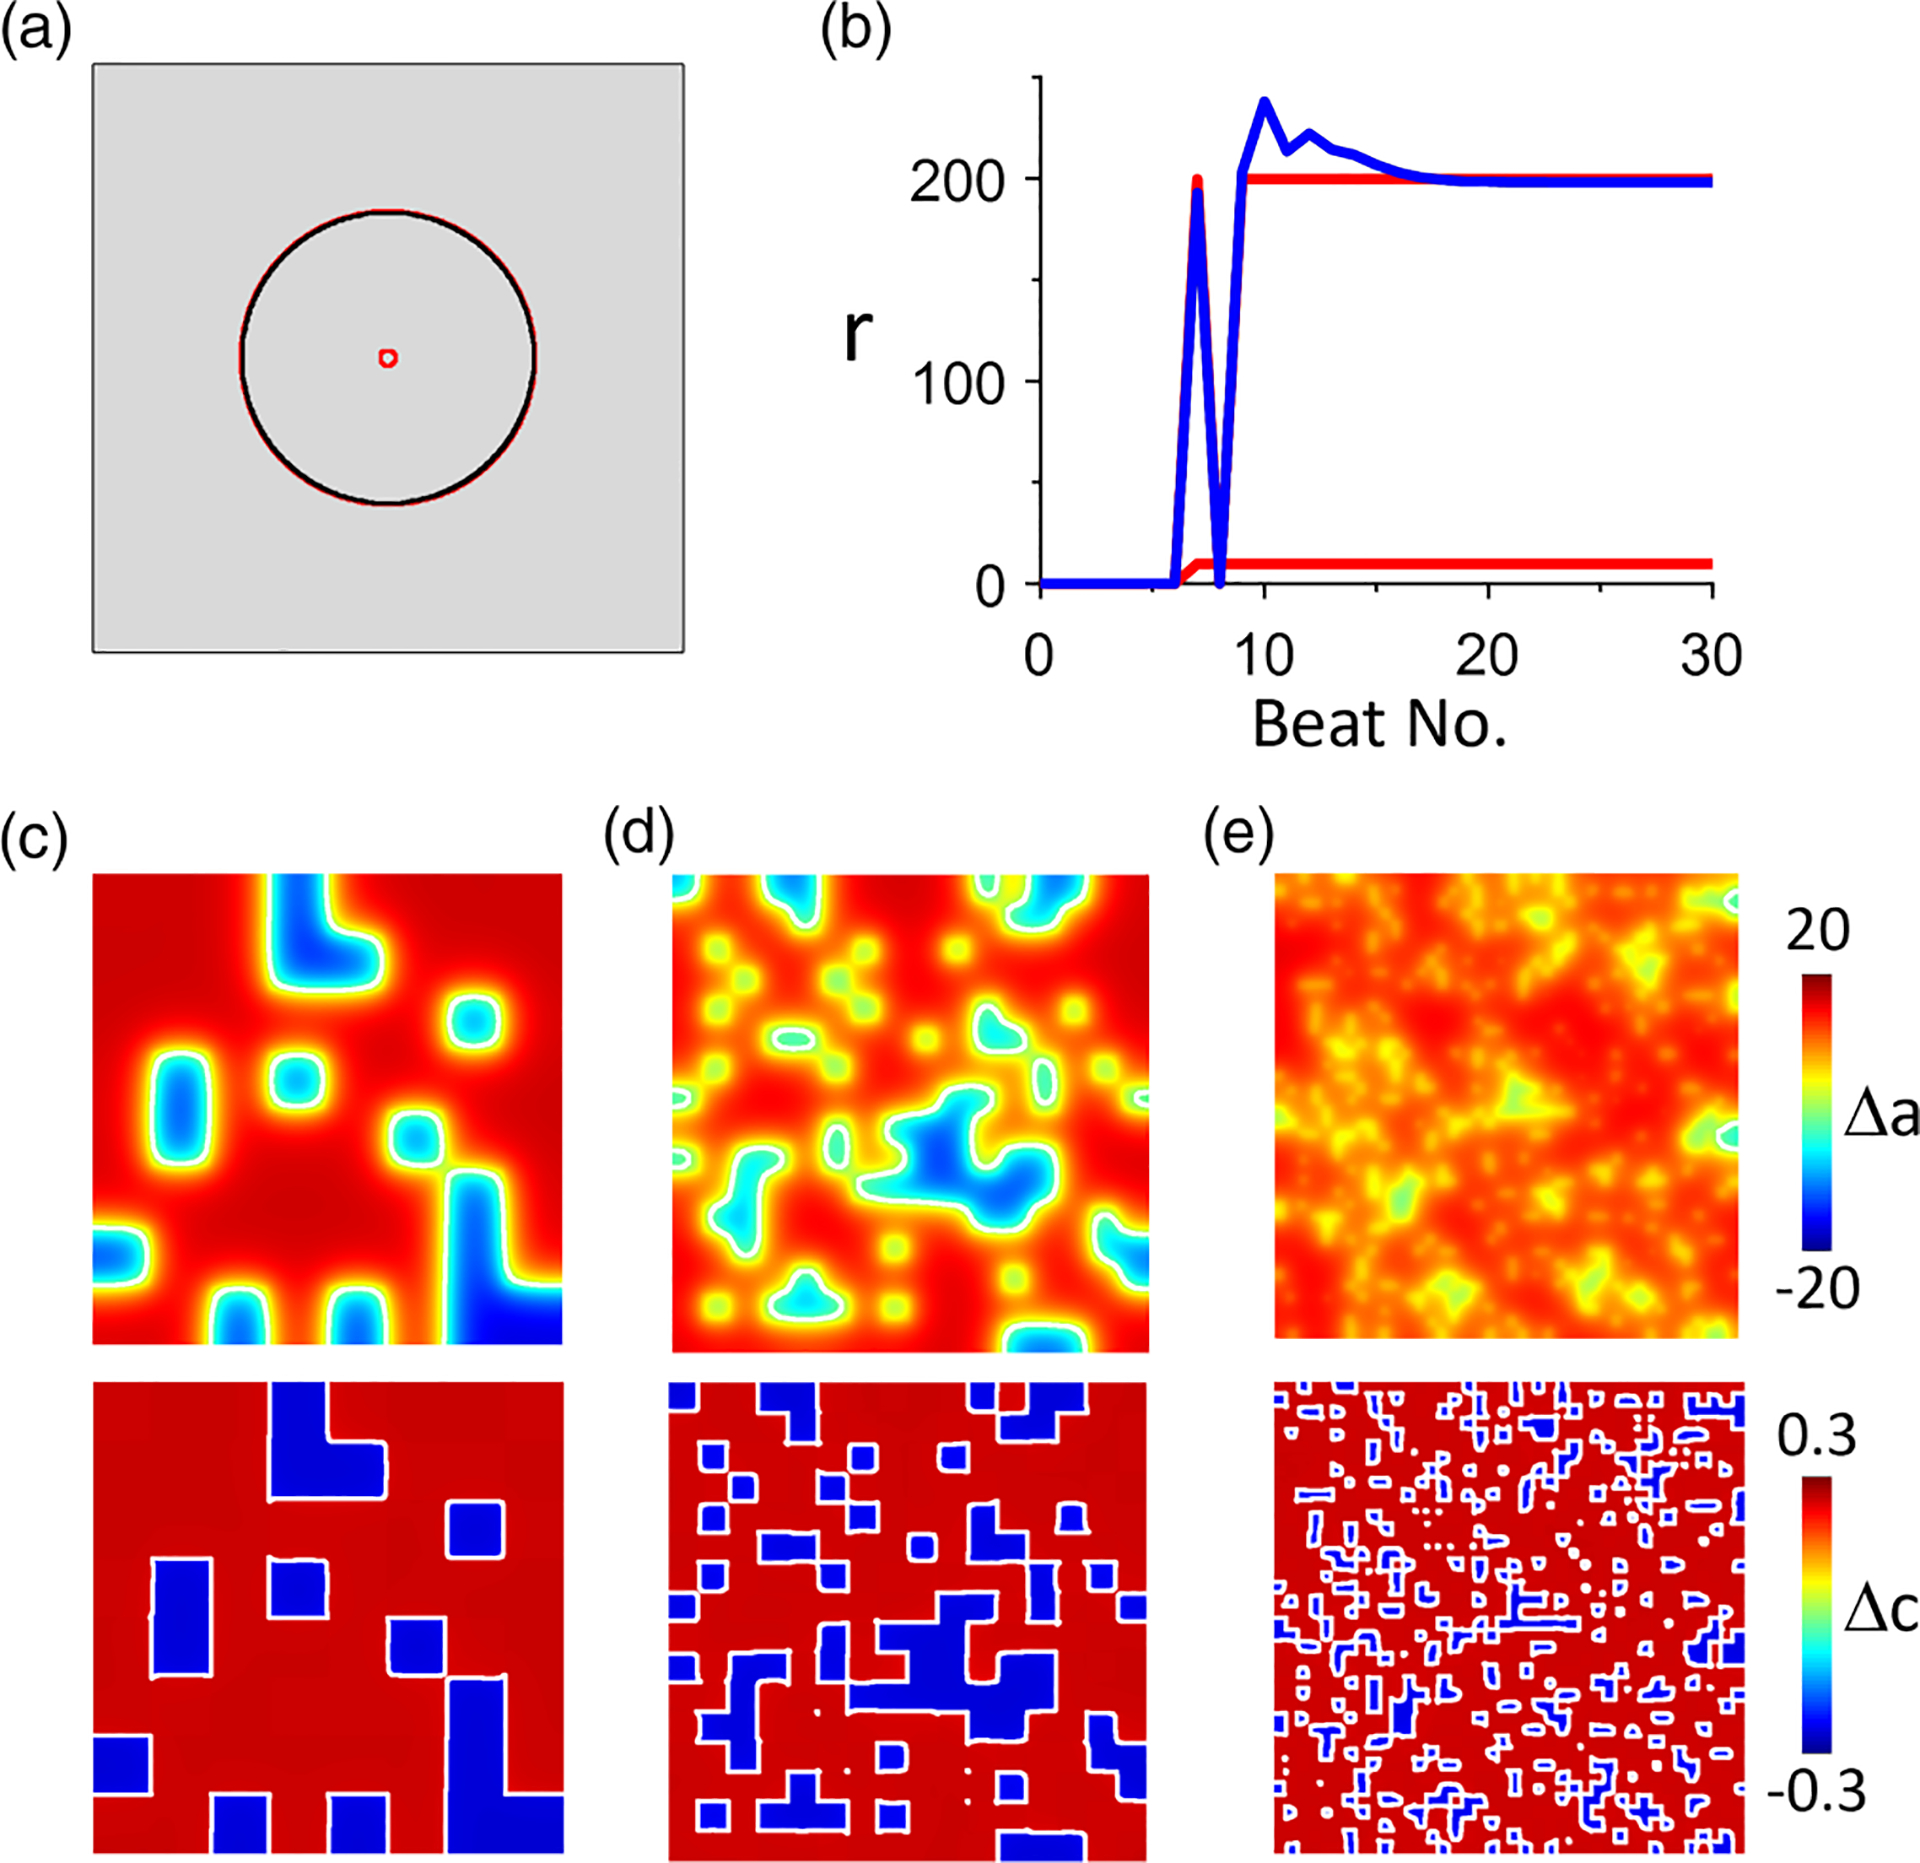
Action potential duration (APD)–spatially discordant alternans (SDA) and Ca-SDA dynamics in a two-dimensional (2D) tissue of the rabbit ventricular cell model. Tissue size is 800 × 800 cells and . (a) Steady-state APD-SDA (black) and Ca-SDA (red) nodal rings. (b) Ring radius vs beat no. showing the time evolution of the APD-SDA (blue) and Ca-SDA (red) nodal rings. (c) Example APD-SDA (upper) and Ca-SDA (lower) patterns. The initial condition block size is 100 × 100 cells. The calculated synchronization index is . (d) Example APD-SDA (upper) and Ca-SDA (lower) patterns. The initial condition block size is 50 × 50 cells. The calculated synchronization index is . (e) Example APD-SDA (upper) and Ca-SDA (lower) patterns. The initial condition block size is 20 × 20 cells. The calculated synchronization index is . In (c)-(e), the white lines are the nodal lines ( or ). Random initiation conditions are set by the random initial values of the sarcoplasmic reticulum (SR) Ca load and the gating variable of IKs.
IV. SUMMARY AND DISCUSSION
In this paper, we investigate the mechanisms of formation and stability of the SDA dynamics and synchronization of APD-SDA and Ca-SDA patterns in cardiac tissue models in the presence of both voltage- and Ca-driven instabilities and the effects of Ca and voltage coupling. We show that, when the Ca subsystem is stable, the Ca-SDA pattern always follows the APD-SDA pattern, and thus, they are always synchronized. When the Ca subsystem is unstable, synchronization of APD-SDA and Ca-SDA patterns depends on the stabilities of both subsystems, their coupling strengths, and the spatial scales of the initial Ca-SDA patterns. Spontaneous (initial condition independent) synchronization is promoted by enhancing APD instability and reducing Ca instability as well as stronger Ca-to-APD and APD-to-Ca coupling, a pattern formation caused by dynamical instabilities. When Ca is more unstable and APD is less unstable or APD-to-Ca coupling is weak, synchronization of APD-SDA and Ca-SDA patterns is promoted by larger initially synchronized Ca-SDA clusters, i.e., initial condition-dependent synchronization. The synchronized APD-SDA and Ca-SDA patterns can be locked in-phase, antiphase, or quasiperiodic depending on the coupling relationship between APD and Ca. Unlike the case of absence of Ca-driven instability in which curved nodal lines are unstable [50,51], curved nodal lines can be stable in homogeneous tissue when Ca-driven alternans exists.
The theoretical and simulation results provide mechanistic insights into APD-SDA and Ca-SDA dynamics observed in experimental studies. Based on our theoretical insights, when there is no Ca-driven instability, the APD-SDA and Ca-SDA patterns are always synchronized. One can imply that Ca is unstable in those experimental settings [44,48,49] in which Ca-SDA and APD-SDA patterns are desynchronized (e.g., Fig. 1). Moreover, that the large spatial scales in the Ca-SDA pattern desynchronize with the APD-SDA pattern in these experiments indicate that the Ca and voltage subsystems may be both unstable (see Fig. 13) since, when either of the two subsystems is stable, APD-SDA and Ca-SDA will tend to be synchronized when the spatial scale of the synchronized clusters of Ca-SDA pattern is large (Figs. 14 and 15).
The mechanistic insights from this paper provide a better understanding of the roles of Ca-driven alternans in cardiac arrhythmogenesis. Since Ca in neighboring cells is not directly coupled, theoretically, the phases of alternans can be arbitrary from cell to cell. If alternans is caused solely by the Ca instability and the phases of Ca alternans are arbitrary, due to the smoothing effect caused by diffusive coupling of voltage, the amplitudes of APD alternans will be small. This cannot generate a large enough APD gradient for arrhythmogenesis [56]. Synchronization of the Ca alternans between cells is required to generate large amplitude APD-SDA for arrhythmogenesis. As shown in this paper, there are two ways to synchronize the SDA patterns. The first one is when Ca alternates in phase in large clusters, which can synchronize APD-SDA to Ca-SDA to generate large APD gradients [e.g., Figs. 5(c) and 11(d)]. This type of clustering may naturally occur in the real system, for example, in heterogeneous tissue in which the onset of alternans is regionally heterogeneous [81,82]. The second way is when APD-to-Ca coupling is strong enough so that APD-SDA and Ca-SDA are spontaneously synchronized to form SDA patterns with large alternans amplitude [e.g., Figs. 6(d) and 9(d)]. Strong APD-to-Ca coupling can be caused by Ca release restitution [67–69] [ in the CML model], which is promoted by fast heart rates. Therefore, Ca alternans at fast heart rates can be more arrhythmogenic than the one at slow heart rates due to stronger APD-to-Ca coupling-promoted Ca-SDA and APD-SDA synchronization. In other words, fast heart rates not only promote Ca alternans but also promote Ca-SDA and APD-SDA synchronization to promote arrhythmias.
There are some limitations of this paper to be mentioned. In the iterated map model, Ca alternans is caused by steep fractional release and APD alternans caused by steep APD restitution. Other mechanisms of Ca alternans and APD alternans exist [83,84] which may affect the SDA dynamics. However, since the AE model is a generic model irrespective of the specific mechanisms of alternans, the mechanisms from the AE model should still be applicable to the SDA dynamics from other mechanisms of alternans. Subcellular Ca alternans has been observed in experiments [27,59,85–87] and computer models [19,59,71,88,89], and tissue models with detailed cell models or multiscale modeling approaches [59,75,77,90–92] are needed to investigate how the subcellular Ca alternans dynamics affect the formation and synchronization of the APD-SDA and Ca-SDA patterns. We only use a global pacing protocol in which no action potential conduction exists. As we argued previously [50,51], this pacing protocol not only has its own physiological realism but also provides a useful means for the understanding of the SDA dynamics when action potential conduction is present. We will carry out further investigations to include action potential conduction in the models to investigate how conduction and conduction restitution affect the SDA dynamics in the presence of Ca-driven alternans. We omitted the cell-to-cell coupling of Ca in our models. It is known that Ca can pass through the gap junction to the neighboring cells [62], and thus, cell-to-cell Ca coupling exists. However, it is believed that this coupling is very weak, and therefore, it has been omitted in computational cardiac tissue models. Although the cell-to-cell Ca coupling may be weak, it may become nontrivial under certain conditions. Furthermore, if this coupling is not weak, it will affect the Ca-SDA patterns and their synchronization with APD-SDA patterns, which cannot be omitted. These need to be investigated in future studies. Finally, we only investigate the nodal line dynamics in the ionic tissue model using the Mahajan et al. [61] action potential model in which the alternans is primarily driven by a Ca instability and the Ca-to-APD coupling is positive. We can change the Ca-to-APD coupling in the model to be negative by adding a Ca-activated small conductance potassium current, as shown in our previous study [19]. However, under the negative coupling condition, we were still not able to generate quasiperiodicity in this model by simply changing the conductance of the L-type Ca current or any of the potassium currents, likely due to the lack of enough voltage-driven instabilities. Other ionic models may be used in future studies to investigate the coupled dynamics when both Ca- and voltagedriven instabilities are present to reveal the predictions from the AE and CML models.
ACKNOWLEDGMENTS
This paper was supported by National Institutes of Health Grants No. R01 HL134709, No. R01 HL133294, and No. R01 HL157116 (Z.Q.) and Natural Science Foundation of China Grant No. 82172067 (Z.S.) and Grant No. 71731002 (C.H.).
APPENDIX: CML AND IONIC MODELS
1. CML model
A CML model is an array of coupled iterated maps of APD and Ca. In a previous study [51,80], we developed a CML model to describe the spatiotemporal dynamics of APD in 1D and 2D models. Here, we use the same CML model to investigate the SDA dynamics in the presence of Ca-driven alternans.
a. Single-cell iterated map model
We use the iterated map model we developed previously [22] for APD and Ca dynamics in the presence of Ca and APD coupling. The equations are
| (A1) |
| (A2) |
| (A3) |
where is the APD of the th beat, and is the DI of the th beat, satisfying . Here, is the SR Ca load at the end of the th beat, and is the total cytosolic Ca at the end of the th beat. Also, is the diastolic Ca at the end of the th beat, which is described by
| (A4) |
Here, is the peak cytosolic Ca at the th beat, which is described by
| (A5) |
The functions are defined as follows:
| (A6) |
| (A7) |
| (A8) |
| (A9) |
| (A10) |
| (A11) |
where is the parameter describing Ca-to-APD coupling, and is the one describing APD-to-Ca coupling. Here, , and in Eq. (A6) are the parameters determining the APD and APD restitution properties. Also, , and are used. We change to alter the APD restitution properties. Furthermore, and are the parameters determining the fractional Ca release properties, and we change to change the fractional Ca release properties to promote Ca alternans. Here, , and . Also, is altered for synchronization of APD-SDA and Ca-SDA. Note that the Greek letters , and are parameters specific to the iterated map model, not related to the same Greek letters in the AE model. The physiological meanings of the functions and parameters are detailed in the previous study [22].
b. 1D cable CML model
Under global pacing, there is no conduction, and thus, every cell in the cable has the same excitation period, which is just the pacing period . Therefore, the DI and APD of a cell satisfy the following relationship:
| (A12) |
where is the cell index in the cable, and is the beat number. Based on our previous formulation [51,80], is determined as follows:
| (A13) |
where is the function described in Eq. (A1). Here, is a parameter controlling the coupling strength of voltage between cells, and is the maximum coupling length (i.e., number of cells). Also, describes the distance-dependent weight of coupling strength, which is a Gaussian function, i.e., . We use , and . No-flux boundary conditions are used. Details of the CML model and boundary conditions are presented in Wang et al. [80].
2. Ionic model
1D cable and 2D tissue simulations are carried out using the rabbit ventricular action potential model by Mahajan et al. [61]. The governing partial differential equation for voltage in the 1D cable is
| (A14) |
where , and is the total ionic current density from the rabbit ventricular action potential model by Mahajan et al. [61]. Here, is the stimulus current density, which is a 0.5 ms duration and pulse applied periodically with a pacing period . The governing partial differential equation for in the isotropic 2D tissue model is
| (A15) |
No-flux boundary conditions are used for both 1D and 2D tissue models.
References
- [1].Bers DM, Cardiac excitation-contraction coupling, Nature (London) 415, 198 (2002). [DOI] [PubMed] [Google Scholar]
- [2].Qu Z, Hu G, Garfinkel A, and Weiss JN, Nonlinear and stochastic dynamics in the heart, Phys. Rep 543, 61 (2014). [DOI] [PMC free article] [PubMed] [Google Scholar]
- [3].Traube L, Ein Fall von Pulsus bigeminus nebst Bemerkungen uber die Lebershwellungen bei Klappenfehlern und acute Leberatrophie, Berl. Klin. Wochenschr 9, 185 (1872). [Google Scholar]
- [4].Hering HE, Das Wesen des Herzalternans, Munch. Med. Wochenschr 4, 1414 (1908). [Google Scholar]
- [5].Mines GR, On dynamic equilibrium in the heart, J. Physiol 46, 349 (1913). [DOI] [PMC free article] [PubMed] [Google Scholar]
- [6].Nolasco JB and Dahlen RW, A graphic method for the study of alternation in cardiac action potentials, J. Appl. Physiol 25, 191 (1968). [DOI] [PubMed] [Google Scholar]
- [7].Guevara MR, Ward G, Shrier A, and Glass L, Electrical alternans and period doubling bifurcations, IEEE Comp. Cardiol 562, 167 (1984). [Google Scholar]
- [8].Glass L, Dynamics of cardiac arrhythmias, Phys. Today 49, 40 (1996). [Google Scholar]
- [9].Rosenbaum DS, Jackson LE, Smith JM, Garan H, Ruskin JN, and Cohen RJ, Electrical alternans and vulnerability to ventricular arrhythmias, N. Engl. J. Med 330, 235 (1994). [DOI] [PubMed] [Google Scholar]
- [10].Narayan SM, T-wave alternans and the susceptibility to ventricular arrhythmias, J. Am. Coll. Cardiol 47, 269 (2006) [DOI] [PubMed] [Google Scholar]
- [11].Zhou X, Bueno-Orovio A, Orini M, Hanson B, Hayward M, Taggart P, Lambiase PD, Burrage K, and Rodriguez B, In vivo and in silico investigation into mechanisms of frequency dependence of repolarization alternans in human ventricular cardiomyocytes, Circ. Res 118, 266 (2016). [DOI] [PMC free article] [PubMed] [Google Scholar]
- [12].Moore PK, Raffel KE, and Whitman IR, Macroscopic Twave alternans: A red flag for code blue, JAMA Intern Med 177, 1520 (2017). [DOI] [PubMed] [Google Scholar]
- [13].Vinet A, Chialvo DR, Michaels DC, and Jalife J, Nonlinear dynamics of rate-dependent activation in models of single cardiac cells, Circ. Res 67, 1510 (1990). [DOI] [PubMed] [Google Scholar]
- [14].Qu Z, Nivala M, and Weiss JN, Calcium alternans in cardiac myocytes: Order from disorder, J. Mol. Cell Cardiol 58, 100 (2013). [DOI] [PMC free article] [PubMed] [Google Scholar]
- [15].Rovetti R, Cui X, Garfinkel A, Weiss JN, and Qu Z, Spark-induced sparks as a mechanism of intracellular calcium alternans in cardiac myocytes, Circ. Res 106, 1582 (2010). [DOI] [PMC free article] [PubMed] [Google Scholar]
- [16].Alvarez-Lacalle E, Cantalapiedra IR, Penaranda A, Cinca J, Hove-Madsen L, and Echebarria B, Dependency of calcium alternans on ryanodine receptor refractoriness, PLoS One 8, e55042 (2013). [DOI] [PMC free article] [PubMed] [Google Scholar]
- [17].Alvarez-Lacalle E, Echebarria B, Spalding J, and Shiferaw Y, Calcium Alternans is Due to an Order-Disorder Phase Transition in Cardiac Cells, Phys. Rev. Lett 114, 108101 (2015). [DOI] [PubMed] [Google Scholar]
- [18].Colman MA, Pinali C, Trafford AW, Zhang H, and Kitmitto A, A computational model of spatio-temporal cardiac intracellular calcium handling with realistic structure and spatial flux distribution from sarcoplasmic reticulum and t-tubule reconstructions, PLoS Comput. Biol 13, e1005714 (2017). [DOI] [PMC free article] [PubMed] [Google Scholar]
- [19].Song Z and Qu Z, Delayed global feedback in the genesis and stability of spatiotemporal excitation patterns in paced biological excitable media, PLoS Comput. Biol 16, e1007931 (2020). [DOI] [PMC free article] [PubMed] [Google Scholar]
- [20].Restrepo JG, Weiss JN, and Karma A, Calsequestrin-mediated mechanism for cellular calcium transient alternans, Biophys. J 95, 3767 (2008). [DOI] [PMC free article] [PubMed] [Google Scholar]
- [21].Shiferaw Y, Sato D, and Karma A, Coupled dynamics of voltage and calcium in paced cardiac cells, Phys. Rev. E 71, 021903 (2005). [DOI] [PMC free article] [PubMed] [Google Scholar]
- [22].Qu Z, Shiferaw Y, and Weiss JN, Nonlinear dynamics of cardiac excitation-contraction coupling: An iterated map study, Phys. Rev. E 75, 011927 (2007). [DOI] [PubMed] [Google Scholar]
- [23].Jordan PN and Christini DJ, Characterizing the contribution of voltage- and calcium-dependent coupling to action potential stability: Implications for repolarization alternans, Am. J. Physiol. Heart Circ. Physiol 293, H2109 (2007). [DOI] [PubMed] [Google Scholar]
- [24].Banville I and Gray RA, Effect of action potential duration and conduction velocity restitution and their spatial dispersion on alternans and the stability of arrhythmias, J. Cardiovasc. Electrophysiol 13, 1141 (2002). [DOI] [PubMed] [Google Scholar]
- [25].Diaz ME, O’Neill SC, and Eisner DA, Sarcoplasmic reticulum calcium content fluctuation is the key to cardiac alternans, Circ. Res 94, 650 (2004). [DOI] [PubMed] [Google Scholar]
- [26].Picht E, DeSantiago J, Blatter LA, and Bers DM, Cardiac alternans do not rely on diastolic sarcoplasmic reticulum calcium content fluctuations, Circ. Res 99, 740 (2006). [DOI] [PubMed] [Google Scholar]
- [27].Kockskamper J and Blatter LA, Subcellular Ca2+ alternans represents a novel mechanism for the generation of arrhythmogenic Ca2+ waves in cat atrial myocytes, J. Physiol 545, 65 (2002). [DOI] [PMC free article] [PubMed] [Google Scholar]
- [28].Li Y, Diaz ME, Eisner DA, and O’Neill S, The effects of membrane potential, SR Ca2+ content and RyR responsiveness on systolic Ca2+ alternans in rat ventricular myocytes, J. Physiol 587, 1283 (2009). [DOI] [PMC free article] [PubMed] [Google Scholar]
- [29].Xie LH, Sato D, Garfinkel A, Qu Z, and Weiss JN, Intracellular Ca alternans: Coordinated regulation by sarcoplasmic reticulum release, uptake, and leak, Biophys. J 95, 3100 (2008). [DOI] [PMC free article] [PubMed] [Google Scholar]
- [30].Martinez-Hernandez E, Kanaporis G, and Blatter LA, Mechanism of carvedilol induced action potential and calcium alternans, Channels 16, 97 (2022). [DOI] [PMC free article] [PubMed] [Google Scholar]
- [31].Pastore JM, Girouard SD, Laurita KR, Akar FG, and Rosenbaum DS, Mechanism linking T-wave alternans to the genesis of cardiac fibrillation, Circulation 99, 1385 (1999). [DOI] [PubMed] [Google Scholar]
- [32].Cao JM, Qu Z, Kim YH, Wu TJ, Garfinkel A, Weiss JN, Karagueuzian HS, and Chen PS, Spatiotemporal heterogeneity in the induction of ventricular fibrillation by rapid pacing: Importance of cardiac restitution properties, Circ. Res 84, 1318 (1999). [DOI] [PubMed] [Google Scholar]
- [33].Qu Z, Garfinkel A, Chen PS, and Weiss JN, Mechanisms of discordant alternans and induction of reentry in simulated cardiac tissue, Circulation 102, 1664 (2000). [DOI] [PubMed] [Google Scholar]
- [34].Clusin WT, Calcium and cardiac arrhythmias: DADs, EADs, and alternans, Crit. Rev. Clin. Lab. Sci 40, 337 (2003). [DOI] [PubMed] [Google Scholar]
- [35].Qu Z, Xie Y, Garfinkel A, and Weiss JN, T-wave alternans and arrhythmogenesis in cardiac diseases, Front Physiol 1, 154 (2010) [DOI] [PMC free article] [PubMed] [Google Scholar]
- [36].Muñoz LM, Gelzer ARM, Fenton FH, Qian W, Lin W, Gilmour RF, and Otani NF, Discordant alternans as a mechanism for initiation of ventricular fibrillation in vitro, J. Am. Heart Assoc 7, e007898 (2018) [DOI] [PMC free article] [PubMed] [Google Scholar]
- [37].Choi BR, Jang W, and Salama G, Spatially discordant voltage alternans cause wavebreaks in ventricular fibrillation, Heart Rhythm 4, 1057 (2007). [DOI] [PMC free article] [PubMed] [Google Scholar]
- [38].Liu W, Kim TY, Huang X, Liu MB, Koren G, Choi BR, and Qu Z, Mechanisms linking T-wave alternans to spontaneous initiation of ventricular arrhythmias in rabbit models of long QT syndrome, J. Physiol 596, 1341 (2018) [DOI] [PMC free article] [PubMed] [Google Scholar]
- [39].Watanabe MA, Fenton FH, Evans SJ, Hastings HM, and Karma A, Mechanisms for discordant alternans, J. Cardiovasc. Electrophysiol 12, 196 (2001). [DOI] [PubMed] [Google Scholar]
- [40].Echebarria B and Karma A, Instability and Spatiotemporal Dynamics of Alternans in Paced Cardiac Tissue, Phys. Rev. Lett 88, 208101 (2002). [DOI] [PubMed] [Google Scholar]
- [41].Fox JJ, Riccio ML, Hua F, Bodenschatz E, and Gilmour RF, Spatiotemporal transition to conduction block in canine ventricle, Circ. Res 90, 289 (2002). [DOI] [PubMed] [Google Scholar]
- [42].de Lange E and Kucera JP, Alternans resonance and propagation block during supernormal conduction in cardiac tissue with decreased K+]o, Biophys. J 98, 1129 (2010). [DOI] [PMC free article] [PubMed] [Google Scholar]
- [43].Echebarria B, Roder G, Engel H, Davidsen J, and Bar M, Supernormal conduction in cardiac tissue promotes concordant alternans and action potential bunching, Phys. Rev. E 83, 040902(R) (2011). [DOI] [PubMed] [Google Scholar]
- [44].Hayashi H, Shiferaw Y, Sato D, Nihei M, Lin SF, Chen PS, Garfinkel A, Weiss JN, and Qu Z, Dynamic origin of spatially discordant alternans in cardiac tissue, Biophys. J 92, 448 (2007). [DOI] [PMC free article] [PubMed] [Google Scholar]
- [45].de Diego C, Pai RK, Dave AS, Lynch A, Thu M, Chen F, Xie LH, Weiss JN, and Valderrabano M, Spatially discordant alternans in cardiomyocyte monolayers, Am. J. Physiol. Heart Circ. Physiol 294, H1417 (2008). [DOI] [PubMed] [Google Scholar]
- [46].Mironov S, Jalife J, and Tolkacheva EG, Role of conduction velocity restitution and short-term memory in the development of action potential duration alternans in isolated rabbit hearts, Circulation 118, 17 (2008). [DOI] [PMC free article] [PubMed] [Google Scholar]
- [47].Gizzi A, Cherry EM, Gilmour RF Jr., Luther S, Filippi S, and Fenton FH, Effects of pacing site and stimulation history on alternans dynamics and the development of complex spatiotemporal patterns in cardiac tissue, Front Physiol. 4, 71 (2013). [DOI] [PMC free article] [PubMed] [Google Scholar]
- [48].Ziv O, Morales E, Song YK, Peng X, Odening KE, Buxton AE, Karma A, Koren G, and Choi BR, Origin of complex behaviour of spatially discordant alternans in a transgenic rabbit model of type 2 long QT syndrome, J. Physiol 587, 4661 (2009). [DOI] [PMC free article] [PubMed] [Google Scholar]
- [49].Lau E, Kossidas K, Kim TY, Kunitomo Y, Ziv O, Zhen S, Taylor C, Schofield L, Yammine J, Liu G et al. , Spatially discordant alternans and arrhythmias in tachypacing-induced cardiac myopathy in transgenic LQT1 rabbits: The importance of IKs and Ca2+ cycling, PLoS One 10, e0122754 (2015). [DOI] [PMC free article] [PubMed] [Google Scholar]
- [50].Huang C, Song Z, Landaw J, and Qu Z, Spatially discordant repolarization alternans in the absence of conduction velocity restitution, Biophys. J 118, 2574 (2020). [DOI] [PMC free article] [PubMed] [Google Scholar]
- [51].Huang C, Song Z, Di Z, and Qu Z, Stability of spatially discordant repolarization alternans in cardiac tissue, Chaos 30, 123141 (2020). [DOI] [PMC free article] [PubMed] [Google Scholar]
- [52].Pruvot EJ, Katra RP, Rosenbaum DS, and Laurita KR, Role of calcium cycling versus restitution in the mechanism of repolarization alternans, Circ. Res 94, 1083 (2004). [DOI] [PubMed] [Google Scholar]
- [53].Qu Z, Liu MB, Olcese R, Karagueuzian H, Garfinkel A, Chen P-S, and Weiss JN, R-on-T and the initiation of reentry revisited: Integrating old and new concepts, Heart Rhythm 19, 1369 (2022). [DOI] [PMC free article] [PubMed] [Google Scholar]
- [54].Akar FG and Rosenbaum DS, Transmural electrophysiological heterogeneities underlying arrhythmogenesis in heart failure, Circ. Res 93, 638 (2003). [DOI] [PubMed] [Google Scholar]
- [55].Laurita KR and Rosenbaum DS, Interdependence of modulated dispersion and tissue structure in the mechanism of unidirectional block, Circ. Res 87, 922 (2000). [DOI] [PubMed] [Google Scholar]
- [56].Qu Z, Garfinkel A, and Weiss JN, Vulnerable window for conduction block in a one-dimensional cable of cardiac cells, 1: Single extrasystoles, Biophys. J 91, 793 (2006). [DOI] [PMC free article] [PubMed] [Google Scholar]
- [57].Qu Z, Garfinkel A, and Weiss JN, Vulnerable window for conduction block in a one-dimensional cable of cardiac cells, 2: Multiple extrasystoles, Biophys. J 91, 805 (2006). [DOI] [PMC free article] [PubMed] [Google Scholar]
- [58].Sato D, Shiferaw Y, Garfinkel A, Weiss JN, Qu Z, and Karma A, Spatially discordant alternans in cardiac tissue. Role of calcium cycling, Circ. Res 99, 520 (2006). [DOI] [PubMed] [Google Scholar]
- [59].Gaeta SA, Bub G, Abbott GW, and Christini DJ, Dynamical mechanism for subcellular alternans in cardiac myocytes, Circ. Res 105, 335 (2009). [DOI] [PMC free article] [PubMed] [Google Scholar]
- [60].Sato D, Bers DM, and Shiferaw Y, Formation of spatially discordant alternans due to fluctuations and diffusion of calcium, PLoS One 8, e85365 (2014). [DOI] [PMC free article] [PubMed] [Google Scholar]
- [61].Mahajan A, Shiferaw Y, Sato D, Baher A, Olcese R, Xie L-H, Yang M-J, Chen P-S, Restrepo JG, Karma A et al. , A rabbit ventricular action potential model replicating cardiac dynamics at rapid heart rates, Biophys. J 94, 392 (2008). [DOI] [PMC free article] [PubMed] [Google Scholar]
- [62].Boyden PA, Dun W, and Stuyvers BD, What is a Ca2+ wave? Is it like an electrical wave? Arrhythm. Electrophysiol. Rev 4, 35 (2015). [DOI] [PMC free article] [PubMed] [Google Scholar]
- [63].Chua SK, Chang PC, Maruyama M, Turker I, Shinohara T, Shen MJ, Chen Z, Shen C, Rubart-von der Lohe M, Lopshire JC et al. , Small-conductance calcium-activated potassium channel and recurrent ventricular fibrillation in failing rabbit ventricles, Circ. Res 108, 971 (2011). [DOI] [PMC free article] [PubMed] [Google Scholar]
- [64].Zhang X-D, Lieu DK, and Chiamvimonvat N, Small-conductance Ca2+-activated K+ channels and cardiac arrhythmias, Heart Rhythm 12, 1845 (2015) [DOI] [PMC free article] [PubMed] [Google Scholar]
- [65].Shannon TR, Ginsburg KS, and Bers DM, Potentiation of fractional sarcoplasmic reticulum calcium release by total and free intra-sarcoplasmic reticulum calcium concentration, Biophys. J 78, 334 (2000). [DOI] [PMC free article] [PubMed] [Google Scholar]
- [66].Nivala M and Qu Z, Calcium alternans in a couplon network model of ventricular myocytes: Role of sarcoplasmic reticulum load, Am. J. Physiol. Heart Circ. Physiol 303, H341 (2012). [DOI] [PMC free article] [PubMed] [Google Scholar]
- [67].Ramay HR, Liu OZ, and Sobie EA, Recovery of cardiac calcium release is controlled by sarcoplasmic reticulum refilling and ryanodine receptor sensitivity, Cardiovasc. Res 91, 598 (2011). [DOI] [PMC free article] [PubMed] [Google Scholar]
- [68].Sobie EA, Song LS, and Lederer WJ, Restitution of Ca2+ release and vulnerability to arrhythmias, J. Cardiovasc. Electrophysiol 17, S64 (2006). [DOI] [PMC free article] [PubMed] [Google Scholar]
- [69].Cely-Ortiz A, Felice JI, Díaz-Zegarra LA, Valverde CA, Federico M, Palomeque J, Wehrens XHT, Kranias EG, Aiello EA, Lascano EC et al. , Determinants of Ca2+ release restitution: Insights from genetically altered animals and mathematical modeling, J. Gen. Physiol 152, e201912512 (2020). [DOI] [PMC free article] [PubMed] [Google Scholar]
- [70].Echebarria B and Karma A, Amplitude equation approach to spatiotemporal dynamics of cardiac alternans, Phys. Rev. E 76, 051911 (2007). [DOI] [PubMed] [Google Scholar]
- [71].Shiferaw Y and Karma A, Turing instability mediated by voltage and calcium diffusion in paced cardiac cells, Proc. Natl. Acad. Sci. USA 103, 5670 (2006). [DOI] [PMC free article] [PubMed] [Google Scholar]
- [72].Heijman J, Zaza A, Johnson DM, Rudy Y, Peeters RL, Volders PG, and Westra RL, Determinants of beat-to-beat variability of repolarization duration in the canine ventricular myocyte: A computational analysis, PLoS Comput. Biol 9, e1003202 (2013). [DOI] [PMC free article] [PubMed] [Google Scholar]
- [73].Skupin A, Kettenmann H, Winkler U, Wartenberg M, Sauer H, Tovey SC, Taylor CW, and Falcke M, How does intracellular Ca2+ oscillate: By chance or by the clock? Biophys. J 94, 2404 (2008). [DOI] [PMC free article] [PubMed] [Google Scholar]
- [74].Nivala M, Ko C, Garfinkel A, Weiss JN, and Qu Z, Self-organization of pacemaking sites for calcium waves and oscillations in cardiac myocytes, Biophys. J 100, 557a (2011). [Google Scholar]
- [75].Campos FO, Shiferaw Y, Prassl AJ, Boyle PM, Vigmond EJ, and Plank G, Stochastic spontaneous calcium release events trigger premature ventricular complexes by overcoming electrotonic load, Cardiovasc. Res 107, 175 (2015). [DOI] [PMC free article] [PubMed] [Google Scholar]
- [76].Song Z, Qu Z, and Karma A, Stochastic initiation and termination of calcium-mediated triggered activity in cardiac myocytes, Proc. Natl. Acad. Sci. USA 114, E270 (2017). [DOI] [PMC free article] [PubMed] [Google Scholar]
- [77].Colman MA, Arrhythmia mechanisms and spontaneous calcium release: Bi-directional coupling between re-entrant and focal excitation, PLoS Comput. Biol 15, e1007260 (2019). [DOI] [PMC free article] [PubMed] [Google Scholar]
- [78].Nivala M, Ko CY, Nivala M, Weiss JN, and Qu Z, Criticality in intracellular calcium signaling in cardiac myocytes, Biophys. J 102, 2433 (2012) [DOI] [PMC free article] [PubMed] [Google Scholar]
- [79].Risken H, The Fokker-Planck Equation (Springer, Berlin, 1989) [Google Scholar]
- [80].Wang S, Xie Y, and Qu Z, Coupled iterated map models of action potential dynamics in a one-dimensional cable of coupled cardiac cells, New J. Phys 10, 055001 (2007). [DOI] [PMC free article] [PubMed] [Google Scholar]
- [81].Cram AR, Rao HM, and Tolkacheva EG, Toward prediction of the local onset of alternans in the heart, Biophys. J 100, 868 (2011) [DOI] [PMC free article] [PubMed] [Google Scholar]
- [82].Visweswaran R, McIntyre SD, Ramkrishnan K, Zhao X, and Tolkacheva EG, Spatiotemporal evolution and prediction of [Ca2+]i and APD alternans in isolated rabbit hearts, J. Cardiovasc. Electrophysiol 24, 1287 (2013). [DOI] [PubMed] [Google Scholar]
- [83].Qu Z, Liu MB, and Nivala M, A unified theory of calcium alternans in ventricular myocytes, Sci. Rep 6, 35625 (2016). [DOI] [PMC free article] [PubMed] [Google Scholar]
- [84].Landaw J and Qu Z, Memory-induced nonlinear dynamics of excitation in cardiac diseases, Phys. Rev. E 97, 042414 (2018) [DOI] [PMC free article] [PubMed] [Google Scholar]
- [85].Diaz ME, Eisner DA, and O’Neill SC, Depressed ryanodine receptor activity increases variability and duration of the systolic Ca2+ transient in rat ventricular myocytes, Circ. Res 91, 585 (2002). [DOI] [PubMed] [Google Scholar]
- [86].Xie LH and Weiss JN, Arrhythmogenic consequences of intracellular calcium waves, Am. J. Physiol. Heart Circ. Physiol 297, H997 (2009). [DOI] [PMC free article] [PubMed] [Google Scholar]
- [87].Aistrup GL, Shiferaw Y, Kapur S, Kadish AH, and Wasserstrom JA, Mechanisms underlying the formation and dynamics of subcellular calcium alternans in the intact rat heart, Circ. Res 104, 639 (2009). [DOI] [PubMed] [Google Scholar]
- [88].Song Z, Liu MB, and Qu Z, Transverse tubular network structures in the genesis of intracellular calcium alternans and triggered activity in cardiac cells, J. Mol. Cell Cardiol 114, 288 (2018) [DOI] [PMC free article] [PubMed] [Google Scholar]
- [89].Romero L, Alvarez-Lacalle E, and Shiferaw Y, Stochastic coupled map model of subcellular calcium cycling in cardiac cells, Chaos 29, 023125 (2019) [DOI] [PMC free article] [PubMed] [Google Scholar]
- [90].Qu Z, Garfinkel A, Weiss JN, and Nivala M, Multi-scale modeling in biology: How to bridge the gaps between scales? Prog. Biophys. Mol. Biol 107, 21 (2011). [DOI] [PMC free article] [PubMed] [Google Scholar]
- [91].Shiferaw Y, Aistrup GL, and Wasserstrom JA, Synchronization of triggered waves in atrial tissue, Biophys. J 115, 1130 (2018) [DOI] [PMC free article] [PubMed] [Google Scholar]
- [92].Colman MA, Alvarez-Lacalle E, Echebarria B, Sato D, Sutanto H, and Heijman J, Multi-scale computational modeling of spatial calcium handling from nanodomain to whole-heart: Overview and perspectives, Front Physiol 13, 836622 (2022). [DOI] [PMC free article] [PubMed] [Google Scholar]


