Abstract
Adenoid hypertrophy can lead to adenoidal mouth breathing, which can result in “adenoid face” and, in severe cases, can even lead to respiratory tract obstruction. The Fujioka ratio method, which calculates the ratio of adenoid (A) to nasopharyngeal (N) space in an adenoidal-cephalogram (A/N), is a well-recognized and effective technique for detecting adenoid hypertrophy. However, this process is time-consuming and relies on personal experience, so a fully automated and standardized method needs to be designed. Most of the current deep learning-based methods for automatic diagnosis of adenoids are CNN-based methods, which are more sensitive to features similar to adenoids in lateral views and can affect the final localization results. In this study, we designed a local attention-based method for automatic diagnosis of adenoids, which takes AdeBlock as the basic module, fuses the spatial and channel information of adenoids through two-branch local attention computation, and combines the downsampling method without losing spatial information. Our method achieved mean squared error (MSE) 0.0023, mean radial error (MRE) 1.91, and SD (standard deviation) 7.64 on the three hospital datasets, outperforming other comparative methods.
Subject terms: Oral diseases, Head and neck cancer
Introduction
The adenoid located in the posterior cephalogram airway is a conglomerate of lymphatic tissue1, which grows after birth and reaches to the maximum size around the age of 4–6 years2, and shrinks progressively thereafter. Adenoid hypertrophy (AH), a pathological proliferation of adenoids, is the most common cause of upper airway obstruction in children with a prevalence of 42–70% in the pediatric population3. AH often leads to mouth breathing and the clinical presentation known as “adenoid face,” which is characterized by an increased anterior facial height, a narrowed maxillary arch, posterior crossbite, and retrognathic mandible. The etiology and pathogenesis of AH are generally believed to be closely associated with factors such as frequent upper airway infections, allergies, and immune responses.
Currently, cephalogram endoscopy is the gold standard of diagnosing AH. However, the painful examination process and the poor cooperation of many children limit its application in clinical practice. As a simple, economical, and routine examination, the lateral cephalogram is a useful alternative tool with high reliability in detecting AH4,5. According to a recent systematic review, despite a relatively elevated false-positive rate, the lateral cephalogram demonstrates significant diagnostic accuracy (with an area under the receiver operating characteristic curve of 0.86) when it comes to diagnosing AH6.
Among numerous methods for assessing AH on lateral cephalograms, the most notable method is the adenoidal-cephalogram (AN) ratio, proposed by Fujioka in 19797. This measurement is an effective means of assessing the degree of AH and cephalogram obstruction. When assessing children suspected of AH, radiologists need to manually mark relevant points on the lateral cephalograms to measure the AN ratio. Unfortunately, this process is highly time-consuming and labor-intensive. Additionally, the nasopharynx and cranial base structures are relatively complex, and the accurate identification of landmarks largely relies on the radiologist’s experience, leading to significant errors and individual variability in AH assessment. When the number of patients is high compared with the limited number of radiologists, this situation results in an overwhelming workload for radiologists, further impacting the accuracy of A/N ratio measurements. Therefore, there is an urgent need to develop a fully automated assessment method to enhance workflow efficiency and alleviate the workload on radiologists.
Deep learning is an artificial intelligence approach based on deep neural networks8. In recent years, many deep learning-based methods have been applied in the field of medical imaging. Lee et al.9 proposed a fully deep learning mask region-based convolutional neural network method for automated tooth segmentation using individual annotation of panoramic radiographs. Ma et al.10 combined a deep convolutional generative adversarial network with a residual neural network for blood cell image classification. Hu et al.11 proposed a method called swin transformer and attention network that uses the swin transformer network, which employs an attention method to overcome the long-range dependency difficulties encountered in CNNs and RNNs to enhance and restore the quality of medical CT images. However, to date, several studies have applied deep learning-based methods for the automated detection of AH12–14. Bi et al.15 developed a novel multi-scale deep network (MIB-ANet) for automatically grading AH based on nasal endoscopy. He et al.16 proposed an adenoid network (ADNet) to automatically assess AH in MRI images. Their model can capture local and global features near landmarks to achieve accurate landmark localization. However, nasal endoscopy is difficult for children, and MRI is too expensive and not frequently used for diagnosing AH.
Given the lack of interpretation of long-term image correlations in performing segmentation tasks by various CNN-based methods, global features cannot be extracted, whereas transformer-based correlation methods are strongly adapted for extracting long-distance dependencies. In recent years, individual scholars have applied transformer to the adenoid detection task17, but global attention18with square-level complexity will bring considerable resource consumption, and the local attention mechanism can solve this problem well.
In this paper, our main contributions were as follows:
We built a large lateral cephalogram X-ray dataset for the task of automated adenoid detection in children.
Through heat map techniques, we converted the A/N ratio prediction problem into a keypoint detection problem.
We proposed a novel deep learning model AdeNet-based local attention for fully automated detection of AH in children, which achieved good performance in experiments.
Related work
Attention
Vision transformer has achieved a wide range of application results in recent years. The original vision transformer proposed by Dos et al. achieved SOTA in the classification task at that time, which inspired researchers to make the application of vision transformer to medical images possible. Chen et al.19 first proposed TransUNet, which combines on top of U-Net to improve the CNN in terms of long-term modelling dependency, but the direct application of the ViT-16 model leads to a significant increase in computational complexity, accompanied with the risk of overfitting. The small-scale dataset has difficulty in supporting the consumption of transformer pre-training, which can lead to the degradation of model performance.
The method proposed by Liu et al.20 restricts the attention computation to a defined window, which reduces the computational volume of the model, and introduces a sliding window mechanism, which creates an information interaction between the windows and improves the model performance.
Key point detection
Key point detection is a crucial preprocessing step in the clinical workflow. In the field of medical imaging, many researchers have used the powerful feature representation ability of deep learning to solve key point localization tasks. Suzani et al.21 proposed an approach based on deep feedforward neural networks to predict the location of each vertebra using its contextual information in the image. Akyol et al.22 developed a key point algorithm to obtain key point information standing for images. Qorchi et al.23 employed automated detection and key point matching methods to simultaneously evaluate all the parameters of interest discussed individually in the literature. Wu et al.24 proposed a novel convolution neural network for the key point estimation of knee X-rays, which employed Res2Net for feature extraction and aggregation. Li et al.25 designed a 3D convolutional neural network, which input a 3D image and output the coordinates of bifurcation points in this image.
Shen et al.12 proposed a computer-aided method for AH classification by key point localization. Zhao et al.13 used attention residual modules, which can improve the performance of key point detection and reduce the final AN ratio error.
Materials and methods
Ethical permissions
This study was reviewed and approved by the ethics committee at Fujian Children’s Hospital (2024ETKLRK03018). All procedures performed in this study involving human participants were following the ethical standards of the ethics committee at Fujian Children’s Hospital and with the 1964 Declaration of Helsinki and its later amendments. All data are de-identified, the ethics committee of Fujian Children's Hospital approved this study as a retrospective review with a waiver for patient informed consent.
Dataset
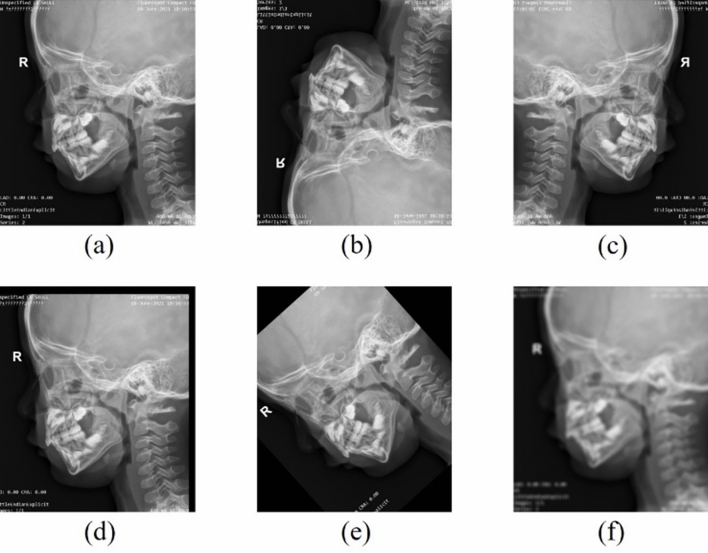
This study is a multicenter investigation. We collected lateral cephalograms from Fujian Children's Hospital (in April to October, 2021), Fujian Maternal and Child Health Hospital (in June to July, 2023), and Shanghai Children's Medical Center (in June, 2023). A total of three X-ray machines (two Healthineers, Siemens, Germany, and one Digital Diagnost, Philips, Germany) were employed to capture the lateral cephalograms following appropriate protocol. Inclusion criteria were as follows: (1) patients positioned correctly; and (2) X-ray images with clear hard palate, adenoids, cranial base, and occipital bone slope. Based on these criteria, 1425 lateral cephalograms were finally included in our dataset. These lateral cephalograms were collected from 1425 children aged 1 to 10 years, with a male-to-female ratio of 3:2. All data were annotated by two radiologists with over 10 years of experience. Among them, 1209 images were randomly selected for training deep learning models, 116 images were randomly chosen for validation, and the remaining 100 images were allocated for testing. To enhance the adaptability of model to various imaging environments, as shown in Fig. 1, we subjected the images in the training set to random flipping, translation, rotation, and the addition of a moderate amount of Gaussian noise, resulting in a sixfold increase in the dataset size compared with the original data.
Figure 1.
Data argumentation of training set. (a) Original image, (b) flipping vertical, (c) flipping horizontal, (d) translation, (e) rotation, and (f) Gaussian noise.
We comprehensively evaluated the performance of our deep learning method for the automated detection of adenoids. Compared with existing studies12,13,16, the dataset used here is much larger, containing more than 1000 samples. The model that we proposed was able to accurately classify lateral cephalograms into those showing normal adenoid or pathological AH without any manual intervention.
All the included lateral cephalograms in this study were converted into JPG format and subjected to anonymization.
Measurement standard
The method used for AH assessment was based on Fujioka’s A/N ratio7. As shown in Fig. 2, four landmarks were marked on the lateral cephalogram, namely, point PNS or the posterior-superior edge of the hard palate, point A’ or the point of maximal convexity along the inferior margin of adenoid shadow, point D’ or the anteroinferior edge of the sphenobasioccipital synchondrosis, and point Ar or the anterior edge point of the occiput (intersection of the inferior cranial base surface and the averaged posterior surfaces of the mandibular condyles). The calculation method involves dividing the adenoid measurement A (the distance from A’ to a line B, drawn along point D’ and Ar) by the cephalograms space N (the distance from point PNS to point D’). The automatic detection task of AH is categorized as a keypoint detection task.
Figure 2.
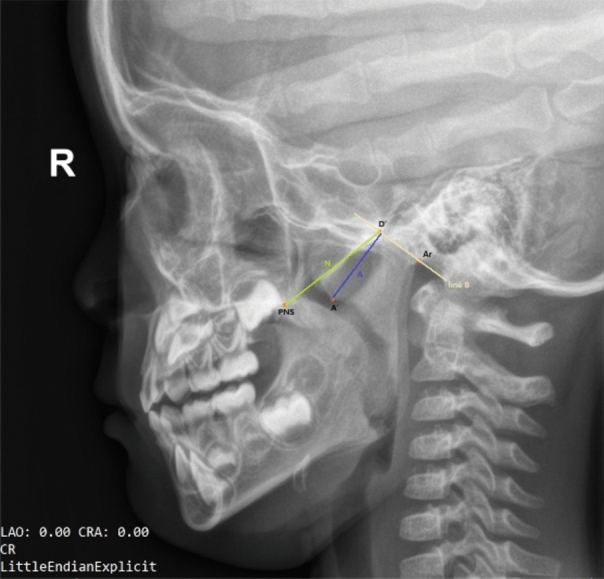
An example of keypoint annotation on a lateral cephalogram.
The diagnostic criterion based on lateral cephalograms for AH is an AN ratio greater than 0.6. The degree of AH was classified and scored as normal (AN ratio ≤ 0.60), moderate hypertrophy (0.60 < AN ratio ≤ 0.71), or severe hypertrophy (AN ratio > 0.71). Following the determination of key points, the AN ratio in the dataset was obtained using an automated measurement method. The A value was calculated as the vertical distance from point A’ to the line connecting points D’ and Ar, and the N value was determined as the linear distance between points PNS and D’.
Main method
AdeNet overall architecture
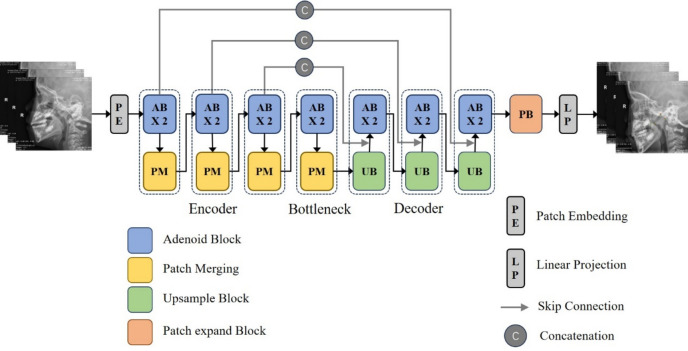
As shown in Fig. 3, AdeNet is a hierarchical network of encoder and decoder with some important feature interaction blocks called attention block. The encoder focuses on the edge features and topology of adenoids, with the aim of obtaining information about the key points of the adenoid. The decoder recovers the deep features from the encoder at the original resolution, cascading them at the same level as the feature map extracted by the encoder to obtain the spatial distribution of the adenoids.
Figure 3.
Architecture of AdeNet.
In light of the diverse scales, distributions, and textures of adenoids within the images, we have devised the attention block to facilitate the perception and integration of adenoids across varying scales. This strategic approach empowers the model with the capability to discern the localization and topological structures of adenoids. Patch merging block serves the dual purpose of transforming raw image information into channel data and reducing resolution, thereby preserving the features of the original image to the utmost extent. Upsample block is the inverse process of patch merging. Patch expand block is the inverse process of patch embedding. Employing a concatenation to link the corresponding layers between the encoder and decoder facilitates the integration of detailed feature information from the encoder to support the decoder in recovering the feature map resolution.
Attention block
The vanilla self-attention mechanism brings long-range dependence to the visual model and helps the neural network obtain a large receptive field, but it suffers from a quadratic computational complexity that limits the applicability to high-resolution images. In lateral cephalograms, adenoids have relatively uniform and monotonic scale and distribution, which do not require much global-level information interaction. However, they also have high demand for the spatial structure of the local region where the key point is located. Therefore, this paper adopted local attention as the feature processing method.
Conventional local attention operates on a single window scale and captures interactions within the window. However, the key points that need to be attended to have significant variations in their distribution due to the diverse size of the head and the shape and size of the adenoids in the lateral cephalograms. This variability cannot be accommodated by a single-scale window attention alone. Inspired by swin transformer and swin-unet, we proposed interaction attention that features multiple scales and encapsulated it into a basic module called AdeBlock.
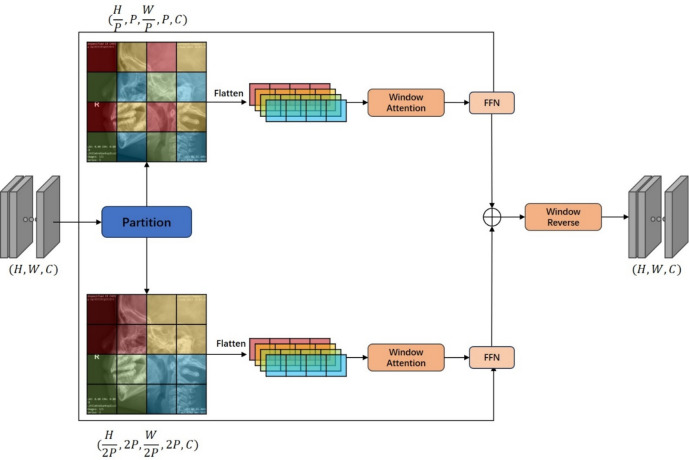
As shown in Fig. 4, we divided feature map X into two series of spatially contiguous patches and and then flattened them along the channel dimension. This step resulted in the generation of two distinct types of tokens: one that accentuates the spatial distribution of adenoid key points within the window, and another that encapsulates the variance in adenoid distribution across different heads. Subsequently, these tokens were promptly subjected to the computation of window attention. Furthermore, the sizing of the window must be meticulously calibrated to align with the dimensions of the patch.
Figure 4.
Attention block. H, W, and C represent the height, width, and number of channels of the input feature map, respectively; P denotes the patch size for calculating attention; FFN refers to a feed-forward neural network with two hidden layers.
Encoder
In the proposed methodology, the input images underwent patch embedding prior to entering the encoder. Patch embedding involves dividing the images into discrete tokens within non-overlapping windows through convolution operations. This split strategy facilitates the subsequent attention calculation. Notably, the convolution kernel size is equal to stride and denoted as 4, as illustrated in Fig. 3.
When the obtained tokens went through the interaction in the AdeBlock’s dual-branch attention, we used patch merging consisting of linear layers to create a new feature map for the next level of AdeBlock. Specifically, the feature map takes pixels spaced along the channel dimension, dividing them into four patches with identical resolutions and then concatenating these patches along the channel dimension. This approach enables downsampling while retaining a maximum number of features, thereby reducing the complexity of image recovery for the decoder and enhancing the efficiency of the image recovery process.
Decoder
The decoder is designed to reconstruct deep, abstract features back to the original resolution. In this process, it preserves the original crucial information and utilizes features extracted by the corresponding level encoder as guidance, aiding in generating outputs that align with the task requirements. In the proposed AdeNet, apart from essential upsampling and skip connections, an AdeBlock, similar to the encoder, is inserted in the middle. The purpose is to enhance the restored image quality of the initial upsampled coarse features through attention-based calculations. Within this structure, the upsample block reverses the patch merging operation in the encoder, and the patch expand block reverses the patch embedding operation. Both are implemented using linear layers, which introduce minimal additional parameters to the network and have no effect on the final prediction accuracy. Finally, linear projection maps the feature maps obtained from the decoder to channels representing the distribution of four key points using a 1×1 convolution.
Experiment
Training details
In this study, we conducted experiments using the PyTorch deep learning framework for training and leveraged the NVIDIA A100 graphics card for GPU acceleration during the training process. In the training phase, the batch size was set to 2, with a total of 500 epochs, and a learning rate of 0.01 was employed. We chose the “cross-entropy” as the loss function.
Data augmentation
To enhance the generalization ability of test models, we employed the following data augmentation (DA) methods (as shown in Table 1) on training dataset.
Table 1.
Details of DA method.
| DA Operation | Parameter |
|---|---|
| Shift | Up/down −50 to 50 |
| Rotation | Counterclockwise −45° to 45° |
| Gaussian noise | Kernel_size 9–31 |
| Horizontal/vertical flip | True |
Evaluation metrics
To verify the performance of different models, we calculated three classical evaluation metrics in our experiments. The definitions of these metrics are as follows:
- Mean squared error (MSE). and are the ground-truth and the predicted AN ratio of sample in the test set, respectively. The MSE of sample is defined as Eq. (1), where n is the total number of samples in the test set.
1 - Mean radial error (MRE). The radial error RE of landmark i in image g is formulated as Eq. (2), where zi = (wi, hi) and ẑi = (ŵi, ĥi) are the annotated landmark and predicted landmark, respectively.
2
The MRE and associated standard deviation (SD) are defined as below, where N is the number of images.
| 3 |
| 4 |
Experiment results
Visualization results of the model
As shown in Fig. 5, the predicted key points by our model were located closely to manually labeled ones. From left to right, the adenoid size of samples were normal, mild hypertrophy, moderate hypertrophy, and pathological hypertrophy. Thus, our model could accurately identify key points for various types of adenoids in children.
Figure 5.
Test dataset image comparison (red points represent detection results, and green points represent ground truth). (a) Normal adenoid size, (b) mild hypertrophy, (c) moderate hypertrophy, and (d) pathological hypertrophy.
Comparison with other models
Table 2 shows the performance of five models on the adenoid detection task, and our model AdeNet achieved better overall performance than the other models. The MSE value predicted by AdeNet was 0.00223, which was 93.59% lower than the second-best value obtained by FCN. The MRE value predicted by AdeNet was 1.91, which was close to the best value obtained by AttUNet, but the SD value predicted by AdeNet was 7.64, which was much lower than those of the other models. Meanwhile, our model exhibited the smallest model size and the lowest computational complexity, suggesting the higher parameter efficiency than other models.
Table 2.
Performance of five different models in adenoid detection.
| Method | MSE | MRE | SD | Params | GFLOPs |
|---|---|---|---|---|---|
| FCN26 | 0.0356 | 2.70 | 12.72 | 134.28 M | 110.78 |
| ResUNet27 | 0.0745 | 2.67 | 20.54 | 13.04 M | 323.98 |
| AttUNet28 | 0.2061 | 1.77 | 21.95 | 34.88 M | 266.58 |
| TransUNet19 | 0.7713 | 2.56 | 37.38 | 149.71 M | 88.32 |
| AdeNet | 0.0023 | 1.91 | 7.64 | 34.98 M | 56.60 |
Optimal values are in bold.
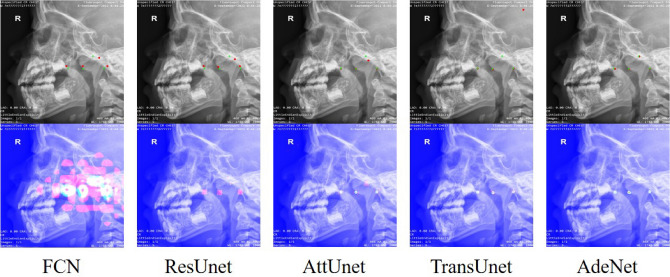
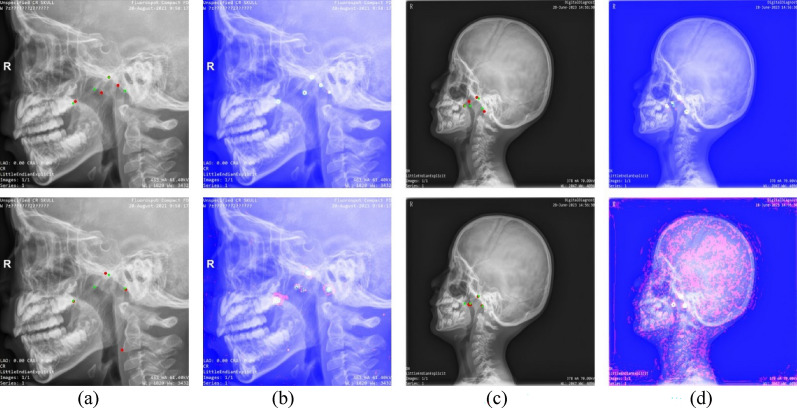
Figure 6 shows the detection and heat map visualization results of different models. The first row shows that the proposed AdeNet could accurately detect the positions of the four key points and learn the relative spatial positions between them. The second row shows that AdeNet could focus on the regions of key points, indicating that our model had better anti-interference ability than the other models.
Figure 6.
Detection and heat map visualization results of different models. The first row is the detection result image containing manually labeled points denoted by green and predicted key points denoted by red. The second row is the visualized heat map, where the pink area indicates the regions of interest.
Table 2 shows that AdeNet did not perform as well as AttUnet on MRE, but other metrics and visualization results were better. This phenomenon is illustrated in Fig. 7. The heat maps in Figs. 7b, d demonstrated that AttUnet failed to only focus on the region of interest around the key points and adenoids. This result was mainly due to the fact that AttUnet is still a purely convolutional network, lacking the ability to capture long-range dependency and unable to effectively model the positional relationships between key points. On the contrary, AdeNet reduces the influence of interference regions through attention computation and multi-scale feature extraction so that its region of interest surrounds the key points.
Figure 7.
Comparison of AdeNet and AttUNet results on two samples with heat maps. The first row shows the results and heat maps for AdeNet, and the second row shows the results and heat maps for AttUNet. (a,b) Represent the different prediction results and heat maps for the A sample. (c,d) Represent the different prediction results and heat maps for the B sample.
Ablation study
On the basis of AdeNet, we conducted ablation experiments involving DA and multi-scale local attention interaction (INTER). The experimental results are presented in Table 3. DA significantly improved the performance of AdeNet on all metrics. DA increased the number of available samples for model learning, enhancing the model ability to better detect key points in different imaging environments. By contrast, the use of INTER only decreased the value of AdeNet on SD. However, the joint use of DA and INTER outperformed DA alone. This phenomenon suggested that the use of INTER could help the model adapt to the diversity of samples.
Table 3.
Ablation study of data augmentation and attention interaction. DA: Data augmentation is applied in AdeNet; INTER: multi-scale local attention interaction is applied in AdeNet.
| Method | MSE | MRE | SD |
|---|---|---|---|
| AdeNet | 0.1946 | 2.01 | 14.32 |
| AdeNet (da) | 0.0091 | 1.88 | 8.06 |
| AdeNet (inter) | 0.4544 | 2.14 | 10.86 |
| AdeNet (da, inter) | 0.0023 | 1.91 | 7.64 |
Optimal values are in bold.
Discussion
The models selected for comparison were chosen based on their architectural types and operator principles. FCN26 is a classical UNet that was initially utilized for segmentation, ResUNet27 integrates UNet with residual architectures, AttUNet28 incorporates attention into UNet, and TransUNet19 is a hybrid neural network containing convolution and self-attention.
FCN model achieves a low SD but has the highest value of MRE. The larger red region of interest generated by FCN indicates that its anti-interference ability is relatively weak, and the extraction of key features is not precise enough. The heat map analysis of ResUNet indicates that the use of residual blocks can enhance the anti-interference capabilities of FCN. However, this improvement does not significantly benefit the overall performance in the final evaluation metrics. AttUNet achieves the best MRE result, but its MSE and SD values are much higher than those of AdeNet. This phenomenon suggests that AttUNet is still inaccurate in keypoint localization. TransUNet utilizes global attention to extract keypoint features, which facilitates capturing long-range dependencies between keypoints29. However, we notice that the majority of the content within the image is irrelevant information for the keypoints. Therefore, the application of global attention not only results in a waste of computational resources but also poses a challenge in discerning irrelevant features30. AdeNet learns the spatial structure of keypoints in a local region through local attention, assigns lower weights to windows containing a large amount of irrelevant information, and enhances the importance of windows containing keypoints31. As a result, our method reduces redundant calculations and improves the model's ability to resist interference. Furthermore, AdeNet employs multi-scale local attention interaction (INTER) to adapt to feature changes occurring at various scales.
In our ablation study, we observe that while INTER significantly enhances the stability of the model, it leads to a slight decrease in localization performance. We speculate that this could be attributed to the repetitive computation introduced by INTER, which complicates the feature fusion process.
Conclusion
In this paper, we proposed a novel deep learning model AdeNet for fully automated detection of AH in children’s lateral cephalogram X-rays. AdeNet is a hierarchical U-shaped neural network based on the composition of multi-scale local attention interaction module. On the one hand, the module learns the spatial structure of key points in a local region through local attention. On the other hand, it helps the model adapt to feature changes at different scales through multi-scale interaction. In addition, we employed DA on the training method to increase the number of available samples for model learning and enhance the model’s generalization. We evaluated the proposed method with other models on a dataset of children’s lateral cephalogram X-rays, and the results showed that the overall performance of AdeNet outperformed the others. The results of the ablation experiments showed that the joint use of DA and INTER was more effective than using only a single method. In the future, we will combine some advanced techniques with this method to further develop the medical image key point detection technology.
Author contributions
Yanying Rao designed and performed the study, collected and labeled the data, and contributed to writing the manuscript. Xiaowei Wang analyzed the data, prepared the figures, and wrote the manuscript. Wenjing Ma analyzed the data and contributed to writing the manuscript. Qiuyun Zhang contributed to collecting the data and writing the manuscript. Xiaoling Xue contributed to collecting and labeling the data. Shuli Xing designed the deep learning network and revised the manuscript critically. All co-authors edited and approved the manuscript.
Funding
This work was supported by the Joint Funds for the innovation of science and Technology, Fujian province (Grant number: 2023Y9387), the Startup Fund for scientific research, Fujian Medical University (Grant Number: 2020QH1214), and the Fujian Children’s Hospital Development Project (Grant Number: YP202410).
Data availability
The datasets analyzed during the current study are not publicly available due to privacy restrictions but are available from the corresponding author on reasonable request.
Code availability
The datasets analyzed during the current study are not publicly available due to privacy restrictions but are available from the corresponding author on reasonable request.
Competing interests
The authors declare no competing interests.
Footnotes
Publisher's note
Springer Nature remains neutral with regard to jurisdictional claims in published maps and institutional affiliations.
These authors contributed equally: Yanying Rao and Qiuyun Zhang.
References
- 1.Major, M. P., Flores-Mir, C. & Major, P. W. Assessment of lateral cephalometric diagnosis of adenoid hypertrophy and posterior upper airway obstruction: A systematic review. Am. J. Orthodont. Dentofac. Orthoped.130, 700–708 (2006). 10.1016/j.ajodo.2005.05.050 [DOI] [PubMed] [Google Scholar]
- 2.Pruzansky, S. Roentgencephalometric studies of tonsils and adenoids in normal and pathologic states. J. Ann. Otol. Rhinol. Laryngol.84(2Pt2 Suppl 19), 55–62 (1975). 10.1177/00034894750840S213 [DOI] [PubMed] [Google Scholar]
- 3.Pereira, L. et al. Prevalence of adenoid hypertrophy: A systematic review and meta-analysis. J. Sleep Med. Rev.38, 101–112 (2018). 10.1016/j.smrv.2017.06.001 [DOI] [PubMed] [Google Scholar]
- 4.Liuba, S. et al. Lateral neck radiography in preoperative evaluation of adenoid hypertrophy. J. Ann. Otol., Rhinol. Laryngol. 129(5), 482–488 (2020). [DOI] [PubMed]
- 5.Moideen, S. P., Mytheenkunju, R., Nair, A. G., Mogarnad, M. & Afroze, M. K. H. Role of adenoid-cephalograms ratio in assessing adenoid hypertrophy. Indian J. Otolaryngol. Head Neck Surg.71, 469–473 (2019). 10.1007/s12070-018-1359-7 [DOI] [PMC free article] [PubMed] [Google Scholar]
- 6.Kunz, F., Stellzig-Eisenhauer, A., Zeman, F., & Boldt, J. Artificial intelligence in orthodontics: Evaluation of a fully automated cephalometric analysis using a customized convolutional neural network. J. Journal of Orofacial Orthopedics / Fortschritte der Kieferorthopädie. 81(1), 52–68 (2020). [DOI] [PubMed]
- 7.Fujioka, M., Young, L. & Girdany, B. Radiographic evaluation of adenoidal size in children: Adenoidal-cephalograms ratio. J. Am. J. Roentgenol.133(3), 401–404 (1979). 10.2214/ajr.133.3.401 [DOI] [PubMed] [Google Scholar]
- 8.LeCun, Y., Bengio, Y. & Hinton, G. Deep learning. Nature521(7553), 436–444 (2015). 10.1038/nature14539 [DOI] [PubMed] [Google Scholar]
- 9.Lee, J. H., Han, S. S., Kim, Y. H., Lee, C. & Kim, I. Application of a fully deep convolutional neural network to the automation of tooth segmentation on panoramic radiographs. J. Oral Surg. Oral Med. Oral Pathol. Oral Radiol. 129(6), 635–642 (2020). [DOI] [PubMed]
- 10.Ma, L., Shuai, R., Ran, X., Liu, W. & Ye, C. Combining DC-GAN with ResNet for blood cell image classification. J. Med. Biol. Eng. Comput. 58(6), 1251–1264 (2020). [DOI] [PubMed]
- 11.Hu, J. et al. Super-resolution swin transformer and attention network for medical CT imaging. J. BioMed. Res. Int.2022, 1–8 (2022). [DOI] [PMC free article] [PubMed] [Google Scholar]
- 12.Shen, Y. et al. A deep-learning-based approach for adenoid hypertrophy diagnosis. J. Med. Phys.47(5), 2171–2181 (2020). 10.1002/mp.14063 [DOI] [PubMed] [Google Scholar]
- 13.Zhao, T. et al. Automated adenoid hypertrophy assessment with lateral cephalometry in children based on artificial intelligence. J. Diagn.11(8), 1386 (2021). [DOI] [PMC free article] [PubMed] [Google Scholar]
- 14.Liu, J. L. et al. Automated radiographic evaluation of adenoid hypertrophy based on VGG-lite. J. Dent. Res.100(12), 1337–1343 (2021). 10.1177/00220345211009474 [DOI] [PubMed] [Google Scholar]
- 15.Bi, M. et al. MIB-ANet: A novel multi-scale deep network for nasal endoscopy-based adenoid hypertrophy grading. J. Front. Med.10, 1142261 (2023). 10.3389/fmed.2023.1142261 [DOI] [PMC free article] [PubMed] [Google Scholar]
- 16.He, Z. et al. An automatic assessment model of adenoid hypertrophy in MRI images based on deep convolutional neural networks. J. IEEE Access (2023).
- 17.Dong, W., Chen, Y., Li, A., Mei, X. & Yang, Y. Automatic detection of adenoid hypertrophy on cone-beam computed tomography based on deep learning. Am. J. Orthod. Dentofac. Orthop.163(4), 553–560 (2023). 10.1016/j.ajodo.2022.11.011 [DOI] [PubMed] [Google Scholar]
- 18.Dosovitskiy, A. et al. An image is worth 16 × 16 words: Transformers for image recognition at scale. Preprint10.48550/arXiv.2010.11929 (2021).
- 19.Chen, J. et al. TransUNet: Transformers Make Strong Encoders for Medical Image Segmentation. Preprint10.48550/arXiv.2102.04306 (2021).
- 20.Liu, Z. et al. Swin transformer: Hierarchical vision transformer using shifted windows. In NationalIEEE/CVF International Conference on Computer Vision (ICCV). Vol. 2021. 9992–10002. 10.1109/ICCV48922.2021.00986 (2021).
- 21.Suzani, A. et al. Fast automatic vertebrae detection and localization in pathological CT scans—A deep learning approach. Med. Image Comput. Comput. Assist. Intervent. 9351, 678–686 (2015).
- 22.Akyol, K., Şen, B. & Bayır, Ş. Automatic detection of optic disc in retinal image by using keypoint detection, texture analysis, and visual dictionary techniques. J. Comput. Math. Methods Med. 2016, 1–10 (2016). [DOI] [PMC free article] [PubMed]
- 23.Qorchi, S., Vray, D. & Orkisz, M. Estimating arterial wall deformations from automatic key-point detection and matching. J. Ultrasound Med. Biol.47(5), 1367–1376 (2021). 10.1016/j.ultrasmedbio.2021.01.001 [DOI] [PubMed] [Google Scholar]
- 24.Wu, Z. et al. Key-point estimation of knee X-ray images using a parallel fusion decoding network. J. Knee40, 256–269 (2023). 10.1016/j.knee.2022.11.026 [DOI] [PubMed] [Google Scholar]
- 25.Li, Y. et al. VBNet: An end-to-end 3D neural network for vessel bifurcation point detection in mesoscopic brain images. J. Comput. Methods Prog. Biomed.214, 106567 (2022). 10.1016/j.cmpb.2021.106567 [DOI] [PubMed] [Google Scholar]
- 26.Shelhamer, E., Long, J. & Darrell, T. Fully convolutional networks for semantic segmentation. J. IEEE Trans. Pattern Anal. Mach. Intell. 39(4), 640–651 (2017). [DOI] [PubMed]
- 27.Diakogiannis, F. I., Waldner, F., Caccetta, P. & Wu, C. ResUNet-a: A deep learning framework for semantic segmentation of remotely sensed data. ISPRS J. Photogramm. Remote Sens. 162, 94–114 (2020).
- 28.Oktay, O., Schlemper, J., Folgoc, L. L. et al. Attention U-Net: Learning where to look for the pancreas. arXiv preprintarXiv:1804.03999 (2018).
- 29.Yang, S., Quan, Z., Nie, M. et al. Transpose: Keypoint localization via transformer. In Proceedings of the IEEE/CVF International Conference on Computer Vision. 11802–11812 (2021).
- 30.Han, K. et al. A survey on vision transformer. IEEE Trans. Pattern Anal. Mach. Intell.45(1), 87–110 (2022). 10.1109/TPAMI.2022.3152247 [DOI] [PubMed] [Google Scholar]
- 31.Zhao, Z., Liu, Q. & Wang, S. Learning deep global multi-scale and local attention features for facial expression recognition in the wild. IEEE Trans. Image Process.30, 6544–6556 (2021). 10.1109/TIP.2021.3093397 [DOI] [PubMed] [Google Scholar]
Associated Data
This section collects any data citations, data availability statements, or supplementary materials included in this article.
Data Availability Statement
The datasets analyzed during the current study are not publicly available due to privacy restrictions but are available from the corresponding author on reasonable request.
The datasets analyzed during the current study are not publicly available due to privacy restrictions but are available from the corresponding author on reasonable request.


