Abstract
Since the 20th century, global climate has been recognized as the most important environmental factor affecting the distribution of plants. Angelica dahurica (A. dahurica) has been in great demand as a medicinal herb and flavoring, but the lack of seed sources has hindered its development. In this study, we utilized the Maxent model combined with Geographic Information System (GIS) to predict the potential habitat of A. dahurica in China based on its geographical distribution and 22 environmental factors. This prediction will serve as a valuable reference for the utilization and conservation of A. dahurica resources.The results indicated that: (1) the Maxent model exhibited high accuracy in predicting the potential habitat area of A. dahurica, with a mean value of the area under the ROC curve (AUC) at 0.879 and a TSS value above 0.6; (2) The five environmental variables with significant effects were bio6 (Min temperature of the coldest month), bio12 (Annual Precipitation), bio17 (Precipitation of Driest Quarter), elevation, and slope, contributing to a cumulative total of 89.6%. Suitable habitats for A. dahurica were identified in provinces such as Yunnan, Guizhou, Guangxi, Sichuan, Hunan, and others. The total area of suitable habitat was projected to increase, with expansion primarily in middle and high latitudes, while areas of decrease were concentrated in lower latitudes. Under future climate change scenarios, the centers of mass of suitable areas for A. dahurica were predicted to shift towards higher latitudes in the 2050s and 2090s, particularly towards the North China Plain and Northeast Plain. Overall, it holds great significance to utilize the Maxent model to predict the development and utilization of A. dahurica germplasm resources in the context of climate change.
Keywords: Angelica dahurica, MaxEnt model, climate factors, habitat prediction, climate change
1. Introduction
Historical observations show that the global average temperature of land and sea increased by 0.78° from 1850 to 2012 (Xue et al., 2023; Shen and Wang, 2013). Since the 20th century, the global climate has shown a major trend of warming, and climate is considered to be the most important environmental factor affecting plant distribution. In the future, without significant reductions in greenhouse gas emissions, global surface temperature will increase by at least 2.1° by 2100 (Ma et al., 2022). Climate change is a serious problem at the global level, affecting entire organisms, including plants. Atmospheric concentrations of carbon dioxide and average temperatures have been rising over the past few decades, and this trend is expected to become more severe in the near future. In addition, environmental stresses such as drought, salinity, ultraviolet radiation, and exposure to heavy metals and toxic elements pose a threat to ecosystems and agriculture. Climate and environmental changes negatively affect plant growth, biomass and yields, and also increase plant susceptibility to pests and diseases (Bokor et al., 2021). Anthropogenic climate change leads to declines in ocean productivity, changes in food web dynamics and fewer habitat-forming species, resulting in changes in species diversity and ranges (Priya et al., 2023). The biodiversity of species is a fundamental component of nature and an important asset shared by all humankind. It not only has great economic value and provides a source of food for mankind; at the same time, species diversity is a valuable repository of genetic resources and provides a source of genes needed by mankind. In the context of climate change, it is therefore necessary to predict the impact of climate change on the potential geographic distribution patterns of plants. In the context of climate change, the potential distribution areas of plants will be changed accordingly, so it is necessary to predict the impact of climate change on the potential geographic distribution pattern of plants.
Species Distribution Models (SDMs) are mathematical models that predict the distribution of suitable habitats for a species by analyzing its distribution data and associated environmental factors. These models assess the survival needs of the species by considering the environmental information gathered from the species' distribution points, and then projecting this data onto a selected study area (Juan and Ni, 2006; Anderson, 2013; Guo et al., 2020; OuYang et al., 2022). As an important research method in biogeography and macroecology, the species distribution model plays an important role in the field of life sciences and environmental sciences. Among the many species distribution models, the Maximum Entropy model (MaxEnt) stands out due to its advantages of lower data requirements, higher prediction accuracy, and ease of use (Fu et al., 2016; Ma and Li, 2023). Species distribution models began with the BioCliM model, followed by generalized linear, additive, and MaxEnt models (Fu et al., 2016). MaxEnt model is a quantitative analysis tool with more applications in the prediction (Ma et al., 2010) of species distribution, species adaptive area, etc (Elith et al., 2006). It is used to predict the probability distribution of the target by calculating the probability distribution of maximum entropy, which is currently used to predict the distribution of the more ideal model. With the development of conservation biology, ecology and other disciplines, the MaxEnt model has been applied more to different species, different periods, and different needs of the situation (Ma et al., 2010; Zhang and Yang, 2018).
Angelica dahurica (A. dahurica), once a symbol of Chinese civilization, is a commonly used Chinese medicine with a long history and a wide range of applications. It was first published in Shennong Ben Cao Jing (Classic of the Divine Husbandman's Materia Medica), classified as a middle grade, and is also known as Sichuan A. dahurica and Walking Horse Celery, among other names (Wang et al., 2017; Zhang and Yang, 2018; Zou et al., 2023). As a member of the umbelliferae genus, A. dahurica is incredibly adaptable and thrives in warm and humid climates. It prefers to be planted in deep, loose, and fertile sandy loam soil (Wang et al., 2017; Ji et al., 2020). This herb is distributed in the northeast of China's mainland, North China, and other regions, typically growing at altitudes of 200 to 1500 meters above sea level. Depending on the region of origin, A. dahurica can be categorized as A. dahurica Chuan, A. dahurica Hang, A. dahurica Yu, A. dahurica Qi, A. dahurica Chongqing, A. dahurica Xiang, A. dahurica Taiwan, A. dahurica Xing'an, and so on. Currently, A. dahurica is used medicinally in four major medicinal varieties: A. dahurica Chuan, A. dahurica Hang, A. dahurica Yu, and A. dahurica Qi (Elith et al., 2006). The main medicinal components in A. dahurica herb are coumarins, including epoprostenol, epoprostenol, and oxidized prostenol (Li, 2012). It has long been used as an herbal medicine for the treatment of colds, fever-induced headaches, and pain caused by wounds (Chen and Yang, 2018). Additionally, it has a wide range of uses in food, nutraceuticals, specices, and cosmetology (Wang et al., 2020; Yang et al., 2020).
There have been many studies on the chemical composition and pharmacological effects of A. dahurica (Zhang et al., 2017; Li et al., 2019; Tang et al., 2021; Liu et al., 2022; Xie et al., 2022; Wang et al., 2023; Zhou et al., 2023), but reports on its distribution, the prediction and change of its habitable zone under future climate change have not yet been seen. Therefore, in order to scientifically elucidate the distribution of A. dahurica and its response to future climate change, this study used the optimized MaxEnt model and ArcGIS software to simulate and predict the potential distribution of the current (1970-2020), the future 2050s (2041-2060) and 2090s (2081-2100), and synthesize the contribution rate of the environmental factor variables and the replacement of the important values. Jackknife test was used to determine the appropriate intervals for the environmental factor variables, and to quantify the potential geographic distribution area and area of A. dahurica under threat in the future. This study aimed to: (i) predict the distribution pattern of potentially suitable areas for A. dahurica under current climatic conditions and classify them into different suitability classes; (ii) analyze the relationship between A. dahurica and the area of distribution in relation to main environmental factors; and (iii) predict the trend of variation in the centroid of A. dahurica within its habitat under future climate scenarios in China.
2. Materials and methods
2.1. Species distribution data of A. dahurica
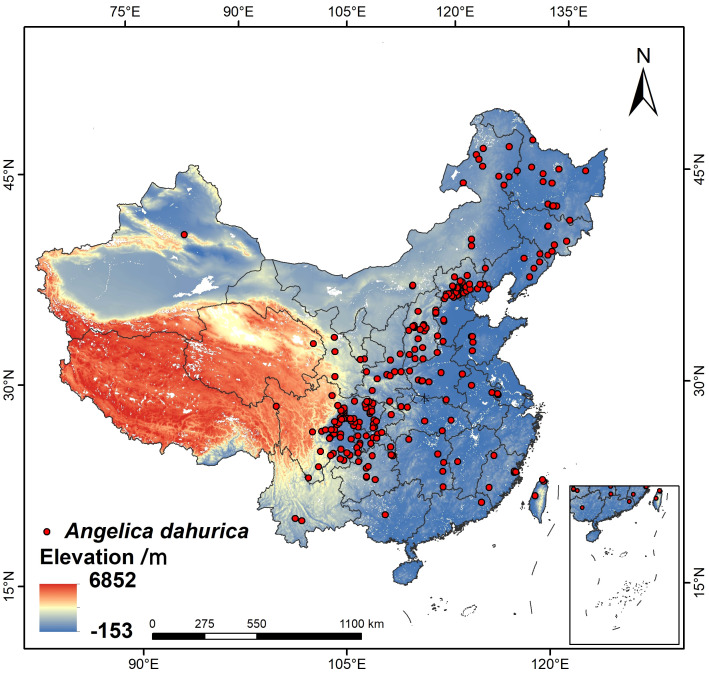
The distribution data of A. dahurica in this study were obtained from the Global Biodiversity Information Facility (GBIF), the Chinese Virtual Herbarium (CVH). Only distribution data with clear latitude and longitude coordinates were retained in the data collection process, and a total of 530 distribution points were collected. After deleting the duplicated and erroneous sample points, 234 distribution record points were finally obtained, and the effective distribution locations were shown in Figure 1 .
Figure 1.
Distribution location of A. dahurica sampling sites.
2.2. Sources and processing of environmental data
The environmental data used in this study came from the Worldclim version 2.1 (http://www.worldclim.org) environmental database, and the main environmental factors selected to affect the distribution of A. dahurica included 19 bioclimatic variables (bioclim) current (1970-2000), 2050s (2041-2060), and 2090s (2081-2100) as detailed in Table 1 . Fourteen soil factors (percent gravel volume, percent gravel, percent chalk, percent clayey grains, soil texture type, soil density, percent organic carbon, pH, cation exchange of clayey constituents, cation exchange, salt base saturation, sum of exchangeable salt bases, percent exchangeable sodium salts, and electrical conductivity) were used in the 0-30 cm surface soil layer. Soil factor and topographic factor data were obtained from the Food and Agriculture Organization of the United Nations (FAO) World Soil Database (HWSD) (http://www.fao.org/faostat/en/#data). Map data were obtained from the Ministry of Natural Resources (http://www.mnr.gov.cn/), and all layer data was converted to GCS-WGS-1984 projection format. The obtained data were then masked to obtain Chinese data using the Chinese map in ArcGIS 10.4 software. Finally, all environmental data were converted to *.asc format. All environmental variables were processed through a series of treatments, and the spatial resolution of each factor was set to 2.5min (about 5 km). Three scenarios (SSP126, SSP245, and SSP585) from the BCC_CSM Future Climate System Scenarios Model (FCSM) were applied in this study, which represents the low, medium, and high GHG emission scenarios, respectively. Since excessive covariance between environmental variables can cause overfitting of the model and lead to a reduction in the transferability of the model, the study screened the variables based on Pearson’s correlation coefficient and variance inflation factor (VIF) to reduce the covariance between the variables. In this study, the R language correlation program package was utilized to identify factors with a correlation below 0.8 (Dormann et al., 2013; Merow et al., 2013). Subsequently, factors with a VIF value less than 10 were chosen. The R language correlation code was then employed to conduct a Pearson correlation test, retaining factors with a correlation coefficient below 0.8. Additionally, for factors with a correlation coefficient exceeding 0.8, only those with greater ecological significance were retained (Wang et al., 2019). A VIF value between 10 and 100 indicates multicollinearity among factors, while a VIF above 100 signifies serious interfactor multicollinearity.
Table 1.
19 environmental factor used in MaxEnt modeling.
| Variable code | Environmental factor |
|---|---|
| Bio1 | Annual Mean Temperature (°) |
| Bio2 | Mean Diurnal Range (°) |
| Bio3 | Isothermality (Bio2/Bio7) (×100) |
| Bio4 | Temperature seasonality (standard deviation×100) |
| Bio5 | Max Temperature of Warmest Month (°) |
| Bio6 | Min Temperature of Coldest Month (°) |
| Bio7 | Temperature Annual Range (Bio5-Bio6) (°) |
| Bio8 | Mean Temperature of Wettest Quarter (°) |
| Bio9 | Mean Temperature of Driest Quarter (°) |
| Bio10 | Mean Temperature of Warmest Quarter (°) |
| Bio11 | Mean Temperature of Coldest Quarter (°) |
| Bio12 | Annual Precipitation (mm) |
| Bio13 | Precipitation of Wettest Month (mm) |
| Bio14 | Precipitation of Driest Month (mm) |
| Bio15 | Precipitation Seasonality (mm) |
| Bio16 | Precipitation of Wettest Quarter (mm) |
| Bio17 | Precipitation of Driest Quarter (mm) |
| Bio18 | Precipitation of Warmest Quarter (mm) |
| Bio19 | Precipitation of Coldest Quarter (mm) |
Six climatic factors (Annual Mean Temperature, Max Temperature of Warmest Month, Min Temperature of Coldest Month, Annual Precipitationl, Precipitation of Driest Month, Precipitation of Wettest Quarter), one topographic factor (elevation), and eleven soil factors (percentage of gravel by volume of surface soil, percentage of chalk, percentage of clayey grains, percentage of organic carbon, pH, cation exchange, saturation of the salt base, sum of exchanged salts, percentage of exchanged sodium salts, electrical conductivity, and cation exchange for clayey grains constituents), totaling eighteen environmental factors, were ultimately selected.
2.3. Species distribution modeling
The study used MaxEnt software for model construction. The organized species point information of A. dahurica was saved in CSV data format and imported into the software together with environmental variables, and then the output type was set as Logistic, 25% of the species distribution data was selected as the test set, 75% as the training data set, and all other parameters were default values. The model factor contributions were analyzed using the Jackknife measure (Pearson et al., 2006), and then analyzed by the ROC curve. The horizontal and vertical coordinates of the ROC curve represent, respectively, the rate of actual absence but predicted presence and the rate of actual presence and predicted presence, and the area enclosed by them is called the AUC. Its magnitude is used as a measure of the accuracy of the model prediction. The AUC takes values ranging from 0 to 1, with larger values indicating better prediction results, 0.9 to 1.0 indicates very good results, 0.8 to 0.9 indicates good results, 0.7 to 0.8 indicates fair results, 0.6 to 0.7 indicates poor results and 0.5 to 0.6 indicates failure of the results. Ture skill statistic (TSS) was also used to assess the net predictive success of the model and the accuracy of the model predictions.
2.4. Optimization of the model
In order to avoid the overfitting phenomenon, the study selects the optimal parameters by testing the AIC information criterion correction (OuYang, et al.) of Maxnent’s model with different feature combinations (FC) and regularization multiplier (RM) conditions. Referring to Robert Muscarella’s latest optimization method, the Checkerboard2 method was used to divide the study area into 4 bins, a masked geostructuring method that better adjusts the level of model regularization. The MaxEnt model regularization level contains 2 parameters, modulation multiplicity (RM) and feature combination (FC), which are optimized by calling the ENMeval (Muscarella et al., 2014) packet in R. The MaxEnt model provides five types of features, namely linear features (L), quadratic features (Q), fragmentation features (H), product features (P) and thresholding features (T).In this study, the default parameters of MaxEnt software are RM=1, FC=LQHPT; in order to optimize the MaxEnt model, RM is set to 0.5-4, increasing by 0.5 each time, for a total of 8 modulation octaves, while 6 combinations containing 1 or more features are used:L; LQ; H; LQH; LQHP; LQHPT; and 48 kinds of calculations are made based on the permutation and combination of parameter combinations. The ENMeval data package examines the 48 parameter combinations mentioned above to test the complexity of the model based on the delta. The AICc value and the 10% test omission rate are both indicators of the accuracy of model predictions. The lower these values are, the more accurate the model predictions will be.
2.5. Data processing
ArcGis10.4 software was used to process the division and visualization of the suitability of A. dahurica. Based on the suitability threshold of A. dahurica predicted by the MaxEnt model, the habitat suitability index of A. dahurica was classified using the natural breakpoint method. The habitat suitability of A. dahurica was categorized into unsuitable area (0∼0.1), low suitable area (0.1∼0.29), middle suitable area (0.29∼0.5), and high suitable area (0.5∼1). We compared the differences in the suitable zones of A. dahurica in different periods, so as to obtain the spatial distribution pattern of A. dahurica under future climate change scenarios. Using the SDMTool data package in R, the center of mass positions of the fitness zone domains of A. dahurica were calculated for the current and the future three climate scenarios, and the range shift direction of the spatial distribution of the fitness zone of A. dahurica was reflected by the change of the center of mass positions; the center-of-mass range shift distances of A. dahurica under different climate scenarios were counted using the geosphere (https://cran.r-project.org/package=geosphere) data package in R language.
3. Results and analysis
3.1. Model optimization and accuracy evaluation
Based on 234 A. dahurica distribution points and 18 environmental variables layers, and the AICc information criterion, the potential distribution area of A. dahurica was simulated and predicted using the MaxEnt model. With MaxEnt default parameter settings, the RM=1, the FC=LQHPT, and the delta.AICc=8.09353. We optimized the model to obtain results when delta.AICc = 0, RM = 1.5 and FC = LQHPT, when the model is optimal and the 10% training omission value is lower than that of the model with default parameters ( Table 2 ). For this reason, the modulation multiplier RM=1.5 and FC=LQHPT were selected as the final parameters of the model, and the AUC value of the simulated training under this parameter was 0.879 ( Figure 2 ), which indicates that the prediction results were accurate. The TSS value was 0.62. Therefore, these assessment methods showed that the accuracy of using the model to predict the distribution of potentially suitable habitats for A. dahurica was relatively high.
Table 2.
Evaluation results of MaxEnt model with different parameter settings.
| Model evaluation | Feature combination | Regularization multiplier | Value of delta akaike information criterion corrected | 10% training omissiion rate |
|---|---|---|---|---|
| Default | LQHPT | 1 | 8.09 | 0.17161 |
| Optimized | LQHPT | 1.5 | 0 | 0.15875 |
Figure 2.
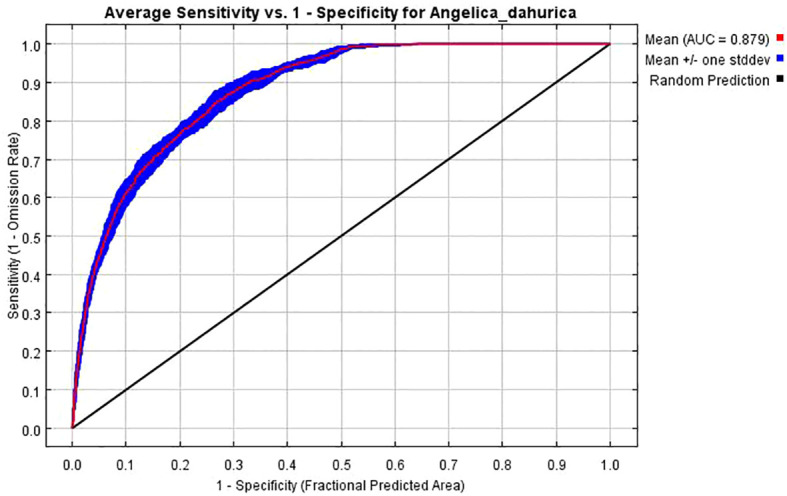
Certification of ROC curve of MaxEnt model on the prediction result of A. dahurica.
3.2. Potential geographic distribution of A. dahurica in China in the current period
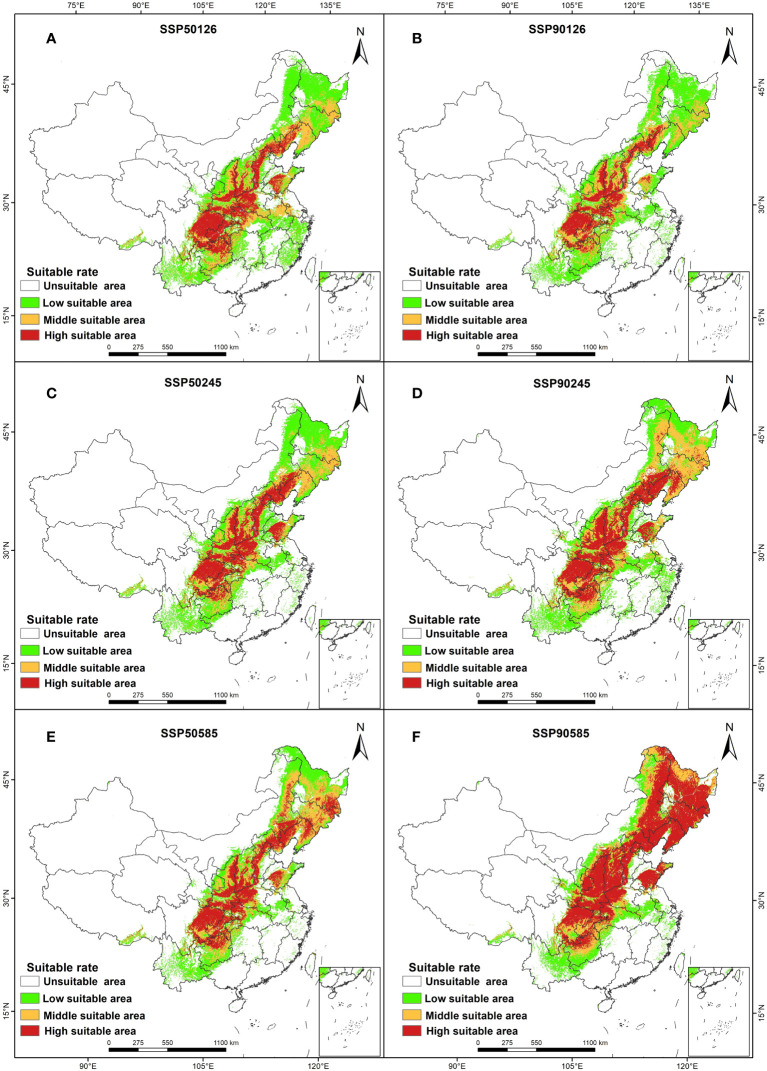
The Maxent model was used to simulate the distribution map of suitable areas for A. dahurica in the current period ( Figure 3 ). The high suitable area and middle suitable area of A. dahurica in the current period were 16,159 km2 and 24,849 km2, respectively. These areas were mainly located in Yunnan, Guangxi, Guizhou, Hunan, Sichuan, Chongqing, Henan, Hubei, Gansu, Shanxi, Shaanxi, Hebei, Liaoning, Jilin, Heilongjiang, and other regions. The high suitable areas were concentrated in eastern and southeastern Sichuan, Chongqing, central Shaanxi, southwestern Shanxi, central Hebei, and Liaoning. Additionally, there were small areas of optimal habitat in Shandong and Guizhou.
Figure 3.
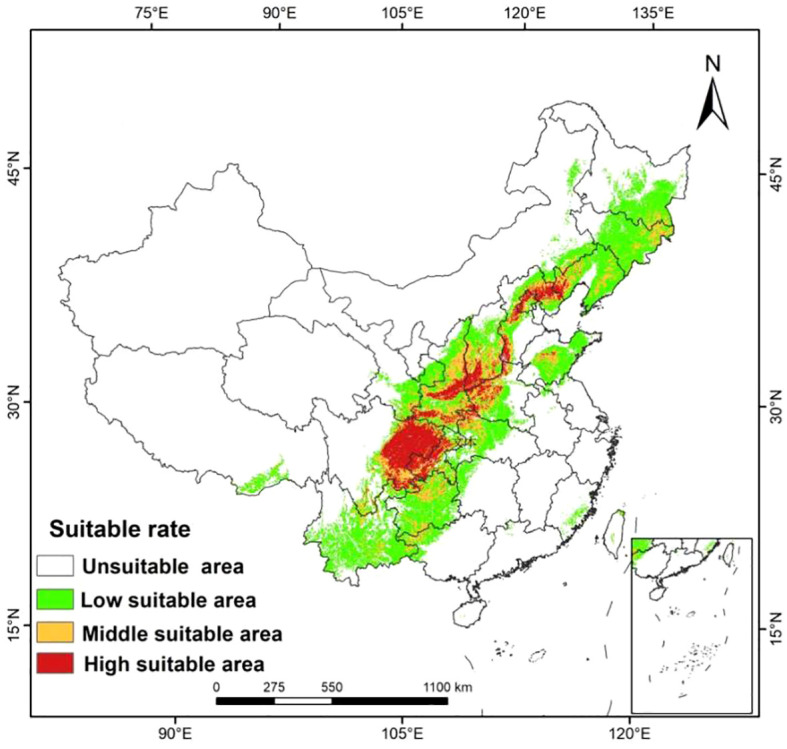
The distribution of suitable growing areas of A. dahurica in China predicted by the MaxEnt model.
3.3. Distribution and geographic variation of A. dahurica’s predicted aptitude zones
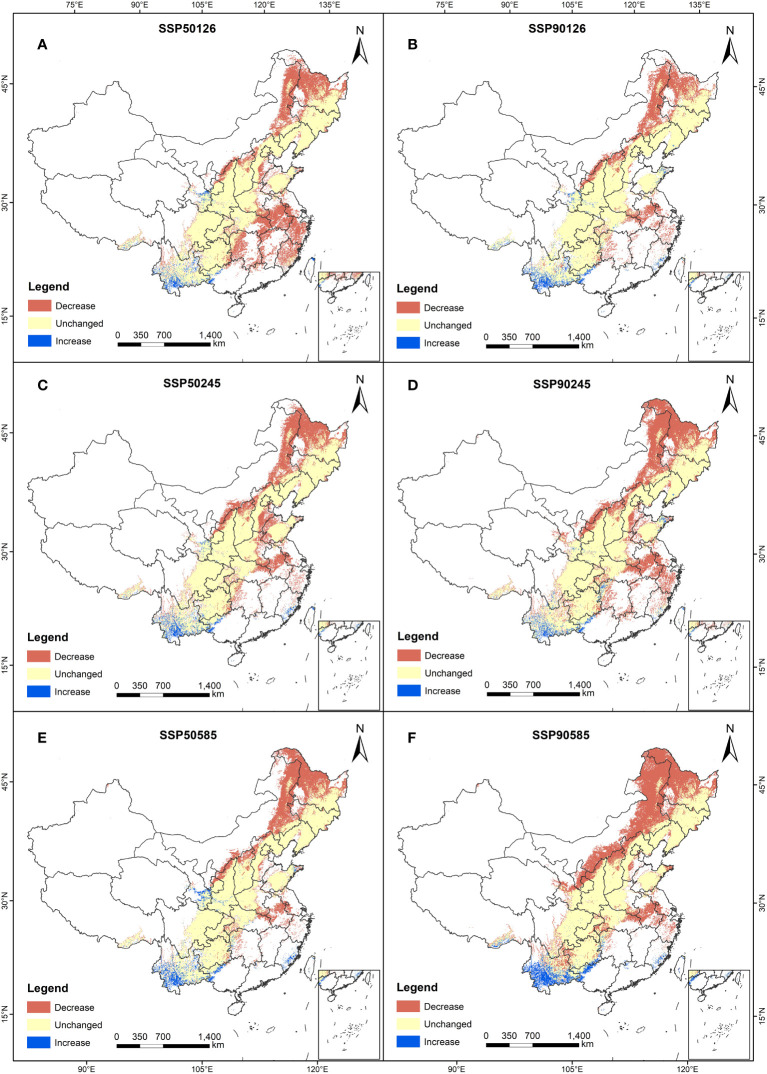
Comparing the predicted suitable areas of A. dahurica in the 1950s and 1970s, we found that the response of A. dahurica to climate change varied, with different trends ( Figures 4 , 5 ). Under the SSP245 scenario, the area of the high suitable area for A. dahurica in the 2090s showed the smallest change, with an increase of 12,903 km2 compared to the current situation, while under the SSP585 scenario, the area of the high suitable area for A. dahurica showed the largest change, with an increase of 36,116 km2 in the high suitable area by the 2050s. The current total suitable area is 109,898 km2, accounting for 20.6% of the total land area ( Table 3 ); the suitable area of A. dahurica showed an expanding trend under all three climate scenarios and was most sensitive to climate change under the SSP585 scenario.
Figure 4.
Distribution of suitable areas for A. dahurica in China in ssp126 (A, B), ssp245 (C, D), ssp585 (E, F) scenarios in the 2050s (A, C, E) and 2090s (B, D, F).
Figure 5.
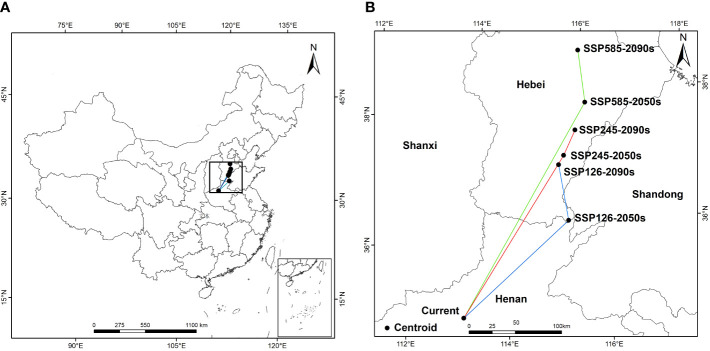
Variation of geographic distribution of the center of mass of A. dahurica aptitude zone under different climate change scenarios.
Table 3.
Area of suitable areas for A. dahurica under different future climate scenarios.
| scenarios | Unsuitable area | Low suitable area | Middle suitable area | High suitable area | Total suitable area |
|---|---|---|---|---|---|
| Current | 424,536 | 68,890 | 24,849 | 16,159 | 109,898 (20.6%) |
| SSP126 2050S | 369,528 | 85,674 | 41,622 | 37,610 | 164,906 (30.9%) |
| SSP126 2090S | 376,686 | 78,986 | 38,549 | 40,213 | 157,748 (29.5%) |
| SSP245 2050S | 380,682 | 60,614 | 45,933 | 47,205 | 153,752 (28.8%) |
| SSP245 2090S | 389,906 | 79,170 | 36,296 | 29,062 | 144,528 (27.0%) |
| SSP585 2050S | 359,408 | 69,092 | 53,659 | 52,275 | 175026 (32.7%) |
| SSP585 2090S | 350,797 | 43,784 | 37,682 | 102,171 | 183,637 (34.4%) |
In terms of spatial pattern, there were differences in the shift change of the suitable area of A. dahurica under different climate scenarios, but the overall range shift trend was more consistent, with the overall trend range shifting to the north ( Figure 6 ). In the current period, the centroid of A. dahurica suitable area is in Zhengzhou, Henan Province. When the climate scenario is SSP126-2090s, the centroids of A. dahurica fertile zone shifted to the northeast, and at this time, the centroid of A. dahurica fertile zone is located in Shijiazhuang, Hebei Province, with a range shift distance of 250,359 m. When the climate scenario is SSP585-2090s, the centroid of A. dahurica fertile zone shift northward, and it is moved to Baoding, Hebei Province, with a shift distance of 250,275 m. In the future, under the climate change scenario, global warming and humidification will cause the centroid of the fertile zone in China to range shift northward, and there is a tendency for further northward expansion of range shift. Under the future climate change scenario, global warming and humidification will cause the center of mass of A. dahurica fertile zone in China to range shift to the north, and the range shift position will have a tendency to further expand to the north.
Figure 6.
Geographical distribution changes of the centroid of the suitable area of A. dahurica under different climate scenarios [(B) is an enlargement of the part of (A)].
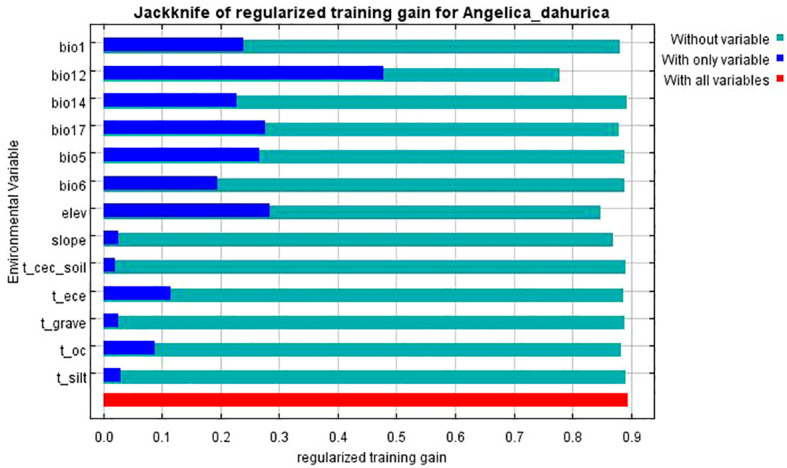
3.4. Primary Environment Variables
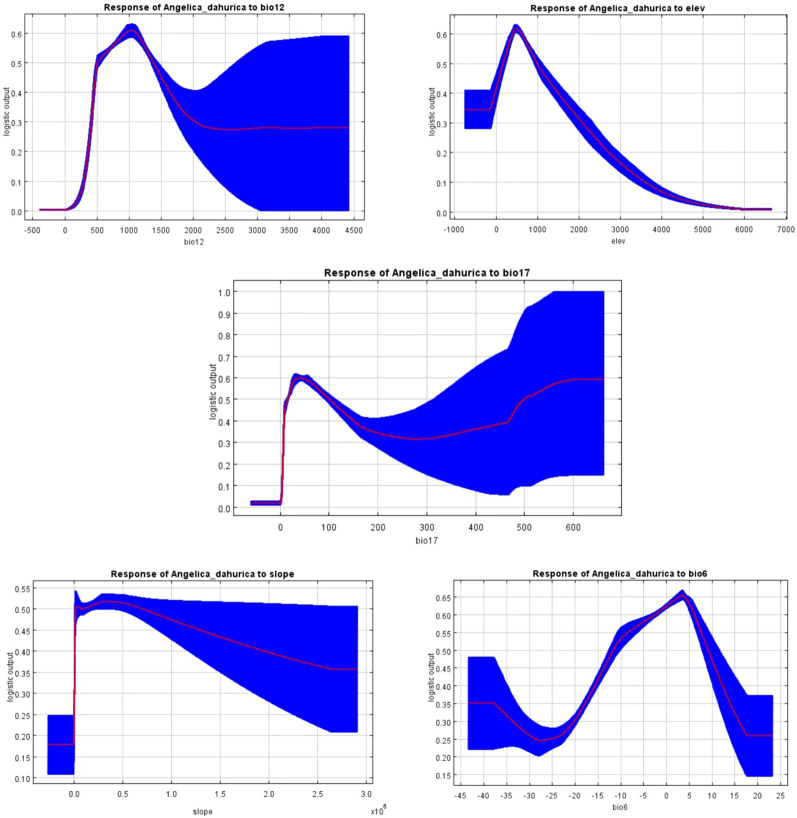
Based on the results of the Jackknife analysis ( Figure 7 ), the contribution rate of each environmental variable to the model construction was calculated, and the analysis results are shown in Table 4 . The factors that contributed more than 4% to the potential geographic distribution of A. dahurica were annual rainfall (51.4%), elevation (23.3%), slope (4.2%), rainfall in the driest season (6.3%), and minimum temperature in the coldest month (4.4%), and the total contribution rate of these five environmental factors was as high as 89.6%, and the importance value of these five environmental factors was 84% at the same time, the total contribution of these five environmental factors was 89.6%, while the importance value of these five environmental factors was 84%.
Figure 7.
Response curves for dominant environmental factors.
Table 4.
Contributions and Significant Values of Environmental Factors.
| Varible | Percent contribution | Permutation importance |
|---|---|---|
| Bio12 | 51.4 | 50.7 |
| Elevation | 23.3 | 18.2 |
| Bio17 | 6.3 | 9.5 |
| Bio6 | 4.4 | 2.2 |
| Slope | 4.2 | 3.4 |
The main environmental variables were selected to draw the response curves of environmental variables, which are shown in Figure 8 . From Figure 8 , it can be seen that: annual precipitation has the greatest influence on the geographic distribution of A. dahurica, and the probability of the existence of A. dahurica is extremely small when the rainfall of the current year is < 0 mm; When the annual precipitation is 0~1000 mm, the existence probability increases rapidly, and it is the highest at about 1043mm, with the survival probability reaching 0.61. After 1000mm, it shows a decreasing trend and tends to be stabilized at 2500 ~ 4418 mm, with the survival probability of 0.27, indicated that A. dahurica has a high sensitivity to precipitation. There is an increasing trend from 0 to 491 m above elev, reaching a maximum at 491 m, with the survival probability of 0.62; after that the survival probability decreases sharply with increasing altitude; The probability of the presence of A. dahurica was greatest when the precipitation of driest quarter was 43 mm, and the survival probability of the presence of A. dahurica was low at a slope of < 0. It increased rapidly from 0 to 0.5*106, and reached a maximum at 0.3*106, and then decreased gradually. The min temperature of coldest month shows an upward and then downward trend as the temperature rises, and shows an upward trend and increases to a maximum and then decreases at 3°, suggested that hot weather can limit the expansion of A. dahurica, which could explain the current phenomenon of low fitness or unfitness of A. dahurica in some hot areas. The above results correspond to the growth habit of A. dahurica.
Figure 8.
Spatial changes in A. dahurica. in China in ssp126 (A, B), ssp245 (C, D), ssp585 (E, F) scenarios in the 2050s (A, C, E) and 2090s (B,D, F).
The relationship between major environmental factors and potential distribution areas is shown in Table 5 . Under the SSP126 climate scenario, the 2050s suitability of A. dahurica is 0.07 higher than the current, while the 2090s suitability is 0.04 higher than the current; under the SSP245 climate scenario, the habitat suitability of A. dahurica in the 2050s and 2090s was 0.06 and 0.09 higher than the current one respectively; under the SSP585 climate scenario, the habitat suitability of A. dahurica still showed an increasing trend, with the habitat suitability of A. dahurica in the 2050s being 0.60, which was 13.2% higher than the current one, and that of A. dahurica in the 2090s being 0.65, which was 22.64% higher than the current one 22.64%. Annual rainfall at 235 A. dahurica distribution sites showed the same increasing trend as the change in habitat suitability of A. dahurica. In the 2050s, annual rainfall increased by 1.1%, 11.8% and 5.9% for the SSP126, SSP245 and SSP585 scenarios, respectively; in the 2090s compared to the 2050s, the annual rainfall increased by 7.8%, 0.71%, and 8.9% for scenarios SSP126, SSP245, and SSP585, respectively. 235 A. dahurica distribution sites showed an incremental trend in the driest season rainfall under scenario SSP126. However, there is a decreasing trend in both the SSP245 and SSP585 scenarios; the driest season rainfall is lower than the current in the 2050s and 2090s in both the SSP245 and SSP585 scenarios, and the driest season rainfall is higher than the current in the 2050s only in the SSP126 scenario. In 2050s, the total fitness zone of A. dahurica increased by 50.05%, 39.90% and 59.26% in SSP126, SSP245 and SSP585 scenarios, respectively; in the 2090s the total fitness zone domain showed a decreasing trend in SSP126 and SSP245 scenarios compared to 2050s, and showed an increasing trend in SSP585, with an increase of 4.92%.
Table 5.
Analysis of the results of the main environmental factors.
| Variable | current | SSP126 | SSP245 | SSP585 | |||
|---|---|---|---|---|---|---|---|
| 2050s | 2090s | 2050s | 2090s | 2050s | 2090s | ||
| Bio12 | 862.21 | 871.84 | 939.41 | 924.41 | 931.03 | 913.2 | 994.34 |
| Bio17 | 42.56 | 39.99 | 42.90 | 41.18 | 40.18 | 42.04 | 40.28 |
| Bio6 | -7.44 | -5.24 | -4.75 | -4.06 | -2.71 | -3.94 | -2.18 |
| Elevation | 773.98 | 773.98 | 773.98 | 773.98 | 773.98 | 773.98 | 773.98 |
| Slope | 245,018.6 | 245,018.6 | 245,018.6 | 245,018.6 | 245,018.6 | 245,018.6 | 245,018.6 |
| Suitability of Species habitat |
0.53 | 0.60 | 0.57 | 0.59 | 0.62 | 0.60 | 0.65 |
4. Discussion
4.1. Optimization model for the prediction of A. dahurica’s current habitable zone
The development of applied ecology provides a powerful model for the prediction of the potential distribution of species, and the algorithms of many models have been computer-programmed and formed into software tools, among which the MaxEnt is the model with the best accuracy of prediction of the distribution of species proved by many researches at present. MaxEnt-based simulation of species distribution is a research hotspot in related disciplines such as conservation ecology and biogeography. In this study, the optimized MaxEnt model was used to predict the habitat area of A. dahurica and the model accuracy was evaluated using ROC curves. The results showed that the AUC value was 0.879, which indicated that the model had a good prediction effect and the reliability of the model prediction was high. In general, with a large sample capacity, the model prediction accuracy is high, and the MaxEnt model can be successfully predicted with a sample size of ≥5, and the prediction results are more accurate (Pearson et al., 2006).
A. dahurica is a plant with significant medicinal value. Utilizing GIS technology and the R language, 234 geographical survey data points and 34 environmental factors of A. dahurica were analyzed. The default parameters of the Maxent model were adjusted using the ENMeval package of R language to create an optimized Maxent model for analyzing the plant's geographical distribution in its current habitat.
Pearson correlation analysis and variance inflation factor (VIF) were used to identify the necessary factors for modeling. The Jackknife method was employed to determine the dominant environmental factors within the suitable habitat zone. Furthermore, the future changes in A. dahurica's geographic distribution under various climatic scenarios were explored based on the 5th climate model released by the IPCC. The impacts of climate change on A. dahurica growing areas in China are predicted to provide the scientific basis for the protection, development and utilization of A. dahurica resources under the background of climate change.
4.2. Constraints on the geographical distribution of A. dahurica by environmental variables
In terms of environmental factors, the factors that have the greatest influence on the distribution of A. dahurica in China are elevation and precipitation: bio6 (Min Temperature of Coldest Month), bio12 (Annual Precipitation), bio17 (Precipitation of Driest Quarter), elevation, and slope. This is closely related to the growth characteristics of A. dahurica, and warm and humid climate is suitable for planting in deep, loose and fertile sandy loam soil. The prediction results concluded that A. dahurica in China is suitable for Yunnan, Guizhou, Guangxi, Sichuan, Chongqing, Hunan, Hubei, Fujian, Jiangxi, Chongqing, Shanxi, Shaanxi, Gansu, Shandong, Hebei, Liaoning, Jilin, Heilongjiang and other provinces and municipalities in local areas. The Maxent model predicted that under the background of climate change A. dahurica germplasm resources was of great significance and that these areas were the preferred places for the introduction of A. dahurica cultivation.
4.3. Impact of climate warming on the geographical distribution of A. dahurica
Under future climate change scenarios, the distribution of suitable areas for A. dahurica will change to varying degrees, with an increase in suitable areas projected by the 2050s and 2090s. The potential geographic distribution of A. dahurica is influenced by climate, soil, and terrain factors, with climate having the greatest impact on the range shift. The model has been optimized to accurately predict the potential geographical distribution of A. dahurica. Future climate change resulting from global warming will alter the distribution pattern of A. dahurica. Results from Maxent simulations indicate a tendency for the total area of the suitable zone to increase, with expansion primarily occurring in middle and high latitudes while decreasing in low latitudes. The centers of the suitable zone for A. dahurica in the 2050s and 2090s are projected to shift towards higher latitudes, with the overall range shifting towards the North China Plain and the Northeast Plain. Currently, 175 points fall within protected areas. By 2050, it is projected that 197, 196, and 193 points will be within protected areas under the SSP126, SSP245, and SSP585 scenarios, respectively. By 2090, 189, 203, and 204 points are projected to be within protected areas under the three scenarios, respectively.
4.4. Potential limitations of the Maxent model
The Maxent model is data-dependent, and in this study we only collected data from distribution sites in China with the aim of predicting the potential distribution area of A. dahurica in China, so the response curves of the environmental factors could not fully reflect the response of A. dahurica to the environment, especially in its global distribution area. Secondly, this study only predicted the effects of climate, soil and topography on A. dahurica, and did not take into account the effects of species interactions, human activities and other bio-ecological factors, so the predicted potential suitability zones will deviate from the actual suitability zones.
5. Conclusion
In this study, the default parameters of the model were optimized, resulting in the optimal model feature combination of FC=LQHPT and a regulation multiplicity of 1.5. The average value of the area under the ROC curve (AUC) was 0.879, indicating that the prediction accuracy of the Maxent model for the potential habitable zone of A. dahurica was high.The results revealed that the distribution of A. dahurica was significantly influenced by five environmental variables: bio6 (Min Temperature of Coldest Month), bio12 (Annual Precipitation), bio17 (Precipitation of Driest Quarter), elev (Altitude), and slope (Slope variability). These factors accounted for 89.6% of the cumulative contribution to the distribution of A. dahurica. A. dahurica showed that high sensitivity to precipitation with hot weather potentially limited its expansion. Based on the study, A. dahurica was most suitable for regions in Shanxi, Shaanxi, Gansu, Shandong, Hebei, Liaoning, Jilin, Heilongjiang, and most provinces and cities south of the Yangtze River in our country. The suitable area for A. dahurica was increasing overall, with expansion mostly occurred in middle and high latitudes while reductions were observed in low latitudes. Considered three future climate change scenarios, it was found that the centers of mass for A. dahurica's suitable areas in the 2050s and 2090s were shifted towards higher latitudes, with the entire suitable area moving towards the North China Plain and Northeast Plain. Thus, it was of great significance to use the Maxent model to predict the development and utilization of A. dahurica germplasm resources in the face of climate change.
Data availability statement
The original contributions presented in the study are included in the article/supplementary material. Further inquiries can be directed to the corresponding author/s.
Author contributions
F-GZ: Data curation, Formal Analysis, Investigation, Writing – original draft. FL: Conceptualization, Methodology, Software, Writing – review & editing. KW: Investigation, Validation, Writing – review & editing. LX: Investigation, Validation, Writing – review & editing. GZ: Resources, Supervision, Writing – review & editing. YW: Funding acquisition, Supervision, Validation, Writing – review & editing.
Acknowledgments
We thank LetPub (www.letpub.com) for its linguistic assistance during the preparation of this manuscript.
Funding Statement
The author(s) declare financial support was received for the research, authorship, and/or publication of this article. This work was supported by the National Natural Science Foundation of China (41801027 and 31700434), the Fundamental Research Program of Shanxi Province (202203021211250 and 202203021211252), the Fund Program for the Scientific Activities of Selected Returned Overseas Professionals in Shanxi Province (20230025 and 20230027), the Research Project Supported by Shanxi Scholarship Council of China (2023-110 and 2024-089), and Shanxi Normal University 2023 Graduate Student Research and Innovation Program (2023XSY062 and 2023XSY063).
Conflict of interest
The authors declare that the research was conducted in the absence of any commercial or financial relationships that could be construed as a potential conflict of interest.
Publisher’s note
All claims expressed in this article are solely those of the authors and do not necessarily represent those of their affiliated organizations, or those of the publisher, the editors and the reviewers. Any product that may be evaluated in this article, or claim that may be made by its manufacturer, is not guaranteed or endorsed by the publisher.
References
- Anderson R. P. (2013). A framework for using niche models to estimate impacts of climate change on species distributions. Ann. New York Acad. Sci. 1297, 8–28. doi: 10.1111/nyas.12264 [DOI] [PubMed] [Google Scholar]
- Bokor B., Santos C. S., Kostoláni D., MaChado J., da Silva M. N., Carvalho S. M. P., et al. (2021). Mitigation of climate change and environmental hazards in plants: Potential role of the beneficial metalloid silicon. J. Haz Mat 416, 126193. doi: 10.1016/j.jhazmat.2021.126193 [DOI] [PubMed] [Google Scholar]
- Chen L., Yang H. (2018). High hepatic exposure of furanocoumarins in Radix Angelica dahuricae is associated with transporter mediated active uptake. J. Ethnopharmacol. 212, 74–85. doi: 10.1016/j.jep.2017.10.014 [DOI] [PubMed] [Google Scholar]
- Dormann C. F., Elith J., Bacher S., Buchmann C., Carl G., Carré G., et al. (2013). Collinearity: a review of methods to deal with it and a simulation study evaluating their performance. Ecography 36, 27–46. doi: 10.1111/j.1600-0587.2012.07348.x [DOI] [Google Scholar]
- Elith J., Graham C. H., Anderson R. P., Dudík M., Ferrier S., Guisan A., et al. (2006). Novel methods improve prediction of species’ distributions from occurrence data. Ecography 29, 129–151. doi: 10.1111/J.2006.0906-7590.04596.X [DOI] [Google Scholar]
- Fu G., Xu X., Ma J., Xu M., Liu J., Ding A. (2016). Responses of Haloxylon ammodendron potential geographical distribution to the hydrothermal conditions under MaxEnt model. Pratacultural Sci. 33, 2173–2179. doi: 10.11829/j.issn.1001-0629.2015-0605 [DOI] [Google Scholar]
- Guo Y., Zhao Z., Qiao H., Wang R., Wei H., Wang L., et al. (2020). Challenges and development trend of species distribution model. Adv. Earth Sci. 35, 1292–1305. doi: 10.11867/j.issn.1001-8166.2020.110 [DOI] [Google Scholar]
- Ji Q., Ma Y., Zhang Y. (2020). Research progress on chemical constituents and pharmacological effects of angelicae dahuricae radix. Food Drug 22, 509–514. doi: 10.3969/j.issn.1672-979X.2020.06.019 [DOI] [Google Scholar]
- Juan W., Ni J. (2006). Review of modelling the distribution of plant species. J. Plant Ecol. 06), 1040–1053. doi: 10.17521/cjpe.2006.0133 [DOI] [Google Scholar]
- Li J., Fei Y., Yu M., Zhu H., Liu W., Liu A., et al. (2019). Study on the chemical composition of Henan Taoist Herbs polar parts of Angelica dahurica Yu in The 11th Chinese National Conference on Chemical Biology, Vol. 1. [Google Scholar]
- Li T.-t. (2012). Advances on the study of biology and chemical constituents of angelica dahurica. Subtropical Plant Sci. 41, 79–82. doi: 10.3969/j.issn.1009-7791.2012.04.019 [DOI] [Google Scholar]
- Liu Z., Zhang M., Zhang P., Li D., Ma X., Xie N., et al. (2022). Simultaneous determination and quality analysis of nine coumarins in angelica dahurica by high performance liquid chromatography. Chem. Reagents 44 (10), 1513–1518. doi: 10.13822/j.cnki.hxsj.2022.0139 [DOI] [Google Scholar]
- Ma S., Zhang M., Zhang H., Meng H., Chen X. (2010). Predicting potential geographical distributions and patterns of the relic plant Gymnocarpos przewalskii using Maximum Entropy and Genetic Algorithm for Rule-set Prediction. Chin. J. Plant Ecol. 34, 1327–1335. doi: 10.3773/j.issn.1005-264x.2010.11.010 [DOI] [Google Scholar]
- Ma W., Li S. (2023). Development of maximum entropy model at home and abroad and its applications in different climatic backgrounds and regional scales. Forestry Construct 02), 32–40. doi: 10.32629/9789811450518 [DOI] [Google Scholar]
- Ma Z., Ren J., Chen H., Jiang H., Gao Q., Liu S., et al. (2022). Analysis and recommendations of IPCC working group. Res. Environmen. Sci. 35 (11), 2550–2558. doi: 10.13198/j.issn.1001-6929.2022.08.08 [DOI] [Google Scholar]
- Merow C., Smith M. J., Silander J.A. (2013). A practical guide to MaxEnt for modeling species’ distributions: what it does, and why inputs and settings matter. Ecography 36, 1058–1069. doi: 10.1111/j.1600-0587.2013.07872.x [DOI] [Google Scholar]
- Muscarella R., Galante P. J., Soley-Guardia M., Boria R. A., Kass J. M., Uriarte M., et al. (2014). ENMeval: An R package for conducting spatially independent evaluations and estimating optimal model complexity for Maxent ecological niche models. Methods Ecol. Evol. 5, 1198–1205. doi: 10.1111/2041-210X.12261 [DOI] [Google Scholar]
- OuYang Z., OuYang S., Wu J., Zhou Z., Li Z., Dong S. (2022). Progress of the application of prediction of potential suitable distribution of plants based on Maxent. Hunan Forestry Sci. Technol. 49 (01), 83–88. doi: 10.3969/j.issn.1003-5710 [DOI] [Google Scholar]
- Pearson R. G., Raxworthy C. J., Nakamura M., Peterson A. T. (2006). Predicting species distributions from small numbers of occurrence records: A test case using cryptic geckos in Madagascar. J. Biogeog 34, 102–117. doi: 10.1111/j.1365-2699.2006.01594.x [DOI] [Google Scholar]
- Priya A. K., M. M., Rajamanickam S., Sivarethinamohan S., Gaddam M. K. R., Velusamy P., R, G., et al. (2023). Impact of climate change and anthropogenic activities on aquatic ecosystem – A review. Environ. Res. 238, 117233. doi: 10.1016/j.envres.2023.117233 [DOI] [PubMed] [Google Scholar]
- Shen Y., Wang G. (2013). Key findings and assessment results of IPCC WGI fifth assessment report. J. Glaciol. Geocryl. 35, 1068–1076. doi: 10.7522/j.issn.1000-0204.2013.0120 [DOI] [Google Scholar]
- Tang J., Zhao K., Zhang T., Shen J., Wen C. (2021). Virtual screening of anti-inflammatory and analgesic coumarins in angelica dahurica. Inf. Traditional Chinese Med. 38 (02), 35–39. doi: 10.19656/j.cnki.1002-2406.210206 [DOI] [Google Scholar]
- Wang Q., Fu L., Huang J., Li Y., Xie Z., Wang T. (2017). Cultivation techniques for high yield of Angelica dahurica Anhui. Agri.Sci.Bull 23, 82–83. doi: 10.16377/j.cnki.issn1007-7731.2017.18.034 [DOI] [Google Scholar]
- Wang Q., Jin S., Li G., Lin C. (2023). Hypoglycemic and hepatoprotective effect of angelica dahurica polysaccharide in type 2 diabetic rats. Food Sci. 44, 176–183. doi: 10.7506/spkx1002-6630-20220331-389 [DOI] [Google Scholar]
- Wang R., Liu J., Yang D., Gao H., Lyv S. (2020). Research progress in chemical and pharmacological action of angelica dahurica. Inf. Traditional Chin. Med. 37, 123–128. doi: 10.19656/j.cnki.1002-2406.200058 [DOI] [Google Scholar]
- Wang Y., Wang Z., Xing H., Li J., Sun S. (2019). Prediction of potential suitable distribution of Davidia involucrata Baill in China based on MaxEnt. Chin. J. Ecol. 38, 1230–1237. doi: 10.13292/j.1000-4890.201904.024 [DOI] [Google Scholar]
- Xie N., Liu Z., Zhang M., Zhang P., Li D., Ma X., et al. (2022). Determination of 9 chemical components of coumarins in anglelica dahurica by high performance liquid chromatography and its multivariate statistical analysis. Phys. Testing Chem. Analysis (Part B: Chem. Analysis) 58 (06), 657–663. doi: 10.11973/lhjy-hx202206007 [DOI] [Google Scholar]
- Xue P., Song B., Zhao Y. (2023). Progress on responses of plant community and ecosystem carbon exchange in grasslands to climate warming. Ecol. Sci. 42, 257–265. doi: 10.14108/j.cnki.1008-8873.2023.02.030 [DOI] [Google Scholar]
- Yang L., Li Q., Feng Y., Qiu D. (2020). Current status of research and application of Angelica dahuricae. J. Traditional Chin. Veterinary Med. 39, 24–28. doi: 10.13823/j.cnki.jtcvm.2020.01.006 [DOI] [Google Scholar]
- Zhang L., Yang X. (2018). Analysis of nine furanocoumarins in Angelicae Dahuricae Radix from different regions by ultra-fast liquid chromatography coupled with triple quadrupole mass spectrometer. J. Pharm. Anal. 38, 214–220. doi: 10.16155/j.0254-1793.2018.02.03 [DOI] [Google Scholar]
- Zhang Q., Zhang D., Wu M., Guo J., Sun C., Xie C. (2017). Predicting the global areas for potential distribution of Gastrodia elata based on ecological niche models. Chin. J. Plant Ecol. 41, 770–778. doi: 10.17521/cjpe.2016.0380 [DOI] [Google Scholar]
- Zhou J., Su W., Pan Y., Cui J. (2023). Progress in the study of chemical constituents and pharmacological effects of Angelica dahurica and the predictive analysis of its quality markers (Q-marker). Modern Traditional Chinese Med. Materia Medica-World Sci. Technol. 25 (07), 2535–2548. doi: 10.1016/j.heliyon.2024.e29557 [DOI] [Google Scholar]
- Zou H., Chen B., Zhang B., Zhou X., Zhang X., Zhang X., et al. (2023). Conservation planning for the endemic and endangered medicinal plants under the climate change and human disturbance: a case study of Gentiana manshurica in China.Front. Plant Sci. 14. doi: 10.3389/fpls.2023.1184556 [DOI] [PMC free article] [PubMed] [Google Scholar]
Associated Data
This section collects any data citations, data availability statements, or supplementary materials included in this article.
Data Availability Statement
The original contributions presented in the study are included in the article/supplementary material. Further inquiries can be directed to the corresponding author/s.


