



SUMMARY
BA.2.86, a recently identified descendant of the Omicron BA.2 sublineage, contains ~35 mutations in the spike (S) protein and spreads in multiple countries. Here, we investigated whether the virus exhibits altered biological traits, focussing on S protein-driven viral entry. Employing pseudotyped particles, we show that BA.2.86, unlike other Omicron sublineages, enters Calu-3 lung cells with high efficiency and in a serine but not cysteine protease-dependent manner. Robust lung cell infection was confirmed with authentic BA.2.86 but the virus exhibited low specific infectivity. Further, BA.2.86 was highly resistant against all therapeutic antibodies tested and efficiently evaded neutralization by antibodies induced by non-adapted vaccines. In contrast, BA.2.86 and the currently circulating EG.5.1 sublineage were appreciably neutralized by antibodies induced by the XBB.1.5-adapted vaccine. Collectively, BA.2.86 has regained a trait characteristic for early SARS-CoV-2 lineages, robust lung cell entry, and evades neutralizing antibodies. However, BA.2.86 exhibits low specific infectivity, which might limit transmissibility.
INTRODUCTION
The coronavirus disease 2019 (COVID-19) is transiting from pandemic to endemic but the causative agent, severe acute respiratory syndrome coronavirus 2 (SARS-CoV-2), continues to circulate globally and to threaten public health. The waning pandemic is currently dominated by viruses of the XBB sublineage of the Omicron variant, including XBB.1.16 and the recently emerged EG.5.1 lineage.1 It is believed that evasion of neutralizing antibodies and optimization of ACE2 binding currently drive the emergence of these lineages. Thus, XBB.1.5 was found to bind to ACE2 with higher efficiency than its precursor, XBB.1,2–4 and EG.5.1 evades neutralizing antibodies with higher efficiency than co-circulating lineages.5 The increase in ACE2 binding and antibody evasion is the result of convergent evolution,6,7 i.e. separate viral sublineages acquire similar or identical mutations, suggesting limited evolutionary space of currently circulating SARS-CoV-2 lineages. However, this situation has changed dramatically with the recent emergence of a novel, highly mutated lineage, BA.2.86.
The BA.2.86 lineage is a descendant of the BA.2 lineage and was first detected in July 2023.8–10 In the middle of August, infections were noted in several countries, including Denmark, South Africa, Israel, the United Kingdom and the United States of America and on August 17, BA.2.86 was classified a “variant under monitoring” by WHO.8,9,11–13 In the United Kingdom, a large outbreak in a care facility was observed that was characterized by a high attack rate among residents, despite most residents being vaccinated 4 months before the outbreak, suggesting efficient immune evasion and transmission.14 By October 23, BA.2.86 has been detected in 32 countries 15 with relative prevalence increasing particularly in Europe, Oceania, North America and Asia, despite high prevalence of previously emerged XBB sublineages (Supplemental figure S1). Although the overall number of detected cases is low, the presence of the virus in multiple countries suggests that it has been spreading globally without detection for some time. In keeping with such a scenario, known cases of BA.2.86 infection were not related and not associated with travel activity.11 Further, although the emergence of BA.2.86 was paralleled by an increase in cases in several countries but it is at present largely unclear whether BA.2.86 causes more severe disease than previous SARS-CoV-2 lineages.
The spike (S) protein of SARS-CoV-2 facilitates viral entry into target cells, a process that depends on S protein binding to the ACE2 receptor and S protein cleavage by a host cell protease, TMPRSS2 or cathepsin L.16 Specifically, the surface unit of the S protein, termed S1, harbours a receptor binding domain (RBD) that binds to ACE2 and constitutes the key target of the neutralizing antibody response.16,17 Further, the transmembrane unit, S2, of the S protein drives fusion of the viral membrane with a target cell membrane, thereby allowing for delivery of the viral genetic information into the host cell cytoplasm, which is critical for infection. Compared to the S protein of its parental BA.2 lineage, the BA.2.86 S protein contains 33 mutations, with most mutations residing within the N-terminal domain (NTD) and the RBD (Figure 1A). However, the impact of the mutations in the BA.2.86 S protein on viral entry and its inhibition by antibodies is unknown.
Figure 1. The BA.2.86 spike protein mediates robust entry into lung cells.
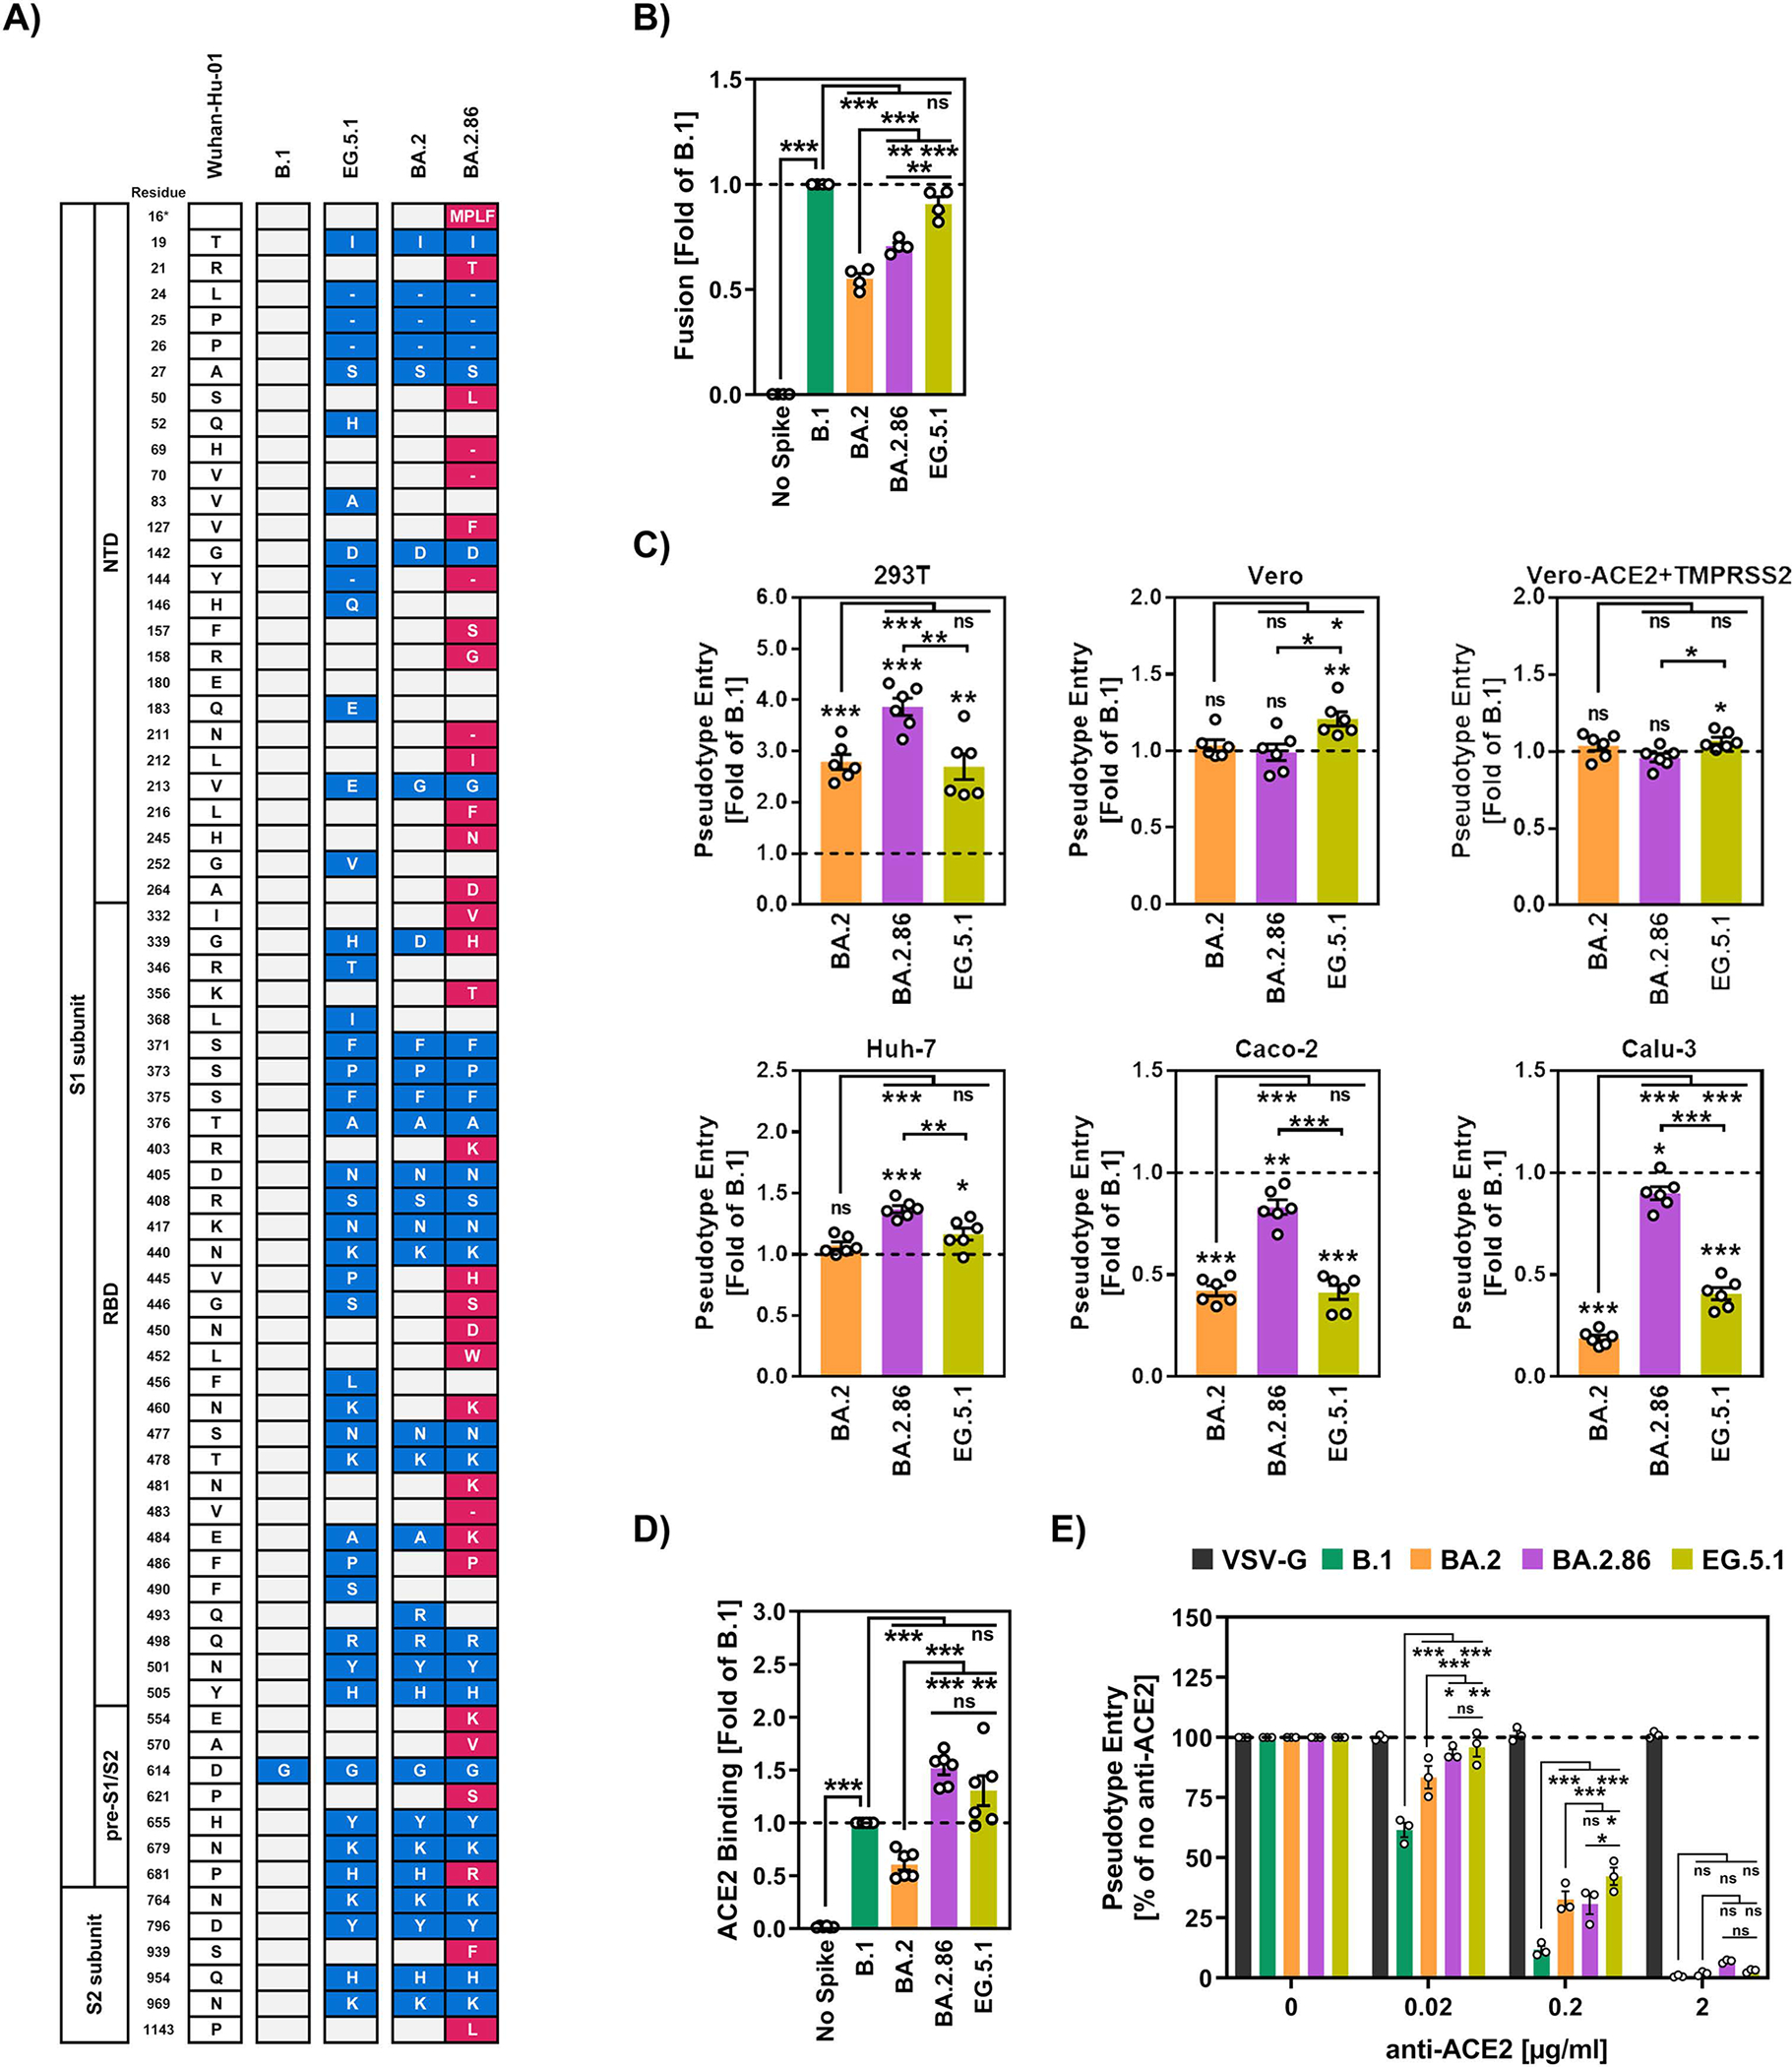
(A) Summary of the mutations found in the S proteins of SARS-CoV-2 lineages B.1, BA.2, BA.2.86, and EG.5.1 compared to the S protein of the Wuhan-Hu-01 isolate (numbering according to the S protein of SARS-CoV-2 Wuhan-Hu-01). Unique S protein mutations in BA.2.86 S compared to BA.2 S are highlighted in red. Minus signs indicate deletions. White boxes highlight identical residues compared to the reference sequence, while blue (non-BA.2.86-specific) and red (only BA.2.86-specific) boxes highlight mutated residues in the S proteins of EG.5.1, BA.2 and BA.2.86. Abbreviations: NTD = N-terminal domain; RBD = receptor-binding domain; pre-S1/S2 and S2’ = sequence between RBD and S1/S2 site.
(B) Effector 293T cells cotransfected to express the indicated S proteins (or no S protein) and the beta-galactosidase alpha fragment were co-cultured with 293T target cells transfected to co-express ACE2 and the beta-galactosidase omega fragment. After 18 h, the cells were incubated for 90 min in the presence of beta galactosidase substrate, before cell-cell fusion was analyzed by measuring the activity of reconstituted beta galactosidase enzyme. The mean data from four biological replicates performed with three technical replicates are shown. Error bars indicate the SEM. Data were normalized against fusion induced by B.1 S (set as 1, dashed line). Statistical significance was assessed by two-tailed Student’s t-test (not significant [ns], p > 0.05; *, p ≤ 0.05; **, p ≤ 0.01; ***, p ≤ 0.001). Please see also supplementary figure S2A–B.
(C) Particles pseudotyped with the indicated S proteins were inoculated onto 293T (human, kidney), Vero (African green monkey, kidney), Vero-ACE2+TMPRSS2 (African green monkey, kidney, stably expressing ACE2 and TMPRSS2), Huh-7 (human, liver), Caco-2 (human, colon) and Calu-3 (human, lung) cells and cell entry was analyzed at 16–18 h postinoculation by measuring the activity of virus-encoded firefly luciferase in cell lysates. The mean data from six biological replicates are shown, each replicate was performed with four technical replicates. Error bars indicate the standard error of the mean (SEM). Data were normalized against cell entry of B.1pp (set as 1, dashed line). Statistical significance was assessed by two-tailed Student’s t-test (not significant [ns], p > 0.05; *, p ≤ 0.05; **, p ≤ 0.01; ***, p ≤ 0.001). Please also see supplementary figure S2C–F.
(D) 293T cells transfected to express the indicated S proteins (or no S protein) were sequentially incubated with soluble ACE2 harboring a C-terminal Fc-tag derived from human IgG and AlexaFlour-488-conjugated antihuman antibody. Binding of ACE2 to S protein expressing cells was analyzed by flow cytometry and the geometric mean channel fluorescence was measured. Cells that did not express any S protein served as control. The mean data from six biological replicates conducted with single samples are shown. Data were normalized against B.1 (set as 1, dashed line) and error bars indicate the SEM. Statistical significance was assessed by two-tailed Student’s t-test (not significant [ns], p > 0.05; *, p ≤ 0.05; **, p ≤ 0.01; ***, p ≤ 0.001). Please also see supplementary figure S2G.
(E) Vero cells were pretreated with different concentrations of anti-ACE2 antibody and subsequently inoculated with pseudovirus particles bearing the indicated S proteins or VSV-G. Cell entry was analyzed at 16–18 h postinoculation as described above. Presented are the normalized mean data from three biological replicates (performed with four technical replicates). For normalization, S protein-driven entry into cells that were not exposed to anti-ACE2 antibody was set as 100%. Error bars represent the SEM. Statistical significance was assessed by two-way analysis of variance with Tukey’s posttest (not significant [ns], p > 0.05; *, p ≤ 0.05; **, p ≤ 0.01; ***, p ≤ 0.001). Please also see supplementary figure S2H.
We assessed cell entry and neutralization sensitivity of BA.2.86 using pseudotyped particles and authentic BA.2.86. We found that BA.2.86 robustly binds ACE2, enters Calu-3 lung cells with comparable efficiency to B.1 and evades therapeutic as well as vaccine- and/or infection-induced antibodies with high efficiency. However, BA.2.86 is neutralized appreciably by antibodies induced by an XBB.1.5-adapted vaccine and specific infectivity of BA.2.86 particles seems to be low. Thus, BA.2.86 might constitute an elevated health threat as compared to previous Omicron sublineages but low specific infectivity might limit transmissibility.
RESULTS
The spike protein of BA.2.86 is highly mutated
Sequence analysis revealed that BA.2.86 S protein contains 33 mutations compared to the S protein of BA.2, including one insertion (ins16MPLF), five deletions (H69Δ, V70Δ, Y144Δ N211Δ, V483Δ) and one reversion (R493Q) (Figure 1A). Several of these mutations are known from other SARS-CoV-2 variants of interest or concern, including NTD mutations R21T (present in B.1.617), H69Δ/V70Δ (present in the Alpha variant), R158G (present in the Delta variant), RBD mutation E484K (present in the Beta and Gamma variants) and pre-S1/S2 mutation P681R (present in the Delta variant). Further, S50L (China, Singapore and Australia,18), H245N (Palestine,19), R403K (USA,20), N481K (Qatar,21), E554K (Pakistan,22), P621S (North America and Oceania,23) were previously detected in viruses circulating in different countries. Several of the mutations in BA.2.86 S protein have been associated with antibody resistance, including K356T, N450D and E484K,24–26 others may alter ACE2 interactions, including ΔV483, N460K and R493Q,27,28 while P681R may increase S protein-cleavage at the S1/S2 site and augment cell-cell fusion activity.29 In sum, BA.2.86 S protein harbours an unusually high number of mutations in the S protein, several of which may alter key biological properties of the virus.
The BA.2.86 spike protein fuses cells with increased efficiency relative to BA.2 spike protein
The SARS-CoV-2 S protein can fuse infected with uninfected cells, resulting in the formation of syncytia, which are believed to contribute to COVID-19 pathogenesis.30–32 We first asked whether the S protein of BA.2.86 shows increased capacity to fuse cells as compared to the parental BA.2 S protein. For comparison, the S proteins of B.1 and EG.5.1 were also analyzed. Viruses of the B.1 lineage circulated early in the pandemic, BA.2 viruses dominated in the first half of 2022 and the EG.5.1 lineage is currently circulating. For analysis of cell-cell fusion, the S proteins were expressed on 293T effector cells and fusion with 293T target cells expressing ACE2 was measured, making use of the reconstitution of a split beta-galactosidase reporter. Flow cytometry revealed that all S protein were robustly expressed at the cell surface (Supplemental figure 2A). Expression of the S proteins of B.1, BA.2 and EG.5.1 was comparable while expression of BA.2.86 S protein was moderately reduced as compared to B.1 (Supplemental figure 2A). The B.1 S protein fused cells with high efficiency while BA.2 S protein was less fusogenic, as expected (Figure 1B and Supplementary figure 2B).33 The S protein of BA.2.86 exhibited increased cell-cell fusion activity as compared to the BA.2 S protein but cell fusion levels did not match those measured for B.1 S protein (Figure 1B). Finally, EG.5.1 S protein drove cell-cell fusion with similar efficiency as B.1 S protein. Thus, BA.2.86 S exhibits increased fusogenicity relative to BA.2 S protein, potentially due to mutation P681R.29,33,34
BA.2.86 has regained the capacity to enter lung cells with high efficiency
We next assessed the cell tropism of BA.2.86 using pseudotyped particles (pp), which adequately model SARS-CoV-2 cell entry and its inhibition by antibodies.35,36 For comparison, we included particles bearing the S proteins of B.1 (B.1pp), BA.2 (BA.2pp), EG.5.1 (EG.5.1pp). Particles harbouring the glycoprotein of the pantropic vesicular stomatitis virus (VSV-Gpp) or no glycoprotein served as controls. As target cells, we employed cell lines frequently used for SARS-CoV-2 research, 293T (human, kidney), Vero (African green monkey, kidney), Vero-ACE2+TMPRSS2 (African green monkey, kidney, stably expressing ACE2 and TMPRSS2), Huh-7 (human, liver), Caco-2 (human, colon) and Calu-3 (human, lung) cells.
Immunoblot confirmed that all S proteins were incorporated into particles (Supplemental figure 2C–D). Particles harboured similar levels of B.1 and EG.5.1 S protein while levels of BA.2.86 were moderately and levels of BA.2 S protein were markedly reduced (Supplemental figure 2C–D), and no apparent differences in S protein cleavage were measured (Supplemental figure 2E). Particles without viral glycoprotein failed to enter target cells while particles bearing VSV-G entered all cell lines tested (Figure 1C and Supplemental figure 2F), in keeping with expectations. Important differences were noted regarding cell entry of particles bearing S proteins of different SARS-CoV-2 lineages. BA.2pp and EG.5.1pp entered all cell lines tested with roughly comparable efficiency and for 293T, Vero, Vero-ACE2+TMPRSS2 and Huh-7 cells entry efficiency was comparable or higher than that measured for B.1pp (Figure 1C). In contrast, BA.2pp and EG.5.1pp entered Caco-2 and Calu-3 cells less efficiently than B.1pp. No major differences in entry of BA.2pp, EG.5.1pp and BA.2.86pp into 293T, Vero, Vero-ACE2+TMPRSS2 and Huh-7 cells were observed (Figure 1C). However, BA.2.86pp entered Caco-2 and Calu-3 cells with roughly the same efficiency as B.1pp and with markedly higher efficiency than BA.2pp and EG.5.1pp (Figure 1C). Collectively, BA.2.86, unlike other known Omicron sublineages, can robustly enter lung cells, and may thus show increased capacity to spread in the lower respiratory tract, a prerequisite to the induction of severe COVID-19.
BA.2.86 spike protein efficiently binds to ACE2
The robust entry of BA.2.86pp suggested efficient engagement of the ACE2 receptor. In order to test this possibility, soluble, recombinant ACE2 and S protein expressing 293T cells were used. In this assay, B.1 S protein bound to ACE2 with higher efficiency than BA.2. S protein while BA.2.86 and EG.5.1 S protein showed elevated ACE2 binding as compared to B.1 S protein (Figure 1D and Supplemental figure 2G). In keeping with increased ACE2 binding of BA.2.86 and EG.5.1 S protein, an antibody known to disrupt S protein binding to ACE2 blocked cell entry of BA.2pp with higher efficiency as compared to BA.2.86pp, and EG.5.1pp with inhibition of B.1pp being most efficient (Figure 1 E and Supplementary figure 2H). Although confirmation of the ACE2 binding results with an independent assay system is pending, these results show that cell entry of BA.2.86 is ACE2-dependent and indicate that BA.2.86 efficiently binds to ACE2.
BA.2.86 S protein, like B.1. S protein, efficiently uses the TMPRSS2 pathway for lung cell entry
The ability of BA.2.86pp to enter Calu-3 lung cells with the same efficiency as B.1pp distinguishes BA.2.86 from other Omicron sublineages. Therefore, we sought to obtain initial insights into the underlying mechanism. All SARS-CoV-2 variants of concern circulating before the Omicron variant critically depend on the serine protease TMPRSS2 for Calu-3 lung cell entry while Omicron sublineages shifted their protease preference towards cathepsin L and can use both TMPRSS2 and cathepsin L for lung cell entry.37–40 In fact, it is believed that reduced TMPRSS2 usage by Omicron sublineages accounts for their reduced ability to infect lung cells as compared to previous SARS-CoV-2 lineages. Therefore, we first investigated whether BA.2.86pp showed altered protease dependence for cell entry, using the well-characterized protease inhibitors Camostat (active against TMPRSS2) and MDL28170 (active against cathepsin L) and Vero (TMPRSS2-negative) and Calu-3 cells (TMPRSS2-positive) as targets.
Entry of VSV-Gpp into both Vero and Calu-3 cells was not modulated by protease inhibitors, as expected (Figure 2A,B). Further, Vero cell entry driven by all S proteins analysed was inhibited by MDL28170 but not Camostat, again in keeping with expectations, with entry of B.1pp and BA.2pp being more susceptible to inhibition than entry of BA.2.86pp and EG.5.1pp (Figure 2A,B). Finally, Calu-3 cell entry of BA.2pp and EG.5.1pp was partially inhibited by both MDL28170 and Camostat while entry of B.1pp and BA.2.86pp was only inhibited by Camostat and inhibition was more efficient as compared to BA.2pp and EG.5.1pp (Figure 2A,B). Thus, protease dependence of BA.2.86 matches that of B.1 and is markedly different from that of all previously known Omicron sublineages.
Figure 2. BA.2.86 entry into Calu-3 lung cells is TMPRSS2-dependent and determined by both NTD and RBD.
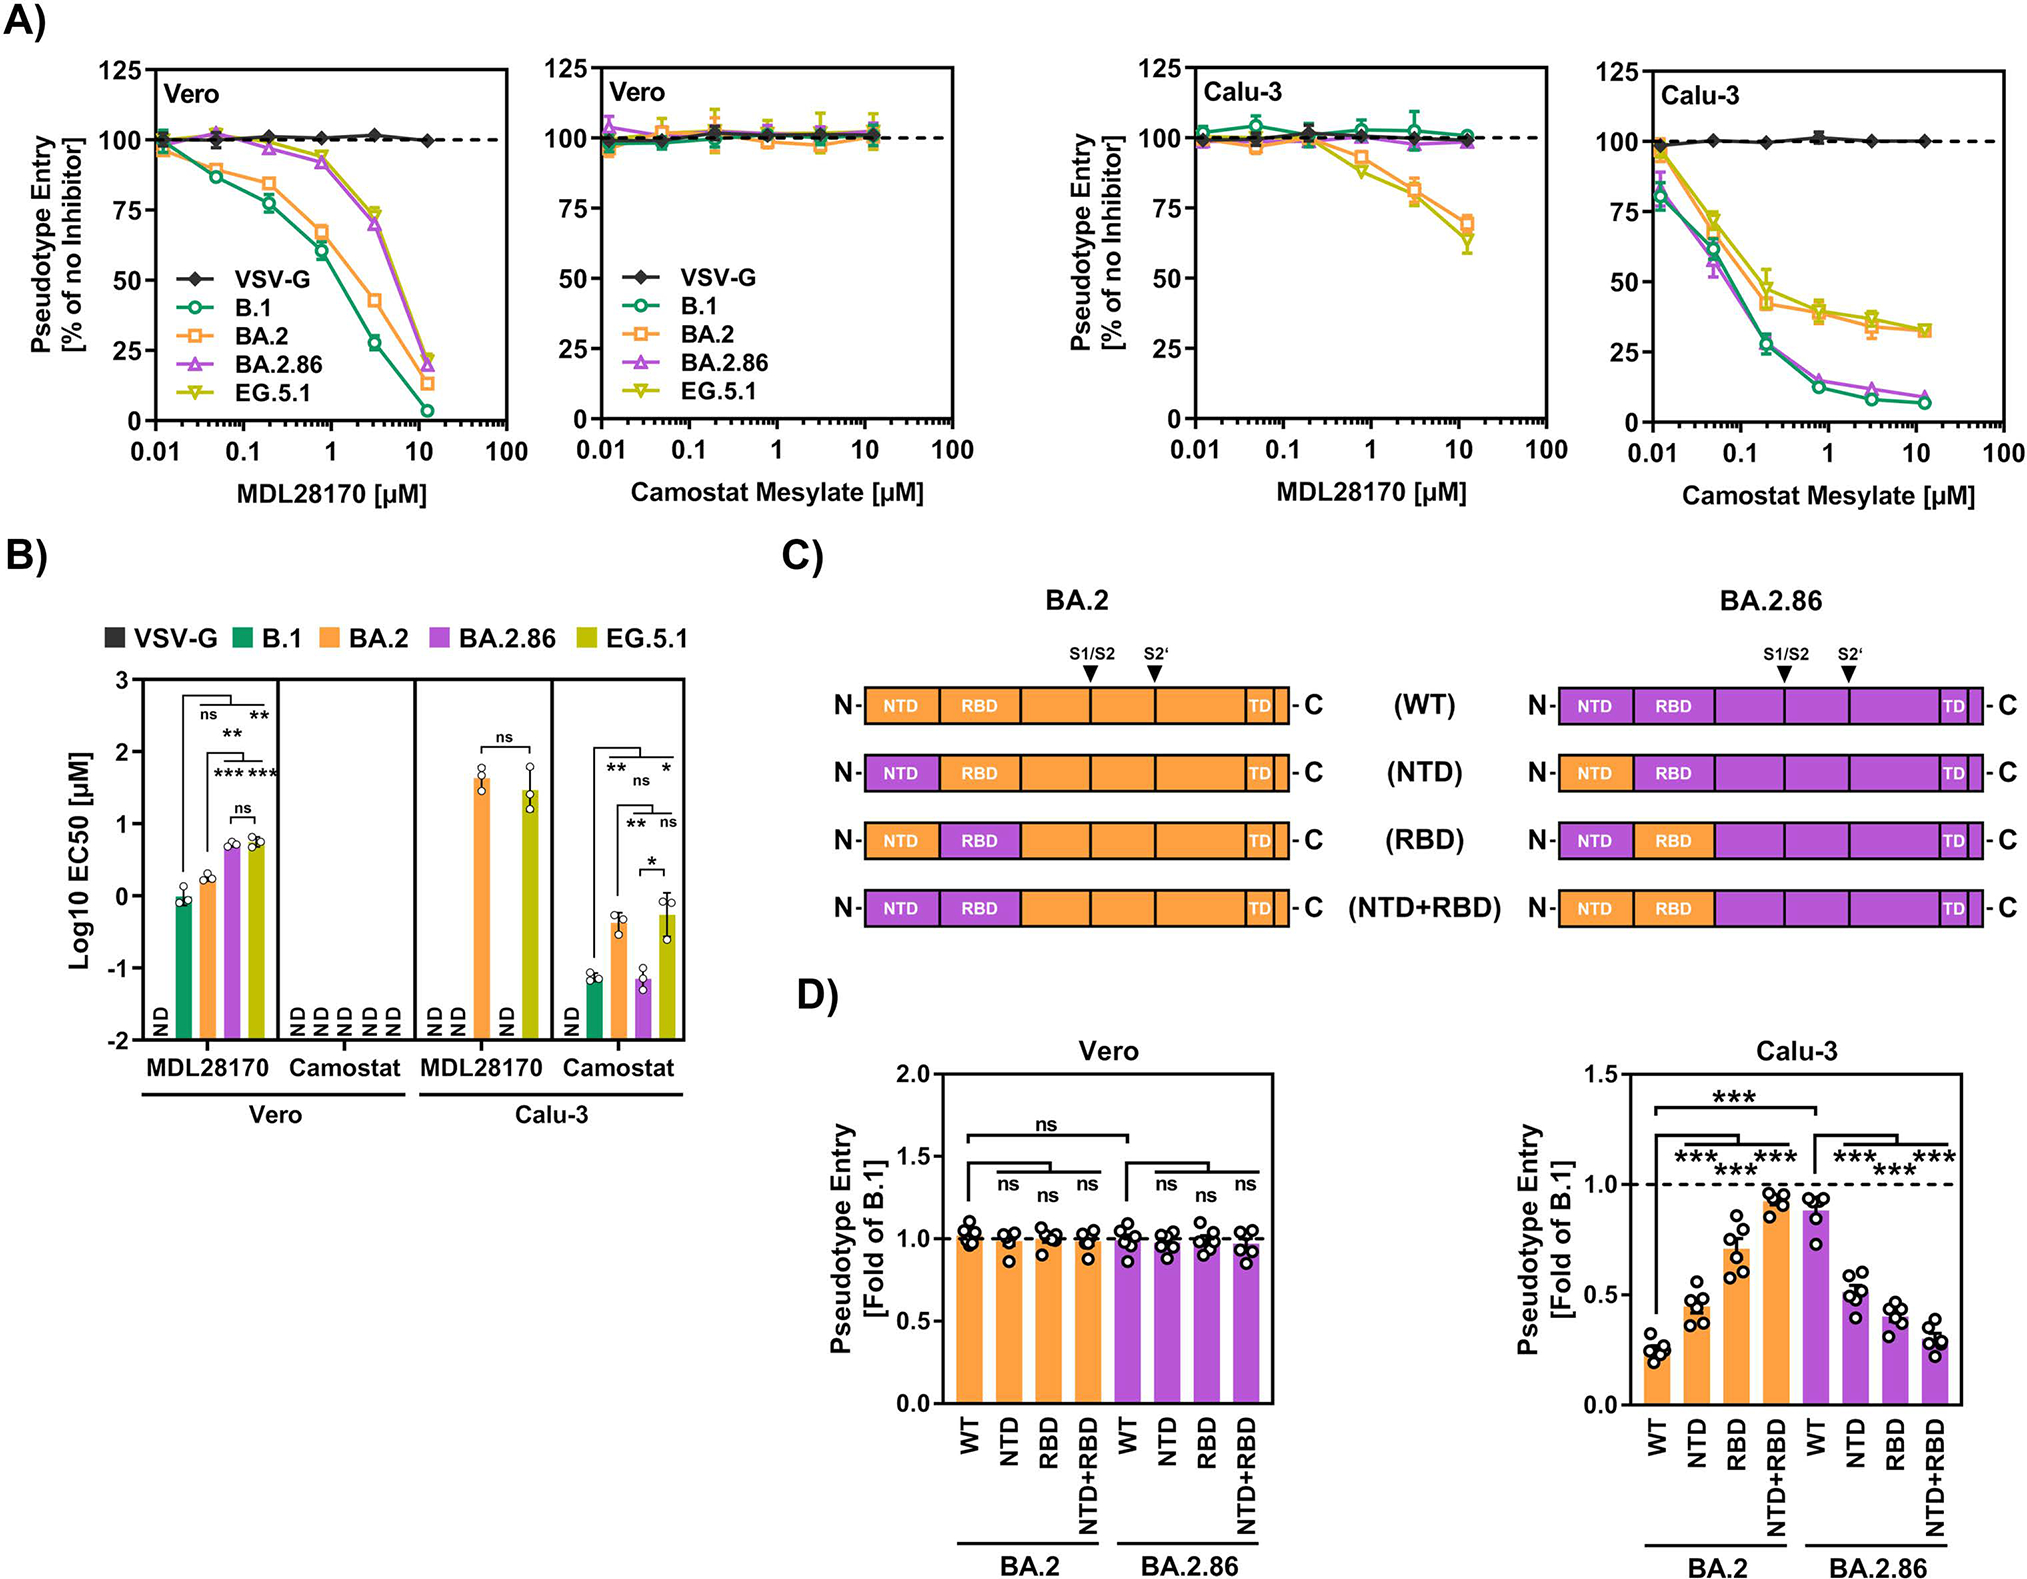
(A) Vero or Calu-3 cells were preincubated for 1 h at 37 °C with medium contain different concentrations of either MDL28170 or Camostat (or DMSO, control), before pseudovirus particles were added. Cell entry was analyzed at 16–18 h postinoculation as described in the legend of figure 1. Presented are the normalized mean data from three biological replicates (performed with four technical replicates). For normalization, S protein-driven entry into cells that were not exposed to inhibitor was set as 100%. Error bars represent the SEM. Statistical significance was assessed by two-tailed Student’s t-test (ns, p > 0.05; *, p ≤ 0.05; **, p ≤ 0.01; ***, p ≤ 0.001). Abbreviation: ND, not determinable.
(B) The inhibitor concentration leading to half-maximal inhibition of pseudovirus entry into target cells (effective concentration 50, EC50) was calculated based on the data shown in panel A. Presented are the normalized mean data from three biological replicates (performed with four technical replicates). Error bars represent the SEM.
(C) Schematic illustration of chimeric BA.2 and BA.2.86 S proteins in which either the NTD, RBD or both are interchanged.
(D) Particles pseudotyped with the indicated wildtype or chimeric S proteins were inoculated onto Vero and Calu-3 cells. Cell entry was analyzed at 16–18 h postinoculation as described in the legend of figure 1. Presented are the normalized mean data from six biological replicates (performed with four technical replicates). Error bars indicate the SEM. Data were normalized against cell entry of B.1pp (set as 1, dashed line). Statistical significance was assessed by two-tailed Student’s t-test (ns, p > 0.05; *, p ≤ 0.05; **, p ≤ 0.01; ***, p ≤ 0.001). Please also see supplementary figure S3A and B.
We next investigated whether sequences in the N-terminal domain (NTD) and/or RBD, which govern SARS-CoV-2 binding to cells, contribute to augmented Calu-3 cell entry. For this, we exchanged the NTD, RBD or both between BA.2 and BA.2.86 S proteins (Figure 2C) and analyzed the ability of the chimeric S proteins to drive entry into Vero and Calu-3 cells. All chimeric S proteins were incorporated into particles with similar efficiency as the corresponding WT S proteins (Supplemental figure 3A) and all S proteins mediated Vero cell entry with comparable efficiency (Figure 2D and supplemental figure 3B). Further, introduction of the NTD and, particularly, the RBD of BA.2.86 S protein into BA.2 S protein markedly increased Calu-3 cell entry while the reverse exchanges had the opposite effect (Figure 2D). Finally, the combined exchange of NTD and RBD was sufficient to fully confer lung cell entry efficiency from the donor to the acceptor S protein (Figure 2D).
The finding that both NTD and RBD contributed to augmented lung cell entry suggested that this phenotype is not due to a single mutation. However, in order to obtain initial insights into which amino acids are critical, we reverted all single mutations found in the BA2.86 S protein relative to the BA.2 S protein. Five mutations, L50S, T356K, K403R, D450N and Q493R, reduced entry into Calu-3 lung cells by at least 1.5-fold without appreciably interfering with particle incorporation of the S protein while insMPLFΔ16 diminished both particle incorporation and entry (Supplemental figure 3C,D). Mutations K403R, D450N and Q493R also diminished entry into Vero cells and thus did not specifically interfere with lung cell entry (Supplemental figure 3C). In contrast, L50S and T356K had negligible effects on Vero cell entry, indicating that BA.2.86-specific mutations at NTD residue L50 and RBD residue T356 specifically promote lung cell entry.
Collectively, our results show that the robust lung cell entry of BA.2.86 is associated with efficient TMPRSS2 usage and is determined by both the NTD and the RBD, with residues L50 and T356 playing an important role.
BA.2.86 efficiently infects lung cells but exhibits low specific infectivity
We next investigated whether the efficient entry of BA.2.86pp into Calu-3 lung cells was reflected by robust Calu-3 cell infection with authentic BA.2.86. Inoculation of Calu-3 cells with B.1, BA.1 (which infects Calu-3 cells with similar low efficiency as compared to BA.233), BA.2.86, and EG.5.1.5 at a multiplicity of infection of 0.01 (titers were determined on Vero cells) resulted in pronounced cytopathic effects (CPE) in case of B.1, BA.2.86 and EG.5.1 infection (CPE severity: B.1 > BA.2.86 > EG.5.1.5), while CPE induced by BA.1 infection was moderate (Figure 3A). Quantitative RT-PCR analyses of viral genomes in culture supernatants detected markedly more genome equivalents of B.1 than BA.1 at 24 h and 48 h post infection, recapitulating our previous observation that B.1 is more adept at replicating in Calu-3 cells compared to BA.1 (Figure 3B).33 The number of EG.5.1.5 genome equivalents at 24 h and 48 h post infection was also reduced as compared to B.1 but the reduction was less pronounced as for BA.2.86 (Figure 3B). Finally, more BA.2.86 as compared to B.1 genome equivalents were detected at 24 h post infection, in agreement with robust entry of BA.2.86 into Calu.3 cells. The quantification of plaque forming units in culture supernatants yielded data for B.1, BA.1 and EG.5.1 that were similar to that obtained upon quantification of genome equivalents, with lower levels of BA.1 plaque forming units at 24 h and 48 h post infection as compared to B.1 and EG.5.1 (Figure 3C). Unexpectedly, however, no BA.2.86 plaque forming units were detected at 24 h and 48 h post infection and only low levels were detected at 72 h post infection although high levels of genome equivalents were present in culture supernatants at these time points (Figure 3B,C). Collectively, these findings confirm that BA.2.86 efficiently infects Calu-3 lung cells but also demonstrate that specific infectivity, i.e. the ratio between the number of infectious viruses and viral genome copies (Figure 3D), of BA.2.86 is low, at least under the conditions chosen.
Figure 3. Authentic BA.2.86 efficiently infects lung cells but exhibits low specific infectivity.
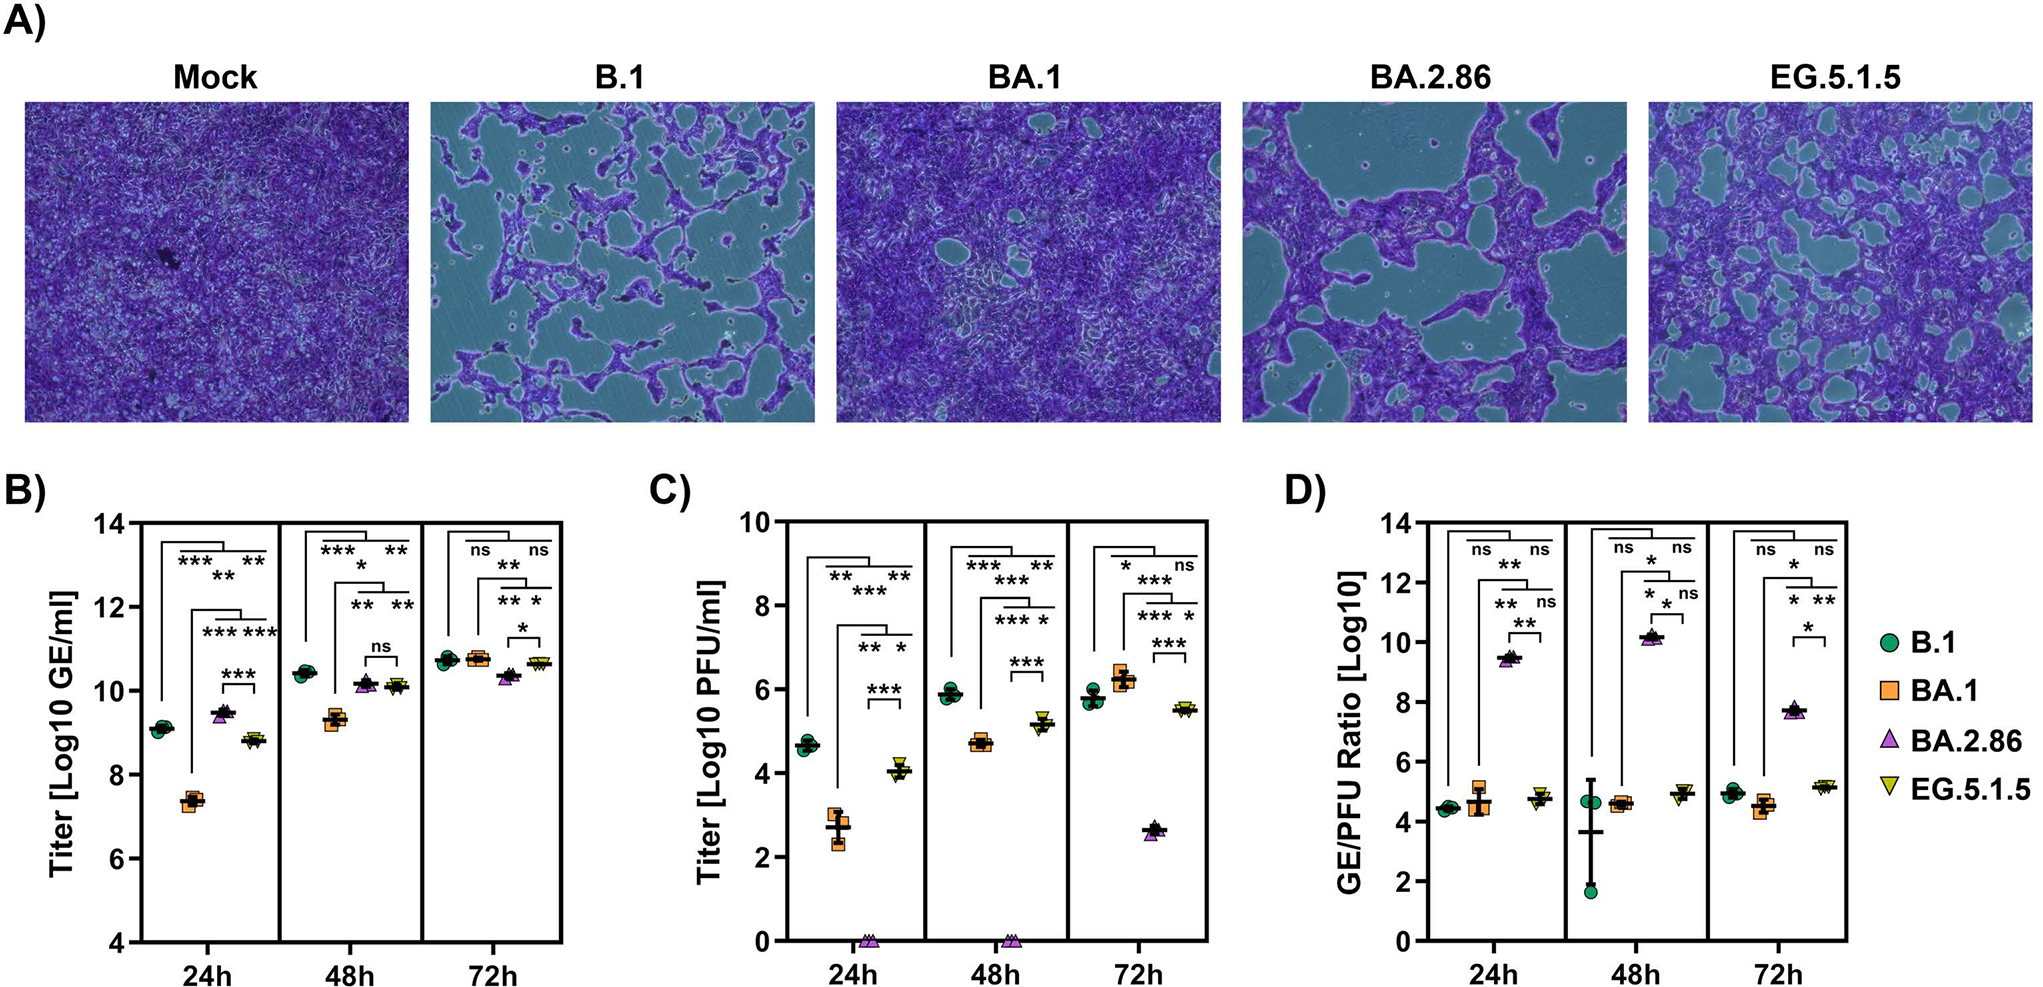
(A) Calu-3 cells were inoculated with the indicated SARS-CoV-2 lineages (MOI = 0.01). At six days postinoculation, cells were fixed, stained with crystal violet and analyzed for cytopathic effect formation by microscopy. Presented are representative microscopic images from three biological replicates (magnification = 10X).
(B) Calu-3 cells were inoculated with the indicated SARS-CoV-2 lineages (MOI = 0.01) and viral genomes released into the cell culture supernatant at 24, 48 and 72 h were quantified by qRT-PCR. The mean data from three biological replicates are shown. Error bars indicate the SD. Abbreviation: GE, genome equivalents.
(C) Calu-3 cells were inoculated with the indicated SARS-CoV-2 lineages (MOI = 0.01) and infectious virus released into the cell culture supernatant at 24, 48 and 72 h was quantified by plaque titration on Vero E6 cells. The mean data from three biological replicates are shown (Threshold = 1 plaque). Error bars indicate the SD. Abbreviation: PFU, plaque forming units.
(D) The specific infectivity of the indicated SARS-CoV-2 lineages was assessed based on the GE/PFU ratio. Graphs show mean GE/PFU ratios from three biological replicates. Error bars indicate the SD.
For panels B, C and D, Statistical significance was assessed by two-tailed Student’s t-test (ns, p > 0.05; *, p ≤ 0.05; **, p ≤ 0.01; ***, p ≤ 0.001).
BA.2.86 is highly resistant to therapeutic antibodies
Recombinant neutralizing antibodies targeting the RBD have been successfully used for COVID-19 therapy. Therefore, we asked whether BA.2.86pp are susceptible to inhibition by a panel of 12 antibodies previously approved for COVID-19 therapy or currently under development. The epitopes of these antibodies are known and all are altered by mutations present in BA.2.86 S protein (Figure 4A and Supplemental figure 4). Several antibodies, including Cilgavimab and Bebtelovimab, inhibited BA.2pp with high efficiency (Figure 4B). In contrast, only Sotrovimab showed appreciable activity against EG.5.1pp, although inhibition was reduced as compared to B.1pp (Figure 4B). Finally, none of the tested therapeutic antibodies was able to inhibit BA.2.86pp (Figure 4B), suggesting that the mutations located in the antibody epitopes interfered with antibody binding. Thus, BA.2.86 is highly resistant against therapeutic antibodies.
Figure 4. BA.2.86 efficiently evades neutralization by therapeutic monoclonal antibodies.
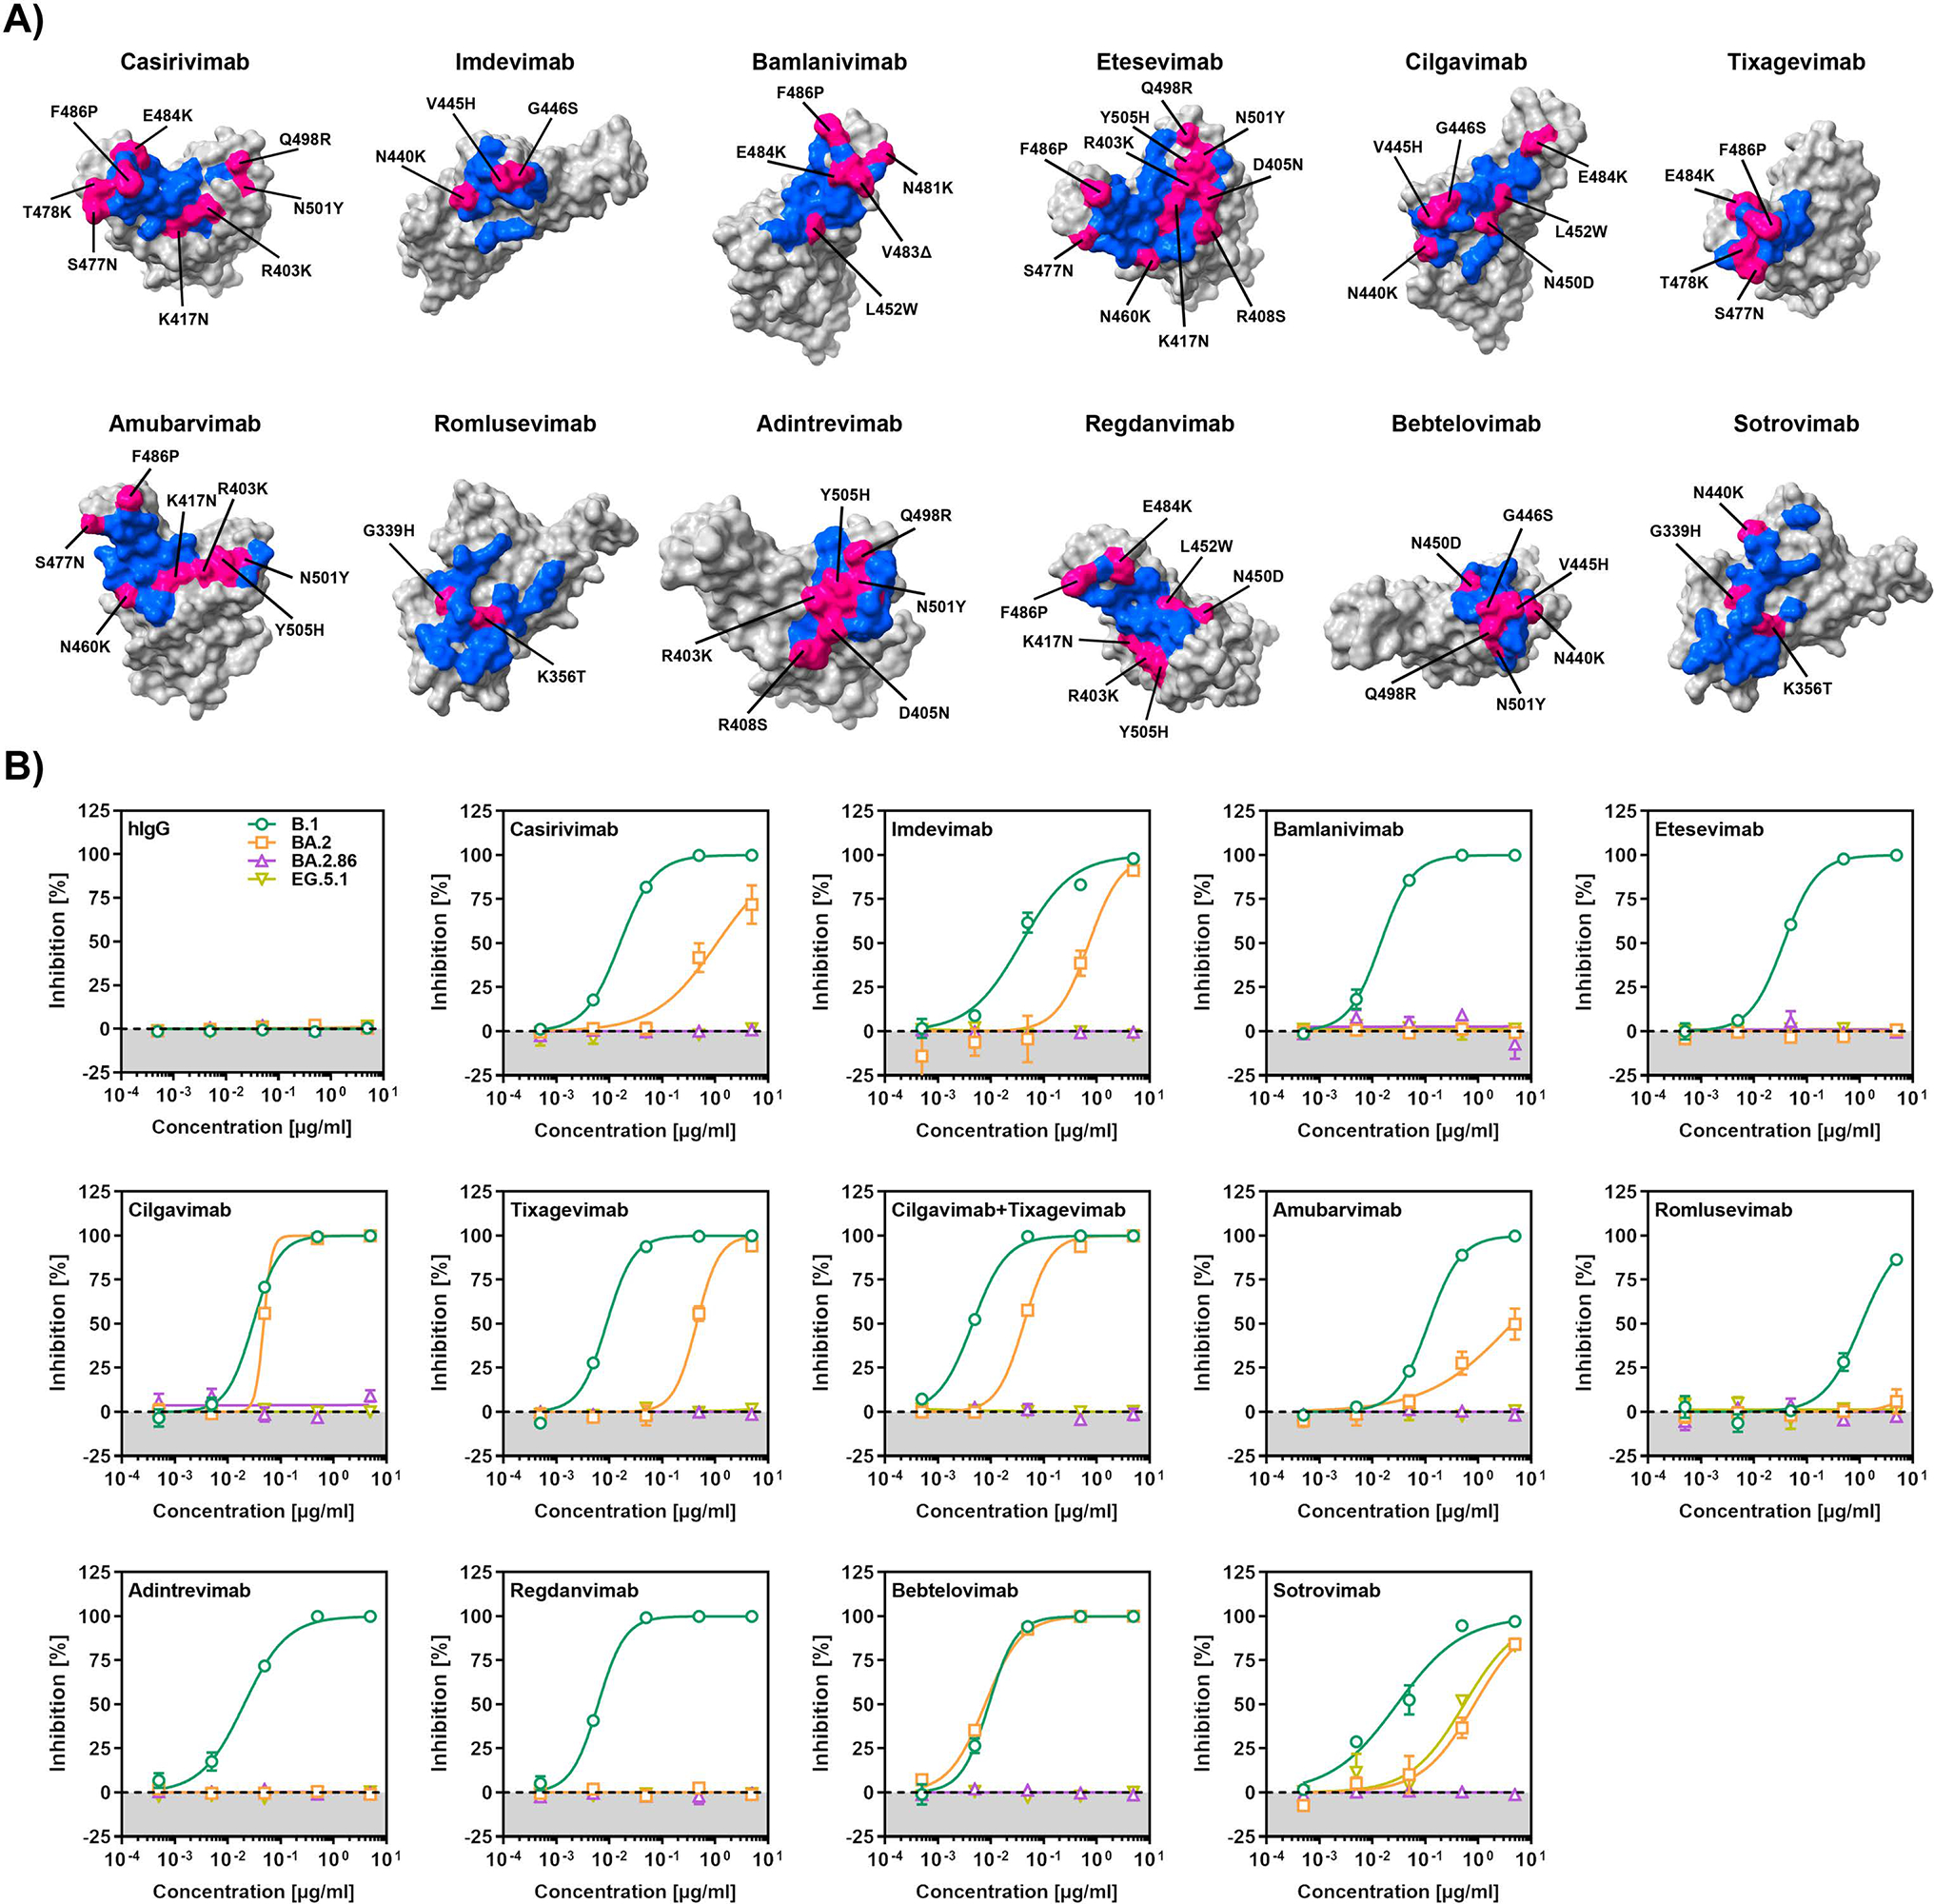
(A) Molecular footprint of therapeutic monoclonal antibodies (blue) on the SARS-CoV-2 RBD (grey). Footprint residues that are mutated in the context of BA.2.86 are highlighted (pink). Please also see supplementary figure S4.
(B) Particles pseudotyped with the indicated S proteins were preincubated (30 min, 37 °C) with the indicated concentrations of recombinant monoclonal antibodies before being inoculated onto Vero cells. S protein-driven cell entry was analyzed at 16–18 h postinoculation by measuring the activity of virus-encoded firefly luciferase in cell lysates. Presented are the mean from three biological replicates (each conducted with four technical replicates) in which S protein-driven cell entry in the absence of antibody was set as 0% inhibition. Please also see supplementary table S1.
BA.2.86 evades neutralizing antibodies induced upon infection and vaccination with high efficiency
We finally investigated BA.2.86 evasion of antibodies induced by vaccination and breakthrough infection (BTI) (Figure 5A–C and Supplemental figure 5A–B). We found that plasma obtained from donors upon quadruple COVID-19 vaccination neutralized BA.2pp with 3.4-fold reduced efficiency as compared to B.1pp while inhibition of BA.2.86pp was 28.1-fold reduced (Figure 5A, first panel). Antibody evasion of EG.5.1pp was even more prominent than that measured for BA.2.86pp (91-fold reduction relative to B.1pp (Figure 5A, first panel)). Similar findings were made for plasma from triple vaccinated donors with BTI during the BA.2 wave in Germany (Figure 5A and Supplemental figure 5A), with BA.2.86pp and EG.5.1pp evading neutralization by 28.3- and 73.9-fold, respectively, more efficiently than B.1pp, while BA.2pp showed only minor ability to evade neutralization (1.8-fold reduced compared to B.1pp) (Figure 5A, second panel). Further, BA.2.86pp and EG.5.1pp also evaded antibodies induced upon triple or quadruple vaccination and BTI during the BA.5 wave in Germany more efficiently than BA.2pp. Thus, neutralization of BA.2.86pp and EG.5.1pp was 15.5- and 35.5-fold, respectively, less efficient than that of B.1pp, while neutralization of BA.2pp was only 1.8-fold reduced (Figure 5A, third panel). Finally, plasma from vaccinated donors that received the XBB.1.5-adapted mRNA vaccine neutralized BA.2.86pp and EG.5.1pp appreciably and with roughly comparable efficiency (Figure 5A, fourths panel). Thus, neutralization of BA.2.86pp was 10.2- and neutralization of EG.5.1pp was 14.3-fold less efficient than that of B.1pp (Figure 5A, fourths panel). Again, BA.2pp evaded neutralization with substantially lower efficiency (1.5-fold reduced compared to B.1pp) compared to BA.2.86pp and EG.5.1pp.
Figure 5. BA.2.86 efficiently evades neutralization by antibodies induced upon vaccination or breakthrough infection.
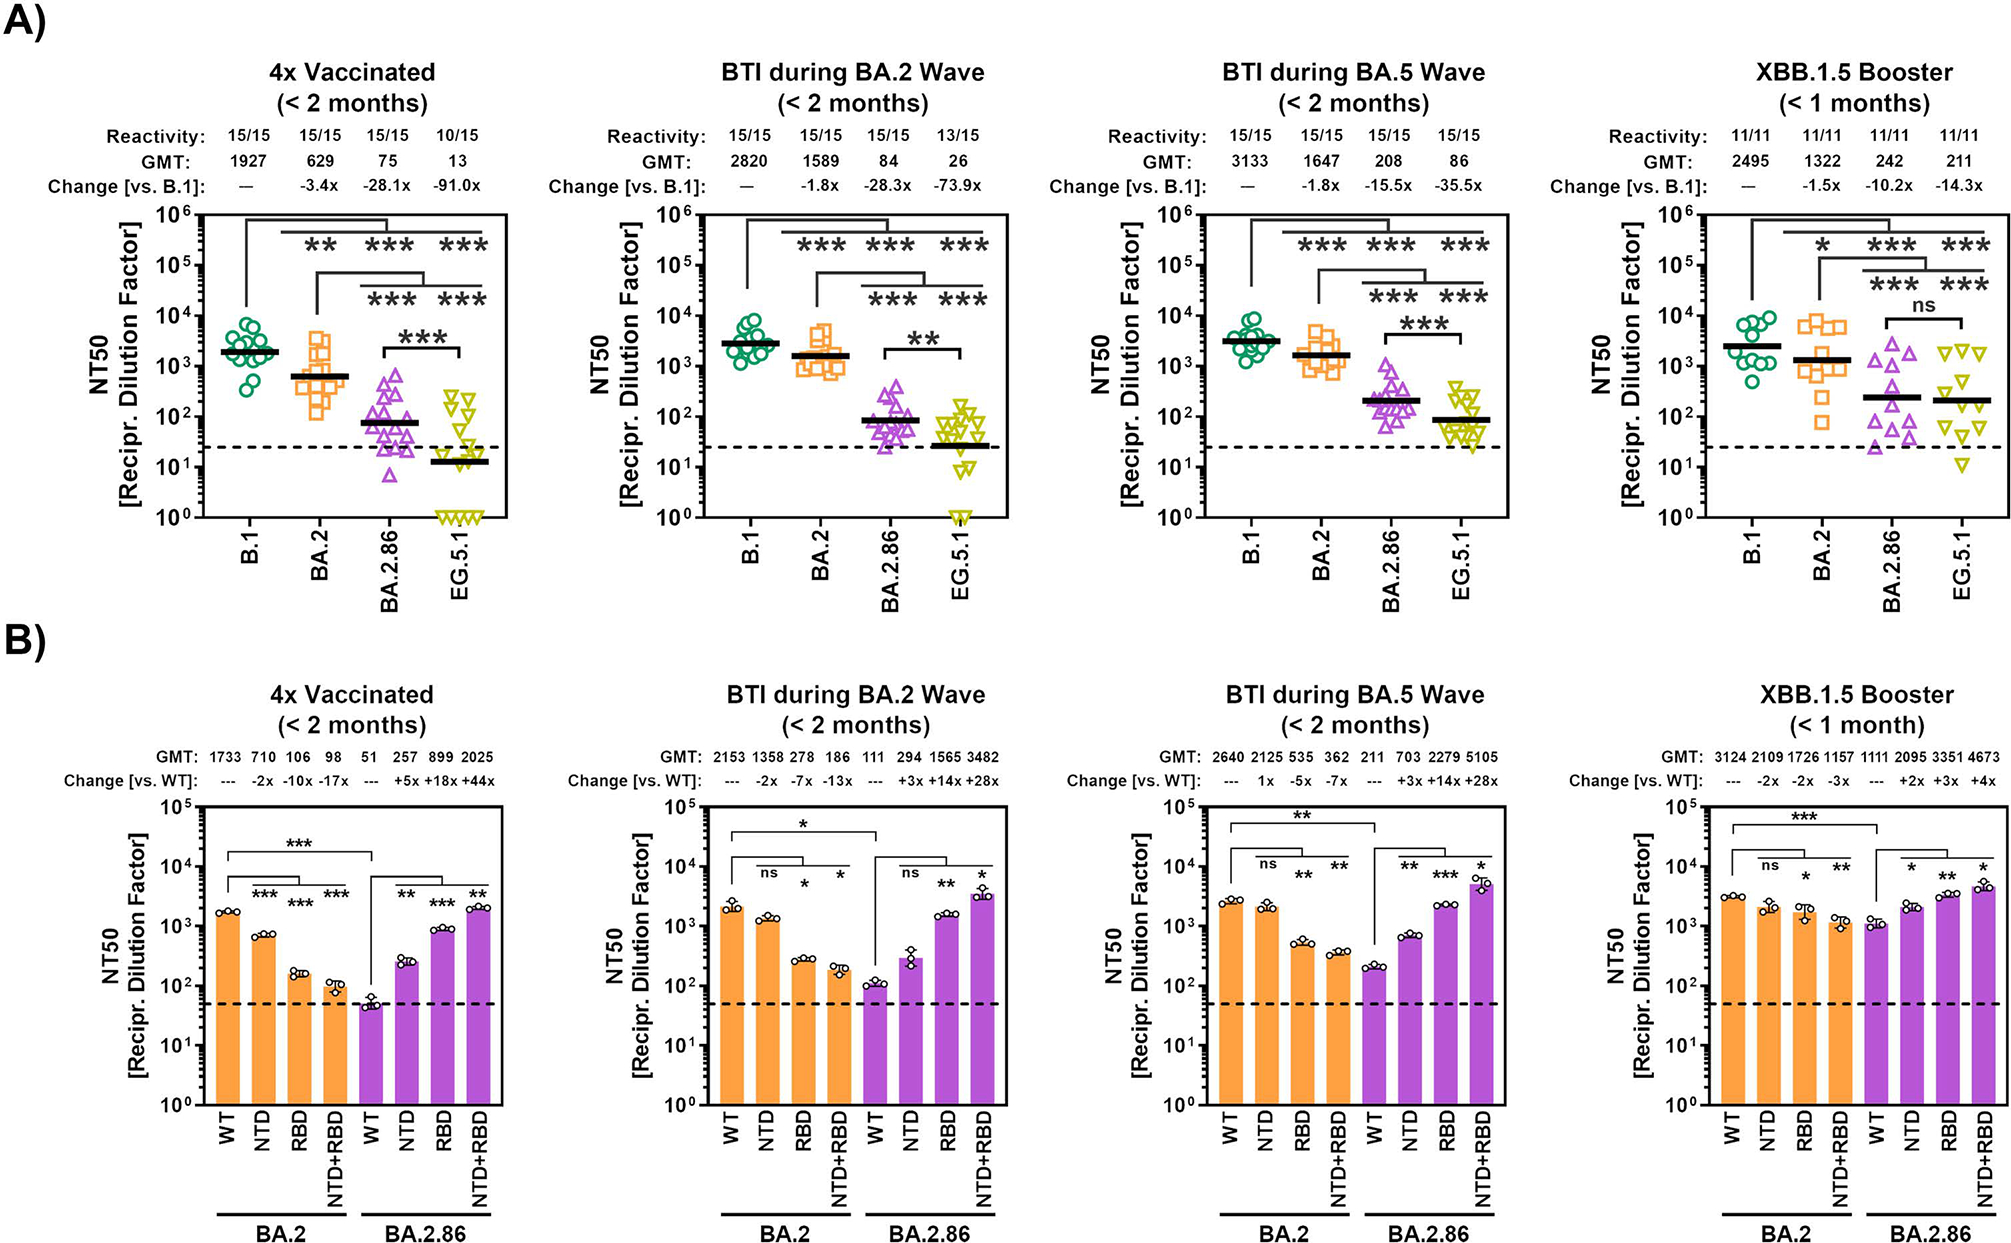
(A) Particles pseudotyped with the indicated S proteins were preincubated with plasma dilutions of people vaccinated with four doses of COVID-19 vaccines (n = 15, cohort 1), vaccinated with three vaccine doses and subsequent infection during the BA.2 wave in Germany (n = 15, cohort 2), vaccinated with three to four vaccine doses and subsequent infection during the BA.5 wave in Germany (n = 15, cohort 3), or vaccinated with the XBB.1.5-adapted booster vaccine (n = 11, cohort 4). Next, mixtures were inoculated onto Vero cells and inhibition of cell entry was analyzed at 16–18 h postinoculation as described above. Relative inhibition of pseudovirus entry was calculated using particles incubated in the absence of plasma as control (= 0% inhibition) and NT50 (neutralizing titer 50) values were calculated using a non-linear regression model. Samples that yielded NT50 values below 6.25 were considered negative and manually assigned an NT50 value of 1. The geometric mean NT50 data (GMT, indicate by black lines and numerical values on top of the graphs) from a single experiment, performed with four technical replicates are shown. The proportion of samples with detectable neutralizing activity as well as the fold change in neutralization compared to B.1 are indicated. Statistical significance was assessed by Wilcoxon matched-pairs signed rank test (ns, p > 0.05; *, p ≤ 0.05; **, p ≤ 0.01; ***, p ≤ 0.001). Please also see supplementary table S2 and supplementary figure 5 for more information.
(B) Particles pseudotyped with the indicated wildtype or chimeric S proteins were preincubated with cohort-specific pooled plasma dilutions and neutralization efficiency was analyzed as described for panel A. Data represent GMT with geometric mean SD from three biological replicates (each biological replicate conducted with four technical replicates). Statistical significance was assessed by two-tailed Student’s t-test (ns, p > 0.05; *, p ≤ 0.05; **, p ≤ 0.01; ***, p ≤ 0.001).
Next, we employed our chimeric S proteins (Figure 2C) to determine whether the NTD or the RBD or both were responsible for the increased antibody evasion of BA.2.86 S over BA.2 S. The exchange of the NTD had only a modest effect on neutralization sensitivity (Figure 5B). In contrast, the introduction of the RBD from BA.2.86 into BA.2 S protein markedly increased neutralization resistance while the reverse exchange profoundly augmented neutralization sensitivity of particles bearing BA.2.86 S protein, irrespective of the plasma samples tested (Figure 5B). In sum, BA.2.86 efficiently evades antibodies induced upon BTI and vaccination with non-adapted immunogens, although antibody evasion is not as prominent as that seen for EG.5.1, and the BA.2.86 RBD is largely responsible for antibody evasion. Nevertheless, an XBB.1.5-adapted vaccine should provide appreciable protection against BA.2.86 infection.
DISCUSSION
The coronavirus S protein is the main determinant of viral tropism and the central target of the neutralizing antibody response. The roughly 35 mutations in the S protein of the emerging SARS-CoV-2 lineage BA.2.86 present a large “jump” in the evolution of the Omicron variant and suggest that this virus might markedly differ from previously circulating ones in the ability to infect target cells, cause disease and evade immune control. Indeed, the present study provides evidence that BA.2.86 has lost an attenuation characteristic of most Omicron sublineages, the inefficient infection of lung cells.41–43 Further, our study reveals that BA.2.86 evades therapeutic, vaccine and BTI induced antibodies with high efficiency, indicating that BA.2.86 presents a health threat, particularly to known risk groups like immunocompromised patients and the elderly. However, we also provide evidence that antibodies elicited by booster vaccination with an XBB.1.5-adapted mRNA vaccine appreciably neutralize BA.2.86 and that BA.2.86 might exhibited low specific infectivity.
The low case numbers could be interpreted to mean that BA.2.86 might not be efficiently transmitted, perhaps because of insufficient amplification in the respiratory epithelium. However, the detection of BA.2.86 in multiple countries distributed over multiple continents11,12 is more compatible with appreciable transmission that remained undetected because of reduced monitoring efforts. Further, the present study shows that BA.2.86 S protein mediates robust entry into diverse cell lines including Calu-3 lung cells, as discussed below, indicating that BA.2.86 transmission is unlikely to be hampered by generally reduced host cell entry. The origin of the BA.2.86 lineage remains elusive at present and it cannot be excluded that the virus emerged due to evasion of vaccine-induced antibody responses. However, it should be noted that several S protein residues that are mutated in BA.2.86 compared to BA.2 (K356, V445, G446, N450, L452, and P621) were also found to be mutated in other Omicron sublineages following prolonged amplification in immunocompromised patients 44. Thus, similar as suggested for the Omicron variant,45 patients with reduced immune function might be a source of highly mutated viruses that can give SARS-CoV-2 evolution an unexpected twist.
The P681R mutation optimizes the S1/S2 cleavage site and increases the ability of the Delta variant to fuse lung cells and, when introduced into B.1, increases viral pathogenicity in hamsters.29 However, this increase was found to be modest in a separate study and the reverse exchange, R681P, did not reduce pathogenicity of the Delta variant in hamsters.34 The BA.2.86 S protein fused cells with higher efficiency than its counterpart from BA.2 and it is possible that P681R accounted for the increased fusogenicity. Further, the EG.5.1. S protein does not harbour the P681R exchange but fused cells more efficiently than BA.2.86 spike, exhibiting fusogenicity similar to that measured for B.1 S protein. However, the specific S protein mutations that are responsible for EG.5.1’s improved fusogenicity remain to be identified and might be located distant to the cleavage site.46 Further, it will be interesting to determine whether increased formation of syncytia is observed in BA.2.86 and EG.5.1 infected patients.
Lung cell entry driven by BA.2.86 S protein was markedly more efficient than that driven by the S proteins of BA.2 and EG.5.1 and was in fact comparable to that mediated by the S protein of B.1, which circulated in the early phase of the pandemic. We were able to link the increased lung cell entry of BA.2.86 to the NTD and, particularly, the RBD and identified the BA.2.86-specific mutations at residues 50 (S50L, NTD) and 356 (K356T, RBD) as important contributors to this phenotype. Further, the increased lung cell entry was associated with altered protease choice of BA.2.86 S protein, which, very much like B.1 S protein, used the TMPRSS2 dependent pathway for entry into lung cells. This finding has significant implications: The reduced ability of Omicron sublineages to infect lung cells, which might be due to a preference for cathepsin L or certain metalloproteinases over TMPRSS2,37–40,47 is believed to contribute to the attenuation of these viruses relative to previously circulating lineages.39,41–43 Our results suggest that BA.2.86 might have lost this attenuation and it will be important to determine in animal as well as clinical studies whether the virus shows augmented spread in the lung and increased capacity to cause disease. We previously found that increased (although not to the same level as B.1) Calu-3 lung cell entry of the Omicron sublineage BA.5 was associated with augmented lung infection in rodent and ferret models33 and two separate studies reached similar conclusions.48,49
The robust lung cell entry of particles pseudotyped with the BA.2.86 S protein was mirrored by efficient lung cell infection by authentic BA.2.86, as evidenced by the high amounts of genome copies in culture supernatants. However, the very same supernatants only contained low levels of infectious BA.2.86 particles, suggesting low specific infectivity of BA.2.86, a finding that was confirmed with Vero cells (not shown). Identifying the underlying reasons is beyond the scope of the present study and we can only speculate at this point. Thus, it is conceivable that the detection of BA.2.86 plaque forming units might be more efficient with a TMPRSS2 expressing cell line as compared to the TMPRSS2-negative Vero cells used in the present study. Further, it is possible that BA.2.86 infected cells, unlike cells infected by previously circulating lineages, produce a large amount of defective and potentially interfering particles, which would have implications for BA.2.86 spread and pathogenesis.
Monoclonal antibodies have been successfully used for treatment and prevention of COVID-19 and are of particular importance for risk groups like the elderly and immunocompromised individuals who do not mount protective responses upon vaccination. However, recent SARS-CoV-2 lineages are largely or fully resistant against these antibodies3,6,50–54 and the present study shows that BA.2.86 is no exception. With monoclonal antibodies not suitable for prevention and treatment of BA.2.86 infection, it will be important to determine whether BA.2.86 is susceptible to inhibition by other antivirals frequently used for COVID-19 treatment, particularly Remdesivir, Molnupiravir and Nirmatrelvir. Vaccines against COVID-19 induce neutralizing antibodies that can protect against infection. However, similar as for monoclonal antibodies, currently circulating SARS-CoV-2 lineages evade vaccine-induced antibodies with high efficiency2,4,5,51,55 and the present study shows that the same is true for BA.2.86. Thus, BA.2.86 evaded antibodies induced upon quadruple vaccination or induced upon vaccination and BTI during the BA.2 or BA.5 waves in Germany with much higher efficiency than BA.2, although not as efficiently as EG.5.1, and we found that the RBD of the BA.2.86 S protein was key to antibody evasion. In contrast to the efficient evasion of antibodies induced by infection and non-adapted vaccines that was also observed by recent studies,56–61 both BA.2.86 and EG.5.1 were appreciably neutralized by antibodies induced by an XBB.1.5-adapted mRNA vaccine, indicating that a fast roll out of adapted vaccines is called for.
Limitations of the study
We employed pseudotyped particles for the present study, a well-established surrogate system that adequately mimics SARS-CoV-2 entry into cells,35,36 and, formally, some of our results await confirmation with authentic SARS-CoV-2. Further, cell lines were used to study viral entry and its inhibition and these analyses should be extended to primary cells and organoids within future studies. In addition, evidence for a low specific infectivity of BA.2.86 was obtained and the underlying reasons remain to be elucidated. Finally, the following limitations apply to our study of BA.2.86 neutralization by plasma samples. Due to the small sample size for the three cohorts, we could not investigate a potential impact of biological factors (e.g. age or gender) on neutralization. Since all plasma samples were collected within two months following vaccination or BTI, we cannot make any statement on SARS-CoV-2 BA.2.86 neutralization after extended time periods post vaccination or BTI. For cohorts 2 and 3, no information on the infecting SARS-CoV-2 lineage is available and cohorts were collated based on the timing of infection and the dominant SARS-CoV-2 lineage at that time. Finally, neutralization sensitivity of SARS-CoV-2 BA.2.86 lineages may vary with respect to cohorts with immune backgrounds distinct from those examined in this study.
STAR METHODS
RESOURCE AVAILABILITY
Lead contact
Requests for material can be directed to Stefan Pöhlmann (spoehlmann@dpz.eu) and the lead contact Markus Hoffmann (mhoffmann@dpz.eu).
Materials availability
All materials and reagents will be made available upon installment of a material transfer agreement (MTA).
Data and code availability
All data reported in this paper will be shared by the lead contact upon request. This paper does not report original code. Any additional information required to reanalyze the data reported in this paper is available from the lead contact upon request.
EXPERIMENTAL MODEL AND STUDY PARTICIPANT DETAILS
Cell culture
Cultivation of cell lines was performed at 37 °C in a humidified atmosphere with 5% CO2. Cell line authentication was performed by short-tandem-repeat analysis, PCR-amplification and sequencing of a cytochrome c oxidase gene fragment, microscopic examination, and/or based on growth characteristics. In addition, all cell lines were regularly tested for the absence of contamination by mycoplasma. Vero cells (African green monkey kidney, female, kidney; CRL-1586, ATCC; RRID: CVCL 0574, kindly provided by Andrea Maisner), 293T cells (human, female, kidney; ACC-635, DSMZ; RRID: CVCL 0063) and Huh-7 cells (human, male, liver; JCRB, JCRB0403; RRID: CVCL_0336, kindly provided by Thomas Pietschmann) were maintained in Dulbecco's modified Eagle medium (DMEM; PAN-Biotech), supplemented with 10% fetal bovine serum (FBS, Biochrom), 1% penicillin/streptomycin solution (pen/strep, PAN-Biotech). Caco-2 cells (human, male, colon; HTB-37, ATCC, RRID: CVCL_0025) were maintained in minimum essential medium (Thermo Fisher Scientific) supplemented with 10% FBS, 1% pen/strep solution, 1% non-essential amino acid solution (PAA) and 1 mM sodium pyruvate (PAN-Biotech). Calu-3 cells (human, male, lung; HTB-55, ATCC; RRID: CVCL_0609, kindly provided by Stephan Ludwig) were maintained in DMEM/F-12 medium (Thermo Fisher Scientific) supplemented with 10% FBS, 1% pen/strep solution, 1% non-essential amino acid solution and 1 mM sodium pyruvate. Vero-ACE2/TMPRSS2 cells were generated by retroviral transduction of Vero-TMPRSS2 cells16 with a murine leukaemia virus vector delivering the genetic information for human ACE2 followed by selection with 5 μg/ml of puromycin (Invivogen). Cells were further maintained in DMEM (PAN-Biotech), supplemented with 10% FBS, 1% pen/strep solution, 2 μg/ml blasticidin (Invivogen) and 1 μg/ml puromycin. Transfection of cell lines was performed by calcium phosphate precipitation.
Human subjects
Plasma samples from donors corresponding to four cohorts were tested: cohort 1: individuals with a history of four vaccinations but no infection (SARS-CoV-2 infection-free status was verified by absence of anti-SARS-CoV-2 nucleocapsid protein (NCP) IgG using the Anti-SARS-CoV-2 NCP ELISA (IgG) [EUROIMMUN]), collection within two months after the last vaccination (n = 15; median age = 51 years; male to female ratio 5:10), cohort 2: three times vaccinated individuals that experienced a breakthrough infection (BTI) between February and May 2022 in Germany (n = 15; median age = 40 years; male to female ratio 8:7); cohort 3: three to four times vaccinated individuals with BTI between July and October 2022 in Germany (n = 15; median age = 49 years; male to female ratio 6:9); cohort 4: individuals vaccinated with the XBB.1.5-adapted updated vaccine as booster, no known BTI and no anti-SARS-CoV-2 NCP IgG, collection two weeks after vaccination (n = 11; median age = 48 years; male to female ratio 4:7). Please see the supplementary table 2 for detailed information. All plasma samples were collected within two months post vaccination or infection and heat-inactivated (56 °C, 30 min) before their use in neutralization assays. Plasma samples were collected following approval by the research ethics committee of the Institutional Review Board of Hannover Medical School (8973 BO K 2020). All donors provided written informed consent prior to the use of their plasma for research.
METHOD DETAILS
Expression plasmids and sequence analysis
Expression plasmids pCAGGS-DsRed,16 pCAGGS-VSV-G,62 pCG1-SARS-CoV-2 B.1 SΔ18 (codon-optimized, C-terminal truncation of 18 amino acid residues),63 pCG1-SARS-CoV-2 BA.2 SΔ18 (codon-optimized, C-terminal truncation of 18 amino acid residues),64 pQCXIP-human ACE2-cMYC,65 pCG1_solACE2-Fc,66 pQCXIP-beta-galactosidase alpha fragment,67 and pQCXIP-beta-galactosidase omega fragment67 have been described before. Plasmid SARS-CoV-2 EG.5.1 SΔ18 was constructed by PCR-based introduction of mutations Q52H and F456L into plasmid pCG1-SARS-CoV-2 XBB.1.5 SΔ183 with overlapping primers harbouring the respective mutations. Plasmid SARS-CoV-2 BA.2.86 SΔ18 was constructed by Gibson assembly. For this, six overlapping DNA strings (Thermo Fisher Scientific), linearized (BamHI/XbaI digested) pCG1 plasmid and GeneArt Gibson Assembly HiFi Master Mix (Thermo Fisher Scientific) were mixed and incubated for 60 min at 50 °C. Thereafter, mixtures were transformed into One Shot™ OmniMAX™ 2 T1R chemically-competent Escherichia coli bacteria (Thermo Fisher Scientific) and bacterial colonies were screened for presence of the plasmid by colony-PCR with primers targeting the S protein open reading frame. Chimeric BA.2 and BA.2.86 S proteins in which either NTD, RBD or NTD+RBD are interchanged were constructed by overlap-extension PCR. Finally, the integrity of all S protein sequences was confirmed by Sanger sequencing using a commercial service (Microsynth SeqLab). The pCG1 expression plasmid was a kind gift of Roberto Cattaneo (Mayo Clinic, Rochester, MN, USA). Information SARS-CoV-2 lineages and their respective mutations was retrieved from GISAID (Global Initiative on Sharing All Influenza Data) (https://gisaid.org/) and CoV-Spectrum (https://cov-spectrum.org/) databases on 26th of August 2023.
Production of soluble human ACE2-Fc
At 24 h post seeding, 293T cells were transfected with expression plasmid for soluble human ACE2, which is C-terminally linked to the Fc-portion of human immunoglobulin G (solACE2-Fc). At 10 h posttransfection, the medium was replaced and cells were further incubated for 38 h. Next, the culture supernatant was collected and cells were pelleted by centrifugation (2,000 x g, 10 min, 4°C). The clarified supernatant was then loaded onto Vivaspin protein concentrator columns (30 kDa molecular weight cut-off; Sartorius) and centrifuged (4,000 x g, 4°C) until the sample was concentrated by a factor of 20. Finally, the concentrated solACE2-Fc was aliquoted and stored at −80° until further use.
ACE2 binding assay
At 24 h post seeding, 293T cells were transfected with expression plasmids for the respective S protein or empty vector. The medium was changed 24 hours after transfection and cells were further incubated. At 48 h posttransfection, the medium was removed, cells washed with phosphate-buffered saline (PBS) and subsequently resuspended in PBS-B (PBS containing 1% bovine serum albumin [BSA; Carl Roth]). Following pelleting of the cells by centrifugation (600 x g, 5 min, room temperature), the supernatant was removed, cells were resuspended in 250 μl PBS-B containing solACE2-Fc (at a dilution of 1:20) and incubated for 1 h at 4 °C using a Rotospin test tube rotator disk (IKA). Next, cells were pelleted by centrifugation (600 x g, 5 min, room temperature), washed with PBS-B, resuspended in 250 μl PBS-B containing Alexa Fluor-488-conjugated anti-human antibody (1:200; Thermo Fisher Scientific, A-11013) and rotated for 60 minutes at 4 °C. Thereafter, cells were pelleted by centrifugation (600 x g, 5 min, room temperature), washed with PBS-B, resuspended in 250 μl of 1 % paraformaldehyde solution and incubated for 30 min at room temperature for fixation. Finally, cells were pelleted by centrifugation (600 x g, 5 min, room temperature), washed with PBS-B, resuspended in 100 μl PBS-B before ACE2 binding was analyzed using an ID7000 Spectral Cell Analyzer along with the ID7000 software (Sony Biotechnology, San Jose, CA, USA).
Analysis of cell surface expression of S proteins
At 24 h post seeding, 293T cells were transfected with expression plasmids for the respective S protein or empty vector. The medium was changed 24 hours after transfection and cells were further incubated. At 48 h posttransfection, the medium was removed, cells washed with PBS and subsequently resuspended in PBS-B. Following pelleting of the cells by centrifugation (600 x g, 5 min, room temperature), the supernatant was removed, cells were resuspended in 250 μl PBS-B containing anti-SARS-CoV-2 S2 (1:100; GTX632604, Biozol) and incubated for 1 h at 4 °C using a Rotospin test tube rotator disk (IKA). Next, cells were pelleted by centrifugation (600 x g, 5 min, room temperature), washed with PBS-B, resuspended in 250 μl PBS-B containing Alexa Fluor-488-conjugated anti-mouse antibody (1:200; Thermo Fisher Scientific, A-10667) and rotated for 60 minutes at 4 °C. Thereafter, cells were pelleted by centrifugation (600 x g, 5 min, room temperature), washed with PBS-B, resuspended in 250 μl of 1 % paraformaldehyde solution and incubated for 30 min at room temperature for fixation. Finally, cells were pelleted by centrifugation (600 x g, 5 min, room temperature), washed with PBS-B, resuspended in 100 μl PBS-B before S protein expression was analyzed using an ID7000 Spectral Cell Analyzer along with the ID7000 software (Sony Biotechnology, San Jose, CA, USA).
Cell-cell fusion assay
At 24 h post seeding, effector 293T cells were cotransfected with expression plasmids for the respective S protein (or empty vector) and the beta-galactosidase alpha fragment, while target 293T cells were cotransfected with expression plasmids for human ACE2 and the beta-galactosidase omega fragment. Following an incubation period of 18 h, cells were washed with PBS and further incubated with fresh culture medium for 6 h, before target cells were washed with PBS, resuspended in fresh medium and added on top of effector cells. Co-cultivation on effector and target cells was allowed for 18 h, before S protein-driven cell-cell fusion was analysed. For this, cells beta-galactosidase substrate (Gal-Screen, Thermo Fisher Scientific) was added to the cells and cells were incubated for 90 min, before luminescence was recorded using a Hidex Sense plate luminometer (Hidex).
Pseudovirus particle production
Pseudovirus particle production was performed according to a previously published protocol.68 In brief, 293T cells were transfected with expression plasmid for the respective S protein, VSV-G, or DsRed (negative control). At 24 h posttransfection, cells were washed with PBS and inoculated with VSV-G-trans-complemented VSV*ΔG(FLuc) (kindly provided by Gert Zimmer).69 After 1 h of incubation at 37 °C, cells were washed with PBS and medium containing anti-VSV-G antibody (culture supernatant from I1-hybridoma cells; ATCC no. CRL-2700) was added (of note, cells expressing VSV-G received medium without antibody). At 16–18 h postinoculation, culture supernatants were harvested and cleared from cellular debris by centrifugation (4,000 x g, 10 min). Clarified supernatants were aliquoted and stored at −80 °C until further use.
Analysis of S protein particle incorporation and cleavage
Particle incorporation of SARS-CoV-2 S proteins and S protein cleavage were analyzed by SDS-PAGE and immunoblot. For this, pseudotype particles were concentrated by high-speed centrifugation (13,300 rpm, 90 min, 4 °C) through a sucrose cushion (20 % w/v sucrose in PBS) and subsequently lysed by addition of 1 volume of 2x Sample buffer (0.03 M Tris-HCl, 10% glycerol, 2% SDS, 5% beta-mercaptoethanol, 0.2% bromophenol blue, 1 mM EDTA) and heating at 96 °C for 15 min. Lysates were subjected to SDS-PAGE and subsequently proteins were blotted onto nitrocellulose membranes (Hartenstein). After blotting, membranes were blocked for 30 minutes in 5% BSA and subsequently incubated overnight at 4 °C with primary antibodies reactive against S2 (SARS-CoV-2 (2019-nCoV) Spike S2 Antibody, Rabbit PAb, antigen affinity purified (1:2000, Biozol, Cat: SIN-40590-T62)) or anti-VSV-M [23H12] antibody (1:1000, Kerafast, Cat: EB0011)). Afterwards, the membranes were washed three times with PBS-T and probed for 1 h at 4 °C with horseradish peroxidase-conjugated anti-rabbit (S2, goat IgG anti-rabbit IgG (H+L)-HRPO (Dianova, Cat: 111–035-003), diluted 1:2000 in 5% BSA) or anti-mouse (VSV-M, goat IgG anti-mouse IgG (H+L)-HRPO (Dianova, Cat: 115–035-045), diluted 1:2000 in PBS-T containing 5% skim milk) secondary antibodies. Following incubation, membranes were washed three times with PBS-T and developed using a home-made chemiluminescence solution (0.1 M Tris-HCl [pH 8.6], 250 g/ml luminol, 0.1 mg/ml para-hydroxycoumaric acid, 0.3 percent hydrogen peroxide) and the ChemoCam imaging system with ChemoStar Professional software (Intas Science Imaging Instruments). Protein bands were quantified using the ImageJ software (version 1.53C, https://imagej.nih.gov/ij/) as follows: (i) for the assessment of S protein incorporation into pseudovirus particles, total S protein signals (uncleaved, S0, and cleaved, S2) were normalized against their respective VSV-M signals and the resulting values were further normalized against the B.1 S protein (set as 1); (ii) for the assessment of S protein cleavage, total signals for individual S proteins (combined signal for uncleaved [S0] and cleaved [S2] S protein) were first set to 100% and then the proportion of cleaved S protein [S2] was calculated.
Analysis of S protein-driven cell entry
In order to investigate cell tropism and host cell entry efficiency, equal volumes of pseudovirus particles bearing different SARS-CoV-2 S proteins, VSV-G or no viral glycoprotein (negative control) were inoculated onto target cell that were grown in 96-well plates. After an incubation period of 16–18 h at 37 °C, S protein-driven cell entry was analyzed by measuring the activity of virus-encoded firefly luciferase activity in cell lysates. For this, the culture medium was aspirated and PBS containing 0.5% Tergitol 15-S-9 (Carl Roth) was added to the cells. Following an incubation period of 30 min at room temperature, cell lysates were transferred into white 96-well plates, mixed with luciferase substrate (Beetle-Juice, PJK), and luminescence was recorded using a Hidex Sense plate luminometer (Hidex). For entry experiments assessing the impact of protease inhibitors MDL28170 (Sigma-Aldrich) and Camostat mesylate (Sigma-Aldrich) on S protein-driven cell entry, target cells were incubated for 1 h with medium containing different inhibitor concentrations or diluent (DMSO, control) prior to addition of pseudovirus particles.
Analysis of ACE2-dependency for S protein-driven cell entry
Vero cells that were grown in 96-well plates were incubated for 30 min at 37 °C with serial dilutions of ACE2-blocking anti-ACE2 antibody (Sino Biologicals, 10108-MM36). Next, pseudovirus particles bearing VSV-G or SARS-CoV-2 S proteins were added and cells were further incubated for 16–18 h postinoculation, before pseudovirus cell entry was analyzed as described above.
Infection experiments with authentic SARS-CoV-2
SARS-CoV-2 strains were curated in the strain collection of the German National Reference Centre for Coronaviruses at Charité Virology, involving culture on Vero-TMPRSS2 cells, concentration and cleanup by ultrafiltration, titration on Vero-TMPRSS2 cells, and full genome sequencing. Strain references are: B.1 – ChVir-984/2020; BA.1 – ChVir26335/2021; BA.2.86 – ChVir44057/2023; EG.5.1.5 – ChVir43769/2023. The BA.2.86 strain (hCoV-19/France/IDF-IPP17625/2023) used here was supplied by the French National Reference Centre for Viruses of Respiratory Infections hosted by Institut Pasteur, through EVAg (https://www.european-virus-archive.com/). The human sample from which it was isolated was provided by Dr Aude Lesenne from Cerballiance, Lisses (France).
For analysis of cytopathic effects, Calu-3 cells were inoculated with SARS-CoV-2 lineages B.1, BA.1, BA.2.86 or EG.5.1.5 at a multiplicity of infection (MOI) of 0.01 for 1 h. Thereafter, the inoculum was removed, cells were washed with PBS and further incubated with fresh medium for six days. Next, the culture supernatant was aspirated and cells were washed and fixed. Finally, cells were stained with crystal violet and analyzed for cytopathic effect formation by light microscopy at a magnification of 10 x using a Zeiss Axio microscope.
For quantification of virus replication by qRT-PCR, Calu-3 cells were inoculated with SARS-CoV-2 lineages B.1, BA.1, BA.2.86 or EG.5.1.5 at an MOI of 0.01 for 1 h. Thereafter, the inoculum was removed, cells were washed with PBS and further incubated with fresh medium. At 24, 48 and 72 h post inoculation a fraction of the culture supernatant (50 μl) was collected, diluted in 300 μl of MagNA Pure96 external lysis reagent (Roche), and stored at −80 °C until sampling was completed. RNA extraction and quantification of SARS-CoV-2 genomes by E gene qRT-PCR was performed according to a published protocol.70
For quantification of virus replication by plaque assay, Calu-3 cells were inoculated with SARS-CoV-2 lineages B.1, BA.1, BA.2.86 or EG.5.1.5 at an MOI of 0.01 for 1 h. Thereafter, the inoculum was removed, cells were washed with PBS and further incubated with fresh medium. At 24, 48 and 72 h postinoculation a fraction of the culture supernatant (150 μl) was collected, diluted 1:2 in virus preservation medium and stored at −80 °C until sampling was completed. Quantification of infectious SARS-CoV-2 progeny by plaque titration on Vero E6 cells was performed according to a published protocol.71
Neutralization assay
Neutralization assays were performed according to a previously published protocol.67 In brief, pseudovirus particles were incubated for 30 min at 37 °C in the presence of different dilutions of monoclonal antibody (mAb; 10, 1, 0.1, 0.01, 0.001 μg/ml) or plasma from donors (1:25, 1:100, 1:400, 1:1,600, 1:6,400). Of note, pseudovirus particles incubated in the absence of mAb/plasma served as controls. Following incubation, the mixtures were inoculated onto Vero cells that were grown in 96-well plates. Cells were further incubated for 16–18 h postinoculation, before pseudovirus cell entry was analyzed as described above and neutralization efficiency was later determined based on the relative inhibition of pseudovirus entry, using signals obtained from pseudovirus particles incubated in the absence of mAb/plasma as reference (= 0% inhibition). Further, a non-linear regression model was used to determine the mAb (inhibitory concentration 50, IC50) and plasma (neutralizing titer 50, NT50) dilutions required for half-maximal inhibition. Of note, plasma samples that did not yield an NT50 value of 6.25 or higher were considered negative and assigned an NT50 value of 1.
QUANTIFICATION AND STATISTICAL ANALYSIS
Data analysis was performed using Microsoft Excel (part of Microsoft Office Professional Plus, version 2016, Microsoft Corporation) and GraphPad Prism version 8.3.0 (GraphPad Software). Statistical significance was assessed by two-tailed Student’s t-test with Welch correction, two-way analysis of variance with Tukey’s posttest, or Wilcoxon matched-pairs signed rank test (plasma neutralization data). Only p values of 0.05 or lower were considered statistically significant (ns [not significant], p > 0.05; *, p ≤ 0.05; **, p ≤ 0.01; ***, p ≤ 0.001).
Supplementary Material
Figure S2: Cell line tropism and entry efficiency of particles bearing SARS-CoV-2 S proteins (related to Figure 1).
(A) 293T cells expressing the indicated S proteins (or no S protein, control) were incubated with anti-SARS-CoV-2 S2 and Alexa Fluor-488-conjugated secondary antibodies, before being subjected to flow cytometry in order to investigate S protein cell surface expression. Presented are the normalized mean data from six biological replicates (performed single samples) in which cell surface expression was normalized against B.1 S (set as 1). Error bars represent the standard error of the mean (SEM). Statistical significance was assessed by two-tailed Student’s t-test (not significant [ns], p > 0.05; *, p ≤ 0.05; **, p ≤ 0.01; ***, p ≤ 0.001).
(B) Effector 293T cells coexpressing the indicated S protein and the beta-galactosidase alpha fragment were mixed and coincubated with target 293T cells coexpressing ACE2 and the beta-galactosidase omega fragment. At 18h post mixing, S protein-driven cell-cell fusion was analyzed by measuring the activity of reconstituted beta-galactosidase. Presented are the normalized mean data from four biological replicates (performed with three technical replicates) in which fusion was normalized against control samples (coincubation of target cells with effector cells that did not express any S protein; set as 1). Error bars represent the SEM.
(C) Pseudovirus particles bearing the indicated S proteins (or no S protein, control) were concentrated by centrifugation, lysed and subjected to SDS-PAGE and immunoblot analysis using antibodies targeting the SARS-CoV-2 S2 subunit or VSV-M (loading control). The results of a representative immunoblot are shown and data were confirmed in five additional experiments. Numbers on the left indicate the molecular weight in kilodalton. Further, bands representing uncleaved (S0) and cleaved (S2) S protein are highlighted.
(D) Quantification of S protein incorporation into pseudovirus particles. Graphs show mean S protein particle incorporation data (obtained from six biological replicates) for which S protein signals were first normalized against their respective loading controls (VSV-M signals) and the resulting values were normalized against B.1 S (set as 1). Error bars indicate the SEM.
(E) Quantification of S protein cleavage efficiency. Graphs show mean S protein cleavage efficiency data (obtained from six biological replicates) representing the relative share of cleaved S protein (S2) from total S protein (uncleaved [S0] plus cleaved [S2] S protein, set as 100 %). Error bars indicate the SEM.
(F) Pseudovirus particles bearing the indicated S proteins or vesicular stomatitis virus glycoprotein (VSV-G) were inoculated onto Vero (African green monkey, kidney), Vero-ACE2+TMPRSS2 (Vero cells stably expressing ACE2 and TMPRSS2), 293T (human, kidney), Huh-7 (human, liver), Caco-2 (human, colon), and Calu-3 (human, lung) cells. Cell entry was analyzed at 16–18 h postinoculation by measuring luciferase activity in cell lysates. Presented are the normalized mean data from six biological replicates (performed with four technical replicates) in which cell entry was normalized against particles bearing no viral glycoprotein (set as 1). Error bars represent the SEM.
(G) 293T cell expressing the indicated S protein or no S protein (control) were subsequently incubated with soluble ACE2-Fc and Alexa Fluor-488-conjugated anti-human antibody, and subjected to flow cytometry to analyze ACE2 binding. Presented are the mean fluorescence intensity data from six biological replicates (performed with single samples). Error bars represent the standard deviation (SD).
(H) Vero cells were pretreated with different concentrations of anti-ACE2 antibody and subsequently inoculated with pseudovirus particles bearing the indicated S proteins or VSV-G. Cell entry was analyzed at 16–18 h postinoculation as described above. Presented are the normalized mean data from three biological replicates (performed with four technical replicates) in which cell entry was normalized against particles bearing no viral glycoprotein (set as 1). Error bars represent the SEM.
Figure S4: Overview of BA.2.86-specific S protein mutations in the context of epitopes recognized by therapeutic monoclonal antibodies (related to Figure 4).
(A) Summary of residues forming the RBD of the SARS-CoV-2 S protein (numbering according to the S protein of the SARS-CoV-2 Wuhan-Hu-01 isolate) with mutations specific to SARS-CoV-2 lineages BA.2, BA.2.86 and EG.5.1 highlighted (blue). RBD residues that contact ACE2 (green) or that form epitopes recognized by therapeutic monoclonal antibodies (pink) are highlighted.
Figure S3: Impact of the NTD and RBD on augmented Calu-3 cell entry by particles bearing BA.2.86 S (related to Figure 2).
(A) Pseudovirus particles bearing the indicated wildtype (WT) or chimeric S proteins (or no S protein, control) were concentrated by centrifugation, lysed and subjected to SDS-PAGE and immunoblot analysis using antibodies targeting the SARS-CoV-2 S2 subunit or VSV-M (loading control). The results of a representative immunoblot are shown and data were confirmed in two additional experiments. Numbers on the left indicate the molecular weight in kilodalton. Further, bands representing uncleaved (S0) and cleaved (S2) S protein are highlighted.
(B) Pseudovirus particles bearing the indicated WT or chimeric S proteins, or VSV-G were inoculated onto Vero and Calu-3 cells. Cell entry was analyzed at 16–18 h postinoculation by measuring luciferase activity in cell lysates. Presented are the normalized mean data from six biological replicates (performed with four technical replicates) in which cell entry was normalized against particles bearing no viral glycoprotein (set as 1). Error bars represent the SEM.
(C) Pseudovirus particles bearing the indicated WT or mutant S proteins were inoculated onto Vero and Calu-3 cells. Cell entry was analyzed at 16–18 h postinoculation by measuring luciferase activity in cell lysates. Presented are the normalized mean data from six biological replicates (performed with four technical replicates) in which cell entry was normalized against particles bearing BA.2.86-S WT (set as 1; grey areas indicate the threshold for specific effects = +/- 1.5-fold change in cell entry compared to BA.2.86-S WT). Error bars represent the SEM. Statistical significance was assessed by two-tailed Student’s t-test ([ns, p > 0.05; *, p ≤ 0.05; **, p ≤ 0.01; ***, p ≤ 0.001).
(D) Pseudovirus particles bearing the indicated WT or mutant S proteins were concentrated by centrifugation, lysed and subjected to SDS-PAGE and immunoblot analysis using antibodies targeting the SARS-CoV-2 S2 subunit or VSV-M (loading control). The results of a representative immunoblot are shown and data were confirmed in two additional experiments. Numbers on the left indicate the molecular weight in kilodalton. Further, bands representing uncleaved (S0) and cleaved (S2) S protein are highlighted.
Table S2, related to figure 5: Information on plasma samples
Table S1, related to figure 4: mAb EC50 values
Figure S5: Sensitivity of BA.2.86 to neutralization by antibodies induced by infection and/or vaccination (related to Figure 5).
(A) Frequency of major SARS-CoV-2 lineages circulating from 2022 to 2023 in Germany and sampling period for cohorts 2 and 3. Data were retrieved from the CoV-Spectrum (https://cov-spectrum.org/) database on 26th of August 2023.
(B) Particles pseudotyped with the indicated S proteins were preincubated with plasma dilutions of people vaccinated with four doses of COVID-19 vaccines (n = 15, cohort 1), vaccinated with three vaccine doses and subsequent infection during the BA.2 wave in Germany (n = 15, cohort 2), vaccinated with three to four vaccine doses and subsequent infection during the BA.5 wave in Germany (n = 15, cohort 3), or vaccinated with the XBB.1.5-adapted booster vaccine (n = 11, cohort 4). Next, mixtures were inoculated onto Vero cells and inhibition of cell entry was analyzed at 16–18 h postinoculation as described above. Presented are the normalized mean data from one biological replicates (performed with four technical replicates) in which cell entry was normalized against particles incubated in the absence of plasma (set as 0% inhibition). Error bars represent the SD.
Figure S1: Prevalence of the SARS-CoV-2 BA.2.86 lineage (related to the main text).
(A) Frequency of major contemporary SARS-CoV-2 lineages on different continents (seven day sliding window). Data were retrieved from the CoV-Spectrum (https://cov-spectrum.org/) database on 01st of November 2023.
(B) Comparative frequency of SARS-CoV-2 lineage BA.2.86 on global and continental scale (seven day sliding window). Data were retrieved from the CoV-Spectrum (https://cov-spectrum.org/) database on 01st of November 2023.
ACKNOWLEDGEMENTS
We thank Berend Jan Bosch, Roberto Cattaneo, Stephan Ludwig, Andrea Maisner, Thomas Pietschmann, and Gert Zimmer for providing reagents and Alex Sigal. We gratefully acknowledge the originating laboratories responsible for obtaining the specimens, as well as the submitting laboratories where the genome data were generated and shared via GISAID, on which this research is based. E.S.-L. acknowledges funding from Institut Pasteur, the HERA Project DURABLE (grant no 101102733), the NIH PICREID (grant no U01AI151758), and from Sante publique France to the French National Reference Center for Viruses of Respiratory Infections. H.-M.J. received funding from BMBF (01KI2043, NaFoUniMedCovid19-COVIM: 01KX2021), Bavarian State Ministry for Science and the Arts and Deutsche Forschungsgemeinschaft (DFG) through the research training groups RTG1660 and TRR130, the Bayerische Forschungsstiftung (Project CORAd) and the Kastner Foundation. L.C.-S. was supported by the COVID-19-Research Network Lower Saxony (COFONI) through funding from the Ministry of Science and Culture of Lower Saxony in Germany (14–76103-184, project 6FF22). G.M.N.B. acknowledges funding by German Center for Infection Research (grant no 80018019238), and G.M.N.B. and A. D.-J. acknowledge funding by a European Regional Development Fund (Defeat Corona, ZW7–8515131) and the Ministry for Science and Culture of Lower Saxony (Niedersächsisches Ministerium für Wissenschaft und Kultur; 14–76103-184, COFONI Network, project 4LZF23). C.D. acknowledges funding by the European Commission Health Emergency Preparedness and Response Authority (HERA, grant 101102733), German Center for Infection Research, National Network University Medicine project GenSurv (01KX2121), and the German Ministry of Health through grant SeroVarCov (2522 NIK 002). SP acknowledges funding by the EU project UNDINE (grant agreement number 101057100), the COVID-19-Research Network Lower Saxony (COFONI) through funding from the Ministry of Science and Culture of Lower Saxony in Germany (14–76103-184, projects 7FF22, 6FF22, 10FF22) and the German Research Foundation (Deutsche Forschungsgemeinschaft, DFG; PO 716/11–1). Funding sources had no role in the design and execution of the study, the writing of the manuscript and the decision to submit the manuscript for publication. The authors did not receive payment by a pharmaceutical company or other agency to write the publication. The authors were not precluded from accessing data in the study, and they accept responsibility to submit for publication.
Footnotes
DECLARATION OF INTERESTS
A.K., I.N., S.P. and M.H. conducted contract research (testing of vaccinee sera for neutralizing activity against SARS-CoV-2) for Valneva unrelated to this work. G.M.N.B. served as advisor for Moderna and S.P. served as advisor for BioNTech, unrelated to this work. A.D-J. served as advisor for Pfizer, unrelated to this work. The authors declare no competing interests.
REFERENCES
- 1.Parums DV (2023). Editorial: A Rapid Global Increase in COVID-19 is Due to the Emergence of the EG.5 (Eris) Subvariant of Omicron SARS-CoV-2. Med Sci Monit 29, e942244. 10.12659/MSM.942244. [DOI] [PMC free article] [PubMed] [Google Scholar]
- 2.Yue C, Song W, Wang L, Jian F, Chen X, Gao F, Shen Z, Wang Y, Wang X, and Cao Y (2023). ACE2 binding and antibody evasion in enhanced transmissibility of XBB.1.5. Lancet Infect Dis 23, 278–280. 10.1016/S1473-3099(23)00010-5. [DOI] [PMC free article] [PubMed] [Google Scholar]
- 3.Hoffmann M, Arora P, Nehlmeier I, Kempf A, Cossmann A, Schulz SR, Morillas Ramos G, Manthey LA, Jack HM, Behrens GMN, and Pohlmann S (2023). Profound neutralization evasion and augmented host cell entry are hallmarks of the fast-spreading SARS-CoV-2 lineage XBB.1.5. Cell Mol Immunol 20, 419–422. 10.1038/s41423-023-00988-0. [DOI] [PMC free article] [PubMed] [Google Scholar]
- 4.Addetia A, Piccoli L, Case JB, Park YJ, Beltramello M, Guarino B, Dang H, de Melo GD, Pinto D, Sprouse K, et al. (2023). Neutralization, effector function and immune imprinting of Omicron variants. Nature. 10.1038/s41586-023-06487-6. [DOI] [PMC free article] [PubMed] [Google Scholar]
- 5.Zhang L, Kempf A, Nehlmeier I, Cossmann A, Dopfer-Jablonka A, Stankov MV, Schulz S, Jack HM, Behrens GMN, Pöhlmann S, and Hoffmann H (In press). Neutralisation sensitivity of SARS-CoV-2 lineages EG.5.1 and XBB.2.3. Lancet Infect Dis. [DOI] [PubMed] [Google Scholar]
- 6.Cao Y, Jian F, Wang J, Yu Y, Song W, Yisimayi A, Wang J, An R, Chen X, Zhang N, et al. (2023). Imprinted SARS-CoV-2 humoral immunity induces convergent Omicron RBD evolution. Nature 614, 521–529. 10.1038/s41586-022-05644-7. [DOI] [PMC free article] [PubMed] [Google Scholar]
- 7.Ito J, Suzuki R, Uriu K, Itakura Y, Zahradnik J, Kimura KT, Deguchi S, Wang L, Lytras S, Tamura T, et al. (2023). Convergent evolution of SARS-CoV-2 Omicron subvariants leading to the emergence of BQ.1.1 variant. Nat Commun 14, 2671. 10.1038/s41467-023-38188-z. [DOI] [PMC free article] [PubMed] [Google Scholar]
- 8.Harris E (2023). CDC Assesses Risk From BA.2.86, Highly Mutated COVID-19 Variant. JAMA. 10.1001/jama.2023.16105. [DOI] [PubMed] [Google Scholar]
- 9.Rasmussen M, Moller FT, Gunalan V, Baig S, Bennedbaek M, Christiansen LE, Cohen AS, Ellegaard K, Fomsgaard A, Franck KT, et al. (2023). First cases of SARS-CoV-2 BA.2.86 in Denmark, 2023. Euro Surveill 28. 10.2807/1560-7917.ES.2023.28.36.2300460. [DOI] [PMC free article] [PubMed] [Google Scholar]
- 10.Wannigama DL, Amarasiri M, Phattharapornjaroen P, Hurst C, Modchang C, Chadsuthi S, Anupong S, Miyanaga K, Cui L, Fernandez S, et al. (2023). Tracing the new SARS-CoV-2 variant BA.2.86 in the community through wastewater surveillance in Bangkok, Thailand. Lancet Infect Dis 23, e464–e466. 10.1016/S1473-3099(23)00620-5. [DOI] [PubMed] [Google Scholar]
- 11.Callaway E (2023). Why a highly mutated coronavirus variant has scientists on alert. Nature 620, 934. 10.1038/d41586-023-02656-9. [DOI] [PubMed] [Google Scholar]
- 12.Looi MK (2023). Covid-19: Scientists sound alarm over new BA.2.86 "Pirola" variant. BMJ 382, 1964. 10.1136/bmj.p1964. [DOI] [PubMed] [Google Scholar]
- 13.Bart SM, Rothstein AP, Philipson CW, Smith TC, Simen BB, Tamin A, Atherton LJ, Harcourt JL, Taylor Walker A, Payne DC, et al. (2023). Notes from the Field: Early Identification of the SARS-CoV-2 Omicron BA.2.86 Variant by the Traveler-Based Genomic Surveillance Program - Dulles International Airport, August 2023. MMWR Morb Mortal Wkly Rep 72, 1168–1169. 10.15585/mmwr.mm7243a3. [DOI] [PMC free article] [PubMed] [Google Scholar]
- 14.Reeve L, Tessier E, Trindall A, Abdul Aziz NIB, Andrews N, Futschik M, Rayner J, Didier'Serre A, Hams R, Groves N, et al. (2023). High attack rate in a large care home outbreak of SARS-CoV-2 BA.2.86, East of England, August 2023. Euro Surveill 28. 10.2807/1560-7917.ES.2023.28.39.2300489. [DOI] [PMC free article] [PubMed] [Google Scholar]
- 15.Lambrou AS, South E, Ballou ES, Paden CR, Fuller JA, Bart SM, Butryn DM, Novak RT, Browning SD, Kirby AE, et al. (2023). Early Detection and Surveillance of the SARS-CoV-2 Variant BA.2.86 - Worldwide, July-October 2023. MMWR Morb Mortal Wkly Rep 72, 1162–1167. 10.15585/mmwr.mm7243a2. [DOI] [PMC free article] [PubMed] [Google Scholar]
- 16.Hoffmann M, Kleine-Weber H, Schroeder S, Kruger N, Herrler T, Erichsen S, Schiergens TS, Herrler G, Wu NH, Nitsche A, et al. (2020). SARS-CoV-2 Cell Entry Depends on ACE2 and TMPRSS2 and Is Blocked by a Clinically Proven Protease Inhibitor. Cell 181, 271–280 e278. 10.1016/j.cell.2020.02.052. [DOI] [PMC free article] [PubMed] [Google Scholar]
- 17.Zhou P, Yang XL, Wang XG, Hu B, Zhang L, Zhang W, Si HR, Zhu Y, Li B, Huang CL, et al. (2020). A pneumonia outbreak associated with a new coronavirus of probable bat origin. Nature 579, 270–273. 10.1038/s41586-020-2012-7. [DOI] [PMC free article] [PubMed] [Google Scholar]
- 18.Laha S, Chakraborty J, Das S, Manna SK, Biswas S, and Chatterjee R (2020). Characterizations of SARS-CoV-2 mutational profile, spike protein stability and viral transmission. Infect Genet Evol 85, 104445. 10.1016/j.meegid.2020.104445. [DOI] [PMC free article] [PubMed] [Google Scholar]
- 19.Al-Jawabreh A, Ereqat S, Dumaidi K, Al-Jawabreh H, and Nasereddin A (2021). Complete genome sequencing of SARS-CoV-2 strains: A pilot survey in Palestine reveals spike mutation H245N. BMC Res Notes 14, 466. 10.1186/s13104-021-05874-4. [DOI] [PMC free article] [PubMed] [Google Scholar]
- 20.Wang R, Chen J, Gao K, Hozumi Y, Yin C, and Wei GW (2021). Analysis of SARS-CoV-2 mutations in the United States suggests presence of four substrains and novel variants. Commun Biol 4, 228. 10.1038/s42003-021-01754-6. [DOI] [PMC free article] [PubMed] [Google Scholar]
- 21.Benslimane FM, Al Khatib HA, Al-Jamal O, Albatesh D, Boughattas S, Ahmed AA, Bensaad M, Younuskunju S, Mohamoud YA, Al Badr M, et al. (2021). One Year of SARS-CoV-2: Genomic Characterization of COVID-19 Outbreak in Qatar. Front Cell Infect Microbiol 11, 768883. 10.3389/fcimb.2021.768883. [DOI] [PMC free article] [PubMed] [Google Scholar]
- 22.Anwar MZ, Lodhi MS, Khan MT, Khan MI, and Sharif S (2022). Coronavirus Genomes and Unique Mutations in Structural and Non-Structural Proteins in Pakistani SARS-CoV-2 Delta Variants during the Fourth Wave of the Pandemic. Genes (Basel) 13. 10.3390/genes13030552. [DOI] [PMC free article] [PubMed] [Google Scholar]
- 23.Guruprasad L (2021). Human SARS CoV-2 spike protein mutations. Proteins 89, 569–576. 10.1002/prot.26042. [DOI] [PMC free article] [PubMed] [Google Scholar]
- 24.Lusvarghi S, Wang W, Herrup R, Neerukonda SN, Vassell R, Bentley L, Eakin AE, Erlandson KJ, and Weiss CD (2022). Key Substitutions in the Spike Protein of SARS-CoV-2 Variants Can Predict Resistance to Monoclonal Antibodies, but Other Substitutions Can Modify the Effects. J Virol 96, e0111021. 10.1128/JVI.01110-21. [DOI] [PMC free article] [PubMed] [Google Scholar]
- 25.Vellas C, Tremeaux P, Del Bello A, Latour J, Jeanne N, Ranger N, Danet C, Martin-Blondel G, Delobel P, Kamar N, and Izopet J (2022). Resistance mutations in SARS-CoV-2 omicron variant in patients treated with sotrovimab. Clin Microbiol Infect 28, 1297–1299. 10.1016/j.cmi.2022.05.002. [DOI] [PMC free article] [PubMed] [Google Scholar]
- 26.Mykytyn AZ, Fouchier RA, and Haagmans BL (2023). Antigenic evolution of SARS coronavirus 2. Curr Opin Virol 62, 101349. 10.1016/j.coviro.2023.101349. [DOI] [PubMed] [Google Scholar]
- 27.Huo J, Dijokaite-Guraliuc A, Liu C, Zhou D, Ginn HM, Das R, Supasa P, Selvaraj M, Nutalai R, Tuekprakhon A, et al. (2023). A delicate balance between antibody evasion and ACE2 affinity for Omicron BA.2.75. Cell reports 42, 111903. 10.1016/j.celrep.2022.111903. [DOI] [PMC free article] [PubMed] [Google Scholar]
- 28.Qu P, Evans JP, Zheng YM, Carlin C, Saif LJ, Oltz EM, Xu K, Gumina RJ, and Liu SL (2022). Evasion of neutralizing antibody responses by the SARS-CoV-2 BA.2.75 variant. Cell Host Microbe 30, 1518–1526 e1514. 10.1016/j.chom.2022.09.015. [DOI] [PMC free article] [PubMed] [Google Scholar]
- 29.Saito A, Irie T, Suzuki R, Maemura T, Nasser H, Uriu K, Kosugi Y, Shirakawa K, Sadamasu K, Kimura I, et al. (2022). Enhanced fusogenicity and pathogenicity of SARS-CoV-2 Delta P681R mutation. Nature 602, 300–306. 10.1038/s41586-021-04266-9. [DOI] [PMC free article] [PubMed] [Google Scholar]
- 30.Bussani R, Schneider E, Zentilin L, Collesi C, Ali H, Braga L, Volpe MC, Colliva A, Zanconati F, Berlot G, et al. (2020). Persistence of viral RNA, pneumocyte syncytia and thrombosis are hallmarks of advanced COVID-19 pathology. EBioMedicine 61, 103104. 10.1016/j.ebiom.2020.103104. [DOI] [PMC free article] [PubMed] [Google Scholar]
- 31.Braga L, Ali H, Secco I, Chiavacci E, Neves G, Goldhill D, Penn R, Jimenez-Guardeno JM, Ortega-Prieto AM, Bussani R, et al. (2021). Drugs that inhibit TMEM16 proteins block SARS-CoV-2 spike-induced syncytia. Nature 594, 88–93. 10.1038/s41586-021-03491-6. [DOI] [PMC free article] [PubMed] [Google Scholar]
- 32.Rajah MM, Bernier A, Buchrieser J, and Schwartz O (2022). The Mechanism and Consequences of SARS-CoV-2 Spike-Mediated Fusion and Syncytia Formation. J Mol Biol 434, 167280. 10.1016/j.jmb.2021.167280. [DOI] [PMC free article] [PubMed] [Google Scholar]
- 33.Hoffmann M, Wong LR, Arora P, Zhang L, Rocha C, Odle A, Nehlmeier I, Kempf A, Richter A, Halwe NJ, et al. (2023). Omicron subvariant BA.5 efficiently infects lung cells. Nat Commun 14, 3500. 10.1038/s41467-023-39147-4. [DOI] [PMC free article] [PubMed] [Google Scholar]
- 34.Furusawa Y, Kiso M, Iida S, Uraki R, Hirata Y, Imai M, Suzuki T, Yamayoshi S, and Kawaoka Y (2023). In SARS-CoV-2 delta variants, Spike-P681R and D950N promote membrane fusion, Spike-P681R enhances spike cleavage, but neither substitution affects pathogenicity in hamsters. EBioMedicine 91, 104561. 10.1016/j.ebiom.2023.104561. [DOI] [PMC free article] [PubMed] [Google Scholar]
- 35.Schmidt F, Weisblum Y, Muecksch F, Hoffmann HH, Michailidis E, Lorenzi JCC, Mendoza P, Rutkowska M, Bednarski E, Gaebler C, et al. (2020). Measuring SARS-CoV-2 neutralizing antibody activity using pseudotyped and chimeric viruses. J Exp Med 217. 10.1084/jem.20201181. [DOI] [PMC free article] [PubMed] [Google Scholar]
- 36.Riepler L, Rossler A, Falch A, Volland A, Borena W, von Laer D, and Kimpel J (2020). Comparison of Four SARS-CoV-2 Neutralization Assays. Vaccines (Basel) 9. 10.3390/vaccines9010013. [DOI] [PMC free article] [PubMed] [Google Scholar]
- 37.Iwata-Yoshikawa N, Kakizaki M, Shiwa-Sudo N, Okura T, Tahara M, Fukushi S, Maeda K, Kawase M, Asanuma H, Tomita Y, et al. (2022). Essential role of TMPRSS2 in SARS-CoV-2 infection in murine airways. Nat Commun 13, 6100. 10.1038/s41467-022-33911-8. [DOI] [PMC free article] [PubMed] [Google Scholar]
- 38.Hui KPY, Ho JCW, Cheung MC, Ng KC, Ching RHH, Lai KL, Kam TT, Gu H, Sit KY, Hsin MKY, et al. (2022). SARS-CoV-2 Omicron variant replication in human bronchus and lung ex vivo. Nature 603, 715–720. 10.1038/s41586-022-04479-6. [DOI] [PubMed] [Google Scholar]
- 39.Shuai H, Chan JF, Hu B, Chai Y, Yuen TT, Yin F, Huang X, Yoon C, Hu JC, Liu H, et al. (2022). Attenuated replication and pathogenicity of SARS-CoV-2 B.1.1.529 Omicron. Nature 603, 693–699. 10.1038/s41586-022-04442-5. [DOI] [PubMed] [Google Scholar]
- 40.Meng B, Abdullahi A, Ferreira I, Goonawardane N, Saito A, Kimura I, Yamasoba D, Gerber PP, Fatihi S, Rathore S, et al. (2022). Altered TMPRSS2 usage by SARS-CoV-2 Omicron impacts infectivity and fusogenicity. Nature 603, 706–714. 10.1038/s41586-022-04474-x. [DOI] [PMC free article] [PubMed] [Google Scholar]
- 41.Chen DY, Chin CV, Kenney D, Tavares AH, Khan N, Conway HL, Liu G, Choudhary MC, Gertje HP, O'Connell AK, et al. (2023). Spike and nsp6 are key determinants of SARS-CoV-2 Omicron BA.1 attenuation. Nature 615, 143–150. 10.1038/s41586-023-05697-2. [DOI] [PubMed] [Google Scholar]
- 42.Halfmann PJ, Iida S, Iwatsuki-Horimoto K, Maemura T, Kiso M, Scheaffer SM, Darling TL, Joshi A, Loeber S, Singh G, et al. (2022). SARS-CoV-2 Omicron virus causes attenuated disease in mice and hamsters. Nature 603, 687–692. 10.1038/s41586-022-04441-6. [DOI] [PMC free article] [PubMed] [Google Scholar]
- 43.Suzuki R, Yamasoba D, Kimura I, Wang L, Kishimoto M, Ito J, Morioka Y, Nao N, Nasser H, Uriu K, et al. (2022). Attenuated fusogenicity and pathogenicity of SARS-CoV-2 Omicron variant. Nature 603, 700–705. 10.1038/s41586-022-04462-1. [DOI] [PMC free article] [PubMed] [Google Scholar]
- 44.Raglow Z, Surie D, Chappell JD, Zhu Y, Martin ET, Kwon JH, Frosch AE, Mohamed A, Gilbert J, Bendall EE, et al. (2023). SARS-CoV-2 shedding and evolution in immunocompromised hosts during the Omicron period: a multicenter prospective analysis. medRxiv. 10.1101/2023.08.22.23294416. [DOI] [PMC free article] [PubMed] [Google Scholar]
- 45.Berkhout B, and Herrera-Carrillo E (2022). SARS-CoV-2 Evolution: On the Sudden Appearance of the Omicron Variant. J Virol 96, e0009022. 10.1128/jvi.00090-22. [DOI] [PMC free article] [PubMed] [Google Scholar]
- 46.Escalera A, Gonzalez-Reiche AS, Aslam S, Mena I, Laporte M, Pearl RL, Fossati A, Rathnasinghe R, Alshammary H, van de Guchte A, et al. (2022). Mutations in SARS-CoV-2 variants of concern link to increased spike cleavage and virus transmission. Cell Host Microbe 30, 373–387 e377. 10.1016/j.chom.2022.01.006. [DOI] [PMC free article] [PubMed] [Google Scholar]
- 47.Chan JF, Huang X, Hu B, Chai Y, Shi H, Zhu T, Yuen TT, Liu Y, Liu H, Shi J, et al. (2023). Altered host protease determinants for SARS-CoV-2 Omicron. Sci Adv 9, eadd3867. 10.1126/sciadv.add3867. [DOI] [PMC free article] [PubMed] [Google Scholar]
- 48.Kimura I, Yamasoba D, Tamura T, Nao N, Suzuki T, Oda Y, Mitoma S, Ito J, Nasser H, Zahradnik J, et al. (2022). Virological characteristics of the SARS-CoV-2 Omicron BA.2 subvariants, including BA.4 and BA.5. Cell 185, 3992–4007 e3916. 10.1016/j.cell.2022.09.018. [DOI] [PMC free article] [PubMed] [Google Scholar]
- 49.Xia H, Yeung J, Kalveram B, Bills CJ, Chen JY, Kurhade C, Zou J, Widen SG, Mann BR, Kondor R, et al. (2023). Cross-neutralization and viral fitness of SARS-CoV-2 Omicron sublineages. Emerg Microbes Infect 12, e2161422. 10.1080/22221751.2022.2161422. [DOI] [PMC free article] [PubMed] [Google Scholar]
- 50.Planas D, Bruel T, Staropoli I, Guivel-Benhassine F, Porrot F, Maes P, Grzelak L, Prot M, Mougari S, Planchais C, et al. (2023). Resistance of Omicron subvariants BA.2.75.2, BA.4.6, and BQ.1.1 to neutralizing antibodies. Nat Commun 14, 824. 10.1038/s41467-023-36561-6. [DOI] [PMC free article] [PubMed] [Google Scholar]
- 51.Wang Q, Iketani S, Li Z, Liu L, Guo Y, Huang Y, Bowen AD, Liu M, Wang M, Yu J, et al. (2023). Alarming antibody evasion properties of rising SARS-CoV-2 BQ and XBB subvariants. Cell 186, 279–286 e278. 10.1016/j.cell.2022.12.018. [DOI] [PMC free article] [PubMed] [Google Scholar]
- 52.Arora P, Kempf A, Nehlmeier I, Schulz SR, Jack HM, Pohlmann S, and Hoffmann M (2023). Omicron sublineage BQ.1.1 resistance to monoclonal antibodies. Lancet Infect Dis 23, 22–23. 10.1016/S1473-3099(22)00733-2. [DOI] [PMC free article] [PubMed] [Google Scholar]
- 53.Arora P, Cossmann A, Schulz SR, Ramos GM, Stankov MV, Jack HM, Behrens GMN, Pohlmann S, and Hoffmann M (2023). Neutralisation sensitivity of the SARS-CoV-2 XBB.1 lineage. Lancet Infect Dis 23, 147–148. 10.1016/S1473-3099(22)00831-3. [DOI] [PMC free article] [PubMed] [Google Scholar]
- 54.Nehlmeier I, Kempf A, Arora P, Cossmann A, Dopfer-Jablonka A, Stankov MV, Schulz SR, Jack HM, Behrens GMN, Pohlmann S, and Hoffmann M (2023). Host cell entry and neutralisation sensitivity of the SARS-CoV-2 XBB.1.16 lineage. Cell Mol Immunol 20, 969–971. 10.1038/s41423-023-01030-z. [DOI] [PMC free article] [PubMed] [Google Scholar]
- 55.Qu P, Faraone JN, Evans JP, Zheng YM, Carlin C, Anghelina M, Stevens P, Fernandez S, Jones D, Panchal AR, et al. (2023). Enhanced evasion of neutralizing antibody response by Omicron XBB.1.5, CH.1.1, and CA.3.1 variants. Cell reports 42, 112443. 10.1016/j.celrep.2023.112443. [DOI] [PMC free article] [PubMed] [Google Scholar]
- 56.Uriu K, Ito J, Kosugi Y, Tanaka YL, Mugita Y, Guo Z, Hinay AA Jr., Putri O, Kim Y, Shimizu R, et al. (2023). Transmissibility, infectivity, and immune evasion of the SARS-CoV-2 BA.2.86 variant. Lancet Infect Dis 23, e460–e461. 10.1016/S1473-3099(23)00575-3. [DOI] [PubMed] [Google Scholar]
- 57.Yang S, Yu Y, Jian F, Song W, Yisimayi A, Chen X, Xu Y, Wang P, Wang J, Yu L, et al. (2023). Antigenicity and infectivity characterisation of SARS-CoV-2 BA.2.86. Lancet Infect Dis 23, e457–e459. 10.1016/S1473-3099(23)00573-X. [DOI] [PubMed] [Google Scholar]
- 58.Sheward DJ, Yang Y, Westerberg M, Oling S, Muschiol S, Sato K, Peacock TP, Karlsson Hedestam GB, Albert J, and Murrell B (2023). Sensitivity of the SARS-CoV-2 BA.2.86 variant to prevailing neutralising antibody responses. Lancet Infect Dis 23, e462–e463. 10.1016/S1473-3099(23)00588-1. [DOI] [PubMed] [Google Scholar]
- 59.Wang Q, Guo Y, Liu L, Schwanz LT, Li Z, Nair MS, Ho J, Zhang RM, Iketani S, Yu J, et al. (2023). Antigenicity and receptor affinity of SARS-CoV-2 BA.2.86 spike. Nature. 10.1038/s41586-023-06750-w. [DOI] [PubMed] [Google Scholar]
- 60.Lasrado N, Collier AY, Hachmann NP, Miller J, Rowe M, Schonberg ED, Rodrigues SL, LaPiana A, Patio RC, Anand T, et al. (2023). Neutralization escape by SARS-CoV-2 Omicron subvariant BA.2.86. Vaccine 41, 6904–6909. 10.1016/j.vaccine.2023.10.051. [DOI] [PMC free article] [PubMed] [Google Scholar]
- 61.Hu Y, Zou J, Kurhade C, Deng X, Chang HC, Kim DK, Shi PY, Ren P, and Xie X (2023). Less neutralization evasion of SARS-CoV-2 BA.2.86 than XBB sublineages and CH.1.1. Emerg Microbes Infect 12, 2271089. 10.1080/22221751.2023.2271089. [DOI] [PMC free article] [PubMed] [Google Scholar]
- 62.Brinkmann C, Hoffmann M, Lubke A, Nehlmeier I, Kramer-Kuhl A, Winkler M, and Pohlmann S (2017). The glycoprotein of vesicular stomatitis virus promotes release of virus-like particles from tetherin-positive cells. PLoS One 12, e0189073. 10.1371/journal.pone.0189073. [DOI] [PMC free article] [PubMed] [Google Scholar]
- 63.Arora P, Sidarovich A, Kruger N, Kempf A, Nehlmeier I, Graichen L, Moldenhauer AS, Winkler MS, Schulz S, Jack HM, et al. (2021). B.1.617.2 enters and fuses lung cells with increased efficiency and evades antibodies induced by infection and vaccination. Cell reports 37, 109825. 10.1016/j.celrep.2021.109825. [DOI] [PMC free article] [PubMed] [Google Scholar]
- 64.Arora P, Zhang L, Rocha C, Sidarovich A, Kempf A, Schulz S, Cossmann A, Manger B, Baier E, Tampe B, et al. (2022). Comparable neutralisation evasion of SARS-CoV-2 omicron subvariants BA.1, BA.2, and BA.3. Lancet Infect Dis 22, 766–767. 10.1016/S1473-3099(22)00224-9. [DOI] [PMC free article] [PubMed] [Google Scholar]
- 65.Hoffmann M, Kruger N, Schulz S, Cossmann A, Rocha C, Kempf A, Nehlmeier I, Graichen L, Moldenhauer AS, Winkler MS, et al. (2022). The Omicron variant is highly resistant against antibody-mediated neutralization: Implications for control of the COVID-19 pandemic. Cell 185, 447–456 e411. 10.1016/j.cell.2021.12.032. [DOI] [PMC free article] [PubMed] [Google Scholar]
- 66.Hoffmann M, Zhang L, Kruger N, Graichen L, Kleine-Weber H, Hofmann-Winkler H, Kempf A, Nessler S, Riggert J, Winkler MS, et al. (2021). SARS-CoV-2 mutations acquired in mink reduce antibody-mediated neutralization. Cell reports 35, 109017. 10.1016/j.celrep.2021.109017. [DOI] [PMC free article] [PubMed] [Google Scholar]
- 67.Arora P, Zhang L, Kruger N, Rocha C, Sidarovich A, Schulz S, Kempf A, Graichen L, Moldenhauer AS, Cossmann A, et al. (2022). SARS-CoV-2 Omicron sublineages show comparable cell entry but differential neutralization by therapeutic antibodies. Cell Host Microbe 30, 1103–1111 e1106. 10.1016/j.chom.2022.04.017. [DOI] [PMC free article] [PubMed] [Google Scholar]
- 68.Kleine-Weber H, Elzayat MT, Wang L, Graham BS, Muller MA, Drosten C, Pohlmann S, and Hoffmann M (2019). Mutations in the Spike Protein of Middle East Respiratory Syndrome Coronavirus Transmitted in Korea Increase Resistance to Antibody-Mediated Neutralization. J Virol 93. 10.1128/JVI.01381-18. [DOI] [PMC free article] [PubMed] [Google Scholar]
- 69.Berger Rentsch M, and Zimmer G (2011). A vesicular stomatitis virus replicon-based bioassay for the rapid and sensitive determination of multi-species type I interferon. PLoS One 6, e25858. 10.1371/journal.pone.0025858. [DOI] [PMC free article] [PubMed] [Google Scholar]
- 70.Corman VM, Landt O, Kaiser M, Molenkamp R, Meijer A, Chu DK, Bleicker T, Brunink S, Schneider J, Schmidt ML, et al. (2020). Detection of 2019 novel coronavirus (2019-nCoV) by real-time RT-PCR. Euro Surveill 25. 10.2807/1560-7917.ES.2020.25.3.2000045. [DOI] [PMC free article] [PubMed] [Google Scholar]
- 71.Niemeyer D, Stenzel S, Veith T, Schroeder S, Friedmann K, Weege F, Trimpert J, Heinze J, Richter A, Jansen J, et al. (2022). SARS-CoV-2 variant Alpha has a spike-dependent replication advantage over the ancestral B.1 strain in human cells with low ACE2 expression. PLoS Biol 20, e3001871. 10.1371/journal.pbio.3001871. [DOI] [PMC free article] [PubMed] [Google Scholar]
Associated Data
This section collects any data citations, data availability statements, or supplementary materials included in this article.
Supplementary Materials
Figure S2: Cell line tropism and entry efficiency of particles bearing SARS-CoV-2 S proteins (related to Figure 1).
(A) 293T cells expressing the indicated S proteins (or no S protein, control) were incubated with anti-SARS-CoV-2 S2 and Alexa Fluor-488-conjugated secondary antibodies, before being subjected to flow cytometry in order to investigate S protein cell surface expression. Presented are the normalized mean data from six biological replicates (performed single samples) in which cell surface expression was normalized against B.1 S (set as 1). Error bars represent the standard error of the mean (SEM). Statistical significance was assessed by two-tailed Student’s t-test (not significant [ns], p > 0.05; *, p ≤ 0.05; **, p ≤ 0.01; ***, p ≤ 0.001).
(B) Effector 293T cells coexpressing the indicated S protein and the beta-galactosidase alpha fragment were mixed and coincubated with target 293T cells coexpressing ACE2 and the beta-galactosidase omega fragment. At 18h post mixing, S protein-driven cell-cell fusion was analyzed by measuring the activity of reconstituted beta-galactosidase. Presented are the normalized mean data from four biological replicates (performed with three technical replicates) in which fusion was normalized against control samples (coincubation of target cells with effector cells that did not express any S protein; set as 1). Error bars represent the SEM.
(C) Pseudovirus particles bearing the indicated S proteins (or no S protein, control) were concentrated by centrifugation, lysed and subjected to SDS-PAGE and immunoblot analysis using antibodies targeting the SARS-CoV-2 S2 subunit or VSV-M (loading control). The results of a representative immunoblot are shown and data were confirmed in five additional experiments. Numbers on the left indicate the molecular weight in kilodalton. Further, bands representing uncleaved (S0) and cleaved (S2) S protein are highlighted.
(D) Quantification of S protein incorporation into pseudovirus particles. Graphs show mean S protein particle incorporation data (obtained from six biological replicates) for which S protein signals were first normalized against their respective loading controls (VSV-M signals) and the resulting values were normalized against B.1 S (set as 1). Error bars indicate the SEM.
(E) Quantification of S protein cleavage efficiency. Graphs show mean S protein cleavage efficiency data (obtained from six biological replicates) representing the relative share of cleaved S protein (S2) from total S protein (uncleaved [S0] plus cleaved [S2] S protein, set as 100 %). Error bars indicate the SEM.
(F) Pseudovirus particles bearing the indicated S proteins or vesicular stomatitis virus glycoprotein (VSV-G) were inoculated onto Vero (African green monkey, kidney), Vero-ACE2+TMPRSS2 (Vero cells stably expressing ACE2 and TMPRSS2), 293T (human, kidney), Huh-7 (human, liver), Caco-2 (human, colon), and Calu-3 (human, lung) cells. Cell entry was analyzed at 16–18 h postinoculation by measuring luciferase activity in cell lysates. Presented are the normalized mean data from six biological replicates (performed with four technical replicates) in which cell entry was normalized against particles bearing no viral glycoprotein (set as 1). Error bars represent the SEM.
(G) 293T cell expressing the indicated S protein or no S protein (control) were subsequently incubated with soluble ACE2-Fc and Alexa Fluor-488-conjugated anti-human antibody, and subjected to flow cytometry to analyze ACE2 binding. Presented are the mean fluorescence intensity data from six biological replicates (performed with single samples). Error bars represent the standard deviation (SD).
(H) Vero cells were pretreated with different concentrations of anti-ACE2 antibody and subsequently inoculated with pseudovirus particles bearing the indicated S proteins or VSV-G. Cell entry was analyzed at 16–18 h postinoculation as described above. Presented are the normalized mean data from three biological replicates (performed with four technical replicates) in which cell entry was normalized against particles bearing no viral glycoprotein (set as 1). Error bars represent the SEM.
Figure S4: Overview of BA.2.86-specific S protein mutations in the context of epitopes recognized by therapeutic monoclonal antibodies (related to Figure 4).
(A) Summary of residues forming the RBD of the SARS-CoV-2 S protein (numbering according to the S protein of the SARS-CoV-2 Wuhan-Hu-01 isolate) with mutations specific to SARS-CoV-2 lineages BA.2, BA.2.86 and EG.5.1 highlighted (blue). RBD residues that contact ACE2 (green) or that form epitopes recognized by therapeutic monoclonal antibodies (pink) are highlighted.
Figure S3: Impact of the NTD and RBD on augmented Calu-3 cell entry by particles bearing BA.2.86 S (related to Figure 2).
(A) Pseudovirus particles bearing the indicated wildtype (WT) or chimeric S proteins (or no S protein, control) were concentrated by centrifugation, lysed and subjected to SDS-PAGE and immunoblot analysis using antibodies targeting the SARS-CoV-2 S2 subunit or VSV-M (loading control). The results of a representative immunoblot are shown and data were confirmed in two additional experiments. Numbers on the left indicate the molecular weight in kilodalton. Further, bands representing uncleaved (S0) and cleaved (S2) S protein are highlighted.
(B) Pseudovirus particles bearing the indicated WT or chimeric S proteins, or VSV-G were inoculated onto Vero and Calu-3 cells. Cell entry was analyzed at 16–18 h postinoculation by measuring luciferase activity in cell lysates. Presented are the normalized mean data from six biological replicates (performed with four technical replicates) in which cell entry was normalized against particles bearing no viral glycoprotein (set as 1). Error bars represent the SEM.
(C) Pseudovirus particles bearing the indicated WT or mutant S proteins were inoculated onto Vero and Calu-3 cells. Cell entry was analyzed at 16–18 h postinoculation by measuring luciferase activity in cell lysates. Presented are the normalized mean data from six biological replicates (performed with four technical replicates) in which cell entry was normalized against particles bearing BA.2.86-S WT (set as 1; grey areas indicate the threshold for specific effects = +/- 1.5-fold change in cell entry compared to BA.2.86-S WT). Error bars represent the SEM. Statistical significance was assessed by two-tailed Student’s t-test ([ns, p > 0.05; *, p ≤ 0.05; **, p ≤ 0.01; ***, p ≤ 0.001).
(D) Pseudovirus particles bearing the indicated WT or mutant S proteins were concentrated by centrifugation, lysed and subjected to SDS-PAGE and immunoblot analysis using antibodies targeting the SARS-CoV-2 S2 subunit or VSV-M (loading control). The results of a representative immunoblot are shown and data were confirmed in two additional experiments. Numbers on the left indicate the molecular weight in kilodalton. Further, bands representing uncleaved (S0) and cleaved (S2) S protein are highlighted.
Table S2, related to figure 5: Information on plasma samples
Table S1, related to figure 4: mAb EC50 values
Figure S5: Sensitivity of BA.2.86 to neutralization by antibodies induced by infection and/or vaccination (related to Figure 5).
(A) Frequency of major SARS-CoV-2 lineages circulating from 2022 to 2023 in Germany and sampling period for cohorts 2 and 3. Data were retrieved from the CoV-Spectrum (https://cov-spectrum.org/) database on 26th of August 2023.
(B) Particles pseudotyped with the indicated S proteins were preincubated with plasma dilutions of people vaccinated with four doses of COVID-19 vaccines (n = 15, cohort 1), vaccinated with three vaccine doses and subsequent infection during the BA.2 wave in Germany (n = 15, cohort 2), vaccinated with three to four vaccine doses and subsequent infection during the BA.5 wave in Germany (n = 15, cohort 3), or vaccinated with the XBB.1.5-adapted booster vaccine (n = 11, cohort 4). Next, mixtures were inoculated onto Vero cells and inhibition of cell entry was analyzed at 16–18 h postinoculation as described above. Presented are the normalized mean data from one biological replicates (performed with four technical replicates) in which cell entry was normalized against particles incubated in the absence of plasma (set as 0% inhibition). Error bars represent the SD.
Figure S1: Prevalence of the SARS-CoV-2 BA.2.86 lineage (related to the main text).
(A) Frequency of major contemporary SARS-CoV-2 lineages on different continents (seven day sliding window). Data were retrieved from the CoV-Spectrum (https://cov-spectrum.org/) database on 01st of November 2023.
(B) Comparative frequency of SARS-CoV-2 lineage BA.2.86 on global and continental scale (seven day sliding window). Data were retrieved from the CoV-Spectrum (https://cov-spectrum.org/) database on 01st of November 2023.
Data Availability Statement
All data reported in this paper will be shared by the lead contact upon request. This paper does not report original code. Any additional information required to reanalyze the data reported in this paper is available from the lead contact upon request.