

Abstract
The relative fitness of viral variants has previously been defined as the slope of the logarithmic ratio of the genotype or phenotype frequencies in time plots of pairwise competition experiments. Developing mathematical models for such experiments by employing the conventional coefficient of selection s, we demonstrate that this logarithmic ratio gives the fitness difference, rather than the relative fitness. This fitness difference remains proportional to the actual replication rate realized in the particular experimental setup and hence cannot be extrapolated to other situations. Conversely, the conventional relative fitness (1 + s) should be more generic. We develop an approach to compute the generic relative fitness in conventional competition experiments. This involves an estimation of the total viral replication during the experiment and requires an estimate of the average lifetime of productively infected cells. The novel approach is illustrated by estimating the relative fitness, i.e., the relative replication rate, of a set of zidovudine-resistant human immunodeficiency virus type 1 variants. A tool for calculating the relative fitness from observed changes in viral load and genotype (or phenotype) frequencies is publically available on the website at http://www-binf.bio.uu.nl/∼rdb/fitness.html.
Differences in the in vitro replication rate (or fitness) between viral variants can be estimated experimentally by pairwise competition experiments in tissue culture. The outcome of such an experiment is typically depicted in a logarithmic time plot of the ratio of the genotype or phenotype frequencies (7). On a logarithmic scale the ratio tends to change linearly in time, and the rate of change (i.e., the slope of the line) has previously been defined as the relative fitness (7). According to population genetics theory, the relative fitness (1 + s) of a variant represents its relative contribution to the next generation. The parameter s is defined as the coefficient of selection. The intertwined concepts of relative fitness (1 + s) and selection coefficient s are traditionally employed in systems with discrete generations. They are equally valid for populations growing continuously, however, when time is scaled with respect to the generation time (11).
Developing conventional population genetics models for pairwise competition experiments, we show that the above-mentioned slope in a logarithmic time plot provides the absolute fitness difference between the two variants rather than the generic relative fitness (1 + s) of one with respect to the other. As the fitness difference remains proportional to the replication rate realized in the particular experimental setup, viral strains having similar selection coefficients s may have large fitness differences. On the other hand, variants differing markedly in the selection coefficients will yield almost horizontal lines in logarithmic time plots when the realized replication rate in the experiment is sufficiently low. This has indeed caused confusion in the literature (see Discussion).
Previous work on the fitness of human immunodeficiency virus type 1 (HIV-1) variants has indeed adopted the concept of a selection coefficient s from population genetics (2, 4). It is unfortunate, therefore, that the slope of the logarithmic time plot of the ratio of two variants in competition experiments has also been called a relative fitness. We here demonstrate that this slope gives the (absolute) fitness difference, and we develop a novel approach for estimating the generic relative fitness (1 + s) by competition experiments.
MATERIALS AND METHODS
To estimate selection coefficients, one conventionally writes simple exponential growth models for the various viral variants. Since viral growth need not be exponential, we first derive a somewhat more realistic model that, however, has to remain sufficiently generic for estimating selection coefficients of different viruses under different circumstances. This requires the assumption that the dynamics of free virus particles are much faster than those of productively infected cells.
A general model for the viral life cycle allows for at least two stages: free virions and infected cells. Infected cells appear when virions infect target cells, and virions appear from infected cells. Let 0 ≤ F(t) ≤ 1 be a function representing target cell availability (and/or other factors limiting viral replication). Considering infectious viral particles V and productively infected cells I only, we write the mathematical model
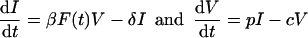 |
1a1b |
The parameter β is an infection rate, 1/δ is the average life span of productively infected cells, p is the virion production rate, and c is the viral clearance rate.
To approach a general population genetics model, this two-compartment model has to be written as a one-compartment model. Since virion dynamics are generally faster than the dynamics of productively infected cells, one typically writes the quasi-steady-state (QSS) equation V = (p/c)I. Thus, the free virion concentration is assumed to remain proportional to the density of productively infected cells. Substitution into equation 1a yields
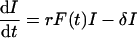 |
2 |
where r = pβ/c appears as a generalized replication rate combining infection β, production p, and clearance c. In this QSS model, viral variants differing in the clearance rate c, in the infection rate β, and/or in the production rate p will differ in this generalized replication rate r = pβ/c only. Importantly, the parameter δ should remain unaffected by such differences.
In most cases viral variants have different replication rates (r) rather than different average life times (1/δ). We therefore write models where the selection acts upon the replication rate. For cases where one knows that selection acts upon the death rate δ, one can easily rewrite our model and obtain similar results. When it is not known whether variants differ in replication or in death rates, one should set δ = 0 and interpret the parameter r as a net replication rate (see Discussion). By setting δ = 0, one can see that equation 2 is a generalization of the conventional exponential growth models.
Copying equation 2, and assuming that selection acts upon replication, a population genetics model of a competition experiment with a wild-type virus W and a mutant M is written as
 |
3a3b |
where s is the conventional selection coefficient. This parameter s is fixed and independent of the time-dependent conditions F(t), and it will generally be negative. In competition experiments, one is interested in the (nondimensional) relative fitness (1 + s). A conventional summary of competition experiments is a logarithmic time plot of the genotype (or phenotype) ratio M/W (7). By writing exponential growth, one previously assumed nonlimiting conditions; i.e., one assumed F(t) = 1 in equations 3, to be able to write the solutions W(t) = W(0)e(r − δ)t and M(t) = M(0)e[r(1 + s) − δ]t. From these solutions one can easily see that the logarithmic ratio obeys
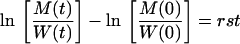 |
4 |
Thus, in a time plot the logarithmic ratio is expected to change linearly with slope rs and is expected to be independent of δ. Finally, note that W need not represent the wild-type virus but may equally well represent the “best mutant” when the competition experiment involves two mutants.
RESULTS
The mathematical model is employed to simulate conventional competition experiments. Figure 1 depicts two typical experiments for the typical situation of exponential growth. The top panels depict the virus density (in arbitrary units), and the bottom panels depict the logarithmic time plot of the genotype ratio. Below we will address other in silico (computer) experimental conditions.
FIG. 1.

Simulations of competition experiments under unlimiting conditions, i.e., F = 1. (A) An in silico experiment of 10 days with r = 1/day and s = −0.1. (B) A 2-day experiment with a rapidly replicating virus, i.e., r = 10/day and s = −0.01. Although the relative fitness of the mutant is 90% in panel A and 99% in panel B, the slope of the logarithmic ratio plot rs = 0.1/day is identical; i.e., the fitness difference is the same (note the difference in the scales of the horizontal axes). In both panels δ = 0.5/day and W(0) = M(0) = 1. The solid lines in the top panels show the total virus concentration (W + M); the dashed lines show the wild-type virus W, and the dash and dotted lines show the mutant M.
The mathematical model demonstrates that the conventional approach of estimating the slope in logarithmic time plots of genotype ratios provides an estimate for rs, i.e., the product of the actual replication rate r and the selection coefficient s. This is the absolute fitness difference between the two variants in this particular experiment [i.e., the mutant replicates at a rate of (r + rs)/day]. Estimating the selection coefficient, and hence the relative fitness, therefore requires an estimate of the wild-type replication rate r. Steep slopes of the logarithmic ratios do not necessarily imply large selection coefficients; a steep slope may also reflect a high replication rate r. For our in silico experiments, Fig. 1 illustrates that viruses having a relative fitness of 90% (Fig. 1A) or of 99% (Fig. 1B) show the same slope on the logarithmic ratio plot when the replication rates differ 10-fold. In general this means that fitness differences cannot easily be extrapolated to other circumstances involving different replication rates (such as the in vivo situation), because they depend on the actual replication rate realized under the in vitro tissue culture conditions.
Estimating the replication rate.
Thus, for estimating the relative fitness of a variant, the replication rate r has to be determined. The simplest situation is the nonlimiting condition F(t) = 1, with exponential growth of both strains. Plotting the natural logarithm of the wild-type virus concentration over time (see the dashed line in Fig. 1A, where we plot the log10 values), one obtains a straight line with a slope of (r − δ)/day, which is the net replication rate of the wild-type virus. For estimating the selection coefficient s, however, one needs to know the replication rate r, whereas the slope gives the net replication rate (r − δ). For the in vivo situation δ has been estimated for several viruses (6, 12, 15, 16, 19). There are limited data on the average lifetime of productively infected cells (1/δ) for the in vitro situation, however. A paper by Gandhi et al. (3) shows for HIV-1 that in vitro >50% of CD4+ T cells are depleted in 2 to 3 days, suggesting that for HIV-1 δ may be similar in vivo and in vitro. Without such in vitro estimates of the lifetime 1/δ, estimates of the relative replication rates (1 + s) of viral variants from in vitro competition experiments remain unreliable. Below we discuss how one typically ignores this problem and what error this implies (see Discussion).
Limiting conditions.
In typical in vitro competition experiments the tissue culture conditions do become limiting after some time. In order to maintain favorable conditions, medium and/or target cells can be added during the experiment. Both can be accounted for in the model by allowing the function F(t) to become smaller than 1 and to change over time (Fig. 2). Two simple theoretical examples are F(t) = [1 − (M + W)/K], which yields logistic growth, and F(t) = exp[−αt] representing deactivation or death of target cells and/or depletion of factors in the medium. Substituting such a declining F(t) into the model results in a decline of the viral replication rate rF(t) over time. As a consequence, the fitness difference, as measured by the slope of the logarithmic ratio, also declines over time (Fig. 2).
FIG. 2.

Competition experiments under limiting conditions, i.e., F(t) ≤ 1. Both panels depict a 10-day experiment with r = 2/day, s = 0.1, δ = 0.5/day, and W(0) = M(0) = 1. In panel A, F(t) = [1 − (W + M)/K] with K = 103, and in panel B, F(t) = exp[−αt] with α = 0.3. Table 1 shows that the correct selection coefficients can be calculated from the beginning and end points only. The solid lines in the top panels show the total virus concentration (W + M); the dashed lines show the wild type virus W, and the dash and dotted lines show the mutant M.
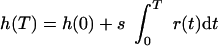
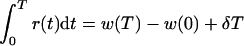
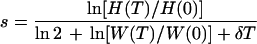
Estimation of the fitness difference under limiting conditions requires an estimate of the total replication during the experiment. Provided that there are data on the viral expansion during the experiment, there is a simple solution to this problem. In the Appendix we derive that the selection coefficient can be directly estimated from the initial and final values of the concentration of the wild-type virus W and the genotype ratio H = M/W. For an experiment of T days we derive that
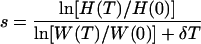 |
5 |
where W(T)/W(0) is the fold expansion of the wild-type virus during the experiment and H(T)/H(0) is the fold change in the M/W ratio over the T days of the experiment.
In Table 1 we show that one can accurately estimate the selection coefficients s from all four in silico experiments in Fig. 1 and 2 by this formula (and by knowing that δ = 0.5/day in our computer experiments). In all cases we recover the correct coefficient of selection by considering only the data at the start and at the end of the experiment. The nonlinear time course of the viral replication during the experiment remains irrelevant for estimating the relative fitness.
TABLE 1.
| Data | W(T)/W(0) | H(T)/H(0) | δT | s |
|---|---|---|---|---|
| Fig. 1A | 148.4 | 0.3679 | 5 | −0.1 |
| Fig. 1B | 1.785 × 10⁸ | 0.8187 | 1 | −0.01 |
| Fig. 2A | 562.3 | 0.3220 | 5 | −0.1 |
| Fig. 2B | 3.800 | 0.5307 | 5 | −0.1 |
We determined the wild-type virus concentration and the mutant/wild-type ratio, at the start (i.e., t = 0) and at the end (i.e., t = T) of the stimulation. These in silico data are given as the fold expansion. W is the wild-type virus concentration, and H is the mutant/wild-type virus ratio M/W (see the Appendix). The table demonstrates that equation 5 correctly retrieves the selection coefficients for each of the growth curves in Fig. 1 and 2.
Experimental data.
To illustrate our approach for the in vitro situation, Fig. 3 and Table 2 provide examples of data from tissue culture competition experiments that were set up to estimate differences in the replication rates of various zidovudine (AZT)-resistant HIV-1 mutants. Halfway through each experiment of 8 days, the cultures were split in half; i.e., half of the medium and cells was replenished with fresh medium and cells (Fig. 3). Table 2 shows that the relative fitness can be estimated by considering the percentage of the mutant virus and the total virus density (as measured by use of the HIV-1 capsid p24 antigen [CA-p24]) at the start and end of each experiment. We show in the Appendix that the twofold dilution during the experiment can be corrected for by the ln 2 factor in equation 14. The relative fitness of the variants varies around 90%.
FIG. 3.

Two sequential competition experiments between wild-type HIV-1 and the AZT-resistant variant M41L/T215Y. Competition experiments were initiated by infection of phytohemagglutinin-stimulated peripheral blood mononuclear cells with a virus mixture containing the wild-type HXB2 virus and the AZT-resistant variant. At day 3, the cells were washed, and a cell-free sample was taken from the culture for CA-p24 analysis. At day 7, half of the culture was removed, and fresh medium supplemented with phytohemagglutinin-stimulated peripheral blood mononuclear cells was added. At day 11, virus supernatant was harvested and used for CA-p24 analysis, and the ratio of the wild-type to the mutant genotype frequency was established [H(11)]. The genotype ratio at day 3 was assumed to be identical to that at day 11 of the previous passage (W. Keulen et al., submitted for publication). In Table 2 we compute the selection coefficients s = −0.0862 and s = −0.0979 for the two experiments.
TABLE 2.
Estimation of the coefficient of selection from several competition experiments between virus with a wild-type reverse transcriptase gene and several AZT-resistant mutants with point mutations in the reverse transcriptase genea
| Mutant | CA-p24 (ng/ml)
|
% M
|
W
|
s | (1 + s) | |||
|---|---|---|---|---|---|---|---|---|
| Day 3 | Day 11 | Day 3 | Day 11 | Day 3 | Day 11 | |||
| M41L | 0.03 | 63 | 30 | 10 | 0.021 | 56.7 | −0.11 | 0.89 |
| T215Y | 0.07 | 87 | 50 | 25 | 0.035 | 65.25 | −0.09 | |
| 0.17 | 69.45 | 25 | 10 | 0.127 | 62.5 | −0.10 | 0.90 | |
| M41L/T215Y | 0.03 | 63 | 50 | 25 | 0.015 | 47.25 | −0.09 | |
| 0.18 | 102.51 | 25 | 10 | 0.135 | 92.26 | −0.10 | 0.91 | |
Three examples with the mutants M41L and T215Y are shown. The total virus concentrations, as measured by the CA-p24, and the percentage of the mutant genotype (M) allow one to compute the wild-type virus density (W) (as measured by the CA-p24 antigen) and the genotype ratio (H) [as % M/(100 − % M)]. From these values we compute the dimensionless fold expansion of the wild-type virus W(11)/W(3) and the genotype ratio H(11)/H(3), which when substituted into equation 14, with δ = 0.5/day (3) and T = 8 days, yields the selection coefficients. The relative fitness (1 + s) is an average.
In these experiments the viral density was measured by use of the CA-p24 antigen. It is important to realize that equation 5 requires only the fold expansion of the virus during the experiment. Equation 5 should therefore allow one to measure the viral density by any type of assay. Being based upon this nondimensional ratio only, most scaling properties of the experimental readout should cancel. We do, however, require that the assay be used within its linear range and that the readout remain proportional to the number of productively infected cells. Note that, due to the possible accumulation of the CA-p24 antigen, the latter requirement need not be true for CA-p24. In that case the selection coefficients in Table 2 represent lower bounds.
The in vivo steady state.
Several viruses establish a chronic infection in their host with an approximately steady-state viral load. For estimating the relative fitness, such a QSS is a much simpler situation than the situations involving expanding virus populations considered above, because one may employ the steady-state equation to estimate the replication rate (4). For a QSS concentration of the wild-type virus, equation 3a, with dW/dt ≃ 0, gives rF(t) ≃ δ. Thus, the slope of the logarithmic ratio becomes δs (4). Hence, if δ is known, one can divide this slope by δ to calculate s. The population geneticist's way to do this is to scale time with the estimated generation time 1/δ (4).
Multiple mutants.
Competition experiments need not be pairwise and may instead involve several genotypes at once. Additionally, the in vivo evolution may involve several genotypes at measurable quantities (4). The multiple strains compete by means of the growth function that is computed from the expansion of the wild-type virus. Equation 5 therefore allows one to compute each of the selection coefficients by considering the expansion of the wild-type virus W(T)/W(0) (or that of the best variant) with the respective changes of the genotype ratios H(T)/H(0) of all variants present in the experiment.
DISCUSSION
The concept of a relative fitness as defined by the slope rs of logarithmic plots of the genotype ratio (7) has been confused with the relative fitness in population genetics (1 + s) in several previous publications (see, e.g., references 5, 9, 10, and 18). Since the viral replication rate can become very high under conditions favoring exponential growth, one may measure a large fitness difference rs even when the coefficient of selection s is relatively small. Previous authors have indeed been surprised by the large fitness differences that were found in the slopes of logarithmic plots of the genotype ratio (14). Under QSS conditions, such as a chronic in vivo infection, the replication rate approaches the death rate. This allows the relative fitness to be obtained by scaling time to the viral generation time (4). Since this method has also been applied to non-steady-state conditions (5), there is even more confusion in the literature. Notwithstanding the confusion on the underlying mathematical model, it has been recognized that the outgrowth of viral variants depends on the realized replication rate (20). Confirming our results, it was demonstrated that the rate at which a wild-type duck hepatitis B virus replaces an initial mutant depends on the rate of production of new hepatocytes (20).
We have shown that realistic estimates of the relative fitness requires an estimate for the average lifetime of infected cells (1/δ). Although δ is known for several viruses in the in vivo situation, it is not known for typical in vitro conditions. This problem has been overlooked before because one typically writes models in terms of a net replication rate incorporating the death rate δ [e.g., dM/dt = r(1 + s)M]. By developing our model from a model with infection and production parameters, however, we derived that the selection coefficient should be independent of the death rate δ. Hence, one requires an estimate of δ to estimate selection coefficients. In our model, we could also interpret the replication rate r as a net replication rate by setting δ = 0 in equation 3. The Appendix shows that this approximation becomes valid when r is ≫δ (see, e.g., Fig. 1b). This illustrates an advantage of performing competition experiments with favorable unlimiting conditions: high replication rates decrease the effect of δ.
If multiple mutants are compared in pairwise competition experiments with a wild-type virus and there is no information on the replication rate r, one does obtain a correct ranking of the fitness differences rs1, rs2, …, rsn from the respective logarithmic slopes (provided that the experimental conditions are the same). This provides information on the fold differences si/sj in the selection coefficients between the variants. To estimate how the mutants compare to the wild type and what the ratios (1 + si)/(1 + sj) in the relative fitnesses are, one still requires equation 5 however.
The main idea of a relative fitness is that it should allow for extrapolation to other situations. For instance, knowing the in vivo replication rate of the wild-type virus (8, 13, 17), one should be able to multiply this by the relative fitness value (1 + s) to obtain the in vivo replication rate of a variant. A word of caution remains appropriate however. The selection coefficient measured in vitro may depend on the precise in vitro conditions, such as the nucleotide availability (1) and the initial viral density (18). Thus, although we have provided an algorithm for estimating the true conventional relative fitness, it remains questionable whether in vitro estimates can be extrapolated to the in vivo situation.
In summary, we have shown that estimating a generic relative fitness (1 + s) requires, besides the time course of the genotype frequencies (7), additional estimates for the fold expansion of the wild-type virus and the death rate δ of productively infected cells during the competition experiment. Based upon this information, a simple formula allows one to estimate the coefficient of selection s. This formula is available on the website at http://www-binf.bio.uu.nl/∼rdb/fitness.html. A final advantage of this model is that it explicitly allows replication rates to change during the experiment when conditions become limiting and/or by experimental manipulation.
ACKNOWLEDGMENTS
We thank André Noest, José Borghans, and James Cohen Stuart for discussion and comments.
This work is partially supported by a grant from the Dutch AIDS Foundation (PccO grant 1317). A. F. M. Marée is supported by the Priority Program Nonlinear Systems of the Netherlands Organization for Scientific Research.
Appendix
In equation 3 we have allowed for changes in the actual replication rate by writing the replication rate rF(t). Here we allow the replication r(t) to be an arbitrary function of the time t during a competition experiment. The experiment starts at time t = 0 and ends at time t = T.
First, define the ratio of mutant to wild-type virus as H = M/W, and define h = ln H as the logarithmic ratio. From equation 3 one obtains by the normal rules of differentiation dH/dt = sr(t)H and, hence
 |
6 |
Thus, the logarithmic ratio h(T) at the end of the experiment is
 |
7 |
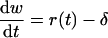
For the wild type virus we follow a similar procedure by first defining w = ln W, and then dW/dt = r(t)W − δW yields
 |
8 |
For the end of the experiment we obtain
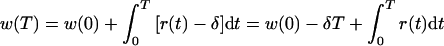 |
9 |
which, when rewritten as
 |
10 |
can be substituted in equation 7 to obtain
 |
11 |
Since h and w are logarithms, this can be rewritten into equation 5 in the text.
In several experimental setups one refreshes the medium at some point during the experiment. Consider, for example, a case where one removes half of the infected cells and medium at time t = Th to add fresh medium and target cells. By this procedure, equation 9 changes into
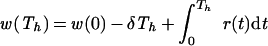 |
12a |
and
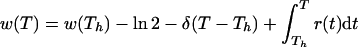 |
12b |
Since
 |
13 |
we obtain
 |
14 |
Thus, halving the number of cells at any time during the experiment can be corrected for by adding the factor ln 2 to the denominator.
REFERENCES
- 1.Back N K, Nijhuis M, Keulen W, Boucher C A, Oude Essink B O, Van Kuilenburg A B, Van Gennip A H, Berkhout B. Reduced replication of 3TC-resistant HIV-1 variants in primary cells due to a processivity defect of the reverse transcriptase enzyme. EMBO J. 1996;15:4040–4049. [PMC free article] [PubMed] [Google Scholar]
- 2.Coffin J M. HIV population dynamics in vivo: implications for genetic variation, pathogenesis, and therapy. Science. 1995;267:483–489. doi: 10.1126/science.7824947. [DOI] [PubMed] [Google Scholar]
- 3.Gandhi R T, Chen B K, Straus S E, Dale J K, Lenardo M J, Baltimore D. HIV-1 directly kills CD4+ T cells by a Fas-independent mechanism. J Exp Med. 1998;187:1113–1122. doi: 10.1084/jem.187.7.1113. [DOI] [PMC free article] [PubMed] [Google Scholar]
- 4.Goudsmit J, De Ronde A, De Rooij E, De Boer R J. Broad spectrum of in vivo fitness of human immunodeficiency virus type 1 subpopulations differing at reverse transcriptase codons 41 and 215. J Virol. 1997;71:4479–4484. doi: 10.1128/jvi.71.6.4479-4484.1997. [DOI] [PMC free article] [PubMed] [Google Scholar]
- 5.Harrigan P R, Bloor S, Larder B A. Relative replicative fitness of zidovudine-resistant human immunodeficiency virus type 1 isolates in vitro. J Virol. 1998;72:3773–3778. doi: 10.1128/jvi.72.5.3773-3778.1998. [DOI] [PMC free article] [PubMed] [Google Scholar]
- 6.Ho D D, Neumann A U, Perelson A S, Chen W, Leonard J M, Markowitz M. Rapid turnover of plasma virions and CD4 lymphocytes in HIV-1 infection. Nature. 1995;373:123–126. doi: 10.1038/373123a0. [DOI] [PubMed] [Google Scholar]
- 7.Holland J J, De la Torre J C, Clarke D K, Duarte E. Quantitation of relative fitness and great adaptability of clonal populations of RNA viruses. J Virol. 1991;65:2960–2967. doi: 10.1128/jvi.65.6.2960-2967.1991. [DOI] [PMC free article] [PubMed] [Google Scholar]
- 8.Little S J, McLean A R, Spina C A, Richman D D, Havlir D V. Viral dynamics of acute HIV-1 infection. J Exp Med. 1999;190:841–850. doi: 10.1084/jem.190.6.841. [DOI] [PMC free article] [PubMed] [Google Scholar]
- 9.Maeda Y, Venzon D J, Mitsuya H. Altered drug sensitivity, fitness, and evolution of human immunodeficiency virus type 1 with pol gene mutations conferring multi-dideoxynucleoside resistance. J Infect Dis. 1998;177:1207–1213. doi: 10.1086/515282. [DOI] [PubMed] [Google Scholar]
- 10.Miralles R, Moya A, Elena S F. Effect of population patchiness and migration rates on the adaptation and divergence of vesicular stomatitis virus quasispecies populations. J Gen Virol. 1999;80:2051–2059. doi: 10.1099/0022-1317-80-8-2051. [DOI] [PubMed] [Google Scholar]
- 11.Nagylaki T. Introduction to theoretical population genetics. Berlin, Germany: Springer-Verlag; 1992. [Google Scholar]
- 12.Neumann A U, Lam N P, Dahari H, Gretch D R, Wiley T E, Layden T J, Perelson A S. Hepatitis C viral dynamics in vivo and the antiviral efficacy of interferon-alpha therapy. Science. 1998;282:103–107. doi: 10.1126/science.282.5386.103. [DOI] [PubMed] [Google Scholar]
- 13.Neumann A U, Tubiana R, Calvez V, Robert C, Li T S, Agut H, Autran B, Katlama C. HIV-1 rebound during interruption of highly active antiretroviral therapy has no deleterious effect on reinitiated treatment. AIDS. 1999;13:677–683. doi: 10.1097/00002030-199904160-00008. [DOI] [PubMed] [Google Scholar]
- 14.Novella I S, Elena S F, Moya A, Domingo E, Holland J J. Size of genetic bottlenecks leading to virus fitness loss is determined by mean initial population fitness. J Virol. 1995;69:2869–2872. doi: 10.1128/jvi.69.5.2869-2872.1995. [DOI] [PMC free article] [PubMed] [Google Scholar]
- 15.Nowak M A, Bangham C R. Population dynamics of immune responses to persistent viruses. Science. 1996;272:74–79. doi: 10.1126/science.272.5258.74. [DOI] [PubMed] [Google Scholar]
- 16.Perelson A S, Neumann A U, Markowitz M, Leonard J M, Ho D D. HIV-1 dynamics in vivo: virion clearance rate, infected cell life-span, and viral generation time. Science. 1996;271:1582–1586. doi: 10.1126/science.271.5255.1582. [DOI] [PubMed] [Google Scholar]
- 17.Phillips A N, McLean A R, Loveday C, Tyrer M, Bofill M, Devereux H, Madge S, Dykoff A, Drinkwater A, Burke A, Huckett L, Janossy G, Johnson M A. In vivo HIV-1 replicative capacity in early and advanced infection. AIDS. 1999;13:67–73. doi: 10.1097/00002030-199901140-00009. [DOI] [PubMed] [Google Scholar]
- 18.Sevilla N, Ruiz-Jarabo C M, Gomez-Mariano G, Baranowski E, Domingo E. An RNA virus can adapt to the multiplicity of infection. J Gen Virol. 1998;79:2971–2980. doi: 10.1099/0022-1317-79-12-2971. [DOI] [PubMed] [Google Scholar]
- 19.Wei X, Ghosh S K, Taylor M E, Johnson V A, Emini E A, Deutsch P, Lifson J D, Bonhoeffer S, Nowak M A, Hahn B H, et al. Viral dynamics in human immunodeficiency virus type 1 infection. Nature. 1995;373:117–122. doi: 10.1038/373117a0. [DOI] [PubMed] [Google Scholar]
- 20.Zhang Y Y, Summers J. Low dynamic state of viral competition in a chronic avian hepadnavirus infection. J Virol. 2000;74:5257–5265. doi: 10.1128/jvi.74.11.5257-5265.2000. [DOI] [PMC free article] [PubMed] [Google Scholar]