Abstract
Eicosanoids are a family of bioactive lipids, including derivatives of the ubiquitous fatty acid arachidonic acid (AA). The intimate involvement of eicosanoids in inflammation motivates the development of predictive in silico models for a systems-level exploration of disease mechanisms, drug development and replacement of animal models. Using an ensemble modelling strategy, we developed a computational model of the AA cascade. This approach allows the visualisation of plausible and thermodynamically feasible predictions, overcoming the limitations of fixed-parameter modelling. A quality scoring method was developed to quantify the accuracy of ensemble predictions relative to experimental data, measuring the overall uncertainty of the process. Monte Carlo ensemble modelling was used to quantify the prediction confidence levels. Model applicability was demonstrated using mass spectrometry mediator lipidomics to measure eicosanoids produced by HaCaT epidermal keratinocytes and 46BR.1N dermal fibroblasts, treated with stimuli (calcium ionophore A23187), (ultraviolet radiation, adenosine triphosphate) and a cyclooxygenase inhibitor (indomethacin). Experimentation and predictions were in good qualitative agreement, demonstrating the ability of the model to be adapted to cell types exhibiting differences in AA release and enzyme concentration profiles. The quantitative agreement between experimental and predicted outputs could be improved by expanding network topology to include additional reactions. Overall, our approach generated an adaptable, tuneable ensemble model of the AA cascade that can be tailored to represent different cell types and demonstrated that the integration of in silico and in vitro methods can facilitate a greater understanding of complex biological networks such as the AA cascade.
Ensemble modelling approaches, which account for the uncertainty surrounding model parameters, were applied to the arachidonic acid cascade for the first time. The adaptable, tuneable model was tailored to represent different cell types and stimuli.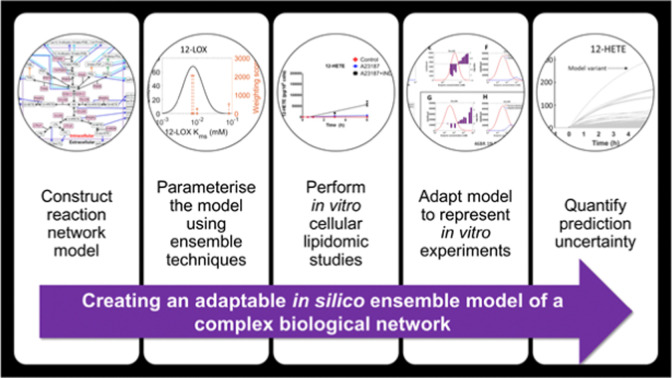
1. Introduction
Eicosanoids are a class of bioactive lipid mediators with hormone-like effects, known for their involvement in inflammation and immune reactions.1–5 They are derivatives of the 20-carbon (C-20) polyunsaturated fatty acid (PUFA) arachidonic acid (AA) and, to a lesser extent, the C-20 PUFAs dihomo-γ-linolenic acid (DGLA) and eicosapentaenoic acid (EPA). Eicosanoids control many physiological and pathophysiological processes; they are produced in response to cellular stressors and/or stimuli, are exported passively or via specific transporters, signal via dedicated G-protein coupled receptors, and can be enzymatically deactivated.4–9 This cascade of reactions allows cellular systems to control both the level and the activity of eicosanoids, offering a rapid response to inflammation and its resolution. Due to their involvement in various biological systems (e.g., cardiovascular, renal, reproductive, nervous, ocular, skin) in both health and disease, the eicosanoids have been targeted for the development of pharmacological agents including the widely used non-steroidal anti-inflammatory drugs.10–17
The eicosanoid cascade begins with the release of AA (or another precursor C-20-PUFA) from membrane glycerophospholipids through the action of phospholipases (PL)A2—this reaction is the rate-limiting step of the pathway.18,19 The resulting free AA is rapidly metabolised by cyclooxygenase (COX), lipoxygenase (LOX) and cytochrome P450 monooxygenase (CYP450) isoforms, to form various eicosanoid classes including prostaglandins (PG), leukotrienes (LT), thromboxanes (TX), and a range of epoxy, mono-hydroxy and poly-hydroxy fatty acids.4,5 Some eicosanoids, mainly hydroxyeicosatetraenoic acid (HETE) species, are also found esterified in membrane glycerophospholipids.20 Overall, the prevalence and profiles of eicosanoids are cell and/or organ-specific, depending on the expression of the relevant biosynthetic enzymes.
Given the important role of eicosanoids in physiological and pathophysiological cellular responses, there is a strong interest in developing computational models that can be reliably used to assess hypotheses, predict adverse reactions, and support the development of novel therapeutics.21–28 Currently, the majority of such in silico metabolic models focus on the AA cascade, as AA is the most abundant cellular C20-PUFA and the bioactivities of its metabolites are best understood. Existing models have simulated the AA cascade in human polymorphonuclear leukocytes (PMNL), endothelial cells and platelets,21,22 and murine RAW 264.7 macrophages,24,26,27 and have been validated using experimental lipidomic and transcriptomic data.
Most of the existing mathematical models of the AA cascade are based upon the principles of continual adaptation and refinement against experimental data. This method enables a critical assessment of the similarity of the in silico simulation to its in vitro experimental counterpart, and allows for its iterative improvement and adaptation as new information is acquired. However, a common limitation of the approach is the lack of quantification of the uncertainty and confidence of the resulting predictions. Parameter fitting is often employed to overcome the issue of incomplete data availability, but this can impact predictive power as parameter values may be over-fitted in the computational model, resulting in model predictions that closely fit existing experimental data, but contain kinetic parameters of limited accuracy and fail to predict system behaviour in new conditions.29 Recent developments in ensemble modelling strategies, which allow a rigorous assessment of prediction confidence, can overcome these limitations.30,31 In contrast to other modelling strategies, ensemble modelling does not directly use individual parameter values from databases. Instead, all available parameter data is processed into probability distributions of plausible values; these distributions can then be sampled repeatedly to produce an ensemble of model variants with unique sets of parameter values. To date, the principles of uncertainty and ensemble modelling have not been applied to computational models of the AA cascade.
Here, we use a combination of in silico and in vitro approaches to implement the first predictive adaptable ensemble model for a generic AA cascade. This approach allows explicit quantification of the uncertainty of the modelling process and simulated predictions, which has not been addressed in the existing models of the AA cascade and facilitates greater model flexibility than the published methods. The benefits of this approach are demonstrated by adapting the metabolic model to represent HaCaT epidermal keratinocytes and 46BR.1N dermal fibroblasts, at baseline and following stimulation to mimic the release of AA and consequential biochemical responses. This versatile predictive model can be adapted and expanded in the future as a tool to investigate the behaviour of the AA cascade in various systems.
2. Materials and methods
2.1. Cell culture
HaCaT human epidermal keratinocytes (CLS Cell Lines Service GmbH; Eppelheim, Germany) were cultured in Dulbecco's modified Eagle medium (DMEM; Sigma; Dorset, UK) supplemented with 10% heat-inactivated foetal bovine serum (FBS; Sigma, UK). 46BR.1N human dermal fibroblasts (The European Collection of Cell Culture; Salisbury, UK) were cultured in minimum essential Eagle medium (MEM; Sigma, UK) supplemented with 15% FBS, l-glutamine, non-essential amino acids and sodium pyruvate (200 nM each; Sigma, UK). Cells were grown at 37 °C, 5% CO2 and 95% humidity; media were changed every 2–3 days; trypsin/EDTA (Sigma, UK) was used to detach the cells when needed.
2.2. Cell treatments
Cells were grown to 80% confluency and treated as follows. Calcium ionophore experiments: calcium ionophore A23187 (5 μM; Sigma, UK) and calcium chloride (1.8 mM; Sigma, UK) were added to cell-appropriate serum-free media, cells were incubated for the required amount of time (0.5, 1, 3 and 6 h). When appropriate, cells were pre-treated with the COX-inhibitor indomethacin (IND) (10 μM; Sigma, UK) for 1 h; they were then washed with phosphate buffered saline (PBS; Sigma, UK) and treated with A23187 in serum-free media, as described above. ATP experiments: cells were treated with ATP (2 mM; Sigma, UK) in serum free media for the required amount of time (0.5, 1, 3 and 6 h). Ultraviolet radiation (UVR) experiments: cells were grown in Petri dishes and were transferred to PBS prior to UV irradiation (15 mJ cm−2) using a Herbert Waldmann 236 B (UV6) lamp (Villingen-Schwenningen, Germany). The cells were then transferred to the appropriate serum-free media and incubated for the required amount of time (0.5, 1, 3 and 6 h). In all cases, conditioned media and cells were collected at the end of treatment and stored at –80 °C awaiting analysis.
2.3. UPLC/ESI-MS/MS analysis of eicosanoids
Eicosanoid production was measured in the cell culture media by mediator lipidomics, using ultra-high performance liquid chromatography coupled to tandem mass spectrometry with electrospray ionisation (UPLC/ESI-MS/MS), as described in ref. 32 and 33. In brief, cell culture media samples were mixed with ice-cold methanol to a final concentration of 15% methanol (v/v), internal standards were added (20 ng each; PGB2-d4 and 12-HETE-d8; Cayman Chemical; Michigan, USA) and the pH of the solution was adjusted to 3.0. Samples were then semi-purified by solid-phase extraction (C18-E 500 mg cartridges, 6 mL; Phenomenex; Macclesfield, UK), lipids eluted with methyl formate and dried under nitrogen. Eicosanoids (PGE2, 15-keto PGE2, PGF2α, 13,14-dihydro-15-keto PGE2, 12-HETE, 15-HETE) were analysed by ultraperformance liquid chromatography (UPLC) (Acquity pump; Waters; Wilmslow, UK) coupled to a triple quadrupole mass spectrometer with electrospray ionisation (ESI-MS/MS) (Xevo TQ-S; Waters, UK). Details on the multiple reaction monitoring transitions and other settings used, are provided in ref. 32. Results are reported as pg of eicosanoid/million cells.
2.4. Fatty acid analysis
Cellular lipids were extracted using chloroform : methanol (2 : 1 v/v; Fisher Scientific; Loughborough, UK) containing butylated hydroxytoluene (0.01% w/v; Fisher Scientific, UK). Fatty acids, including AA, were then trans-esterified into fatty acid methyl esters (FAME) using boron trifluoride in methanol and heneicosanoic acid (21:0; Sigma Aldrich; Gillingham, UK) as the internal standard. FAME were analysed by gas chromatography with flame ionisation detection (GC-FID), as previously described in ref. 34. Results are reported as ng of AA/million cells.
2.5. Western blot analysis
Cell pellets were lysed in radioimmunoprecipitation assay buffer (RIPA, Sigma Aldrich, UK) containing a protease inhibitor cocktail (Sigma Aldrich, UK). Sample protein content was determined using the DC Protein Assay Kit II (Sigma Aldrich, UK) and was used to normalise the cellular extracts. Protein extracts were reduced (Laemmli sample buffer; Sigma Aldrich, UK) and separated on sodium dodecyl sulfate (SDS) gels (10%; Bio-Rad, UK). Trans-blotting was performed using polyvinylidene difluoride (PVDF) membranes (Fisher Scientific, UK). The membranes were then blocked with powder milk solution (5% w/v) and incubated with primary monoclonal antibodies for COX-2 (1:50 000 dilution) (Cayman Chemicals, USA) and GAPDH (1:30 000 dilution) (AbCam; Cambridge, UK), followed by the secondary HRP-linked anti-mouse (1:1000 dilution) (GE Healthcare; Amersham, UK), and the anti-biotin molecular weight ladder HRP-linked antibody (1:2000 dilution) (Cell Signalling Technology; Leiden, Netherlands). Treated membranes were overlaid with enhanced chemiluminescence solution and developed using a ChemiDOC MP Imaging System (Blot/Chemi-Sensitivity mode). Images were taken using Image Lab 4.1 (Bio-Rad, UK); ImageJ software was used for densitometry. The relative expression of proteins was calculated by normalising band intensity against the GAPDH loading control.
2.6. Kinetic model
2.6.1. Construction of the AA cascade metabolic model
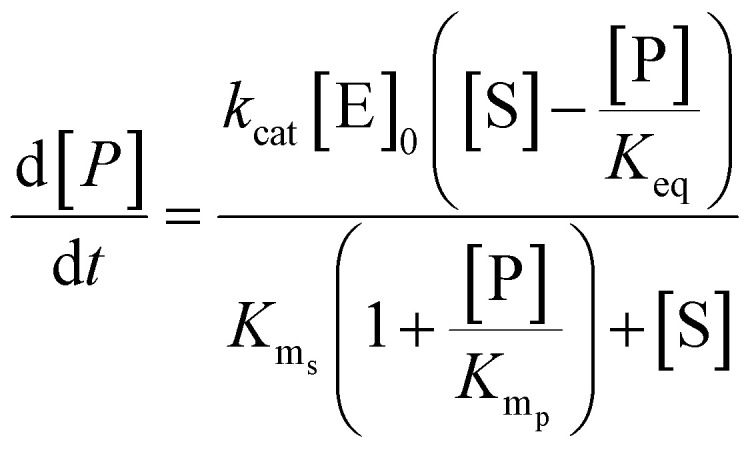
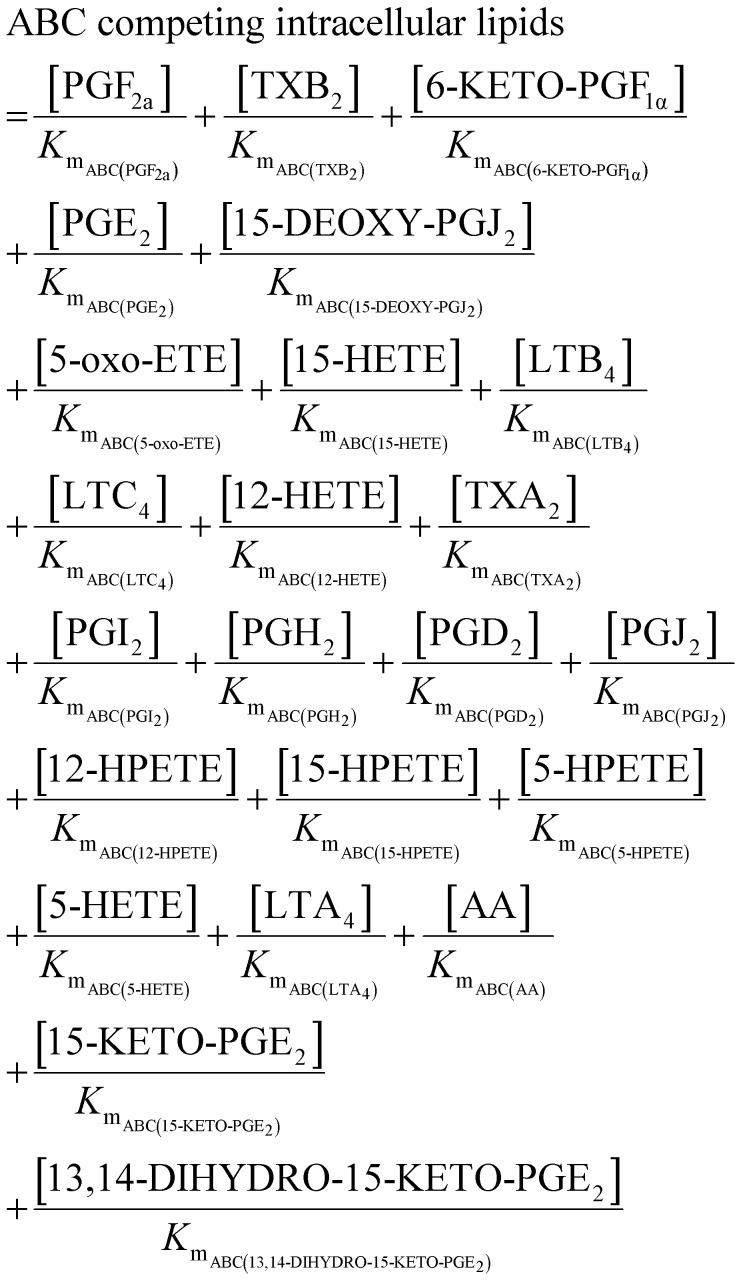
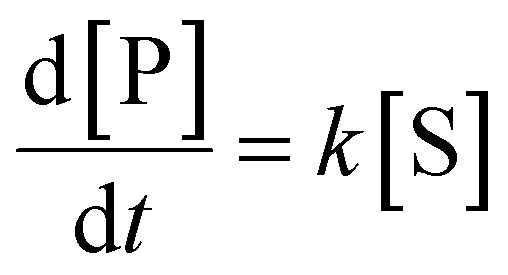
The construction of the generic model was carried out using the biochemical system simulator COPASI version 4.21.16635 and MATLAB® R2016A (MathWorks). The AA cascade reaction network was defined on the basis of existing literature and described in terms of reaction rate laws and differential equations for transport events and metabolite concentration changes, respectively (eqn (1)–(8), Table 1, ESI,† Tables S1–S6 and S12–S16). These equations show the generic formula used to describe substrate release, protein induction, enzymatic reactions, non-enzymatic reactions, transport reactions and degradation in the model. Each reaction in the model has a unique reaction number (reaction (1)–(113); ESI,† Tables S1–S6). The parameterisation of each reaction is described in Supplementary Documents S7–S11 (ESI†), whereupon each reaction is provided a unique identifier which is found in the contents of each Supplementary Document (ESI†).
Summary of network rate laws used for the construction of the AA cascade in silico model.
| Reaction type | Rate law | Equation number |
|---|---|---|
| Substrate release |
 . . |
(1) |
| Protein induction switch |

|
(2) |
| Enzymatic |
|
(3) |
| Non-enzymatic |

|
(4) |
| Transport |

|
(5) |
| Competing intracellular lipids (*) |
|
(6) |
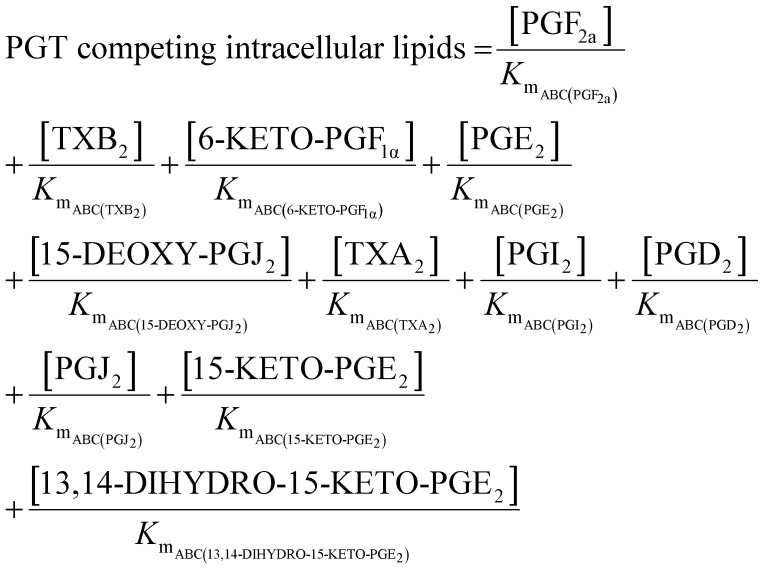
|
(7) | |
| Degradation |
|
(8) |
The initial metabolite concentrations were set as 10−28 mM, and simulations took place over 7 total simulated hours. The first simulated hour is an equilibration period to allow the system to reach steady state. Following this, an optional event occurs which mimics cell simulation, and the model runs for 6 further simulated hours. The optional event was controlled by adjusting the values of parameters in eqn (1) (Table 1) to alter the concentration of AA available to the model. The response of the model over the next 6 simulated hours was then recorded.
The parameters in eqn (1) (Table 1) represent different dynamics of AA release. For instance, maximum 6 h concentration of AA represents an unspecified source of AA from which intracellular AA is derived. The other parameters (Doubling Time of AA, Half Life of AA) were used to alter the rate at which AA became available upon stimulation and disappears afterwards, without assuming a specific mechanism underlying these dynamics. The Boolean parameter Decay Switch determines if the available AA concentration decreases subsequent to stimulation or not.
The enzyme abundances were assumed to remain constant for the duration of the 6 h simulated period after 1 h equilibration, representing the concentration of active enzymes. This assumption is a simplification of what is expected in the real biological systems, where enzyme concentrations are expected change in response to regulatory cascades activated by the stimulus. The intracellular volume was set as 1 pL and the extracellular volume to 1 nL, approximating the cell-to-media ratio in cell culture dishes.36
2.6.2. Parameterisation of the AA cascade model
The differential equations describing the AA cascade were parameterised by assigning numerical values to the kinetic parameters, protein concentrations of all relevant enzymes and transporters, decay rates and physical constants contained within them. The same elementary Michaelis–Menten kinetics were assumed for all enzymes, as data justifying more complex kinetics was not available. Parameterisation was performed according to our recently published ensemble modelling protocol,31 and involved collecting literature values for parameters alongside information pertaining to experimental conditions. This standardised pipeline was then utilised to score and weight values in a semi-automated fashion. log-normal distributions of kcat, Kms, Kmp, Keq, kf and kr values were defined from their corresponding weighted literature values to allow sampling of kinetic parameter and enzyme protein concentration values by Monte Carlo ensemble modelling.37–39 Each distribution was determined using weighted experimental data from multiple cell types reported in the protein database PaxDb,40 and represents the range of concentrations at which each enzyme has been detected.
An assumption of the model was that all chemical reactions (enzymatic and non-enzymatic) are theoretically reversible.41 To account for this, the terms for the Michaelis constant for the product (Kmp) and reverse reaction rate constant (kr) were included in each kinetic equation. However, no values for the Kmp or kr parameters could be found in the literature. Therefore, the pipeline developed by Tsigkinopoulou et al. (2018)31 was employed to generate thermodynamically consistent values for Kmp and kr, on the basis of the known (or estimated) equilibrium constant for each reaction. These parameters were assigned as the dependent parameters in enzymatic quadruplets or non-enzymatic triplets of kinetic parameters. Multivariate distributions were produced for each quadruplet or triplet, allowing a thermodynamically consistent value for the unknown parameters (Kmp and kr) to be calculated.
A comprehensive description of literature values underpinning the distributions of kinetic parameters (kcat, Kms, Kmp, Keq, kf and kr values), enzyme and transporter protein concentrations, decay rates, physical constants (e.g. gas constant), model equations/reactions, weighting system and log-normal distributions are provided in the Supplementary Documents S7–S11 (ESI†) and project MediaWiki (http://www.systemsbiology.ls.manchester.ac.uk/wiki/index.php/Welcome_to_AA-Model-MediaWiki). Model scripts are also available at https://github.com/GS-Horne-UoM/Uttley_Adaptable_Model.
2.6.3. Solving the AA cascade model
Ordinary differential equations (ODEs) (ESI,† Table S12) were solved using the ode15s solver in MATLAB® R2016A (MathWorks). Ensembles of model variants were generated by randomly sampling 1000 values from the log-normal probability distribution of each parameter. Each model variant was assigned one of the unique parameter sets. In order to account for the competitive inhibition of multiple species passing through the same transporter, a parameter was introduced into the ODEs for transport reactions. This term represents the affinity of each metabolite for the transporter using their individual Km parameter.
2.6.4. Adapting and quality scoring the model
To further adapt the model, the option to change protein expression was incorporated into the adaptable structure, as key enzymes of the eicosanoid cascade (e.g., COX-2) are inducible, leading to protein concentration and enzymatic activity changes following exposure to various stimuli (eqn (2) – Table 1). This option of the model allows the user to change the concentration of any enzyme in the cascade by altering the value of protein induction parameters, at set time points during the simulation.
In order to adapt the enzyme abundance profile, the Kolmogorov–Smirnov (KS) test was used to detect significant differences between the parameter distributions in the most accurate members of the ensemble and distributions from which the parameters were originally sampled. The accuracy of model variant predictions was evaluated by comparing the concentration of metabolites in the model predictions to those of the in vitro experiments, and calculating a quality score as described by eqn (9). The quality score is based on the logarithm of the probability density function of a Gaussian distribution, thus yielding a weighted distance between the model prediction and the corresponding experimental data. Lower non-zero quality scores indicate a more accurate model variant.
 |
9 |
where E is the log of the experimental data point and S is the log of the simulation data.
To assess the overall quality of an ensemble of models in each in silico experiment, an additional ensemble-level quality score, the Ψ score, was introduced. This score represents the percentage of model variants predicting metabolite concentrations in a relatively close range to experimental data. Three types of Ψ scores were calculated, and the models were ranked accordingly. The scores were: (A) “Time point Ψ” score; this assesses the percentage of ensemble model variants predicting concentrations in relatively close range to individual data points (quality scores > −10), (B) “Metabolite Ψ” score; this assesses the percentage of ensemble model variants predicting concentrations in relatively close range to a series of data points for each metabolite (cumulative quality score > −40), (C) “Total Ψ” score; this assesses the percentage of ensemble model variants predicting metabolite concentrations that are relatively close to all data points (cumulative quality score > −500) (ESI,† Table S16).
2.6.5. Statistical analysis of quality scores relative to experimental data
For each parameter in the model, a one-sample KS test was used to test for statistically significant differences between the distribution of the parameter values in the top ten percent best-fitting models, compared with the originally-sampled parameter distribution. A Bonferroni correction was applied to compensate for multiple testing and control the family-wise error rate at 1%, considering a total number of hypotheses of 184 (i.e., total number of parameters).
3. Results and discussion
Here we present the first mathematical ensemble model of AA metabolism, which explicitly quantifies prediction uncertainty by employing a Monte Carlo ensemble modelling method to acknowledge parameter uncertainty.30,37–39 Experimentally, six eicosanoid species were detected above the limit of quantification of the UPLC-MS/MS assay (Section 2.3), in HaCaT keratinocytes (PGE2, 15-keto PGE2, PGF2α, 13,14-dihydro-15-keto PGE2, 12-HETE, 15-HETE), whilst three species were detected above the limit of quantification in 46BR.1N fibroblasts (PGE2, 12-HETE, 15-HETE). Thus, we explore the experimental and computational data for products of COX, 12-LOX and 15-LOX as no experimental data was available for leukotrienes. Subsequently, we developed a novel quality scoring method to quantitatively investigate the proximity between an ensemble of in silico model variants and in vitro data. This facilitated model adaptation by inferring the probable enzyme concentrations of the eicosanoid reaction network (e.g., COX-1, COX-2, 12-LOX, 15-LOX) in HaCaT keratinocytes and 46BR.1N fibroblasts.
3.1. Creating a model of the AA reaction network
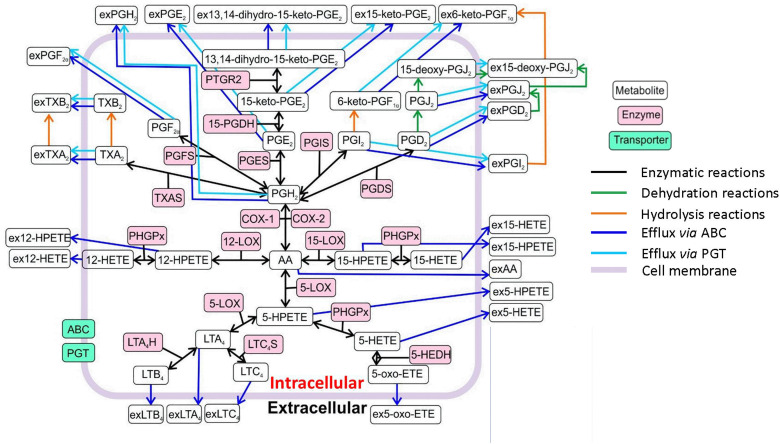
Our ensemble model of the AA cascade includes 113 reactions and 49 metabolites; thus, it provides a more comprehensive view of the AA cascade compared with the currently published models21,22,24,26,27 (Fig. 1 and ESI,† Tables S1–S6, S12–S16, Supplementary Documents S7–S11). The network includes key lipid mediators as well as enzymatic, non-enzymatic and transport reactions taking place in the intracellular and extracellular compartments of a generic cell. To reduce the complexity of the model, we opted to disregard feedback mechanisms that are included in some previously-published AA cascade models.21,27,28 The metabolism of AA via CYP, hydrolysis of glycerophospholipid-esterified HETE, and formation of cysteinyl leukotrienes and related feedback loops were not included either. These reactions could be included in future iterations of our model, as it becomes adapted to a wider range of cell types including immune cells. Our model also excludes the processes of transcription and translation, which are considered to occur at a much slower timescale than the dynamics we simulate.42,43 Future iterations of the model could include these processes to allow application to a wider range of scenarios.
Fig. 1. Overview of the reaction network of the in silico model of the AA cascade. The model includes intracellular production by enzymatic and non-enzymatic reactions (oxygenation; dehydration; hydrolysis), efflux to the extracellular compartment (ABC transporters) and prostaglandin transporter (PGT) mediated reactions. Abbreviations: arachidonic acid (AA), extracellular prostaglandin H2 (exPGH2), extracellular prostaglandin E2 (exPGE2), extracellular 13,14-dihydro-15-keto-prostalgandin E2 (ex13,14-dihydro-15-keto-PGE2), extracellular 15-keto-prostalgandin E2 (ex15-keto-PGE2), extracellular 6-keto-prostaglandin F1α (ex6-keto-PGF1α), extracellular prostaglandin F1α (exPGF1α), 13,14-dihydro-15-keto-prostaglandin E2 (13,14-dihydro-15-keto-PGE2), 15-deoxy-prostaglandin J2 (15-deoxy-PGJ2), extracellular 15-deoxy-prostaglandin J2 (ex15-deoxy-PGJ2), extracellular thromboxane B2 (exTXB2), thromboxane B2 (TXB2), prostaglandin reductase 2 (PTGR2), prostaglandin F2α (PGF2α), 15-keto-prostaglandin E2 (15-keto-PGE2), 6-keto-PGF1α (6-keto-PGF1α), prostaglandin J2 (PGJ2), extracellular prostaglandin J2 (exPGJ2), extracellular prostaglandin D2 (exPGD2), 15-prostaglandin dehydrogenase (15-PGDH), extracellular thromboxane A2 (exTXA2), thromboxane A2 (TXA2), prostaglandin F synthase (PGFS), prostaglandin E synthase (PGES), prostaglandin E2 (PGE2), prostaglandin I synthase (PGIS), prostaglandin I2 (PGI2), prostaglandin D2 (PGD2), extracellular prostaglandin I2 (exPGI2), thromboxane A synthase (TXAS), prostaglandin H2 (PGH2), prostaglandin D synthase (PGDS), cyclooxygenase-1 (COX-1), cyclooxygenase-2 (COX-2), extracellular 12-hydroperoxy-eicosatetraenoic acid (ex12-HPETE), phospholipid hydroperoxide glutathione peroxidase (PHGPx), 12-lipoxygenase (12-LOX), 15-lipoxygenase (15-LOX), extracellular 15-hydroxy-eicosatetraenoic acid (ex15-HETE), extracellular 15-hydroperoxy-eicosatetraenoic acid (ex15-HPETE), extracellular 12-hydroxy-eicosatetraenoic acid (ex12-HETE), 12-hydroperoxy-eicosatetraenoic acid (12-HPETE), 15-hydroxy-eicosatetraenoic acid (15-HETE), extracellular arachidonic acid (ex-AA), 5-lipoxygenase (5-LOX), 5-hydroperoxy-eicosatetraenoic acid (5-HPETE), extracellular 5-hydroperoxy-eicosatetraenoic (ex5-HPETE), extracellular 5-hydroxy-eicosatetraenoic acid (ex5-HETE), 5-hydroxy-eicosatetraenoic acid (5-HETE), 5-hydroxyeicosanoid dehydrogenase (5-HEDH), 5-oxo-eicosatetraenoic acid (5-oxo-ETE), extracellular 5-oxo-eicosatetraenoic acid (ex5-oxo-ETE), leukotriene A4 (LTA4), leukotriene C4 synthase (LTC4S), leukotriene A4 hydrolase (LTA4H), leukotriene B4 (LTB4), leukotriene C4 (LTC4), extracellular leukotriene B4 (exLTB4), extracellular leukotriene A4 (exLTA4), extracellular leukotriene C4 (exLTC4), ATP-binding cassette transporter (ABC), prostaglandin transporter (PGT).
PLA2-mediated AA release acts as a trigger for eicosanoid cascade activation. As this process involves multiple isoforms and glycerophospholipid substrates that are beyond the scope of this model,18,19 we instead simulated the initiation of the AA cascade based upon enzymatic release of AA (reaction (1), ESI,† Table S1), non-enzymatic accumulation of AA (reaction (95); Table 1, ESI,† Table S1 and Supplementary Document S.11.1.) and the release of AA from membrane-bound sources via a non-enzymatic route (reaction (113); ESI,† Table S1, Supplementary Document S.11.3.). Furthermore, each reaction can be turned on/off by changing the value of its parameters (kcat, Kms, Kmp, Keq and [Enzyme]0). In the applications described here, reaction (95) (ESI,† Table S1 and Supplementary Document S.11.1.); represented in eqn (1) was turned on, leading to a sudden release of AA into the system, whilst reactions (1) and (113) were turned off. The simplified dynamics of AA release in Reaction (95) were manually defined to match the observed dynamics of AA (ESI,† Table S1 and Supplementary Document S.11.1.). This mechanism ensured that metabolite concentration matched our in vitro observations and allowed multiple AA release dynamics to be explored during model refinement.
3.2. Modelling parameterisation uncertainty
Parameterisation using an ensemble modelling pipeline allowed for standardised and semi-automated scoring of published data to produce log-normal distributions of kcat, Kms, Kmp, Keq, kf and kr and [Enzyme]0 in the network.31 Ensemble parameterisation also enables the incorporation of literature data from multiple sources (e.g., PaxDB, BRENDA, MetaCyc),44–46 and the subsequent supplementation of parameters should new data become available. In some cases, where incomplete sets of kinetic information were obtained, parameter distributions were produced from the most analogous information available (e.g., 5-LOX and 5-LOX/5-LOX activating protein (5-LOX/FLAP) parameter distributions for Kms and kcat were produced from the same set of literature values) (ESI,† Tables S7–S11). As PaxDB does not report exact enzyme abundance values, future proteomic studies would enable further optimisations leading to more accurate models.
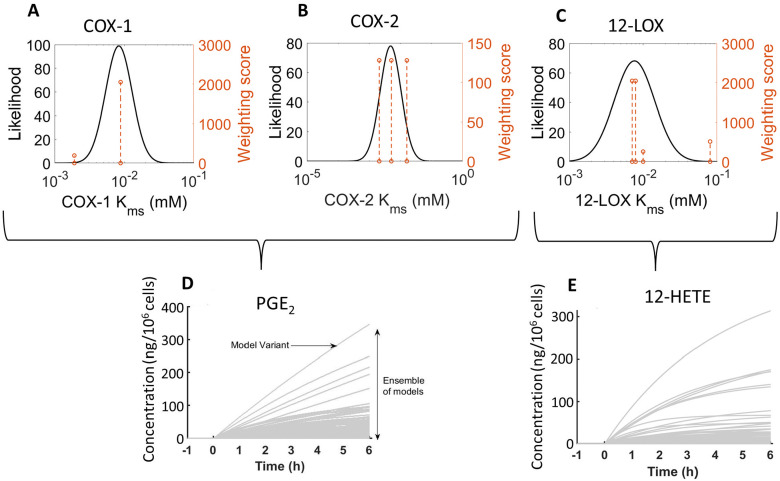
As an example of our approach, we demonstrate how we used the Kms literature values for COX-1, COX-2, and 12-LOX, to produce their likelihood weighting (Fig. 2(A)–(C)). Upon initiation, we randomly sampled the log-normal distributions of all kinetic parameters, to generate ensembles of 1000 model variants with unique parameter values. Each model variant produced a single set of predictions of metabolite concentrations over 6 h, resulting in a range of simulated behaviours for the concentration of the respective reaction product (e.g., PGE2 and 12-HETE, respectively, Fig. 2(D) and (E)). In comparison, published in silico models of the AA cascade rely on single literature value parameters or parameter fitting, which may poorly describe the modelled system.24,26,27 While fitting methods result in parameters that optimally describe existing experimental results, overfitting may produce implausible values or ignore alternative, plausible values.29,47
Fig. 2. log-normal distribution of COX-148,49 (A), COX-250–52 (B), and 12-LOX53–56 (C) Kms values and resultant predictions of PGE2 (D) and 12-HETE (E) concentration by an ensemble model (1000 model variants). The dashed orange line represents published values and the height corresponds to the weighting score from the parameter estimation pipeline.31 The source of this demonstration data was the HaCaT model of indomethacin (IND) + calcium ionophore (A23187) stimulated in silico model (“HaCaT + IND + A23187”).
By capturing the uncertainty associated with each parameter value, our approach allows us to simulate the behaviour of an ensemble of models covering a range of plausible parameter combinations and thus assess the full range of system behaviour compatible with our current knowledge of the parameter values and network topology. However, overestimation of the uncertainty of kinetic parameters could occur as values observed in a wide range of circumstances are considered when determining parameter distributions. For instance, if experimental outliers are included in the parameterisation pipeline, this could result in overestimating the range of plausible values and thus the uncertainty of the kinetic parameters. The weighting process is designed to account for this, and other scenarios such as data sources which may be unsuitable due to their quality, reliability or relevance. Kinetic values of this nature can be further discounted in a principled and documented way using the parameterisation pipeline we employed31 to generate more informative priors.
3.3. The AA cascade in HaCaT keratinocytes and 46BR.1N fibroblasts
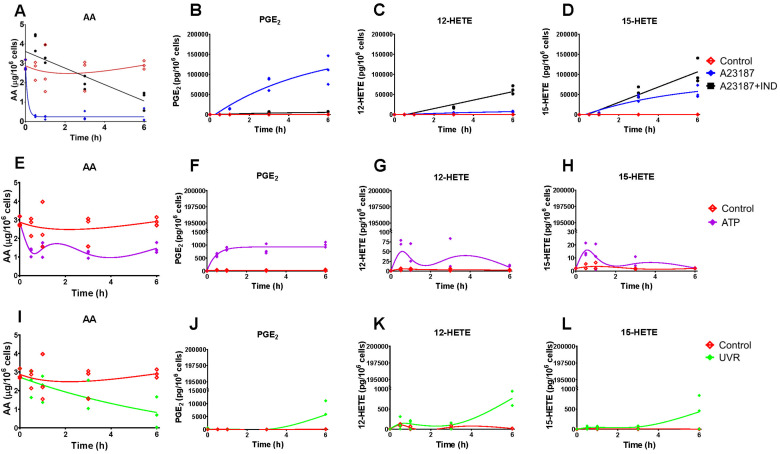
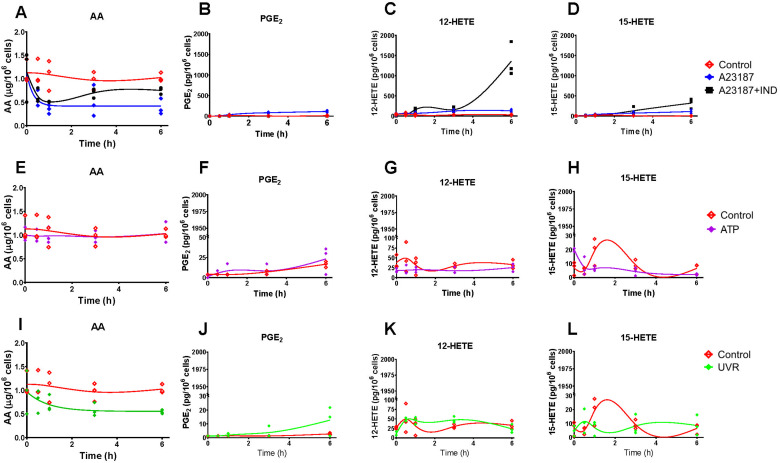
In order to generate in vitro data to assess and support adaptations of the model, we used two human cell lines, HaCaT epidermal keratinocytes and 46BR.1N dermal fibroblasts. Cells were exposed to four treatments, each representing distinct biochemical/pharmacological events: (a) calcium ionophore A23187 to initiate the AA cascade; (b) A23187 in the presence of the COX inhibitor IND; (c) stimulation of the AA cascade by ATP; (d) UV irradiation to activate the AA cascade and upregulate COX-2 expression. Eicosanoid production was assessed by mediator lipidomic analysis of the cell culture media32,33 (HaCaT epidermal keratinocytes and 46BR.1N dermal fibroblasts, Fig. 3 and 4, respectively).
Fig. 3. Levels of cellular arachidonic acid (AA) and eicosanoids produced by HaCaT keratinocytes stimulated with calcium ionophore A23187 and indomethacin (IND) (A)–(D), ATP (E)–(H) and ultraviolet irradiation (UVR) (I)–(L). Eicosanoid production by untreated control cells (CTR; red) and post stimulation with A23187 (5 μM, blue), A23187 + IND (10 μM, black), ATP (2 mM, purple) and UVR (15 mJ cm−2, green) treatment was measured over time (0, 0.5, 1, 3 and 6 h) by UPLC/ESI-MS/MS; AA release was measured by GC-FID. Data shown as individual points, n = 3 independent experiments. Non-linear lines of best fit are shown for untreated control (red) and treated cells as a visual guide only, and do not imply a mechanistic model or most likely dynamics. Hydroxy-eicosatetraenoic acid, HETE; prostaglandin E2, PGE2.
Fig. 4. Levels of cellular arachidonic acid (AA) and eicosanoid produced by 46BR.1N fibroblasts stimulated with calcium ionophore A23187 and indomethacin (IND) (A)–(D), ATP (E)–(H) and ultraviolet irradiation (UVR) (I)–(L). Eicosanoid production by untreated control cells (CTR; red) and post stimulation with A23187 (5 μM, blue), A23187 + IND (10 μM, black), ATP (2 mM, purple) and UVR (15 mJ cm−2, green) treatment was measured over time (0, 0.5, 1, 3 and 6 h) by UPLC/ESI-MS/MS; AA release was measured by GC-FID. Data shown as individual points, n = 3 independent experiments. Non-linear lines of best fit are shown for untreated control (red) and treated cells as a visual guide only and do not imply a mechanistic model or most likely dynamics. Hydroxy eicosatetraenoic acid, HETE; prostaglandin E2, PGE2.
Experimentally, a major distinction between the two cell types examined here was that 46BR.1N fibroblasts had lower levels of cellular AA (Fig. 4(A), (E), (I) and 3(A), (E), (I) respectively), were not as responsive to the stimuli (Fig. 4(B)–(D), (F)–(H), (J)–(L) and 3(B)–(D), (F)–(H), (J)–(L), respectively) and had different COX-2 expression profiles (Fig. 5(B) and (A), respectively) than HaCaT keratinocytes. Cellular AA concentration was found approximately 3-fold higher in unstimulated HaCaT keratinocytes (2.9 μg/106 cells) compared with 46BR.1N fibroblasts (1.1 μg/106 cells) (Fig. 3(A) and 4(A)). Treatment with A23187 decreased cellular AA with concomitant increased production of COX-derived PGE2 and LOX-derived 12-HETE and 15-HETE, in both cell lines; HaCaT keratinocytes produced these eicosanoids at much higher concentrations than 46BR1.N fibroblasts, ranging from one to four orders of magnitude, also reflecting the higher cellular AA levels (Fig. 3(A)–(D) and 4(A)–(D)). COX inhibition directed AA to the LOX pathway increasing concentrations of 12-HETE and 15-HETE (Fig. 3(A)–(D) and 4(A)–(D)). Treatment with ATP, a stimulus of the AA cascade successfully used in murine RAW 264.7 macrophages,57 increased PGE2 production but had little impact on the production of 12- and 15-HETE by HaCaT keratinocytes, whilst little to no activation of the AA cascade was observed in the 46BR.1N fibroblasts (Fig. 3(E)–(H) and 4(E)–(H)).
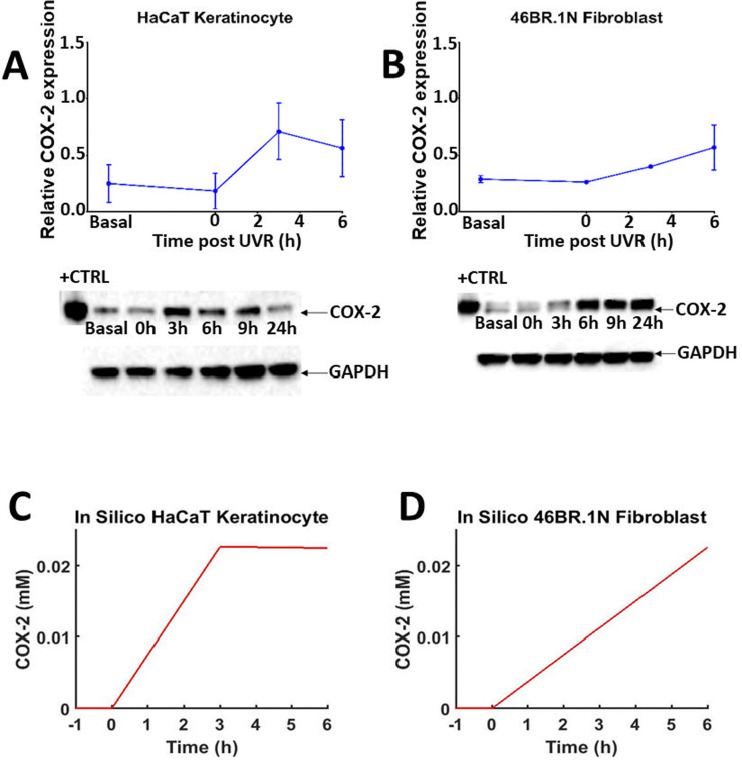
Fig. 5. Time-dependent COX-2 protein expression post UVR treatment in HaCaT keratinocytes and 46BR.1N fibroblasts (A) and (B) and in silico prediction (C) and (D). Normalised mean protein expression (n = 3 independent experiments) and representative western blots for COX-2 and GAPDH (loading control) in HaCaT keratinocytes (A) and 46BR.1N fibroblasts (B) before (basal) and post UVR treatment (15 mJ cm−2 UVR). Data expressed as mean ± SEM. “HaCaT + UVR” (C) and “46BR.1N + UVR” (D) in silico experiments, showing median COX-2 protein concentration over 6 h in 1000 model variants.
Cell treatment with UVR increased production of PGE2 3–6 h post stimulation (Fig. 3(J) and 4(J)), an effect attributed to UVR-induced upregulation of COX-2.58,59 PGE2 production was much more pronounced in UVR-treated HaCaT keratinocytes than UVR-treated 46BR.1N fibroblasts. Western blot analysis confirmed upregulation of COX-2 protein expression in both cell lines (Fig. 5). In HaCaT keratinocytes COX-2 expression was faster and peaked at 3 h post UVR treatment, whereas in 46BR.1N fibroblasts it increased gradually up to 6 h post UVR treatment (Fig. 5(A) and (B)), in accordance with the higher concentrations of eicosanoids produced by HaCaT keratinocytes.
3.4. Adapting the model to represent HaCaT keratinocytes and 46BR.1N fibroblasts
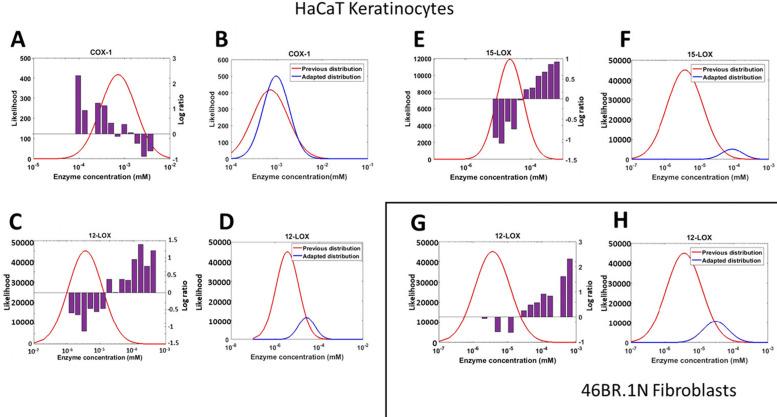
The generic in silico model of the AA cascade was further adapted based on the in vitro experimental data, to represent the HaCaT keratinocytes and 46BR.1N fibroblasts. Predictions from each generic model variant were assessed for accuracy via our novel quality score (eqn (9)). The distribution of [Enzyme]0 values in the most accurate models was then assessed against the mode of the original distribution, identifying parts of the distribution where values were enriched or depleted in the best-performing members of the ensemble (Fig. 6). If the parameter distribution of the most accurate model variants were significantly different from the original distribution, the distribution was adjusted to favour the sampling of [Enzyme]0 values that are enriched in well-performing models. Therefore, comparison of the range of predicted metabolite concentrations and experimental data allowed further constraints to be placed on the range of plausible values which [Enzyme]0 could take.
Fig. 6. Adapting the protein (enzyme) concentration profile in the generic in silico model to generate HaCaT keratinocyte and 46BR.1N fibroblast models. Comparison between the originally sampled parameter distribution and the actual parameters in ensemble members that best predicted the experimental data of HaCaT keratinocytes. The purple bar plots represent the log-ratio of the number of high-quality models containing values in this range, relative to their expected frequency in the sample (A), (C) and (E). The adapted protein (enzyme) concentration distributions for the model of HaCaT keratinocytes, compared with the original distribution (COX-1, 12-LOX and 15-LOX; all P < 0.01); the apparent smaller area under the curve for the adjusted distributions is due to the log-scale of the x-axis (B), (D) and (F). Comparison between the expected parameter values according to the parameter distribution and the actual parameters that belonged to the model variants which predicted the experimental data in 46BR.1N fibroblasts; the purple bar plots represent the log-ratio of the number of high-quality models containing values in this range, relative to their expected frequency in the sample (G). The adapted protein (enzyme) concentration distribution of 46BR.1N fibroblasts, compared with the original distribution (P < 0.01); the apparent smaller area under the curve for the adjusted distribution is due to the log-scale of the x-axis (H).
Generic model variants that most accurately predicted the HaCaT keratinocyte in vitro data demonstrated statistically significantly different parameter values for COX-1, 12-LOX and 15-LOX enzyme concentrations compared with the originally sampled distribution (P < 0.0001) (Fig. 6(A)–(F)). COX-1 shows a narrower range of values than anticipated, leading to a tightening of the distribution in the successful model (Fig. 6(A) and (B)). Initially, COX-1 concentrations in the range 10−4–10−2 mM were expected in HaCaT keratinocytes; however, the adapted distribution shows that the true distribution was much tighter around 10−3 mM. Accurate model variants also had higher concentrations of 12-LOX and 15-LOX than expected from published information (Fig. 6(C)–(F)). The concentrations of both 12-LOX and 15-LOX were initially distributed between 10−7 and 10−4 mM; however, accurate model variants used 12-LOX concentrations in the range 10−6–10−4 mM, and 15-LOX concentrations in the range 10−5–10−4 mM.
When comparing the predictions of the generic model to the 46BR.1N fibroblast data, only the concentration of 12-LOX was statistically significantly different (P < 0.0001) (Fig. 6(G) and (H)). Again, the adapted distribution shifts towards higher concentrations and becomes narrower, as value ranges that yielded inaccurate predictions are excluded. The 46BR.1N fibroblast model was adapted from the same initial model as the HaCaT keratinocytes, so the initial 12-LOX concentration distribution was identical for both cell types (10−7–10−4 mM); however, in accurate models of 46BR.1N fibroblasts, the sampled 12-LOX concentrations were found in a much narrower range of 10−5–10−4 mM.
In a published model of anti-inflammatory drug targets in the AA cascade, cell-specific model adaptations were performed by excluding reactions with no experimentally detected products.22 However, the network topology could be oversimplified by deleting reactions, as all reactions may be possible in every cell type but not with the same favourable kinetics. Furthermore, deleting reactions can impede model adaptability, as subsequent work may need to reintroduce reactions if the relevant products are detected.22 Our approach facilitated more robust model adaptation, as the overall network topology was retained and reaction kinetics were adjusted by constraining the probability distribution of published values. Related to this, if specific pathways are not present in a cell type of interest, the corresponding enzyme concentrations should be set to zero. Adapting the model's protein profile using cell-specific protein data would help with further refining this process. Moreover, in future model adaptations, additional targeted experimentation could be used to constrain plausible parameter values that currently have particularly high uncertainty and/or strong influence on model behaviour.
3.5. Adaptations to represent responses to stimuli and inhibitors in silico
As cellular eicosanoid profiles depend on both the expression of relevant enzymes (e.g., COX) and availability of substrate fatty acid (e.g., AA), the options to modify both parameters were included in the in silico model. To simulate the differences in COX-2 protein induction in various cell types in silico, an equation describing protein expression and activity was introduced (eqn (2) and Table 1). The parameters of this equation were chosen so that the COX-2 concentration increased at fixed timepoints across a time-course approximating the dynamics of COX-2 induction seen in the in vitro data (ESI,† Table S15 and Fig. 5(C), (D)). Future adaptations of the model could expand to accommodate protein and gene expression of further inducible enzymes important for the AA cascade in various systems.
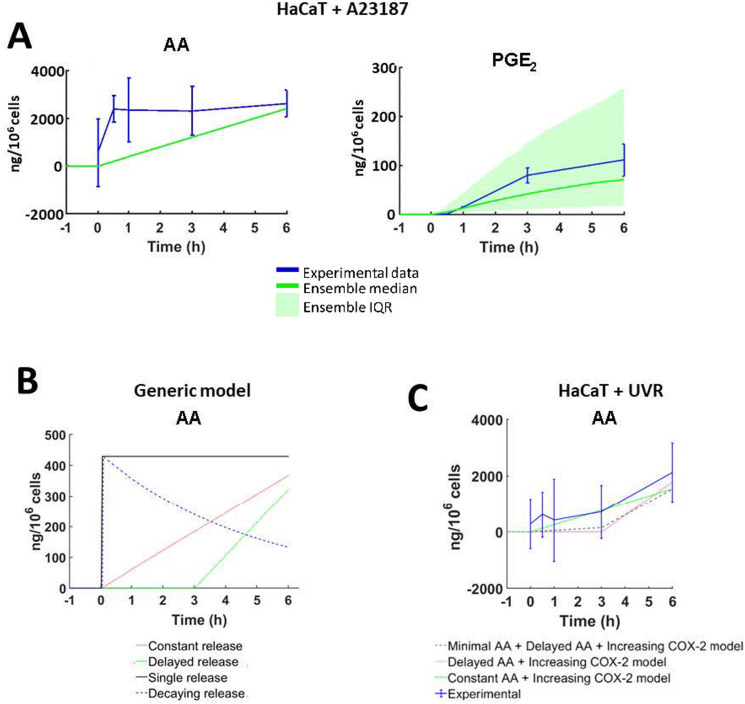
To explore the dynamics of AA release in each cell type and following different treatments, eqn (1) was parameterised with a unique set of estimated values based upon in vitro data of cell lines and stimuli/inhibitors, respectively (eqn (1) and ESI,† Table S13). The parameter “Maximum 6 h Concentration of AA” was estimated based on the qualitative trend of eicosanoid production in corresponding in vitro cultures (Fig. 7(A) and ESI,† Table S13). In comparison, published models of the AA cascade perform model refinement against experimental data of a single stimulus and cell type. As a result, they cannot adapt the dynamics and magnitude of parameters such as AA release, to reflect the behaviour of different cell types and stimuli.21–28 To overcome this limitation, Yang et al. adapted the flexibility of their models by excluding reactions from the system.22 A specific advantage of our model is that alternative AA release dynamics can be tailored to alter the release of AA depending on experimental design or hypotheses tested. Fig. 7(B) and ESI,† Table S14 illustrate four examples of putative patterns of AA release: single release, decaying release, constant release and delayed release.
Fig. 7. Stimulus-specific adaptations to the arachidonic acid (AA) network models. (A) In silico AA concentrations simulated to reflect total in vitro eicosanoid production by HaCaT keratinocytes stimulated with calcium ionophore A23187 (5 μM). Experimental data shown as mean ± SD; (n = 3 independent experiments; in silico data shown as median ± the interquartile range (IQR) of 1000 model variants). (B) Four examples of the dynamic way AA can be introduced into the cascade: single pulse (black), constant (red), decaying (blue) and delayed (green). These examples were created by amending the value of parameters in eqn (1), at set time points (ESI,† Table S14). (C) AA available for the eicosanoid cascade as predicted by the “HaCaT + UVR” optimisation models. ‘Minimal AA + Delayed AA + COX-2’ (grey), ‘Delayed AA’ (pink), ‘Constant AA + COX-2’ (green), ‘Constant AA’ (green) models; experimental data (blue) shown as mean ± SD, n = 3 independent experiments; in silico data shown as median ± the IQR of 1000 model variants.
The easy adaptability of the model afforded by the flexible AA release dynamics was useful when adjusting the model for simulations of UVR treatment (Fig. 7(C)). “Minimal” AA release was simulated by releasing 10% of the total AA concentration between 0–3 h post-simulation, and the remaining 90% was released between 3–6 h post-simulation. Flexible control of AA release provides a robust tool for future adaptations, as a range of stimuli and cell types can be simulated without the need to add or remove reactions. Further iterations of our model could accommodate complex biological reactions including single or multiple substrate availability and inducible enzyme expression.
3.6. Quantification of prediction uncertainty and confidence of the adapted in silico models
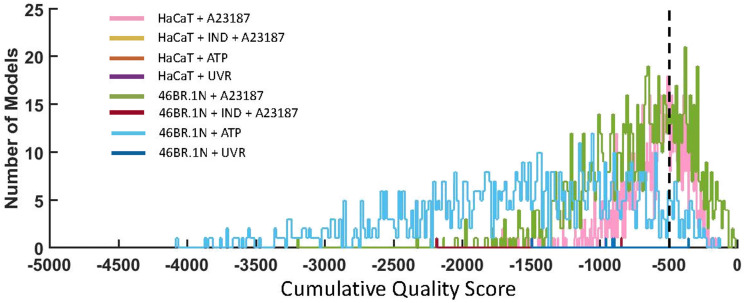
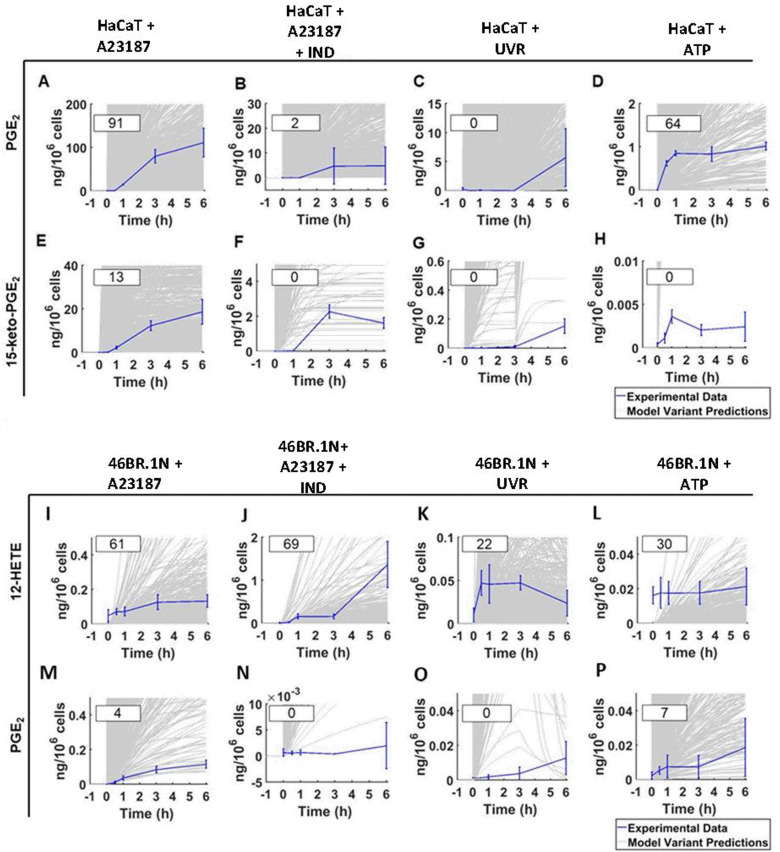
Quality score analysis (eqn (9)) was undertaken to assess the accuracy of the in silico experiment predictions, compared with the experimental data. Predictions from our simulated scenarios indicated a good qualitative agreement with experimental counterparts, with the A23187 stimulated models producing the most accurate predictions, for both HaCaT keratinocytes and 46BR.1N fibroblasts. Their “Total Ψ” scores are 38 and 31 respectively, meaning that 38% of HaCaT + A23187 model variants had a cumulative quality score of >−500 for all timepoints, whilst 31% of 46BR.1N + A23187 model variants had a cumulative quality score of >−500 for all timepoints (Fig. 8).
Fig. 8. Quality scores comparing the proximity of all ensemble in silico model variants with their in vitro counterparts using eqn (9). The accuracy of HaCaT keratinocyte models were calculated by comparing the predicted and measured concentration of six eicosanoids (PGE2, PGF2α, 12-HETE, 15-HETE, 15-keto-PGE2 and 13,14-dihydro-15-keto-PGE2) at four time points (0.5 h, 1 h, 3 h and 6 h post stimulation). The accuracy of 46BR.1N fibroblast models was calculated by comparing the predicted and measured concentration of three eicosanoids (PGE2, 12-HETE and 15-HETE) at four time points (0.5 h, 1 h, 3 h and 6 h post stimulation). A cumulative quality score of >−500 (black, dashed line) indicated that a model variant predicted metabolite concentrations within a relatively close range to experimental data for all datapoints.
When comparing the two models, the average “Metabolite Ψ” scores indicated that the HaCaT keratinocyte model is more accurate in predicting COX-mediated AA metabolism. “Metabolite Ψ” scores indicated that 57% of model variants accurately predicted PGF2α and 39% of model variants accurately predicted PGE2, whilst 12-HETE and 15-HETE were predicted accurately in 3% and 2% of models respectively (ESI,† Table S16). Conversely, the 46BR.1N model is more accurate in predicting LOX-derived AA metabolites. The metabolite 12-HETE was predicted accurately in 46% of 46BR.1N model variants, whilst PGE2 was predicted accurately in only 3% of 46BR.1N model variants according to the “Metabolite Ψ” score (Fig. 9 and ESI,† Table S16). Overall, these findings show that the in silico model can differentiate between the main metabolic pathways active in each cell type examined (Fig. 3 and 4).
Fig. 9. Experimental data compared with the predicted data for examples of highly accurately and inaccurately predicted metabolites in the “HaCaT keratinocyte” in silico experiments (PGE2, high accuracy example; 15-keto-PGE2, low accuracy example) and “46BR.1N fibroblast” in silico experiments (12-HETE, high accuracy example; PGE2, low accuracy example). Predicted and experimental data, alongside calculated “Metabolite Ψ” scores, are shown for HaCaT keratinocytes stimulated with (A) and (E) calcium ionophore A23187, (B) and (F) calcium ionophore A23187 and the COX inhibitor IND, (C) and (G) UVR and (D) and (H) ATP. The HaCaT eicosanoid profiles shown are PGE2 (A)–(D) and 15-keto-PGE2 (E)–(H). Predicted and experimental data are shown for 46BR.1N fibroblasts stimulated with (I) and (M) calcium ionophore A23187, (J) and (N) calcium ionophore A23187 with the COX inhibitor IND, (K) and (O) UVR and (L) and (P) ATP. The 46BR.1N eicosanoid profiles shown are 12-HETE (I)–(L) and PGE2 (M)–(P). Experimental data shown as mean ± SD, n = 3 independent experiments (blue); in silico data shown based on an ensemble of 1000 model variants (grey); calculated “Metabolite Ψ” scores are listed in the upper left corner of each panel.
Furthermore, the lack of a convincing fit between our simulated and experimental data indicates that HaCaT keratinocytes and 46BR.1N fibroblasts may respond differently to the stimuli applied, in ways not accounted for in our model AA cascade. Crosstalk of the eicosanoid cascade with other biochemical reactions that were not modelled here, and additional AA metabolic pathways (e.g., CYP450-mediated reactions, hydrolysis of glycerophospholipid-esterified HETE, production of leukotrienes, etc.) which were omitted from our network might account for some of the differences between simulated and experimental observations. Our model also does not include the transcription and translation processes, which are considered to occur at a much slower timescale than the processes studied here.42,43 Currently, the low prediction accuracy limits the applicability of the model when predicting experimental outcomes for other cell types and stimuli. Further work is needed to expand the network complexity in future iterations of the model, alongside additional experimentation to reduce the parameter uncertainty in critical areas of the model, as identified by the ensemble modelling strategy.
4. Conclusion
This work presents the first model of the AA cascade which employs the Monte Carlo ensemble modelling method. Overall, our approach allows the visualisation of plausible and thermodynamically feasible predictions, overcoming the limitations of fixed-parameter modelling.
The integration of in vitro metabolite concentration estimates facilitated the adaptation of our model into cell- and stimulus-specific versions even when no additional condition-specific parameter data were available. The “generic” model proved to be readily adaptable when representing HaCaT keratinocytes or 46BR.1N fibroblasts in response to stimuli and inhibitors of the AA cascade. Furthermore, validation against experimental results using a novel scoring method allowed us to quantify prediction accuracy. Published models report close quantitative agreements between experimental and simulated data, which are only achieved via inflexible and fixed parameter fitting methods. We avoided the use of such methods to produce a model that can simulate a wider range of scenarios, whilst accounting for the uncertainty surrounding biological events. This not only avoids the issue of overfitting, but also provides additional transparency regarding areas of remaining uncertainty and identifies gaps in the current knowledge that can be targeted in future experiments. Therefore, our approach generated an adaptable, tuneable ensemble model of the AA cascade that can be tailored to represent different cell types.
In addition, the ensemble modelling approach allowed us to quantify the confidence in individual predictions, highlighting aspects of system behaviour that are robust to uncertainties in the enzyme kinetic parameters, but also openly revealing areas of the system for which confident predictions are currently not yet possible. Thus, this model offers a comprehensive survey of the state of our understanding of the AA cascade, which can form the basis of future modelling activities to enhance our mechanistic understanding of this important pathway.
Future application of in silico models like the one presented here, can facilitate the development of new therapeutics by providing statistically rigorous predictions of systems behaviour, support mechanistic insight into the AA cascade which can underpin inflammatory diseases, and contribute to reduction and replacement of preclinical animal models.
Abbreviations
- AA
Arachidonic acid
- C-20
20-Carbon
- COX
Cyclooxygenase
- CYP450
Cytochrome P450
- DGLA
Dihomo-γ-linolenic acid
- DMEM
Dulbecco's modified Eagle medium
- [Enzyme]0
Initial enzyme concentration
- EPA
Eicosapentaenoic acid
- ESI-MS/MS
Triple quadrupole mass spectrometer with electrospray ionisation
- FAME
Fatty acid methyl ester
- FBS
Foetal bovine serum
- FLAP
5-Lipoxygenase activating protein
- GC-FID
Gas chromatography with flame ionisation
- HETE
Hydroxyeicosatetraenoic acid
- IND
Indomethacin
- KS
Kolmogorov–Smirnov
- LOX
Lipoxygenase
- LT
Leukotriene
- MEM
Minimum essential Eagle medium
- ODE
Ordinary differential equation
- PBS
Phosphate buffered saline
- PG
Prostaglandin
- PLA2
Phospholipase A2
- PMNL
Polymorphonuclear leukocyte
- PVDF
Polyvinylidene difluoride
- PUFA
Polyunsaturated fatty acid
- RIPA
Radioimmunoprecipitation assay buffer
- SDS
Sodium dodecyl sulfate
- TX
Thromboxane
- UPLC
Ultraperformance liquid chromatography
- UVR
Ultraviolet irradiation
Data availability
All data supporting this study are provided in full in the ‘Results and Discussion’ section of this paper and in the Supplementary Information files accompanying this paper.
Author contributions
MU performed cell culture, lipidomic assays, analysed data, generated the in silico model and figures. GH edited and amended figures, reproduced and validated in silico data. AT, AH and FDC assisted with the design of the model. MK-T performed protein analysis. ACK supervised lipidomic assays. RB, DM, RKB and JJ designed and co-directed the research. AN raised research funds, designed and co-directed the research. All authors contributed to the drafting, reviewing and final approval of the manuscript.
Conflicts of interest
The project was funded in part through a grant from Unilever to the University of Manchester. DM, RKB and JJ are Unilever employees. The authors have no conflicts to declare.
Supplementary Material
Acknowledgments
The work has been supported by an EPSRC-DTP scholarship to MU (EP/M506436/1), a BBSCR-Unilever-CTP scholarship to GH (BB/V509474/1) and a research grant from Unilever to the University of Manchester. We wish to thank Neil O’Hara (University of Manchester) for excellent technical support, and Waters for their support of the work.
Electronic supplementary information (ESI) available. See DOI: https://doi.org/10.1039/d3mo00187c
References
- Funk C. D. Science. 2001;294:1871–1875. doi: 10.1126/science.294.5548.1871. [DOI] [PubMed] [Google Scholar]
- Kiezel-Tsugunova M. Kendall A. C. Nicolaou A. Biochem. Soc. Trans. 2018;46:119–129. doi: 10.1042/BST20160469. [DOI] [PubMed] [Google Scholar]
- Nicolaou A. Mauro C. Urquhart P. Marelli-Berg F. Front. Immunol. 2014;5:75. doi: 10.3389/fimmu.2014.00075. [DOI] [PMC free article] [PubMed] [Google Scholar]
- Nicolaou A. Prostaglandins, Leukotrienes Essent. Fatty Acids. 2013;88:131–138. doi: 10.1016/j.plefa.2012.03.009. [DOI] [PubMed] [Google Scholar]
- Calder P. C. Essays Biochem. 2020;64:423–441. doi: 10.1042/EBC20190083. [DOI] [PubMed] [Google Scholar]
- Schuster V. L. Prostaglandins Other Lipid Mediat. 2002;68–69:633–647. doi: 10.1016/S0090-6980(02)00061-8. [DOI] [PubMed] [Google Scholar]
- Nakanishi T. Nakamura Y. Umeno J. Pharmacol. Ther. 2021;223:107803. doi: 10.1016/j.pharmthera.2021.107803. [DOI] [PubMed] [Google Scholar]
- Takenaka S. Itoh T. Fujiwara R. Pharmacol. Res. Perspect. 2013;1:e00005. doi: 10.1002/prp2.5. [DOI] [PMC free article] [PubMed] [Google Scholar]
- Powell W. S. Clin. Sci. 2021;135:1945–1980. doi: 10.1042/CS20190657. [DOI] [PubMed] [Google Scholar]
- Zhu L. Zhang Y. Guo Z. Wang M. Arterioscler., Thromb., Vasc. Biol. 2020;40:1454–1463. doi: 10.1161/ATVBAHA.119.313234. [DOI] [PubMed] [Google Scholar]
- Johnson A. M. Kleczko E. K. Nemenoff R. A. Front. Pharmacol. 2020;11:595498. doi: 10.3389/fphar.2020.595498. [DOI] [PMC free article] [PubMed] [Google Scholar]
- Mitchell J. A. Kirkby N. S. Ahmetaj-Shala B. Armstrong P. C. Crescente M. Ferreira P. Lopes Pires M. E. Vaja R. Warner T. D. Pharmacol. Ther. 2021;217:107624. doi: 10.1016/j.pharmthera.2020.107624. [DOI] [PubMed] [Google Scholar]
- Holtzman M. J. Annu. Rev. Physiol. 1992;54:303–329. doi: 10.1146/annurev.ph.54.030192.001511. [DOI] [PubMed] [Google Scholar]
- Bogatcheva N. V. Sergeeva M. G. Dudek S. M. Verin A. D. Microvasc. Res. 2005;69:107–127. doi: 10.1016/j.mvr.2005.01.007. [DOI] [PubMed] [Google Scholar]
- Hoxha M. Adv. Med. Sci. 2018;63:22–29. doi: 10.1016/j.advms.2017.06.004. [DOI] [PubMed] [Google Scholar]
- Wang T. Fu X. Chen Q. Patra J. K. Wang D. Wang Z. Gai Z. Int. J. Mol. Sci. 2019;20:3683. doi: 10.3390/ijms20153683. [DOI] [PMC free article] [PubMed] [Google Scholar]
- Kendall A. C. Nicolaou A. Prog. Lipid Res. 2013;52:141–164. doi: 10.1016/j.plipres.2012.10.003. [DOI] [PubMed] [Google Scholar]
- Mouchlis V. D. Dennis E. A. Biochim. Biophys. Acta, Mol. Cell Biol. Lipids. 2019;1864:766–771. doi: 10.1016/j.bbalip.2018.08.010. [DOI] [PMC free article] [PubMed] [Google Scholar]
- Balsinde J. Winstead M. V. Dennis E. A. FEBS Lett. 2002;531:2–6. doi: 10.1016/S0014-5793(02)03413-0. [DOI] [PubMed] [Google Scholar]
- Hammond V. J. O’Donnell V. B. Biochem. Biophys. Acta. 2012;1818:2403–2412. doi: 10.1016/j.bbamem.2011.12.013. [DOI] [PMC free article] [PubMed] [Google Scholar]
- Yang K. Ma W. Liang H. Ouyang Q. Tang C. Lai L. PLoS Comput. Biol. 2007;3:e55. doi: 10.1371/journal.pcbi.0030055. [DOI] [PMC free article] [PubMed] [Google Scholar]
- Yang K. Bai H. Ouyang Q. Lai L. Tang C. Mol. Syst. Biol. 2008;4:228. doi: 10.1038/msb.2008.60. [DOI] [PMC free article] [PubMed] [Google Scholar]
- Fajmut A. Emersic T. Dobovisek A. Antic N. Schafer D. Brumen M. IET Syst. Biol. 2015;9:204–215. doi: 10.1049/iet-syb.2014.0037. [DOI] [PMC free article] [PubMed] [Google Scholar]
- Kihara Y. Gupta S. Maurya M. R. Armando A. Shah I. Quehenberger O. Glass C. K. Dennis E. A. Subramaniam S. Biophys. J. 2014;106:966–975. doi: 10.1016/j.bpj.2014.01.015. [DOI] [PMC free article] [PubMed] [Google Scholar]
- Yang W. Wang X. Li K. Liu Y. Liu Y. Wang R. Li H. Quant. Biol. 2019;7:30–41. doi: 10.1007/s40484-018-0163-4. [DOI] [Google Scholar]
- Gupta S. Kihara Y. Maurya M. R. Norris P. C. Dennis E. A. Subramaniam S. J. Phys. Chem. B. 2016;120:8346–8353. doi: 10.1021/acs.jpcb.6b02036. [DOI] [PMC free article] [PubMed] [Google Scholar]
- Gupta S. Maurya M. R. Stephens D. L. Dennis E. A. Subramaniam S. Biophys. J. 2009;96:4542–4551. doi: 10.1016/j.bpj.2009.03.011. [DOI] [PMC free article] [PubMed] [Google Scholar]
- Dobovišek A. Fajmut A. Brumen M. J. Pharmacokinet. Pharmacodyn. 2011;38:261–278. doi: 10.1007/s10928-011-9192-6. [DOI] [PubMed] [Google Scholar]
- Famili I. Mahadevan R. Palsson B. O. Biophys. J. 2005;88:1616–1625. doi: 10.1529/biophysj.104.050385. [DOI] [PMC free article] [PubMed] [Google Scholar]
- Tsigkinopoulou A. Baker S. M. Breitling R. Trends Biotechnol. 2017;35:518–529. doi: 10.1016/j.tibtech.2016.12.008. [DOI] [PubMed] [Google Scholar]
- Tsigkinopoulou A. Hawari A. Uttley M. Breitling R. Nat. Protoc. 2018;13:2643–2663. doi: 10.1038/s41596-018-0056-z. [DOI] [PubMed] [Google Scholar]
- Camacho-Muñoz D. Kiezel-Tsugunova M. Kiss O. Uddin M. Sundén M. Ryaboshapkina M. Lind L. Oscarsson J. Nicolaou A. FASEB J. 2021;35:e21976. doi: 10.1096/fj.202100380RRR. [DOI] [PubMed] [Google Scholar]
- Kendall A. C. Pilkington S. M. Murphy S. A. Del Carratore F. Sunarwidhi A. L. Kiezel-Tsugunova M. Urquhart P. Watson R. E. B. Breitling R. Rhodes L. E. Nicolaou A. FASEB J. 2019;33:13014–13027. doi: 10.1096/fj.201901501R. [DOI] [PMC free article] [PubMed] [Google Scholar]
- Green P. Anyakoha N. Yadid G. Gispan-Herman I. Nicolaou A. Prostaglandins, Leukotrienes Essent. Fatty Acids. 2009;80:213–220. doi: 10.1016/j.plefa.2009.02.005. [DOI] [PubMed] [Google Scholar]
- Hoops S. Sahle S. Gauges R. Lee C. Pahle J. Simus N. Singhal M. Xu L. Mendes P. Kummer U. Bioinformatics. 2006;22:3067–3074. doi: 10.1093/bioinformatics/btl485. [DOI] [PubMed] [Google Scholar]
- Uhal B. D. Ramos C. Joshi I. Bifero A. Pardo A. Selman M. Am. J. Physiol. 1998;275:L998–L1005. doi: 10.1152/ajplung.1998.275.5.L998. [DOI] [PubMed] [Google Scholar]
- Achcar F. Kerkhoven E. J. Bakker B. M. Barrett M. P. Breitling R. PLoS Comput. Biol. 2012;8:e1002352. doi: 10.1371/journal.pcbi.1002352. [DOI] [PMC free article] [PubMed] [Google Scholar]
- Achcar F. Fadda A. Haanstra J. R. Kerkhoven E. J. Kim D. H. Leroux A. E. Papamarkou T. Rojas F. Bakker B. M. Barrett M. P. Clayton C. Girolami M. Krauth-Siegel R. L. Matthews K. R. Breitling R. Adv. Microb. Physiol. 2014;64:115–143. doi: 10.1016/B978-0-12-800143-1.00003-8. [DOI] [PMC free article] [PubMed] [Google Scholar]
- Achcar F. Barrett M. P. Breitling R. FEBS J. 2013;280:4640–4651. doi: 10.1111/febs.12436. [DOI] [PMC free article] [PubMed] [Google Scholar]
- Wang M. Weiss M. Simonovic M. Haertinger G. Schrimpf S. P. Hengartner M. O. von Mering C. Mol. Cell. Proteomics. 2012;11:492–500. doi: 10.1074/mcp.O111.014704. [DOI] [PMC free article] [PubMed] [Google Scholar]
- Cornish-Bowden A. and Cárdenas M. L., Proceedings of the 9th International BioThermoKinetics Meeting, Stellenbosch, 2000, pp. 65–71
- Shamir M. Bar-On Y. Phillips R. Milo R. Cell. 2016;164:1302. doi: 10.1016/j.cell.2016.02.058. [DOI] [PubMed] [Google Scholar]
- Carthew R. W. Trends Genet. 2021;37:389–400. doi: 10.1016/j.tig.2020.09.018. [DOI] [PMC free article] [PubMed] [Google Scholar]
- Wang M. Herrmann C. J. Simonovic M. Szklarczyk D. von Mering C. Proteomics. 2015;15:3163–3168. doi: 10.1002/pmic.201400441. [DOI] [PMC free article] [PubMed] [Google Scholar]
- Chang A. Jeske L. Ulbrich S. Hofmann J. Koblitz J. Schomburg I. Neumann-Schaal M. Jahn D. Schomburg D. Nucleic Acids Res. 2021;49:D498–D508. doi: 10.1093/nar/gkaa1025. [DOI] [PMC free article] [PubMed] [Google Scholar]
- Karp P. D. Billington R. Caspi R. Fulcher C. A. Latendresse M. Kothari A. Keseler I. M. Krummenacker M. Midford P. E. Ong Q. Ong W. K. Paley S. M. Subhraveti P. Briefings Bioinf. 2019;20:1085–1093. doi: 10.1093/bib/bbx085. [DOI] [PMC free article] [PubMed] [Google Scholar]
- MacLeod M. Nersessian N. J. Hist. Philos. Life Sci. 2018;40:17. doi: 10.1007/s40656-017-0183-9. [DOI] [PMC free article] [PubMed] [Google Scholar]
- Noreen Y. Ringbom T. Perera P. Danielson H. Bohlin L. J. Nat. Prod. 1998;61:2–7. doi: 10.1021/np970343j. [DOI] [PubMed] [Google Scholar]
- Mukherjee A. Brinkley D. W. Chang K. M. Roth J. P. Biochemistry. 2007;46:3975–3989. doi: 10.1021/bi602502j. [DOI] [PubMed] [Google Scholar]
- Bambai B. Rogge C. E. Stec B. Kulmacz R. J. J. Biol. Chem. 2004;279:4084–4092. doi: 10.1074/jbc.M304762200. [DOI] [PubMed] [Google Scholar]
- Vecchio A. J. Simmons D. M. Malkowski M. G. J. Biol. Chem. 2010;285:22152–22163. doi: 10.1074/jbc.M110.119867. [DOI] [PMC free article] [PubMed] [Google Scholar]
- Kim S. F. Huri D. A. Snyder S. H. Science. 2005;310:1966–1970. doi: 10.1126/science.1119407. [DOI] [PubMed] [Google Scholar]
- Lagarde M. Croset M. Authi K. S. Crawford N. Biochem. J. 1984;222:495–500. doi: 10.1042/bj2220495. [DOI] [PMC free article] [PubMed] [Google Scholar]
- Romano M. Chen X. S. Takahashi Y. Yamamoto S. Funk C. D. Serhan C. N. Biochem. J. 1993;296(Pt 1):127–133. doi: 10.1042/bj2960127. [DOI] [PMC free article] [PubMed] [Google Scholar]
- Chen X. S. Brash A. R. Funk C. D. Eur. J. Biochem. 1993;214:845–852. doi: 10.1111/j.1432-1033.1993.tb17988.x. [DOI] [PubMed] [Google Scholar]
- Hada T. Ueda N. Takahashi Y. Yamamoto S. Biochem. Biophys. Acta. 1991;1083:89–93. doi: 10.1016/0005-2760(91)90128-5. [DOI] [PubMed] [Google Scholar]
- Dinasarapu A. R. Gupta S. Ram Maurya M. Fahy E. Min J. Sud M. Gersten M. J. Glass C. K. Subramaniam S. Bioinformatics. 2013;29:2735–2743. doi: 10.1093/bioinformatics/btt469. [DOI] [PMC free article] [PubMed] [Google Scholar]
- Rhodes L. E. Gledhill K. Masoodi M. Haylett A. K. Brownrigg M. Thody A. J. Tobin D. J. Nicolaou A. FASEB J. 2009;23:3947–3956. doi: 10.1096/fj.09-136077. [DOI] [PMC free article] [PubMed] [Google Scholar]
- Chen X. Gresham A. Morrison A. Pentland A. P. Biochem. Biophys. Acta. 1996;1299:23–33. doi: 10.1016/0005-2760(95)00166-2. [DOI] [PubMed] [Google Scholar]
Associated Data
This section collects any data citations, data availability statements, or supplementary materials included in this article.
Supplementary Materials
Data Availability Statement
All data supporting this study are provided in full in the ‘Results and Discussion’ section of this paper and in the Supplementary Information files accompanying this paper.


