Abstract
Background
The prognosis for patients with kidney renal clear cell carcinoma (KIRC) remains unfavorable, and the understanding of SRY-box transcription factor 11 (SOX11) in KIRC is still limited. The purpose of this paper is to explore the role of SOX11 in the prognosis of KIRC.
Methods
We analyzed SOX11 expression in KIRC and adjacent normal tissues using The Cancer Genome Atlas (TCGA) and Gene Expression Omnibus (GEO) databases. Our study aims to establish a correlation between SOX11 expression and clinical pathological features. Differentially expressed genes (DEGs) were assessed using R software. Furthermore, we conducted Gene Ontology (GO)/Kyoto Encyclopedia of Genes and Genomes (KEGG) analyses and gene set enrichment analysis (GSEA). Integration of data from the Tumor Immune Estimation Resource (TIMER) and TCGA databases allowed us to assess the association between SOX11 expression and immune infiltration in KIRC. Additionally, we analyzed the association between SOX11 gene expression and N6-methyladenosine (m6A) modification in KIRC using TCGA and GEO data.
Results
Our findings revealed high SOX11 expression in KIRC, which showed a significant correlation with tumor staging and prognosis. GO/KEGG and GSEA analyses indicated that SOX11 was closely associated with sodium ion transport, synaptic vesicle circulation, and oxidative phosphorylation. Analysis of the TIMER and TCGA databases demonstrated correlations of SOX11 expression levels with the presence of CD8+ T lymphocytes, neutrophils, CD4+ T cells, as well as B cells. Moreover, both the TCGA and GEO datasets showed a substantial association between SOX11 and m6A modification-related genes, namely ZC3H13, FTO, METTL14, YTHDC1, IGF2BP1, and IGF2BP2.
Conclusions
SOX11 exhibits a correlation with m6A modification and immune infiltration, suggesting its potential as a prognostic biomarker for KIRC.
Keywords: SRY-box transcription factor 11 (SOX11), kidney renal clear cell carcinoma (KIRC), prognostic biomarker, immune infiltration, N6-methyladenosine modification (m6A modification)
Highlight box.
Key findings
• Our findings reveal SRY-box transcription factor 11 (SOX11) exhibits a correlation with N6-methyladenosine (m6A) modification and immune infiltration, suggesting its potential as a prognostic biomarker for kidney renal clear cell carcinoma (KIRC).
What is known and what is new?
• SOX11 is lowly expressed in many tissues but becomes overexpressed in certain cancer types, suggesting its potential involvement in cancer development and progression. Studies show SOX11 is associated with variety types of cancers, such as cervical cancer, where the hypermethylation of the SOX11 promoter promotes cancer progression, and breast cancer where its expression correlates with aggressive tumor characteristics.
• Our research showed high SOX11 expression in KIRC, which showed a significant correlation with tumor staging and prognosis. Gene Ontology/Kyoto Encyclopedia of Genes and Genomes and gene set enrichment analysis analyses indicate that SOX11 is closely associated with sodium ion transport, synaptic vesicle circulation, and oxidative phosphorylation. Analysis of the Tumor Immune Estimation Resource and The Cancer Genome Atlas (TCGA) databases demonstrates correlations of SOX11 expression levels with the presence of CD8 T lymphocytes, neutrophils, CD4 T cells, and B cells. Moreover, both the TCGA and Gene Expression Omnibus datasets show a substantial association between SOX11 and m6A modification-related genes.
What is the implication, and what should change now?
• The paper explored the role of SOX11 in KIRC diagnosis and prognosis, which could pave the way for new therapeutic targets in the treatment of KIRC.
Introduction
Kidney cancer is recognized as one of the top 10 most prevalent malignancies in the United States (1). Its incidence rate is steadily increasing worldwide, posing a significant public health concern (2). Annually, kidney cancer affects nearly 300,000 individuals globally and causes over 100,000 deaths. The 5-year survival rate for individuals with localized or locally advanced disease ranges from 20% to 95%, while those with metastatic disease have a 5-year survival rate of 0% to 10% (3). Kidney renal clear cell carcinoma (KIRC) constitutes 70–80% of all kidney cancer cases, making it the most common subtype (4,5). Over the past decade, treatment options for KIRC have significantly improved, offering surgical, radiation, immunotherapy, and targeted therapy approaches (6). However, outcomes for individuals with advanced/late-stage KIRC remain poor, with approximately an 8% 5-year survival rate for stage IV KIRC according to the American Cancer Society (7). Therefore, identifying possible prognostic biomarkers in KIRC is crucial for early diagnosis and exploration of novel treatment targets.
SRY-box transcription factor 11 (SOX11) is a crucial transcription factor for embryonic development and has been associated with various types of cancer (8). It belongs to the SOX family of transcription factors, which regulate gene expression in cell differentiation and development (9). SOX11 plays a vital role in embryonic central nervous system and limb development (10), as well as the development of the heart, kidney, and pancreas (11-14). In adults, SOX11 is lowly expressed in many tissues but becomes overexpressed in certain cancer types, suggesting its potential involvement in cancer development and progression (8,9). Studies have linked SOX11 to the pathogenesis of various hematological malignancies, including mantle cell lymphoma and Burkitt lymphoma (15,16). In mantle cell lymphoma patients, SOX11 acts as a key regulator in the development of B cells. Besides, its overexpression is associated with poorer prognosis (15). Additionally, SOX11 has been associated with other types of cancer (17), such as cervical cancer, where the hypermethylation of the SOX11 promoter (18) promotes cancer progression, and in breast cancer in which its expression correlates with aggressive tumor characteristics (19). Therefore, investigating the role of SOX11 in KIRC and exploring its potential clinical applications are essential.
Using R software and online databases, we performed bioinformatics analysis to uncover distinct expression patterns of SOX11 across diverse tumor types. To validate messenger RNA (mRNA) expression differences between normal renal tubular cells and renal cancer cells, we conducted real-time quantitative polymerase chain reaction (RT-qPCR). Immunohistochemical (IHC) staining confirmed differential protein expression of SOX11 in KIRC tumors and adjacent tissues. Additionally, we comprehensively analyzed the biological functions and signaling pathways associated with SOX11-related genes. Lastly, we investigated the relationship of SOX11 expression levels with infiltrating level of immune cells as well as N6-methyladenosine (m6A) modification. We present this article in accordance with the MDAR reporting checklist (available at https://tcr.amegroups.com/article/view/10.21037/tcr-24-109/rc).
Methods
Expression of SOX11 in KIRC
We analyzed the differential expression of SOX11 in various tumors (n=18,102) using RNA-sequencing (RNA-seq) data in transcripts per million (TPM) format from the UCSC XENA database (https://xenabrowser.net/datapages/) (20). We compared SOX11 expression levels in normal tissues and KIRC tumor tissues (n=613) using The Cancer Genome Atlas (TCGA)-KIRC database (https://portal.gdc.cancer.gov/). We acquired three datasets (GSE53757, GSE66271, and GSE66272) from the Gene Expression Omnibus (GEO) database to compare SOX11 expression among KIRC and normal samples. IHC staining validated the disparities in the expression of SOX11 protein among KIRC tumor and adjacent tissues. The assessment of diagnostic and prognostic values of SOX11 was performed for KIRC patients using receiver operating characteristic (ROC) and Kaplan-Meier (KM) curves (patient’s follow-up duration extends for a period of 4,000 days). In addition, the association of SOX11 expression levels and clinicopathological characteristics of KIRC patients was analyzed on the basis of the TCGA-KIRC dataset.
KIRC tissue samples
The study was conducted in accordance with the Declaration of Helsinki (as revised in 2013). This study was approved by the Medical Ethics Committee of the First Affiliated Hospital of Nanchang University (ethical approval No. 2022-01-015). We recruited KIRC patients who received surgical treatment during hospitalization and obtained informed consent from study participants prior to the start of the study. Patient information is in Table S1.
IHC staining
Paraffin sections were deparaffinized, rehydrated, and subjected to antigen retrieval through autoclaving at 121 ℃ for 10 minutes. Sections were then incubated with serum-free protein block (Dako, Santa Clara, CA, USA), followed by pretreatment with 100% methanol containing 3% hydrogen peroxide. Next, the sections were further incubated with the SOX11 antibody (catalog number NBP1-85823; Novus Biologicals, Inc., Centennial, CO, USA; RRID:AB_11003542). Primary-stained sections underwent incubation with secondary antibodies appropriately conjugated with peroxidase (GB23303; Servicebio, Wuhan, China) and diaminobenzidine substrate. The 3,3'-diaminobenzidine (DAB) reagent was used for staining each section, followed by counterstaining with hematoxylin.
Cell culture
The HK2 human renal tubular epithelial cell line (CRL-2190, RRID:CVCL_0302), ACHN human renal carcinoma cell line (CRL-1611, RRID:CVCL_1067), along with A498 human renal carcinoma cell line (HTB-44, RRID:CVCL_1056) were obtained from the American Type Culture Collection (ATCC; Manassas, VA, USA). HK2 cells were cultivated in Dulbecco’s modified Eagle medium (DMEM)/F12 medium supplemented with 10% fetal bovine serum (FBS). The cell culture was maintained at 37 ℃ in an environment comprising 5% CO2 and humidified air. ACHN and A498 cells were then cultured in DMEM-H media supplemented with FBS (10%) under the same conditions. The culture medium was renewed every 48 hours, and no antibiotics were added.
RT-qPCR
The isolation of total RNA from HK2, ACHN, and A498 cells was conducted utilizing a kit from Takara Bio, Inc. (Kusatsu, Japan). Complementary DNA (cDNA) synthesis was performed using the Bestar™ qPCR RT Kit (Takara Bio, Inc.). RT-qPCR was conducted on the Applied Biosystems 7500 RT PCR System with TB Green Premix Ex Taq II (cat. no. RR820A; Takara Bio, Inc.) as the detection reagent. The reaction involved an initial pre-denaturation at 95 ℃ for 30 seconds, followed by 40 cycles of denaturation at 95 ℃ for 5 seconds and annealing/extension at 60 ℃ for 30 seconds. The primer sequences for glyceraldehyde-3-phosphate dehydrogenase (GAPDH) and SOX11 are in Table 1. Besides, the 2−ΔΔCq method was utilized to determine the relative expression of the target genes (21).
Table 1. Primer sequences of SOX11 and GAPDH.
| Gene | Species | Forward | Reverse |
|---|---|---|---|
| GAPDH | Human | 5-ACAACTTTGGTATCGTGGAAGG-3 | 5-GCCATCACGCCACAGTTTC-3 |
| SOX11 | Human | 5-GCTGAAGGACAGCGAGAAGATC-3 | 5-GGGTCCATTTTGGGCTTTTTCCG-3 |
SOX11, SRY-box transcription factor 11; GAPDH, glyceraldehyde-3-phosphate dehydrogenase.
Western blotting
HK2, ACHN, and A498 cells were lysed using NP-40 lysis buffer (Beyotime Institute of Biotechnology, Vienna, Austria). Following centrifugation at 15,000 ×g at 4 ℃ for 15 minutes, the supernatants were collected. Protein concentration was quantified using a bicinchoninic acid (BCA) assay and analyzed using a Multiskan full-wavelength microplate reader (Thermo Fisher Scientific, Inc., Waltham, MA, USA). Subsequently, proteins were separated on 10% gels for sodium dodecyl sulfate-polyacrylamide gel electrophoresis (SDS-PAGE) with each lane containing 40 µg of protein. Proteins were then subjected to a polyvinylidene fluoride (PVDF) membrane. To prevent nonspecific binding, the membrane was treated with a 5% non-fat dry milk solution for a duration of 1 hour at room temperature. The membranes were then subjected to an overnight incubation at 4 ℃ with primary antibodies, followed by a subsequent incubation with secondary antibodies for a duration of 1 hour at room temperature. After triplicate washing in tris-buffered saline (TBS)-Tween (0.1%) solution, the membranes were visualized using the Gel DOC XR Gel Imaging System and analyzed using Image Lab v5.2 software (Bio-Rad Laboratories, Inc., Hercules, CA, USA). The primary antibodies included SOX11 (catalog number NBP1-85823; Novus Biologicals, Inc.; RRID:AB_11003542) and GAPDH, both at a dilution of 1:2,000. Horseradish peroxidase (HRP)-linked anti-rabbit immunoglobulin G (IgG; catalog number 7074; Cell Signaling Technology, Inc., Beverly, MA, USA) was used as the secondary antibody at a dilution of 1:1,000. Visualization of protein bands were conducted utilizing the Gel DOC XR Gel Imaging System, and subsequently the bands were analyzed utilizing Image Lab v5.2 software (Bio-Rad Laboratories, Inc.).
Differentially expressed genes (DEGs) of high and low SOX11 expression groups in KIRC
To study the DEGs between groups in KIRC (0–50% and 51–100% for low and high SOX11 expression groups, respectively), we used the deseq2 package. Subsequently, a volcano plot was generated using the ggplot2 package. The threshold value was set at |log2fold change (FC)| >1.0, with an adjusted P value of <0.05. DEGs underwent Gene Ontology (GO)/Kyoto Encyclopedia of Genes and Genomes (KEGG) pathway enrichment analysis using the clusterProfiler package in R software (version 3.6.3). Data visualization were achieved using the ggplot2 package (22).
Gene set enrichment analysis (GSEA)
Using the median expression level of SOX11, the TCGA-KIRC dataset was divided into two different groups. Differential analysis at the single-gene level was performed using the DESeq2 package (version 1.26.0) (23). GSEA (24) was conducted on the entire set of DEGs using the clusterProfiler package (version 3.14.3) (22) to verify the enrichment of genes during biologically significant processes. Besides, the curated gene set c2.cp.v7.2.symbols.gmt served as the reference, and enriched pathways were visualized using the ggplot2 package (version 3.3.3) with a statistical significance cutoff of false discovery rate (FDR) (q value) <0.025 and P<0.05.
Tissue immune infiltrating cells and SOX11
The association between SOX11 expression and the infiltrating levels of immune cells in TCGA-KIRC samples was analyzed using the Tumor Immune Estimation Resource (TIMER) database (http://cistrome.org/TIMER/) (25). Immune-infiltrating cells, including tumor purity, B cells, CD4+ T cells, macrophages, neutrophils, CD8+ T cells, as well as dendritic cells (DCs), were evaluated for their correlation with SOX11 expression. The association of SOX11 copy number variation (CNV) with infiltrating levels of immune cells was also analyzed using the somatic copy-number alterations (SCNAs) module in the TIMER database. Additionally, the expressions of 24 immune cells were compared between the high and low SOX11 expression groups in KIRC samples using the single-sample GSEA algorithm (26). The immune cells included T cells, activated DCs (aDCs), B cells, CD8+ T cells, cytotoxic cells, DCs, eosinophils, immature DCs (iDCs), plasmacytoid DCs (pDCs), helper T (Th) cells, T central memory (Tcm), T effector memory (Tem), T follicular helper (TFH) cells, Tγδ (Tgd), Th1 cells, Th17 cells, Th2 cells, and regulatory T cell (Treg) (27). The relationship between SOX11 and genes that serve as markers for immune cells in KIRC samples obtained from the TCGA database was also analyzed.
SOX11 expression and m6A modification in KIRC
The relationship of SOX11 expression with m6A-related gene expression was investigated using GSE53757 and TCGA-KIRC datasets. The expression levels of 17 m6A-related genes were examined, and their significance in the prediction of prognosis in KIRC samples was assessed (28). Results were visualized using R packages survminer and ggplot2 (29).
Statistical analysis
Bioinformatics tools were primarily used for the research presented in this article. Continuous data were presented with mean ± standard deviation (SD)/median with interquartile range (IQR). Group comparisons were conducted utilizing t-tests/Wilcoxon tests. Meanwhile, categorical data were described with counts as well as percentages, and group comparisons were carried out utilizing chi-squared tests/Fisher’s exact tests. In vitro experiments were repeated for at least three times. All collected data were analyzed using SPSS and expressed as mean ± standard error of measurement (SEM). Various tests, including unpaired t-tests, Wilcoxon signed-rank tests, analysis of variance (ANOVA), least significant difference (LSD) post-hoc multiple comparisons test, and Dunnett’s post-hoc multiple comparisons test, were performed. A P value <0.05 indicated statistical significance.
Results
SOX11 expression in KIRC patients and its impact on diagnosis and prognosis
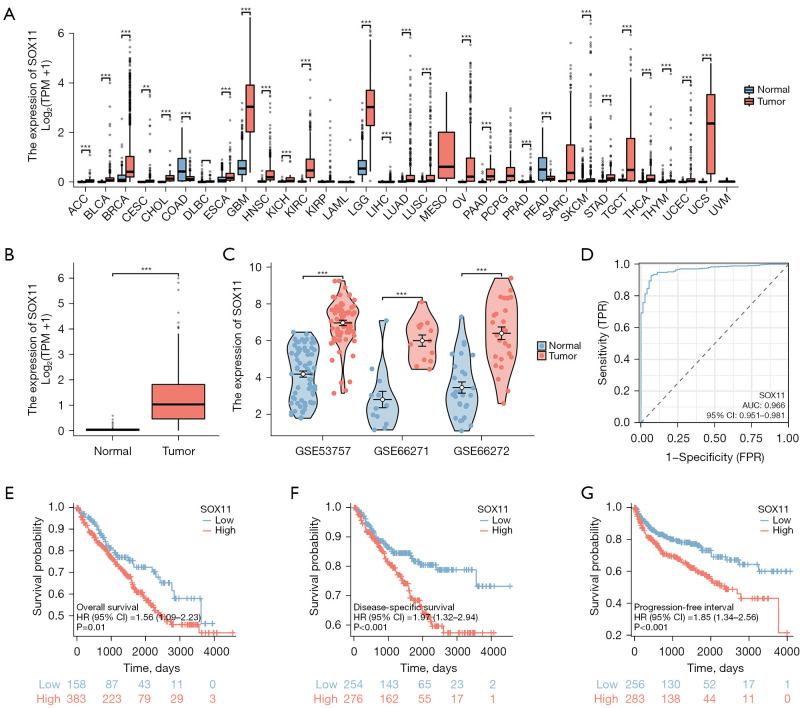
To explore the mRNA expression levels of SOX11 across different tumors, we adopted the data from the XENA platform and the TCGA Genotype-Tissue Expression (GTEx) project. The differential expression patterns of SOX11 were observed between tumor types and normal tissues (Figure 1A). Significant upregulation of SOX11 was observed in various cancer tissues, including adrenocortical carcinoma (ACC), bladder urothelial carcinoma (BLCA), breast invasive carcinoma (BRCA), cervical squamous cell carcinoma and adenocarcinoma (CESC), cholangiocarcinoma (CHOL), diffuse large B-cell lymphoma (DLBC), esophageal carcinoma (ESCA), glioblastoma multiforme (GBM), head and neck squamous cell carcinoma (HNSC), kidney chromophobe (KICH), KIRC, brain lower grade glioma (LGG), liver hepatocellular carcinoma (LIHC), lung adenocarcinoma (LUAD), lung squamous cell carcinoma (LUSC), ovarian serous cystadenocarcinoma (OV), pancreatic adenocarcinoma (PAAD), prostate adenocarcinoma (PRAD), skin cutaneous melanoma (SKCM), stomach adenocarcinoma (STAD), testicular germ cell tumor (TGCT), thyroid carcinoma (THCA), thymoma (THYM), uterine corpus endometrial carcinoma (UCEC), as well as uterine carcinosarcoma (UCS). However, the expression level of SOX11 was decreased in colon adenocarcinoma (COAD) as well as rectum adenocarcinoma (READ) with statistical significance.
Figure 1.
The expression of SOX11 in KIRC and pan-carcinoma. (A) XENA-TCGA GTEx dataset analysis (Wilcoxon rank sum test) to assess SOX11 expression levels across different tumors. The full name of the TCGA abbreviations sees the website: https://gdc.cancer.gov/resources-tcga-users/tcga-code-tables/tcga-study-abbreviations. (B) Boxplots of SOX11 expression between KIRC and normal tissue in the TCGA dataset (Wilcoxon rank sum test). (C) Differences in SOX11 expression between KIRC and normal tissues in GSE53757, GSE66271, and GSE66272 datasets (Wilcoxon rank sum test). (D) ROC curve analysis of SOX11 diagnosis. (E) The OS curve of SOX11 [HR (95% CI): 1.56 (1.09–2.23), P=0.01]. (F) The DSS curve of SOX11 [HR (95% CI): 1.97 (1.32–2.94), P<0.001]. (G) The PFI curve of SOX11 [HR (95% CI): 1.85 (1.34–2.56), P<0.001]. **, P<0.01; ***, P<0.001. SOX11, SRY-box transcription factor 11; TPM, transcripts per million; TPR, true positive rate; FPR, false positive rate; AUC, area under the curve; CI, confidence interval; HR, hazard ratio; KIRC, kidney renal clear cell carcinoma; TCGA, The Cancer Genome Atlas; GTEx, Genotype-Tissue Expression; ROC, receiver operating characteristic; OS, overall survival; DSS, disease-specific survival; PFI, progression-free interval.
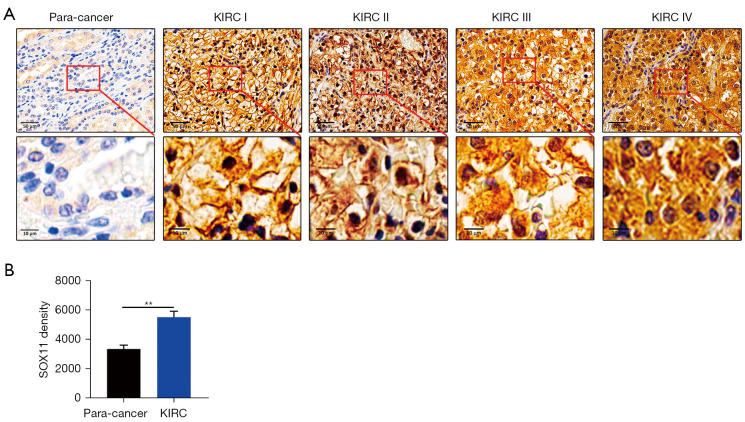
As depicted in Figure 1B, SOX11 mRNA levels in the TCGA dataset exhibited a significant increase in KIRC samples compared to normal control samples. Additionally, GSE53757, GSE66271, and GSE66272 datasets also proved the increased expression of SOX11 in KIRC samples (Figure 1C). ROC analysis demonstrated that SOX11 could be a reliable predictor for KIRC, with an area under the curve (AUC) of 0.966 [95% confidence interval (CI): 0.951–0.981] (Figure 1D). Furthermore, high SOX11 expression in KIRC was found to be associated with poor overall survival (OS) [hazard ratio (HR) (95% CI): 1.56 (1.09–2.23), P=0.01], disease-specific survival (DSS) [HR (95% CI): 1.97 (1.32–2.94), P<0.001], as well as progression-free interval (PFI) [HR (95% CI): 1.85 (1.34–2.56), P<0.001] (Figure 1E-1G). IHC analysis confirmed higher SOX11 protein levels in KIRC tumor tissues than in adjacent normal tissues (Figure 2). RT-qPCR and western blotting analysis further validated elevated SOX11 mRNA/protein levels within human renal carcinoma cell lines (ACHN/A498) compared to the HK2 human renal tubular epithelial cell line (Figure S1). In conclusion, upregulation of SOX11 mRNA/protein levels among KIRC tissues may be potential biomarkers for prognosis prediction.
Figure 2.
The expression of SOX11 in KIRC tissues. (A) Representative images showing IHC staining results of SOX11 in KIRC tissues (KIRC I: pathologic stage I; KIRC II: pathologic stage II; KIRC III: pathologic stage III; KIRC IV: pathologic stage IV) and ANTs (scale bar, 50 µm). (B) Semiquantitative analysis of IHC staining (n=6). The difference between groups was evaluated by one-way ANOVA followed by the LSD post-hoc multiple comparisons test (n≥3). Data are presented as the mean ± SEM. **, P<0.01. KIRC, kidney renal clear cell carcinoma; SOX11, SRY-box transcription factor 11; ANT, adjacent normal tissue; IHC, immunohistochemical; ANOVA, analysis of variance; LSD, least significant difference; SEM, standard error of the mean.
SOX11 expression as well as clinicopathological parameters among KIRC patients
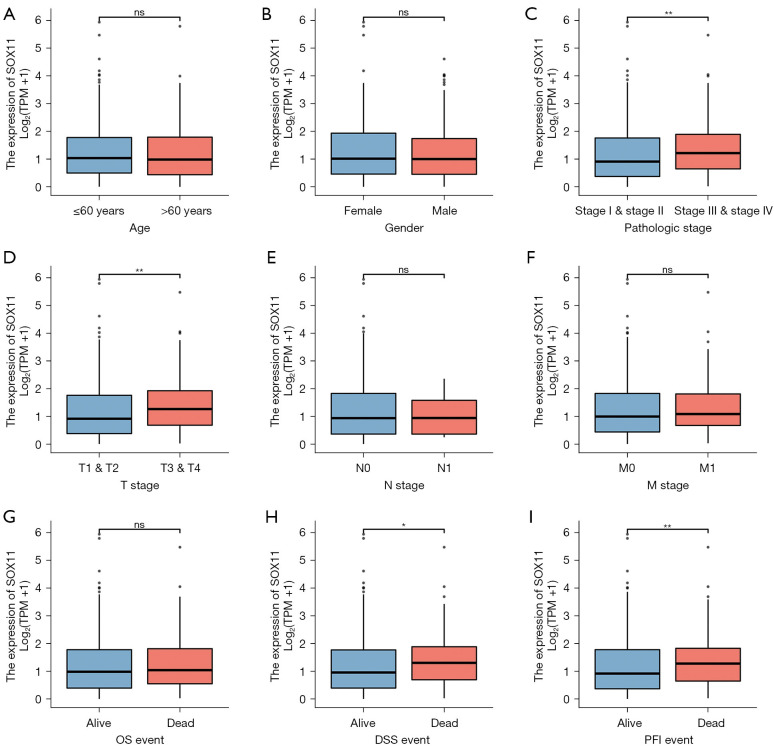
Analyzing the levels of SOX11 expression and its association with clinicopathological characteristics in KIRC is crucial for understanding the underlying significance of SOX11 in its development. Therefore, we analyzed clinical samples from TCGA-KIRC (n=613) to determine the significance of SOX11. Our findings revealed a higher expression of SOX11 in stages III & IV than that in stages I & II. Additionally, SOX11 expression in the T3 & T4 group was obviously higher in contrast with the T1 & T2 group. Regarding DSS along with PFI, the expression levels of SOX11 were higher among deceased patients than those among surviving patients with statistical significance (Figure 3). Table 2 provided a comprehensive overview of the clinical characteristics of SOX11 in KIRC.
Figure 3.
Relationship between SOX11 expression and clinicopathological parameters in patients with KIRC. (A) Age (Wilcoxon rank sum test). (B) Gender (Wilcoxon rank sum test). (C) Pathologic stage (one-way ANOVA test). (D) T stage (Kruskal-Wallis test). (E) N stage (Kruskal-Wallis test). (F) M stage (Wilcoxon rank sum test). (G) OS event (Wilcoxon rank sum test). (H) DSS event (Wilcoxon rank sum test). (I) PFI event (Wilcoxon rank sum test). *, P<0.05; **, P<0.01; ns, not significant. SOX11, SRY-box transcription factor 11; TPM, transcripts per million; OS, overall survival; DSS, disease-specific survival; PFI, progression-free interval; KIRC, kidney renal clear cell carcinoma; ANOVA, analysis of variance.
Table 2. Clinical characteristics of SOX11 in KIRC (n=541)†.
| Characteristics | Low expression of SOX11 | High expression of SOX11 | P value |
|---|---|---|---|
| Number | 270 | 271 | |
| Pathologic T stage, n (%) | 0.01 | ||
| T1 & T2 | 189 (34.9) | 161 (29.8) | |
| T3 & T4 | 81 (15.0) | 110 (20.3) | |
| Pathologic N stage (n=258), n (%) | 0.89 | ||
| N0 | 125 (48.4) | 117 (45.3) | |
| N1 | 8 (3.1) | 8 (3.1) | |
| Pathologic M stage (n=508), n (%) | 0.32 | ||
| M0 | 216 (42.5) | 213 (41.9) | |
| M1 | 35 (6.9) | 44 (8.7) | |
| Pathologic stage (n=538), n (%) | 0.03 | ||
| Stage I & stage II | 179 (33.3) | 153 (28.4) | |
| Stage III & stage IV | 91 (16.9) | 115 (21.4) | |
| Age, n (%) | 0.69 | ||
| ≤60 years | 132 (24.4) | 137 (25.3) | |
| >60 years | 138 (25.5) | 134 (24.8) | |
| OS, n (%) | 0.42 | ||
| Alive | 187 (34.6) | 179 (33.1) | |
| Dead | 83 (15.3) | 92 (17.0) | |
| DSS (n=530), n (%) | 0.006 | ||
| No | 221 (41.7) | 200 (37.7) | |
| Yes | 41 (7.7) | 68 (12.8) | |
| PFI, n (%) | 0.003 | ||
| No | 205 (37.9) | 174 (32.2) | |
| Yes | 65 (12.0) | 97 (17.9) |
†, some items were removed for patients without clinical information. SOX11, SRY-box transcription factor 11; KIRC, kidney renal clear cell carcinoma; OS, overall survival; DSS, disease-specific survival; PFI, progression-free interval.
DEGs in high and low SOX11 expression groups in KIRC
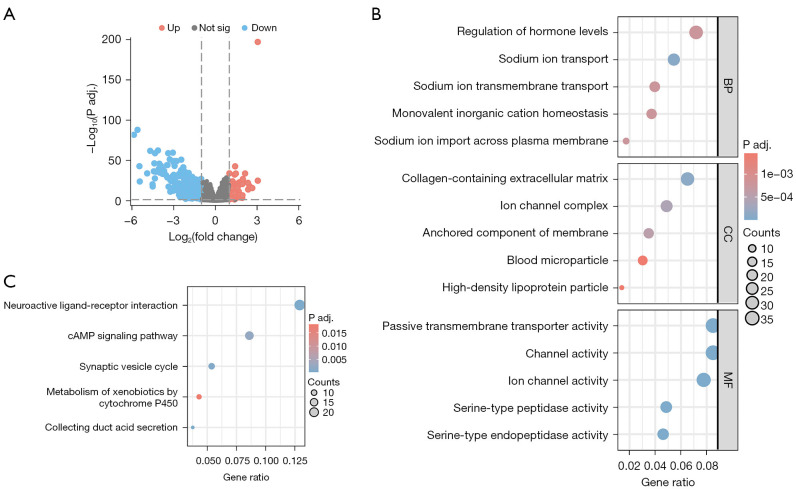
To gain insight into the biological function of SOX11 in KIRC, an analysis of DEGs associated with SOX11 was performed using statistical packages in R software. A total of 450 DEGs met our threshold criteria, among which 123 DEGs were up-regulated and 327 DEGs were down-regulated (Figure 4A). GO/KEGG enrichment analyses were then conducted on these DEGs (Figure 4B,4C). Our results revealed that the DEGs were mainly related to sodium ion transport, sodium ion import across the plasma membrane, regulation of hormone levels, sodium ion transmembrane transport, monovalent inorganic cation homeostasis, collagen-containing extracellular matrix (ECM), ion channel complex, anchored component of the membrane, high-density lipoprotein particle, blood microparticle, channel-mediated transport function, passive transportation via transmembrane transporter, ion-conducting channel function, serine-type peptidase activity, serine endopeptidase activity, acid secretion in the collecting duct, interaction between neuroactive ligands and receptors, cycle of synaptic vesicle dynamics, signaling pathway mediated by cyclic adenosine monophosphate (cAMP), as well as metabolism of xenobiotics by cytochrome P450.
Figure 4.
PPI network building and GO and KEGG analyses of DEGs between SOX11 high expression and low expression groups in KIRC. (A) The volcano map of DEGs (red: upregulation; blue: downregulation). (B,C) GO and KEGG analyses of DEGs. Sig, significant; BP, biological process; CC, cellular component; MF, molecular function; cAMP, cyclic adenosine monophosphate; PPI, protein-protein interaction; GO, Gene Ontology; KEGG, Kyoto Encyclopedia of Genes and Genomes; DEGs, differentially expressed genes; SOX11, SRY-box transcription factor 11; KIRC, kidney renal clear cell carcinoma.
GSEA
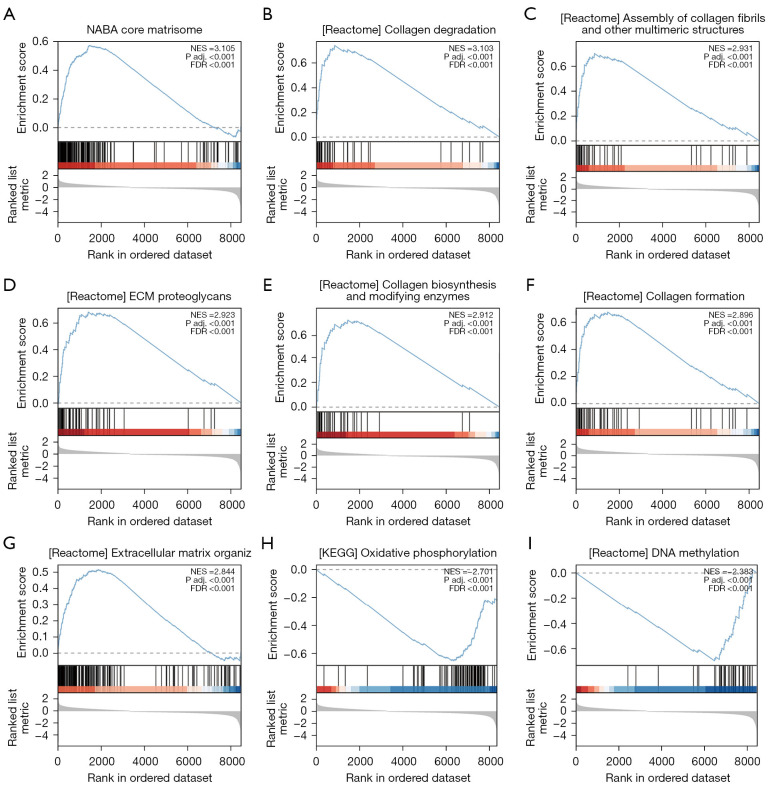
To investigate the potential influence of SOX11 on KIRC, GSEA was conducted on the DEGs associated with SOX11. We identified a total of 392 gene sets, including the NABA core matrisome, collagen degradation, assembly of collagen fibrils and other multimeric structures, ECM proteoglycans, collagen biosynthesis and modifying enzymes, collagen formation, ECM organization, oxidative phosphorylation, and DNA methylation (FDR <0.001 and P<0.001 for all) (Figure 5). Additional information can be found in Table 3.
Figure 5.
GSEA. (A) NABA core matrisome. (B) Collagen degradation. (C) Assembly of collagen fibrils and other multimeric structures. (D) ECM proteoglycans. (E) Collagen biosynthesis and modifying enzymes. (F) Collagen formation. (G) ECM organization. (H) Oxidative phosphorylation. (I) DNA methylation. NES, normalized enrichment score; FDR, false discovery rate; KEGG, Kyoto Encyclopedia of Genes and Genomes; GSEA, gene set enrichment analysis; ECM, extracellular matrix.
Table 3. Gene sets enriched in correlated with SOX11 mRNA expression phenotype.
| ID | Enrichment score | Normalized enrichment score | P value |
|---|---|---|---|
| NABA_CORE_MATRISOME | 0.571 | 3.105 | <0.001 |
| REACTOME_COLLAGEN_DEGRADATION | 0.740 | 3.102 | <0.001 |
| REACTOME_ASSEMBLY_OF_COLLAGEN_FIBRILS_AND_OTHER_MULTIMERIC_STRUCTURES | 0.699 | 2.931 | <0.001 |
| REACTOME_ECM_PROTEOGLYCANS | 0.681 | 2.923 | <0.001 |
| REACTOME_COLLAGEN_BIOSYNTHESIS_AND_MODIFYING_ENZYMES | 0.729 | 2.911 | <0.001 |
| REACTOME_COLLAGEN_FORMATION | 0.674 | 2.896 | <0.001 |
| REACTOME_EXTRACELLULAR_MATRIX_ORGANIZATION | 0.5163 | 2.844 | <0.001 |
| KEGG_OXIDATIVE_PHOSPHORYLATION | −0.654 | −2.700 | <0.001 |
| REACTOME_DNA_METHYLATION | −0.698 | 2.382 | <0.001 |
SOX11, SRY-box transcription factor 11; mRNA, messenger RNA.
Tissue immune infiltrating cells and SOX11
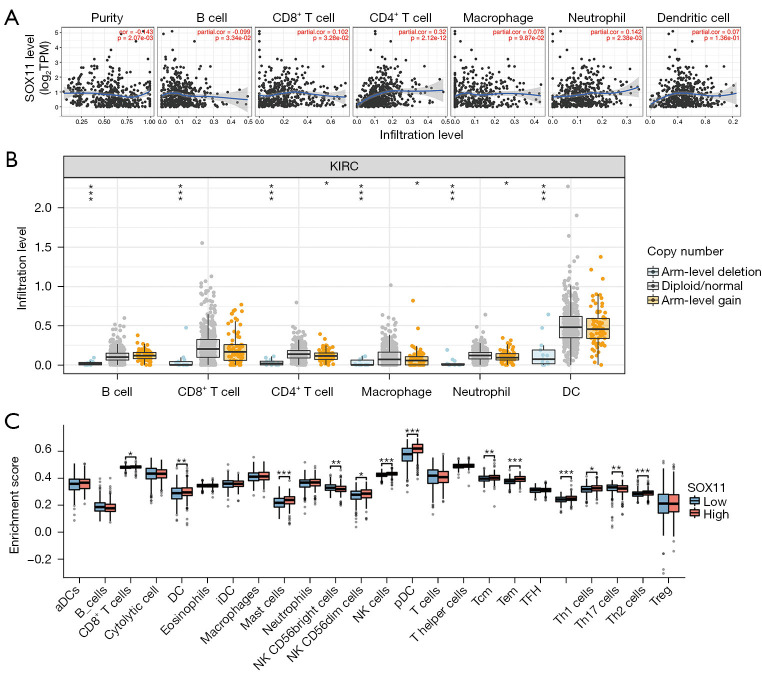
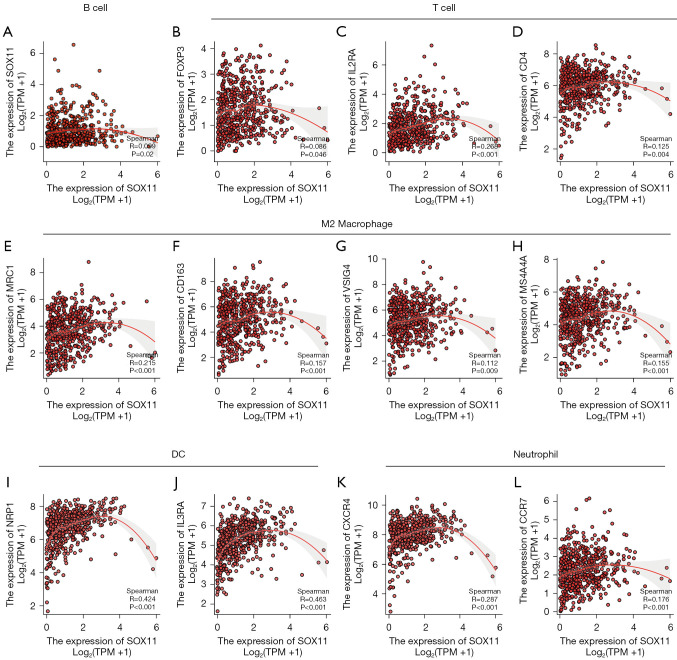
The results suggested that SOX11 possibly exerts a crucial effect on the regulation of immune cell infiltration in KIRC. Specifically, it was positively correlated with CD8+ T lymphocytes (r=0.102, P=3.28E−02), CD4+ T cells (r=0.32, P=2.12E−12), as well as neutrophils (r=0.142, P=2.38E−03). In contrast, there was a negative correlation with B cells (r=−0.099, P=3.34E−02) (Figure 6A). Furthermore, the differential effects of SOX11 with varying copy numbers further emphasized its role in modulating immune infiltration in KIRC (Figure 6B). SOX11 expression levels were associated with immune infiltrating cells in tumors, including CD8+ T cells (P=0.03), DCs (P=0.008), mast cells (P<0.001), natural killer (NK) CD56bright cells (P=0.001), NK CD56dim cells (P=0.03), NK cells (P<0.001), pDCs (P<0.001), Tcm (P=0.008), Tem (P<0.001), Tgd (P<0.001), Th1 (P=0.01), Th17 (P=0.005), and Th2 (P<0.001) (Figure 6C). Further investigations using multiple databases including GEPIA, TIMER, and TCGA demonstrated that SOX11 expression was in a positive relationship with several immune infiltration markers in KIRC with statistical significance. Specifically, SOX11 expression was observed to exhibit a positive association with B-cell biomarkers (CD20: MS4A1) as well as T-cell biomarkers (FOXP3, IL2RA, and CD4). Additionally, it displayed a similar positive association with the biomarkers of M2 macrophage (MRC1, CD163, VSIG4, together with MS4A4A), neutrophil biomarkers (CXCR4 together with CCR7), as well as DC biomarkers (NRP1 and IL3RA) (Figure 7). These findings provided support for the hypothesis that SOX11 plays a role in promoting immune cell infiltration in tumors.
Figure 6.
Correlation between SOX11 and tumor immune infiltrating cells. (A) Correlation between SOX11 expression and immune infiltrating cells in KIRC (Spearman correlation analysis). (B) SOX11 CNV affects the infiltrating levels of B cell, CD8+ T cell, CD4+ T cell, macrophage, neutrophil, and DC in KIRC. (C) Changes in 24 immune cell subtypes between high and low SOX11 expression groups in KIRC tumor samples (Wilcoxon rank sum test). *, P<0.05; **, P<0.01; ***, P<0.001. SOX11, SRY-box transcription factor 11; TPM, transcripts per million; aDC, activated DC; DC, dendritic cell; iDC, immature DC; NK, natural killer; pDC, plasmacytoid DC; Tcm, T central memory; Tem, T effector memory; TFH, T follicular helper; Tgd, Tγδ; Th, helper T; Treg, regulatory T cell; KIRC, kidney renal clear cell carcinoma; CNV, copy number variation.
Figure 7.
Correlation analysis of SOX11 expression with marker genes of infiltrating immune cells in KIRC. (A) B cell; (B-D) T cell; (E-H) M2 macrophage; (I,J) DC; and (K,L) neutrophil. SOX11, SRY-box transcription factor 11; TPM, transcripts per million; KIRC, kidney renal clear cell carcinoma; DC, dendritic cell.
SOX11 expression and m6A modification in KIRC
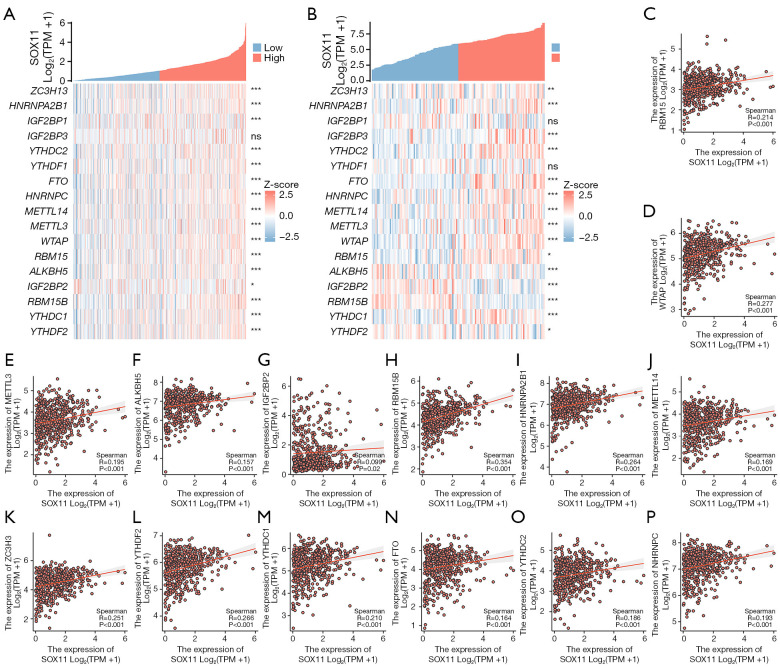
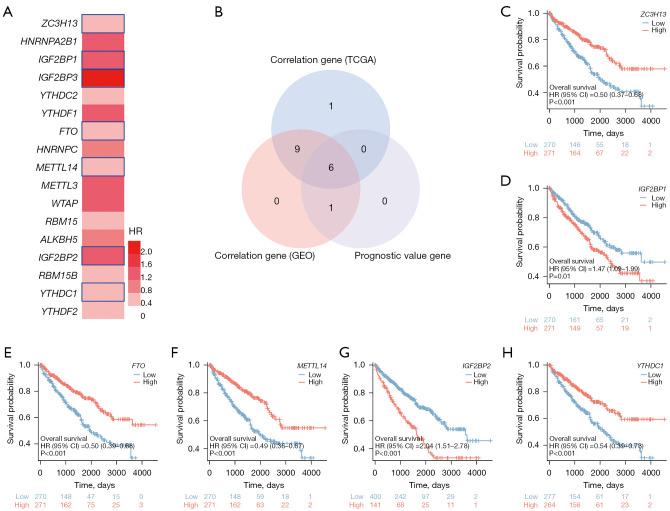
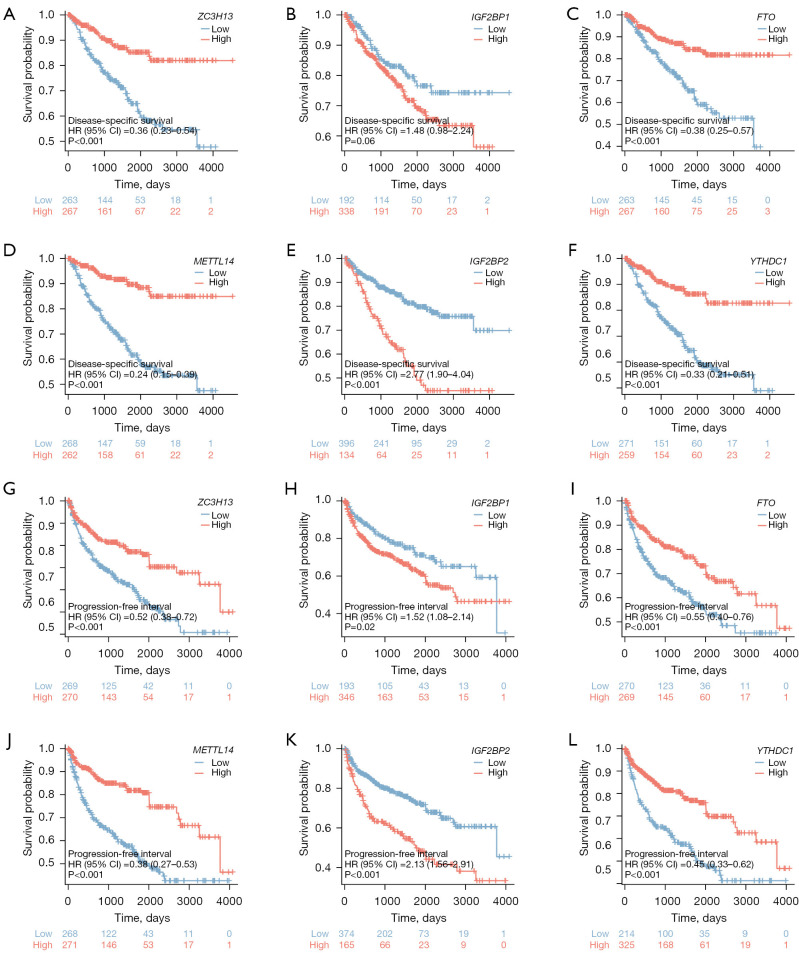
We conducted a comparative analysis of the TCGA-KIRC and GSE53757 datasets to explore the link of SOX11 expression with 17 genes related with m6A in KIRC. The TCGA-KIRC data revealed a positive correlation between SOX11 expression and ZC3H13, HNRNPA2B1, IGF2BP1, YTHDC2, YTHDF1, FTO, HNRNPC, METTL14, METTL3, WTAP, RBM15, ALKBH5, IGF2BP2, RBM15B, YTHDC1, as well as YTHDF2. Furthermore, the GSE53757 data indicated a significantly positive correlation of SOX11 expression with ZC3H13, HNRNPA2B1, IGF2BP3, YTHDC2, FTO, HNRNPC, METTL14, METTL3, WTAP, RBM15, and YTHDC1. Conversely, SOX11 expression exhibited a significantly negative correlation with ALKBH5, IGF2BP2, RBM15B, and YTHDF2 in this dataset (Figure 8A,8B). These findings were depicted through scatter plots, visually displaying the correlations between SOX11 and the m6A-related genes (Figure 8C-8P). We used survival map analysis to demonstrate the significance of these 17 m6A-related genes in the prognosis of KIRC (Figure 9A). Additionally, a Venn diagram verified the overlap between these genes and prognostic genes (Figure 9B). KM analysis revealed that lower expressions of ZC3H13 (P<0.001), FTO (P<0.001), METTL14 (P<0.001), as well as YTHDC1 (P<0.001) were related to a poor prognosis, while higher expressions of IGF2BP1 (P=0.01) and IGF2BP2 (P<0.001) were linked to poor prognosis in KIRC. Based on these findings, it can be inferred that SOX11 expression is possibly linked with m6A modification, impacting the progression and prognosis of KIRC through the regulation of m6A methylation (Figures 9C-9H,10).
Figure 8.
Correlation analysis of SOX11 expression and m6A-related genes in KIRC. We examined the correlation between the expression of SOX11 and m6A-related genes in KIRC using the (A) TCGA-KIRC and (B) GSE53757 datasets. (C-P) To illustrate the correlation between SOX11 and m6A gene expression, scatterplots were drawn. (Wilcoxon rank sum test) *, P<0.05; **, P<0.01; ***, P<0.001; ns, not significant. SOX11, SRY-box transcription factor 11; TPM, transcripts per million; m6A, N6-methyladenosine; KIRC, kidney renal clear cell carcinoma; TCGA, The Cancer Genome Atlas.
Figure 9.
Prognostic value analysis of m6A-related genes that are associated with SOX11 in KIRC. (A) Survival maps for the m6A-related gene. (B) Venn diagrams show their overlapping genes. The OS curve of (C) ZC3H13, (D) IGF2BP1, (E) FTO, (F) METTL14, (G) IGF2BP2, and (H) YTHDC1. HR, hazard ratio; TCGA, The Cancer Genome Atlas; GEO, Gene Expression Omnibus; CI, confidence interval; m6A, N6-methyladenosine; SOX11, SRY-box transcription factor 11; KIRC, kidney renal clear cell carcinoma; OS, overall survival.
Figure 10.
Prognostic value analysis of m6A-related genes that are associated with SOX11 in KIRC. The DSS curve of (A) ZC3H13, (B) IGF2BP1, (C) FTO, (D) METTL14, (E) IGF2BP2, and (F) YTHDC1. The PFI curve of (G) ZC3H13, (H) IGF2BP1, (I) FTO, (J) METTL14, (K) IGF2BP2, and (L) YTHDC1. HR, hazard ratio; CI, confidence interval; m6A, N6-methyladenosine; SOX11, SRY-box transcription factor 11; KIRC, kidney renal clear cell carcinoma; DSS, disease-specific survival; PFI, progression-free interval.
Discussion
SOX11, a crucial transcription factor, plays a pivotal role in embryonic neural development and has been involved in the pathogenesis of numerous cancers. Recent studies have shed light on the critical involvement of SOX11 in the development and progression of different cancer types (18,30). For instance, in HNSC, SOX11 overexpression could promote tumor growth and enhance aggressiveness (31). Further investigations have revealed that SOX11 regulates the expression of SDCCAG8, a gene involved in cell cycle regulation. The upregulation of SOX11 leads to increased expression of SDCCAG8, thereby promoting cancer cell proliferation and survival (31). In the context of prostate cancer, Hirokawa et al. demonstrated that overexpression of SOX11 enhances the invasiveness of cancer cells by suppressing vimentin expression (32). Moreover, Oliemuller et al. demonstrated the crucial role of SOX11 in driving epithelial/mesenchymal hybridization in invasive breast cancer cells (19). This process involves the acquisition of traits from both epithelial and mesenchymal states, resulting in increased plasticity, invasiveness, and resistance to therapy. Notably, the study suggests that SOX11 also modulates the tropism of these hybrid cells, promoting their migration towards specific tissues within the body (19). In our investigation, we observed significant upregulation of SOX11 in KIRC, which was confirmed by RT-PCR and IHC staining. Importantly, our study demonstrates that the overexpression of SOX11 serves as a reliable biomarker for the early detection of KIRC, as it is strongly associated with negative prognostic indicators and clinical characteristics of KIRC patients.
SOX11 plays a crucial role in on the regulation of various tumors, exerting its effects through diverse molecular mechanisms (17,33). Our study reveals that differential expression of SOX11 genes in KIRC is associated with the regulation of hormone levels, sodium ion channel activity, serine-type peptidase activity, synaptic vesicle cycling, the cAMP signaling pathway, and metabolism of xenobiotics by cytochrome P450, as identified through GO/KEGG enrichment analysis. Hormonal imbalance has been implicated in the pathogenesis and progression of cancer. Dysregulation of sodium ion channels contributes to the growth and proliferation of renal cancer cells in vitro (34,35). Notably, voltage-gated sodium channel (VGSC) is frequently overexpressed in breast (36), prostate (37), and cervical cancer (38), contributing to malignant behavior (34). Serine proteases play crucial roles in various steps of cancer progression, including angiogenesis, invasion, and metastasis (39). The synaptic vesicle cycle has been implicated in cancer (40,41), with overexpression observed in colorectal cancer and glioblastoma, promoting migration and invasion into surrounding tissues (39). The cAMP signaling pathway regulates tumor cell growth and metastasis through processes such as apoptosis, angiogenesis, and immune response (42). Collectively, these findings highlight the critical effect of SOX11 on the development and advancement of cancers.
GSEA of the DEGs associated with SOX11 revealed enrichment in several biological pathways, including the NABA core matrisome, collagen formation and degradation, ECM proteoglycans, oxidative phosphorylation, and DNA methylation. The NABA core matrisome comprises ECM proteins that play a crucial role in maintaining tissue homeostasis and supporting cellular function, with alterations in this matrisome linked to cancer development and progression (43). Collagen, as the most abundant and significant structural protein, influences the function and phenotype of tumor-infiltrating immune cells (44). Perturbations in specific ECM proteoglycans, such as syndecan and versican, have been associated with the development and progression of KIRC (45). Inhibition of oxidative phosphorylation promotes renal cell carcinoma (RCC) progression and enhances its metastatic potential (46). Dysregulated DNA methylation, a vital mechanism regulating gene expression, has been closely linked to poor prognoses or survival rates among individuals with KIRC (47). Collectively, these findings suggest that SOX11 exerts its functional impact in KIRC by modulating these signaling pathways, leading to an unfavorable prognosis.
Tumor-infiltrating immune cells have emerged as integral parts of tumor microenvironment, playing a significant role in shaping the clinical outcomes of cancer patients. Our research reveals a positive correlation between SOX11 expression in KIRC and the levels of CD8+ T cells, CD4+ T cells, and neutrophils, while showing a negative correlation with B cell levels. B cells, despite their critical role in the body’s defense against infections and foreign substances, can exert both pro-tumorigenic and anti-tumorigenic effects. They secrete cytokines and growth factors that promote cancer cell growth and survival, and their interactions with other immune cells within the tumor microenvironment can suppress anti-tumor immune responses (48,49). In contrast, CD8+ T cells are crucial for mounting an effective immune response against cancer. Intratumoral CXCL13+CD8+ T cells have been found to be associated with an unfavorable outcome in KIRC patients (50). CD4+ T cells infiltrate the tumor microenvironment and exert significant influence on cancer progression. Wang et al. demonstrated that CD4+ T cell infiltration stimulates TGFβ1 expression in both RCC cells and T cells, subsequently regulating KIRC cell proliferation through the modulation of TGFβ1/YBX1/HIF2α signals (51). Neutrophils, as shown by Peng et al., possess the capability to generate oncostatin M (OSM), facilitating liver cancer metastasis (52). Based on these findings, we speculate that SOX11 may impact KIRC prognosis by modulating the immune response to the tumor microenvironment.
Recent advancements in tumor immunotherapy have highlighted the crucial role of immune cell infiltration in cancer initiation and progression (53). Consequently, genes identified within the tumor microenvironment have become valuable diagnostic and prognostic biomarkers, as well as therapeutic targets. Our study reveals a significant correlation between SOX11 expression and various immune marker genes, underscoring the vital role of SOX11 in regulating the immune microenvironment in KIRC tumors. These findings provide a theoretical foundation for the development of innovative immunotherapeutic targets for KIRC treatment.
The m6A modification has garnered increasing attention due to its critical involvement in tumorigenesis, tumor progression, and therapeutic interventions. Zhang et al. demonstrated that YTHDF2 promotes the acquisition of the stem cell phenotype of liver cancer and enhances metastatic potential by modulating OCT4 expression through m6A RNA methylation (54). Additionally, m6A methylation has been shown to influence the immune evasion of tumor cells, resulting in increased resistance to immune checkpoint inhibitors (55). In our study, we observed a significant correlation between SOX11 expression and several m6A-related genes, including ZC3H13, IGF2BP1, FTO, METTL14, IGF2BP2, and YTHDC1. ZC3H13 serves as an m6A reader protein, modulating the stability, localization, and translation of m6A-modified transcripts, thereby impacting cellular growth, differentiation, and survival processes (56). IGF2BP1, an m6A-binding protein, plays a role in the regulation of RNA metabolism and gene expression, promoting the proliferation, migration, as well as invasion of KIRC cells through the modulation of mRNA targets (57). FTO, functioning as an RNA demethylase, facilitates the removal of m6A modifications from mRNAs. Shen et al. reported that FTO enhances the progression of KIRC by increasing PDK1 expression through an m6A-dependent pathway (58). METTL14, a pivotal component of the m6A methyltransferase complex, has been found to mediate m6A modification of Pten mRNA, thereby impeding the progression of KIRC (59). IGF2BP2, another m6A-binding protein, participates in the regulation of m6A-modified mRNAs in cancer (60). YTHDC1, an RNA-binding protein, recognizes and binds to m6A-modified mRNAs, suppressing KIRC progression by inhibiting the ANXA1/MAPK pathway (61). These findings suggest a potential link between the oncogenic effect of the SOX11 gene and m6A modification, as m6A modification may impact KIRC methylation levels through interactions with ZC3H13, IGF2BP1, FTO, METTL14, IGF2BP2, or YTHDC1, ultimately influencing KIRC progression.
Conclusions
This study represents the first investigation into the relationship between SOX11 expression, infiltrating levels of immune cells, methylation patterns, and prognosis in patients with KIRC. The findings reveal a negative association between SOX11 expression levels and B cells, while demonstrating a positive link to CD8+ T cells, CD4+ T cells, as well as neutrophils, potentially influencing tumor immunity through the modulation of these immune cell populations. Moreover, the expression levels of SOX11 exhibit positive correlations with ZC3H13, IGF2BP1, FTO, METTL14, IGF2BP2, and YTHDC1, suggesting their potential involvement in KIRC tumor progression through m6A methylation pathways. These findings suggest that SOX11 holds promise as a prognostic biomarker for KIRC. However, given that this study relied solely on bioinformatics analysis, further experimental investigations are necessary to explore the role of SOX11 in KIRC.
Supplementary
The article’s supplementary files as
Acknowledgments
Funding: This work was supported by the National Natural Science Foundation of China (No. 82060007), the Jiangxi Provincial Natural Science Foundation (No. 20232BAB206054), and the Science and Technology Research Project of Jiangxi Provincial Department of Education (No. GJJ210220).
Ethical Statement: The authors are accountable for all aspects of the work in ensuring that questions related to the accuracy or integrity of any part of the work are appropriately investigated and resolved. The study was conducted in accordance with the Declaration of Helsinki (as revised in 2013). The present study was approved by the Medical Ethics Committee of the First Affiliated Hospital of Nanchang University (ethical approval No. 2022-01-015). Written informed consent was provided from all patients.
Footnotes
Reporting Checklist: The authors have completed the MDAR reporting checklist. Available at https://tcr.amegroups.com/article/view/10.21037/tcr-24-109/rc
Conflicts of Interest: All authors have completed the ICMJE uniform disclosure form (available at https://tcr.amegroups.com/article/view/10.21037/tcr-24-109/coif). The authors have no conflicts of interest to declare.
Data Sharing Statement
Available at https://tcr.amegroups.com/article/view/10.21037/tcr-24-109/dss
References
- 1.Gray RE, Harris GT. Renal Cell Carcinoma: Diagnosis and Management. Am Fam Physician 2019;99:179-84. [PubMed] [Google Scholar]
- 2.Motzer RJ, Jonasch E, Agarwal N, et al. Kidney Cancer, Version 3.2022, NCCN Clinical Practice Guidelines in Oncology. J Natl Compr Canc Netw 2022;20:71-90. 10.6004/jnccn.2022.0001 [DOI] [PMC free article] [PubMed] [Google Scholar]
- 3.Linehan WM, Schmidt LS, Crooks DR, et al. The Metabolic Basis of Kidney Cancer. Cancer Discov 2019;9:1006-21. 10.1158/2159-8290.CD-18-1354 [DOI] [PubMed] [Google Scholar]
- 4.Sun Z, Tao W, Guo X, et al. Construction of a Lactate-Related Prognostic Signature for Predicting Prognosis, Tumor Microenvironment, and Immune Response in Kidney Renal Clear Cell Carcinoma. Front Immunol 2022;13:818984. 10.3389/fimmu.2022.818984 [DOI] [PMC free article] [PubMed] [Google Scholar]
- 5.Wei JH, Feng ZH, Cao Y, et al. Predictive value of single-nucleotide polymorphism signature for recurrence in localised renal cell carcinoma: a retrospective analysis and multicentre validation study. Lancet Oncol 2019;20:591-600. 10.1016/S1470-2045(18)30932-X [DOI] [PubMed] [Google Scholar]
- 6.Xu H, Zheng X, Zhang S, et al. Tumor antigens and immune subtypes guided mRNA vaccine development for kidney renal clear cell carcinoma. Mol Cancer 2021;20:159. 10.1186/s12943-021-01465-w [DOI] [PMC free article] [PubMed] [Google Scholar]
- 7.Siegel RL, Miller KD, Wagle NS, et al. Cancer statistics, 2023. CA Cancer J Clin 2023;73:17-48. 10.3322/caac.21763 [DOI] [PubMed] [Google Scholar]
- 8.Sun Q, Du J, Dong J, et al. Systematic Investigation of the Multifaceted Role of SOX11 in Cancer. Cancers (Basel) 2022;14:6103. 10.3390/cancers14246103 [DOI] [PMC free article] [PubMed] [Google Scholar]
- 9.Grimm D, Bauer J, Wise P, et al. The role of SOX family members in solid tumours and metastasis. Semin Cancer Biol 2020;67:122-53. 10.1016/j.semcancer.2019.03.004 [DOI] [PubMed] [Google Scholar]
- 10.Jankowski MP, Miller L, Koerber HR. Increased Expression of Transcription Factor SRY-box-Containing Gene 11 (Sox11) Enhances Neurite Growth by Regulating Neurotrophic Factor Responsiveness. Neuroscience 2018;382:93-104. 10.1016/j.neuroscience.2018.04.037 [DOI] [PMC free article] [PubMed] [Google Scholar]
- 11.Su D, Gao Q, Guan L, et al. Downregulation of SOX11 in fetal heart tissue, under hyperglycemic environment, mediates cardiomyocytes apoptosis. J Biochem Mol Toxicol 2021;35:e22629. 10.1002/jbt.22629 [DOI] [PubMed] [Google Scholar]
- 12.McNeill A. Are congenital anomalies of the kidney and urinary tract part of the SOX11 syndrome? Kidney Int 2018;94:826-7. 10.1016/j.kint.2018.06.014 [DOI] [PubMed] [Google Scholar]
- 13.Neirijnck Y, Reginensi A, Renkema KY, et al. Sox11 gene disruption causes congenital anomalies of the kidney and urinary tract (CAKUT). Kidney Int 2018;93:1142-53. 10.1016/j.kint.2017.11.026 [DOI] [PubMed] [Google Scholar]
- 14.Dinarvand P, Wang WL, Roy-Chowdhuri S. Utility of SOX11 for the diagnosis of solid pseudopapillary neoplasm of the pancreas on cytological preparations. Cytopathology 2022;33:216-21. 10.1111/cyt.13080 [DOI] [PMC free article] [PubMed] [Google Scholar]
- 15.Balsas P, Veloza L, Clot G, et al. SOX11, CD70, and Treg cells configure the tumor-immune microenvironment of aggressive mantle cell lymphoma. Blood 2021;138:2202-15. 10.1182/blood.2020010527 [DOI] [PMC free article] [PubMed] [Google Scholar]
- 16.Wästerlid T, Nordström L, Freiburghaus C, et al. Frequency and clinical implications of SOX11 expression in Burkitt lymphoma. Leuk Lymphoma 2017;58:1760-3. 10.1080/10428194.2016.1258701 [DOI] [PubMed] [Google Scholar]
- 17.Tsang SM, Oliemuller E, Howard BA. Regulatory roles for SOX11 in development, stem cells and cancer. Semin Cancer Biol 2020;67:3-11. 10.1016/j.semcancer.2020.06.015 [DOI] [PubMed] [Google Scholar]
- 18.Li X, Wu X, Li Y, et al. Promoter hypermethylation of SOX11 promotes the progression of cervical cancer in vitro and in vivo. Oncol Rep 2019;41:2351-60. 10.3892/or.2019.6993 [DOI] [PubMed] [Google Scholar]
- 19.Oliemuller E, Newman R, Tsang SM, et al. SOX11 promotes epithelial/mesenchymal hybrid state and alters tropism of invasive breast cancer cells. Elife 2020;9:e58374. 10.7554/eLife.58374 [DOI] [PMC free article] [PubMed] [Google Scholar]
- 20.Vivian J, Rao AA, Nothaft FA, et al. Toil enables reproducible, open source, big biomedical data analyses. Nat Biotechnol 2017;35:314-6. 10.1038/nbt.3772 [DOI] [PMC free article] [PubMed] [Google Scholar]
- 21.Livak KJ, Schmittgen TD. Analysis of relative gene expression data using real-time quantitative PCR and the 2(-Delta Delta C(T)) Method. Methods 2001;25:402-8. 10.1006/meth.2001.1262 [DOI] [PubMed] [Google Scholar]
- 22.Yu G, Wang LG, Han Y, et al. clusterProfiler: an R package for comparing biological themes among gene clusters. OMICS 2012;16:284-7. 10.1089/omi.2011.0118 [DOI] [PMC free article] [PubMed] [Google Scholar]
- 23.Love MI, Huber W, Anders S. Moderated estimation of fold change and dispersion for RNA-seq data with DESeq2. Genome Biol 2014;15:550. 10.1186/s13059-014-0550-8 [DOI] [PMC free article] [PubMed] [Google Scholar]
- 24.Subramanian A, Tamayo P, Mootha VK, et al. Gene set enrichment analysis: a knowledge-based approach for interpreting genome-wide expression profiles. Proc Natl Acad Sci U S A 2005;102:15545-50. 10.1073/pnas.0506580102 [DOI] [PMC free article] [PubMed] [Google Scholar]
- 25.Li T, Fan J, Wang B, et al. TIMER: A Web Server for Comprehensive Analysis of Tumor-Infiltrating Immune Cells. Cancer Res 2017;77:e108-10. 10.1158/0008-5472.CAN-17-0307 [DOI] [PMC free article] [PubMed] [Google Scholar]
- 26.Hänzelmann S, Castelo R, Guinney J. GSVA: gene set variation analysis for microarray and RNA-seq data. BMC Bioinformatics 2013;14:7. 10.1186/1471-2105-14-7 [DOI] [PMC free article] [PubMed] [Google Scholar]
- 27.Bindea G, Mlecnik B, Tosolini M, et al. Spatiotemporal dynamics of intratumoral immune cells reveal the immune landscape in human cancer. Immunity 2013;39:782-95. 10.1016/j.immuni.2013.10.003 [DOI] [PubMed] [Google Scholar]
- 28.Li Y, Xiao J, Bai J, et al. Molecular characterization and clinical relevance of m(6)A regulators across 33 cancer types. Mol Cancer 2019;18:137. 10.1186/s12943-019-1066-3 [DOI] [PMC free article] [PubMed] [Google Scholar]
- 29.Liu J, Lichtenberg T, Hoadley KA, et al. An Integrated TCGA Pan-Cancer Clinical Data Resource to Drive High-Quality Survival Outcome Analytics. Cell 2018;173:400-416.e11. 10.1016/j.cell.2018.02.052 [DOI] [PMC free article] [PubMed] [Google Scholar]
- 30.Wu H, Dai Y, Zhang D, et al. LINC00961 inhibits the migration and invasion of colon cancer cells by sponging miR-223-3p and targeting SOX11. Cancer Med 2020;9:2514-23. 10.1002/cam4.2850 [DOI] [PMC free article] [PubMed] [Google Scholar]
- 31.Huang J, Ji EH, Zhao X, et al. Sox11 promotes head and neck cancer progression via the regulation of SDCCAG8. J Exp Clin Cancer Res 2019;38:138. 10.1186/s13046-019-1146-7 [DOI] [PMC free article] [PubMed] [Google Scholar]
- 32.Hirokawa YS, Kanayama K, Kagaya M, et al. SOX11-induced decrease in vimentin and an increase in prostate cancer cell migration attributed to cofilin activity. Exp Mol Pathol 2020;117:104542. 10.1016/j.yexmp.2020.104542 [DOI] [PubMed] [Google Scholar]
- 33.Yang Z, Jiang S, Lu C, et al. SOX11: friend or foe in tumor prevention and carcinogenesis? Ther Adv Med Oncol 2019;11:1758835919853449. 10.1177/1758835919853449 [DOI] [PMC free article] [PubMed] [Google Scholar]
- 34.Angus M, Ruben P. Voltage gated sodium channels in cancer and their potential mechanisms of action. Channels (Austin) 2019;13:400-9. 10.1080/19336950.2019.1666455 [DOI] [PMC free article] [PubMed] [Google Scholar]
- 35.Horne J, Mansur S, Bao Y. Sodium ion channels as potential therapeutic targets for cancer metastasis. Drug Discov Today 2021;26:1136-47. 10.1016/j.drudis.2021.01.026 [DOI] [PubMed] [Google Scholar]
- 36.Luo Q, Wu T, Wu W, et al. The Functional Role of Voltage-Gated Sodium Channel Nav1.5 in Metastatic Breast Cancer. Front Pharmacol 2020;11:1111. 10.3389/fphar.2020.01111 [DOI] [PMC free article] [PubMed] [Google Scholar]
- 37.Lopez-Charcas O, Pukkanasut P, Velu SE, et al. Pharmacological and nutritional targeting of voltage-gated sodium channels in the treatment of cancers. iScience 2021;24:102270. 10.1016/j.isci.2021.102270 [DOI] [PMC free article] [PubMed] [Google Scholar]
- 38.Sanchez-Sandoval AL, Gomora JC. Contribution of voltage-gated sodium channel β-subunits to cervical cancer cells metastatic behavior. Cancer Cell Int 2019;19:35. 10.1186/s12935-019-0757-6 [DOI] [PMC free article] [PubMed] [Google Scholar]
- 39.Martin CE, List K. Cell surface-anchored serine proteases in cancer progression and metastasis. Cancer Metastasis Rev 2019;38:357-87. 10.1007/s10555-019-09811-7 [DOI] [PMC free article] [PubMed] [Google Scholar]
- 40.Chang YC, Li CH, Chan MH, et al. Overexpression of synaptic vesicle protein Rab GTPase 3C promotes vesicular exocytosis and drug resistance in colorectal cancer cells. Mol Oncol 2023;17:422-44. 10.1002/1878-0261.13378 [DOI] [PMC free article] [PubMed] [Google Scholar]
- 41.Georgantzi K, Tsolakis AV, Jakobson Å, et al. Synaptic Vesicle Protein 2 and Vesicular Monoamine Transporter 1 and 2 Are Expressed in Neuroblastoma. Endocr Pathol 2019;30:173-9. 10.1007/s12022-019-09584-3 [DOI] [PubMed] [Google Scholar]
- 42.Ahmed MB, Alghamdi AAA, Islam SU, et al. cAMP Signaling in Cancer: A PKA-CREB and EPAC-Centric Approach. Cells 2022;11:2020. 10.3390/cells11132020 [DOI] [PMC free article] [PubMed] [Google Scholar]
- 43.Yuzhalin AE, Urbonas T, Silva MA, et al. A core matrisome gene signature predicts cancer outcome. Br J Cancer 2018;118:435-40. 10.1038/bjc.2017.458 [DOI] [PMC free article] [PubMed] [Google Scholar]
- 44.Rømer AMA, Thorseth ML, Madsen DH. Immune Modulatory Properties of Collagen in Cancer. Front Immunol 2021;12:791453. 10.3389/fimmu.2021.791453 [DOI] [PMC free article] [PubMed] [Google Scholar]
- 45.Niedworok C, Kempkensteffen C, Eisenhardt A, et al. Serum and tissue syndecan-1 levels in renal cell carcinoma. Transl Androl Urol 2020;9:1167-76. 10.21037/tau-19-787 [DOI] [PMC free article] [PubMed] [Google Scholar]
- 46.Yuan JS, Chen ZS, Wang K, et al. Holliday junction‑recognition protein modulates apoptosis, cell cycle arrest and reactive oxygen species stress in human renal cell carcinoma. Oncol Rep 2020;44:1246-54. 10.3892/or.2020.7656 [DOI] [PubMed] [Google Scholar]
- 47.Klümper N, Ralser DJ, Bawden EG, et al. LAG3 (LAG-3, CD223) DNA methylation correlates with LAG3 expression by tumor and immune cells, immune cell infiltration, and overall survival in clear cell renal cell carcinoma. J Immunother Cancer 2020;8:e000552. 10.1136/jitc-2020-000552 [DOI] [PMC free article] [PubMed] [Google Scholar]
- 48.Engelhard V, Conejo-Garcia JR, Ahmed R, et al. B cells and cancer. Cancer Cell 2021;39:1293-6. 10.1016/j.ccell.2021.09.007 [DOI] [PubMed] [Google Scholar]
- 49.Laumont CM, Banville AC, Gilardi M, et al. Tumour-infiltrating B cells: immunological mechanisms, clinical impact and therapeutic opportunities. Nat Rev Cancer 2022;22:414-30. 10.1038/s41568-022-00466-1 [DOI] [PMC free article] [PubMed] [Google Scholar]
- 50.Dai S, Zeng H, Liu Z, et al. Intratumoral CXCL13(+)CD8(+)T cell infiltration determines poor clinical outcomes and immunoevasive contexture in patients with clear cell renal cell carcinoma. J Immunother Cancer 2021;9:e001823. 10.1136/jitc-2020-001823 [DOI] [PMC free article] [PubMed] [Google Scholar]
- 51.Wang Y, Wang Y, Xu L, et al. CD4 + T cells promote renal cell carcinoma proliferation via modulating YBX1. Exp Cell Res 2018;363:95-101. 10.1016/j.yexcr.2017.12.026 [DOI] [PubMed] [Google Scholar]
- 52.Peng ZP, Jiang ZZ, Guo HF, et al. Glycolytic activation of monocytes regulates the accumulation and function of neutrophils in human hepatocellular carcinoma. J Hepatol 2020;73:906-17. 10.1016/j.jhep.2020.05.004 [DOI] [PubMed] [Google Scholar]
- 53.Altorki NK, Markowitz GJ, Gao D, et al. The lung microenvironment: an important regulator of tumour growth and metastasis. Nat Rev Cancer 2019;19:9-31. 10.1038/s41568-018-0081-9 [DOI] [PMC free article] [PubMed] [Google Scholar]
- 54.Zhang C, Huang S, Zhuang H, et al. YTHDF2 promotes the liver cancer stem cell phenotype and cancer metastasis by regulating OCT4 expression via m6A RNA methylation. Oncogene 2020;39:4507-18. 10.1038/s41388-020-1303-7 [DOI] [PubMed] [Google Scholar]
- 55.Peng L, Pan B, Zhang X, et al. Lipopolysaccharide facilitates immune escape of hepatocellular carcinoma cells via m6A modification of lncRNA MIR155HG to upregulate PD-L1 expression. Cell Biol Toxicol 2022;38:1159-73. 10.1007/s10565-022-09718-0 [DOI] [PubMed] [Google Scholar]
- 56.Wen J, Lv R, Ma H, et al. Zc3h13 Regulates Nuclear RNA m(6)A Methylation and Mouse Embryonic Stem Cell Self-Renewal. Mol Cell 2018;69:1028-1038.e6. 10.1016/j.molcel.2018.02.015 [DOI] [PMC free article] [PubMed] [Google Scholar]
- 57.Yuan B, Zhou J. N.(6)-methyladenosine (m(6)A) reader IGF2BP1 facilitates clear-cell renal cell carcinoma aerobic glycolysis. PeerJ 2023;11:e14591. 10.7717/peerj.14591 [DOI] [PMC free article] [PubMed] [Google Scholar]
- 58.Shen H, Ying Y, Ma X, et al. FTO promotes clear cell renal cell carcinoma progression via upregulation of PDK1 through an m(6)A dependent pathway. Cell Death Discov 2022;8:356. 10.1038/s41420-022-01151-w [DOI] [PMC free article] [PubMed] [Google Scholar]
- 59.Zhang L, Luo X, Qiao S. METTL14-mediated N6-methyladenosine modification of Pten mRNA inhibits tumour progression in clear-cell renal cell carcinoma. Br J Cancer 2022;127:30-42. 10.1038/s41416-022-01757-y [DOI] [PMC free article] [PubMed] [Google Scholar]
- 60.Wang J, Chen L, Qiang P. The role of IGF2BP2, an m6A reader gene, in human metabolic diseases and cancers. Cancer Cell Int 2021;21:99. 10.1186/s12935-021-01799-x [DOI] [PMC free article] [PubMed] [Google Scholar]
- 61.Li W, Ye K, Li X, et al. YTHDC1 is downregulated by the YY1/HDAC2 complex and controls the sensitivity of ccRCC to sunitinib by targeting the ANXA1-MAPK pathway. J Exp Clin Cancer Res 2022;41:250. 10.1186/s13046-022-02460-9 [DOI] [PMC free article] [PubMed] [Google Scholar]


