Abstract
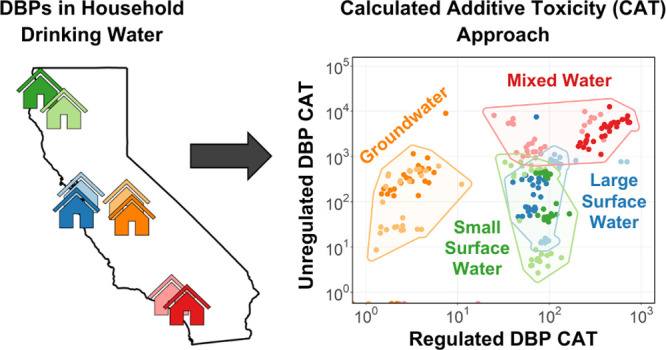
Recent studies have implemented a calculated additive toxicity (CAT) approach that sums measured disinfection byproduct (DBP) concentrations weighted by their respective in vitro bioassay potencies to estimate their associated risk in disinfected waters. In this study, the CAT approach was used to systematically investigate 21 regulated and unregulated DBPs measured in drinking water at the household level. Water samples from the tap were collected from over 120 randomly selected participants supplied by eight public water systems using four distinct source water types, two types of disinfection processes, and across two seasons. The purpose of this study was to compare CAT using multiple biological end points, examine household variability, identify DBPs driving toxicity, and assess if current regulated DBPs are adequate predictors of unregulated DBPs. Our results support the significance of unregulated DBPs, particularly haloacetonitriles and iodoacetic acid, as drivers of toxicity. Simple linear models between regulated versus unregulated concentrations and CAT were overall weak with 67% considered poor (r2 < 0.3). These results reveal that current regulatory monitoring approaches may not be adequately capturing true household exposure due to higher contribution of unregulated DBPs to CAT and poor predictability between regulated and unregulated DBP-mediated CAT.
Keywords: oxidative stress, cytotoxicity, haloacetonitriles, iodoacetic acid, chlorination, chloramination, potable reuse
Short abstract
A household-level examination of disinfection byproducts across eight public water systems reveals high variability of calculated additive toxicity and supports the importance of unregulated compounds.
Introduction
Drinking water disinfection is notably recognized as one of the greatest public health achievements of the 20th century, significantly reducing waterborne pathogens responsible for disease outbreaks including typhoid, cholera, and salmonellosis.1 Although disinfection has successfully controlled waterborne diseases and increased overall life expectancy, an unintended consequence includes the formation of toxic and carcinogenic compounds known as disinfection byproducts (DBPs). DBPs are formed when chemical disinfectants react with natural organic matter (NOM; e.g., humic and fulvic acids), other organic compounds, bromide, iodide, and nitrogen in the source water.
Currently 11 disinfection byproducts are regulated in the U.S. under the EPA Stage 2 Disinfectants and Disinfection Byproducts Rule (DBPR) including four trihalomethanes (THM4), five haloacetic acids (HAA5), bromate, and chlorite.2 Under the Stage 2 DBPR, community water systems must conduct an initial distribution system evaluation (IDSE) to identify locations with the highest DBP concentrations. These locations are then used as monitoring sites where compliance is based on the locational running annual average (LRAA) for each site. However, DBPs are known to have considerable variability throughout a distribution system. Such variability may be related to the nature of the distribution system (changes in demand, storage tank fill and empty, varying water ages); nature of the pipelines (pipe failures, leaching of pipe material, presence of biofilms); and transformations (biodegradation, volatilization).3 Other studies have observed the high variability of both regulated and unregulated DBPs within a given distribution system.4−9 While only 11 compounds are regulated in the US, more than 700 DBPs have been identified but only ∼100 have been studied for their occurrence, toxicity, and associated health effects.10
Exposure to disinfection byproducts in drinking water has been correlated with numerous adverse health effects in epidemiologic and in vivo studies. These studies are limited in their ability to establish causality because of variability in genetic factors, health status, diets, and lifestyles across studied populations, and difficulty of extrapolating from observed animal to predicted human response.11 A further difficulty is that, although regulated compounds are typically used as surrogates to represent overall DBP toxicity and health outcomes, studies using in vitro mammalian cell bioassays have revealed that emerging unregulated compounds, particularly nitrogenous and iodinated DBPs, can be significantly more toxic.12−19
In vitro bioassay tests have emerged as a useful tool to assess the relative toxicity of chemicals such as disinfection byproducts in drinking water.20 The use of in vitro bioassay tests allows systematic testing of chemicals with reproducible cell lines and a range of biological end points. The largest database for DBP bioassay potencies to date is based on the Chinese hamster ovary (CHO) cell for cytotoxicity and genotoxicity end points with the inclusion of 103 regulated and unregulated emerging DBPs.21 The most potent DBPs to the CHO cell consist predominately of unregulated DBPs with haloacetonitriles (HANs), haloacetamides, iodo-HAAs, and haloacetaldehydes as the most potent groups.21 The TIC-TOX approach sums measured DBP concentrations weighted by their individual CHO cell LC50 values to estimate DBP-mediated toxicity in disinfected waters.12 This calculated additive toxicity (CAT) approach has recently been validated for the CHO cytotoxicity end point.22 Another study has found that CHO genotoxicity is antagonistic rather than additive, where calculated toxicity was higher than the observed bioassay response.23 While the authors suggest that CAT may provide an upper-limit or worst-case scenario, quantitative analyses are recommended for the genotoxicity end point.23
A study of 50 DBPs using nine different bioassays representative of different toxicity pathways and biological end points found that DBPs are more toxic through oxidative stress induction or enzyme inhibition rather than direct cell damage.24 The AREc32 assay, which is indicative of oxidative stress induction and based on the MCF7 human breast cancer cell line, was the most responsive bioassay to DBPs with HANs, haloketones, mono-HAAs, and haloacetamides as the most potent groups.24 Another study validated the CAT approach in DBP mixtures with equipotent concentrations for the AREc32 bioassay, two other bioassays based on human cancer cell lines (ARE-bla and p53-bla), and one bacterial assay (Microtox).25
There are some limitations and research gaps concerning the CAT approach including bias with the inclusion or omission of specific DBPs,26 influence of unknown DBPs,26 and role of metabolic activity for DBP toxicity.25 However, measuring all unregulated DBPs (likely more than 1000 compounds) and their toxicological potencies is likely impracticable in the immediate future.26 The CAT approach provides a useful tool for identifying DBP drivers of toxicity and prioritizing them for future research and risk assessments.
In this study, the CAT approach was implemented for 21 regulated and unregulated DBPs measured in California household drinking water collected from over 120 participants supplied by eight different public water systems using four distinct source water types, two types of disinfection processes, and across two seasons. The objectives of the research were to (1) compare CAT across the five validated biological end points including ARE-bla oxidative stress, AREc32 oxidative stress, p53-bla adaptive stress, Microtox cytotoxicity, and CHO cytotoxicity, (2) examine household seasonal and intradistribution system variability in CAT, (3) identify DBP compounds driving toxicity, and (4) assess the adequacy of regulated DBPs as surrogates for unregulated DBPs.
Methods
Methodological Limitations
This study was part of a larger research project that aimed to systematically investigate compounds in California household tap water that may be contributing to breast cancer risks. This research involved targeted analysis of a broad suite of chemical classes including disinfection byproducts (DBPs) as well as nontargeted chemical analysis. Due to the extensive nature of this larger research project, there were some methodological limitations in the analysis of DBPs, including the inability to use a dechlorinating agent during sample preparation, extended holding times during sample processing, instances where extrapolation of chloroform concentrations were required, and the inclusion of a limited range of unregulated DBPs. These methodological limitations and their implications are further addressed in Section S2.1.
Water Systems Studied
Eight public water systems in California were chosen for study including East Bay Municipal Utility District (EB), California Water Services San Mateo (SM), Weaverville CSD (WV), Yurok Tribal Environmental Department (YT), Irvine Ranch Water District (IR), Los Angeles Water and Power (LA), City of Merced (MC), and City of Madera (MD). Systems were selected to include different water source types (large surface water, small surface water, mixed water, and groundwater); disinfection processes (chlorination and chloramination); and distribution system characteristics (population and geographic area served). A map of studied public water systems and their corresponding water sources is shown in Figure S1. Additional information for each region is presented in Section S1.
Household Selection and Participation
For each public water system, the California Public Water Supply Systems Search Tool (Drinking Water Watch) was used to select neighborhoods within service areas and (CalEnviroScreen 3.0) was used to select neighborhoods with the greatest economic diversity. After collaboration with advocacy partners and a recruiting process, 15 households from each water system were selected for participation. Selected household sampling locations within each distribution system are shown in Figure S2.
Sampling Process
Each household was sampled twice, once in the winter (January-April 2020) and once in the summer (July-October 2020). Sampling kits were shipped to all selected households within a region and then collected on a single day, transported back, and processed on the day received. Regions were sampled consecutively each week in the following order: San Mateo, East Bay, Weaverville, Yurok, Los Angeles, Irvine, Madera, and Merced. Participants were instructed to collect water directly from the household kitchen sink faucet and remove any point of use filters or devices prior. Household samples were collected in 2.5 L amber glass bottles and participants were instructed to fill bottles completely to the top to avoid volatilization during transport. The collected sample bottle was then placed in a cooler with 3 ice packs. Coolers were picked up from each household and transported to the laboratory via Rapidus courier service.
Analytical Methods
DBPs examined in this study are presented in Table S1 and include THM4 (TCM, BDCM, DBCM, TBM); HAA5 (CAA, DCAA, TCAA, BAA, DBAA); HANs (BAN, BCAN, DBAN, IAN); unregulated HAAs (BCAA, CDBAA, BDCAA, TBAA, CIAA, IAA); and unregulated THMs (BCIM and CDIM). Upon arrival at the laboratory, samples were aliquoted into 40 mL glass vials for HAAs extraction and 50 mL glass vials for THMs and HANs extraction. Aliquots were filled to the top to avoid volatilization, stored at 4 °C, and extracted within 14 days.
All HAAs were extracted using methods outlined in Section S2.3 including liquid–liquid extraction (LLE) and GC–ECD instrumentation. HAA extraction methods were derived from EPA Method 552.3, however a dechlorinating agent was not used.27 All remaining compounds including THMs and HANs were extracted using methods outlined in Section S2.3 including thin-film solid-phase microextraction (TF–SPME) and GS–MS instrumentation paired with an automated thermal desorption system. The limits of detection, limits of quantification, quality control recoveries, and calibration curve accuracies for both methods are discussed in Section S2.6.
Calculated Additive Toxicity (CAT)
In this study, the calculated additive toxicity (CAT) approach was implemented using toxicity potencies for the five biological end points that have been previously validated for this approach. These include the ARE-bla oxidative stress, AREc32 oxidative stress, p53-bla adaptive stress, Microtox cytotoxicity, and CHO cytotoxicity end points. Toxicity potencies for individual DBPs for the CHO end point were used from the study published by Wagner and Plewa21 and toxicity potencies for all other end points were used from the study published by Stalter et al.24 The CAT for each sample and biological end point was calculated using eqs 1–5:
| 1 |
| 2 |
| 3 |
| 4 |
| 5 |
Where [DBP] is the concentration of each compound in (g/L), Mw is the molecular weight of the compound (g/mol), ECIR1.5 is the ARE-bla, AREc32, and p53-bla effect concentration (mol/L), EC50 is the Microtox effect concentration (mol/L), LC50 is the CHO lethal concentration (mol/L), and 106 is a normalization factor. For compounds where no effect (n.e.) was observed, the highest concentration tested was used. ECIR1.5/EC50/LC50 values used for each compound are summarized in Table S6.
Statistical Analysis
To compare results across multiple variables, Tukey’s Honest Significant Difference (Tukey HSD) tests were conducted at a 95% confidence interval. Results are presented as the compact letter display (cld) where variables with the same letters indicate that there is no statistically significant difference. To compare results between only two variables, Student’s t-Tests were conducted at a 95% confidence interval. Results are presented with the p-value (P) and degrees of freedom (df). Linear models between system variables were developed in RStudio using analysis of variance (ANOVA) lm() and aov() functions. Coefficients of determination (r2) indicate model strength or predictability power between independent and dependent variables.
Results and Discussion
Measured DBP Concentrations
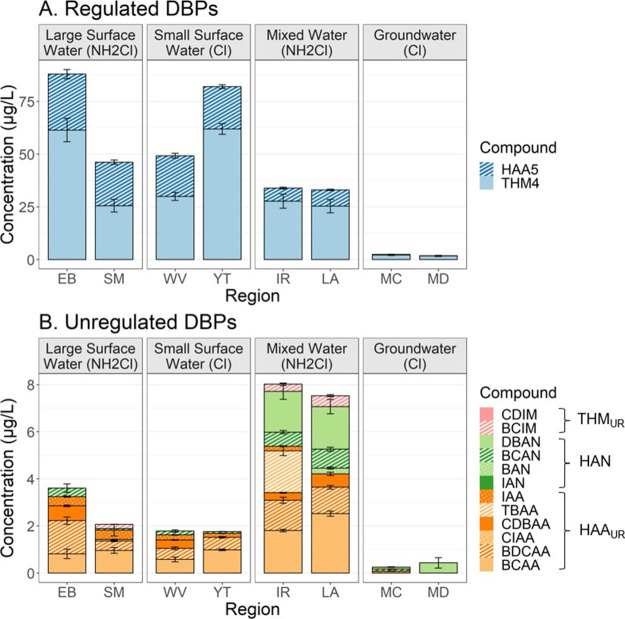
Detection frequencies for all compounds and regions are presented in Table S7 and represent the percentage of samples within each region that have compounds detected above the LOD. The regulated and unregulated DBP concentrations measured within each region are presented in Figure 1 and discussed in the following sections. Regions with similar source water type had comparable DBP concentrations and speciation. Observed similarities and results by grouped regions are further discussed in Section S3.2.
Figure 1.
Regulated and unregulated measured concentrations (μg/L) by region and source water type. Values represent the regional average across both seasons and error bars represent the standard error.
Regulated
The measured and corresponding water utility reported regional averages for THM4 and HAA5 are discussed in Section S3.1 and presented in Table S8. Overall, measured concentrations of regulated DBPs were comparable to values reported in water utility consumer confidence reports (CCR) with no statistical difference for either THM4 (P = 0.10, df = 7) or HAA5 (P = 0.19, df = 6). Comparable values between reported and measured regulated concentrations support the validity of the methods used in this study despite deviations from standard procedure imposed by the overall study design including the absence of a dechlorinating agent, extended reaction times, and incidences of TCM extrapolation. Highest regulated compound concentrations by source water type included large surface water ≈ small surface water (cld = c) > mixed water (cld = b) > groundwater (cld = a).
Unregulated
The five highest measured unregulated DBPs in decreasing rank order included BCAA, BDCAA, DBAN, BCAN, and CDBAA, which together accounted for ∼91% of total unregulated concentrations. Highest unregulated concentrations by source water type included mixed water (cld = c) > large surface water ≈ small surface water (cld = b) > groundwater (cld = a). HANs, which have been identified as major forcing agents of DBP associated toxicity in disinfected waters,12,28,29 were highest in the mixed water sources ranging from 0.6 to 7.4 μg/L, with a few nondetects.
Comparison of CAT across Different Validated Biological End Points
A Tukey HSD test revealed that there was no statistical difference in CAT between the ARE-bla, p53-bla, Microtox, and CHO end points across all samples (P > 0.05, df = 1185). However, the AREc32 end point was statistically different (P < 0.05, df = 1185) and had the overall highest CAT which was primarily due to increased sensitivity to BCAN and DBAN. Tukey HSD tests across system variables (i.e., season, region, disinfection type, and source water type) generally confirmed the statistically insignificant differences among ARE-bla, p53-bla, Microtox, CHO and the statistical separation of AREc32 from other end points. The compact letter displays (cld) of these Tukey HSD tests are summarized in Figure S3. Boxplots of CAT across all biological end points and each system variable are shown in Figures S4–S8.
It should be noted that out of the 21 compounds included in this study, two compounds (BAN and IAN) did not have a potency value for the ARE-bla, AREc32, p53-bla, or Microtox end points.24 However, this only affected BAN concentrations in LA in the summer, which ranged from 0.1–0.8 μg/L. The CHO end point had potency values available for all compounds included in this study. Due to the CHO end point’s statistically insignificant difference from multiple other end points, the following sections focus only on calculated CHO cytotoxicity and AREc32 oxidative stress. The DBPs measured in this study account for 21% of the DBPs in the CHO database published by Wagner and Plewa,21 and include four of the top ten most potent compounds (DBAN, IAA, BAN, and IAN). Similarly, the DBPs measured in this study account for 38% of the DBPs in the database published by Stalter et al.,24 and include three of the top ten most potent compounds (DBAN, BCAN, IAA).
Variability of CAT at the Household Level
Regional CAT Averages
The average CAT values for regulated and unregulated DBPs within each region are shown in Figure 2. Unregulated DBPs dominated in all regions when averaging across the winter and summer seasons and contributed 91.3% of total CHO cytotoxicity and 98.9% of total AREc32 oxidative stress. Considering that only 13% of known unregulated DBPs with toxicological data were included in this study, the magnitude of total unregulated compound contributions to CAT are likely to be even higher. For the DBPs included in this study, the highest CAT by source water type for both end points included mixed water (cld = b) > large surface water ≈ small surface water ≈ groundwater (cld = a). However, it should be noted that this ranking may be altered with the inclusion of other known and unknown DBPs.26
Figure 2.
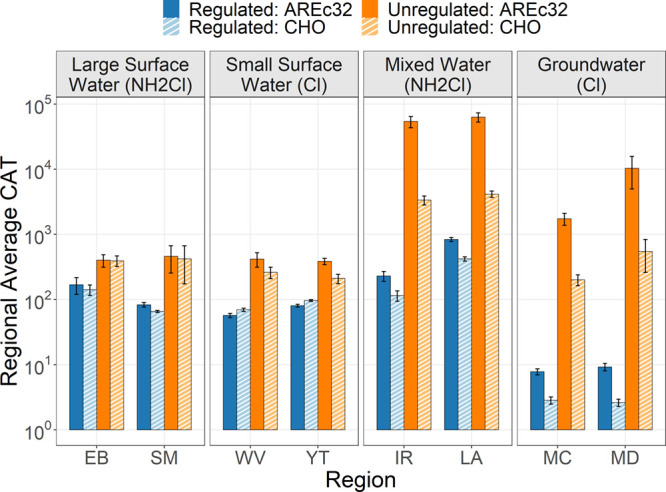
Regional CAT averages. Plotted values represent the regional average CAT for the CHO and AREc32 end points across seasons. Error bars represent the standard error.
Variability between Seasons
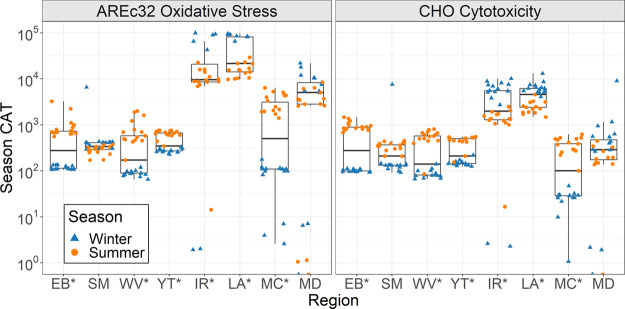
The boxplots in Figure 3 show the seasonal variability of CAT within each region where scattered data points represent each individual household’s CAT value. There was a statistical difference (P < 0.05) between the winter and summer regional averages for all regions except SM and MD. CHO cytotoxicity was 9 ± 5 times higher in the summer for four regions (EB, WV, YT, MC) and 3 ± 1 times higher in the winter for two regions (IR, LA). AREc32 oxidative stress was 15 ± 16 times higher in the summer for four regions (EB, WV, YT, MC) and 8 ± 2 times higher in the winter for two regions (IR, LA).
Figure 3.
Variability in CAT between seasons. Asterisks (*) next to region name indicate statistical differences in regional average CAT between winter and summer seasons (P < 0.05).
For each household, CAT in the summer season was divided by CAT in the winter season to determine seasonal variability within each household. The interquartile range (IQR) for CHO cytotoxicity ranged from 44 to 862% and AREc32 oxidative stress ranged from 24 to 779%. These results provide strong evidence that CAT can have high seasonal variability both within a given household and across the entirety of a system. The AREc32 end point had higher seasonal variance due to its increased sensitivity and higher overall CAT, however seasonal trends were comparable across both biological end points.
Variability between Households within a Region
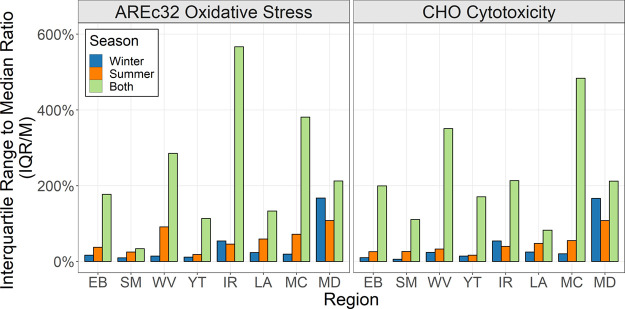
To evaluate intradistribution system variability, the interquartile range to median ratio (IQR/M) was determined which represents the spread of CAT around the median or the difference between the third and first quartiles divided by the median. There was no statistical difference in IQR/M ratios between the AREc32 and CHO end points (P = 0.65, df = 22). Madera (MD) had the highest IQR/M ratios which ranged from 108 to 168% across both end points. This was driven primarily by high variability in measured DBAN concentrations which ranged from ND-5.0 (μg/L). The other regions had lower variability with IQR/M ratios ranging from 6 to 91%. IQR/M ratios for each season and within each region are presented in Figure 4.
Figure 4.
Interquartile range to median ratios (IQR/M) of CAT within each region.
When considering variability across both seasons, all regional IQR/M ratios increased ranging from 34 to 567% as shown in Figure 4. This reveals that the largest variability in CAT is attributed to seasonal/temporal differences rather than intradistribution system variability. Under the Stage 2 DBPR, compliance is based on 2–20 sampling locations measured either annually or quarterly, depending on the source water type and population size served.2 While this study only included 2 seasons, these results provide strong evidence that DBP-associated CAT can vary significantly in season/time. Future research with the inclusion of more time points throughout the year may help elucidate whether current regulatory methods provide an accurate snapshot of DBP exposure considering this observed high seasonal variability.
DBP Compounds Driving CAT
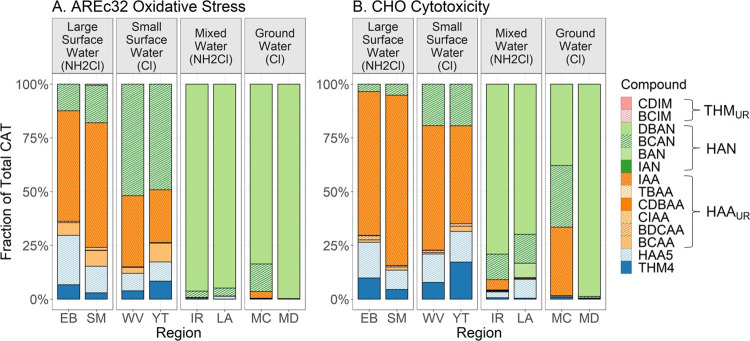
BCAN, DBAN, and IAA were
the main drivers of CAT, accounting for 87.3% of total CHO cytotoxicity
and 98.6% of total AREc32 oxidative stress. Compounds driving toxicity
were comparable in regions that had similar water source types as
shown in Figure 5.
IAA ( ) dominated
CAT in the regions that use surface water sources and both chlorination
and chloramination. This may be due to elevated iodide levels in surface
waters.30 HANs (
 ,
,  ) dominated CAT in the mixed
water and groundwater sources. Irvine (IR) and Los Angeles (LA) regions
both rely on complex water sources including high salinity water,
brackish groundwater, and direct or indirect potable reuse of recycled
water which may explain the role of nitrogenous DBPs as toxicity drivers.
Elevated unregulated DBPs, particularly N-DBPs, have also been identified
as drivers of cytotoxicity in drinking water from heavily wastewater-impacted
sources.30 Madera (MD) and Merced (MC)
are among the top dairy farming counties in California which may explain
the dominance of nitrogenous DBPs. Future research on source water
quality and DBP formation could help to elucidate the role played
by each water source in producing the observed DBP speciation in these
regions.
Figure 5.
DBP compounds driving CAT.
Utility of Regulated DBPs as Predictors of Unregulated Concentrations and CAT
Regulated vs Unregulated Concentrations
THMs were found to only explain ∼30% (r2 ∼ 0.3) of the variance in HANs in a study that included an EPA data set of over 9500 measurements across 248 public water systems in the U.S.31 In our study, THM4 explained 2% of the variance in HANs (r2 = 0.02, df = 164) and HAA5 explained 3% of the variance in HANs (r2 = 0.03, df = 164). Total regulated concentrations or the sum of THM4 and HAA5 explained <1% of the variance in total unregulated concentrations (r2 = 0.009, df = 236). These results support other study findings that current DBPs measured for regulation are not proportional to unregulated DBP concentrations, particularly toxicity-driving HANs, which can result in exposure misclassification bias in epidemiologic studies.31
When considering all system variables (i.e., season, region, disinfection type, and source water type), coefficients of determination ranged from r2 < 0.01 to r2 = 0.71 as summarized in Table S9 and shown in Figures S10–S17. Overall, 60% of the models were considered poor (r2 < 0.3), 38% were considered fair (0.3 < r2 < 0.7), and only 2% were strong (r2 > 0.7). The strongest relationships between regulated and unregulated concentrations were observed when the data was grouped by season and source water type as shown in Figure S9.
Regulated vs Unregulated CAT
While poor predictability between regulated and unregulated concentrations have been observed, the question remains: does regulated CAT accurately predict unregulated CAT? THM4 explained 3% of the variance in HANs-mediated CHO cytotoxicity (r2 = 0.03, df = 164) and HAA5 explained 43% of the variance in HANs-mediated CHO cytotoxicity (r2 = 0.43, df = 164). The AREc32 end point was analogous to these results within ±3% of variance explained. Multiple linear regression revealed that the higher predictability power of HAA5 was attributed primarily to BAA and DBAA, which are the most potent regulated DBPs.
Total regulated CAT explained 39% of the variance in total unregulated CAT for both biological end points (r2 = 0.39, df = 236). When considering all system variables, model strengths for the CHO and AREc32 end point were not statistically different (P = 0.12, df = 43). Coefficients of determination for both end points ranged from r2 < 0.01 to r2 = 0.71 as summarized in Section S3.6. Overall, models for regulated versus unregulated CAT were weak with 71% considered poor (r2 < 0.3), 27% considered fair (0.3 < r2 < 0.7), and only 2% considered strong (r2 > 0.7). Linear models were strongest when the data was grouped and modeled by season and source water type. CHO cytotoxicity models across season and source water type are shown in Figure 6. While their results are analogous, AREc32 oxidative stress models by season and source water type are presented in Figure S19. Overall, these results reveal that regulated CAT poorly predicts unregulated CAT across all samples, across both CHO and AREc32 end points, and when grouped by season, region, disinfection type, source water type, and multiple variable interactions.
Figure 6.
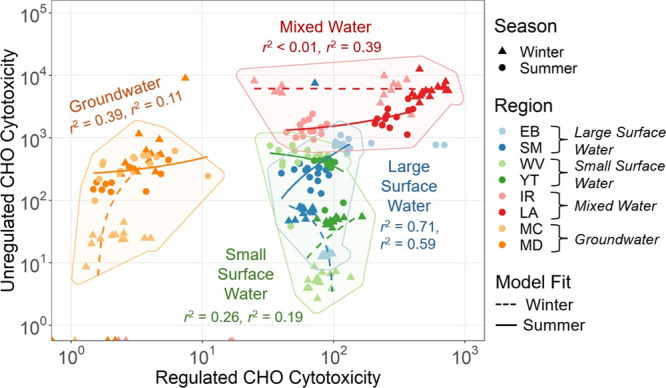
Regulated vs unregulated CHO Cytotoxicity. Data points not encompassed within their respective shaded polygons indicate outliers that were determined using Q-Q plots. These outliers were excluded from the linear regression models. Coefficients of determination (r2) represent winter followed by summer season model strengths.
Conclusions
The aim of this study was to investigate 21 disinfection byproducts (DBPs) in California household drinking water across different public water systems, source water types, disinfection types, and seasons. To assess variability in household level risk, the calculated additive toxicity (CAT) approach was implemented using previously published in vitro bioassay toxicity potencies for five biological end points that have been validated for additive bioassay response. Our results reveal that there was generally no statistical difference in CAT between the ARE-bla, p53-bla, Microtox, and CHO end points. AREc32 oxidative stress CAT was statistically different than the others but yielded similar seasonal variability, intradistribution system variability, DBPs driving toxicity, and models strengths between regulated versus unregulated DBPs as CHO cytotoxicity CAT. These results provide strong evidence that using potencies indicative of different biological end points and toxicity pathways produce comparable results when assessing DBP-associated risk in disinfected drinking water.
While DBP concentrations and speciation are known to have high seasonal variability and high variability within a given distribution system,4−9 our results indicate that this also translates to highly variable CAT. The interquartile range to median ratios (IQR/M) within each distribution system ranged from 6 to 168% and seasonal ratios ranged from 34 to 567%. This revealed that seasonal variability was greater than intradistribution system variability. While regulatory compliance is currently based on annual or quarterly monitoring, future work using the CAT approach and more extensive DBP temporal data may help elucidate if this limited sampling schedule provides an adequate snapshot of household DBP-associated risk.
Studies implementing the CAT approach have identified unregulated DBPs, particularly HANs, as drivers of toxicity in disinfected waters.22,32−36 A recent study investigated 70 DBPs and identified HANs, particularly dihaloacetonitriles, and IAA as drivers of cytotoxicity in water utilities across the United States.30 While these studies assessed DBPs at the water utility or treatment level, our results support the role of haloacetronitriles, particularly DBAN, and IAA as drivers of toxicity in drinking water at the household level. HANs and IAA alone accounted for ∼87% of CHO cytotoxicity CAT and ∼99% of AREc32 oxidative stress CAT across all samples. While we did not analyze haloacetamides or haloacetaldehydes in this study, it should be noted that the inclusion of these equally potent compounds could affect the precent contributions of HANs and IAA.26 Nonetheless, we support the prioritization of HANs and IAA for future research and consideration for regulation.30 The addition of dihaloacetonitriles and iodoacetic acids to pre-existing EPA methods would be inexpensive and relatively simple to implement, yet would provide valuable data that could be used for future epidemiological studies.30
Our results also support findings that unregulated concentrations, particularly HANs, are not proportional to regulated concentrations.31 Additionally, we show that unregulated CAT is also not proportional to regulated CAT across all samples and system variables (i.e., season, region, disinfection type, and source water type) where 67% of all models were considered poor (r2 < 0.3). Overall, current regulatory methods may not be accurately capturing household DBP exposure due to high contribution of unregulated DBPs to CAT, high seasonal variability of CAT, and poor predictive models between regulated and unregulated DBPs.
Acknowledgments
Funding for this research was provided by the California Breast Cancer Research Program (CBCRP) under grant number 25UB-1204 and by the National Institute of Environmental Health Science of the National Institutes of Health under award numbers P42 ES004699 and P30 ES023513. The content is solely the responsibility of the authors and does not necessarily represent the official views of the funding agencies. The authors would also like to thank Christopher Alaimo, Luann Wong, Guillemette Calderwood, Matessa Martin, and Melissa Huang for their laboratory assistance.
Supporting Information Available
The Supporting Information is available free of charge at https://pubs.acs.org/doi/10.1021/acsestwater.4c00392.
DBP target compounds; overview of studied public water systems; methodological limitations; analytical methods, instrumentation, and method quality controls; and regulated versus unregulated DBPs predictive models (PDF)
Author Present Address
† California Water Science Center, US Geological Survey, Sacramento, California, United States (G.P.B.)
The authors declare no competing financial interest.
Supplementary Material
References
- National Research Council . Drinking Water and Health: Vol. 2; National Academies Press: Washington, D.C., 1980; 1904. (accessed 2021–08–11). [Google Scholar]
- USEPA . Fact Sheet: Stage 2 Disinfectants and Disinfection Byproducts Rule, 2005. https://nepis.epa.gov/Exe/ZyPDF.cgi?Dockey=2000E99D.txt.
- Baribeau H.Formation and Decay of Disinfection By-Products in the Distribution System; AwwA Research Foundation, 2006. [Google Scholar]
- Guilherme S.; Rodriguez M. J. Short-Term Spatial and Temporal Variability of Disinfection by-Product Occurrence in Small Drinking Water Systems. Sci. Total Environ. 2015, 518, 280–289. 10.1016/j.scitotenv.2015.02.069. [DOI] [PubMed] [Google Scholar]
- Guilherme S.; Rodriguez M. J. Occurrence of Regulated and Non-Regulated Disinfection by-Products in Small Drinking Water Systems. Chemosphere 2014, 117, 425–432. 10.1016/j.chemosphere.2014.08.002. [DOI] [PubMed] [Google Scholar]
- Shanks C. M.; Serodes J.-B.; Rodriguez M. J. Spatio-Temporal Variability of Non-Regulated Disinfection by-Products within a Drinking Water Distribution Network. Water Res. 2013, 47 (9), 3231–3243. 10.1016/j.watres.2013.03.033. [DOI] [PubMed] [Google Scholar]
- Wei J.; Ye B.; Wang W.; Yang L.; Tao J.; Hang Z. Spatial and Temporal Evaluations of Disinfection By-Products in Drinking Water Distribution Systems in Beijing. China. Sci. Total Environ. 2010, 408 (20), 4600–4606. 10.1016/j.scitotenv.2010.06.053. [DOI] [PubMed] [Google Scholar]
- Legay C.; Levallois P.; Aranda-Rodriguez R.; Dabeka L.; Hnatiw J.; Rodriguez M. J.. Variability of Non-Regulated Disinfection By-Products in Distribution Systems: Impact of the Storage Tank. In Recent Advances in Disinfection By-Products; ACS Symposium Series; American Chemical Society, 2015; 1190, 341–362. [Google Scholar]
- Evans A. M.; Wright J. M.; Meyer A.; Rivera-Núñez Z. Spatial Variation of Disinfection By-Product Concentrations: Exposure Assessment Implications. Water Res. 2013, 47 (16), 6130–6140. 10.1016/j.watres.2013.07.032. [DOI] [PubMed] [Google Scholar]
- Richardson S. D.Disinfection By-Products: Formation and Occurrence in Drinking Water★★This Article Has Been Reviewed in Accordance with the US EPA’s Peer and Administrative Review Policies and Approved for Publication. Mention of Trade Names or Commercial Products Does Not Constitute Endorsement or Recommendation for Use by the US EPA. In Encyclopedia of Environmental Health; Elsevier, 2011; 110–136. [Google Scholar]
- Melnick R. L.; Hooth M. J.. Carcinogenicity of Disinfection Byproducts in Laboratory Animals. In Encyclopedia of Environmental Health; Elsevier, 2011; 516–523. [Google Scholar]
- Plewa M. J.; Wagner E. D.; Richardson S. D. TIC-Tox: A Preliminary Discussion on Identifying the Forcing Agents of DBP-Mediated Toxicity of Disinfected Water. J. Environ. Sci. 2017, 58, 208–216. 10.1016/j.jes.2017.04.014. [DOI] [PubMed] [Google Scholar]
- Plewa M. J.; Wagner E. D.; Muellner M. G.; Hsu K.-M.; Richardson S. D.. Comparative Mammalian Cell Toxicity of N-DBPs and C-DBPs. In Disinfection By-Products in Drinking Water; ACS Symposium Series; American Chemical Society, 2008; 995, 36–50. [Google Scholar]
- Plewa M. J.; Wagner E. D.. Comparative Mammalian Cell Cytotoxicity and Genotoxicity. In Encyclopedia of Environmental Health; Elsevier, 2011; 806–812. [Google Scholar]
- Richardson S.; Plewa M.; Wagner E.; Schoeny R.; Demarini D. Occurrence, Genotoxicity, and Carcinogenicity of Regulated and Emerging Disinfection by-Products in Drinking Water: A Review and Roadmap for Research. Mutat. Res. Mutat. Res. 2007, 636 (1–3), 178–242. 10.1016/j.mrrev.2007.09.001. [DOI] [PubMed] [Google Scholar]
- Muellner M. G.; Wagner E. D.; McCalla K.; Richardson S. D.; Woo Y.-T.; Plewa M. J. Haloacetonitriles vs. Regulated Haloacetic Acids: Are Nitrogen-Containing DBPs More Toxic? Environ. Sci. Technol. 2007, 41 (2), 645–651. 10.1021/es0617441. [DOI] [PubMed] [Google Scholar]
- Dong H.; Qiang Z.; Richardson S. D. Formation of Iodinated Disinfection Byproducts (I-DBPs) in Drinking Water: Emerging Concerns and Current Issues. Acc. Chem. Res. 2019, 52 (4), 896–905. 10.1021/acs.accounts.8b00641. [DOI] [PubMed] [Google Scholar]
- Plewa M. J.; Muellner M. G.; Richardson S. D.; Fasano F.; Buettner K. M.; Woo Y.-T.; McKague A. B.; Wagner E. D. Occurrence, Synthesis, and Mammalian Cell Cytotoxicity and Genotoxicity of Haloacetamides: An Emerging Class of Nitrogenous Drinking Water Disinfection Byproducts. Environ. Sci. Technol. 2008, 42 (3), 955–961. 10.1021/es071754h. [DOI] [PubMed] [Google Scholar]
- Richardson S. D.; Fasano F.; Ellington J. J.; Crumley F. G.; Buettner K. M.; Evans J. J.; Blount B. C.; Silva L. K.; Waite T. J.; Luther G. W.; McKague A. B.; Miltner R. J.; Wagner E. D.; Plewa M. J. Occurrence and Mammalian Cell Toxicity of Iodinated Disinfection Byproducts in Drinking Water. Environ. Sci. Technol. 2008, 42 (22), 8330–8338. 10.1021/es801169k. [DOI] [PubMed] [Google Scholar]
- Neale P. A.; Escher B. I. In Vitro Bioassays to Assess Drinking Water Quality. Curr. Opin. Environ. Sci. Health 2019, 7, 1–7. 10.1016/j.coesh.2018.06.006. [DOI] [Google Scholar]
- Wagner E. D.; Plewa M. J. CHO Cell Cytotoxicity and Genotoxicity Analyses of Disinfection By-Products: An Updated Review. J. Environ. Sci. 2017, 58, 64–76. 10.1016/j.jes.2017.04.021. [DOI] [PubMed] [Google Scholar]
- Lau S. S.; Wei X.; Bokenkamp K.; Wagner E. D.; Plewa M. J.; Mitch W. A. Assessing Additivity of Cytotoxicity Associated with Disinfection Byproducts in Potable Reuse and Conventional Drinking Waters. Environ. Sci. Technol. 2020, 54 (9), 5729–5736. 10.1021/acs.est.0c00958. [DOI] [PubMed] [Google Scholar]
- Lau S. S.; Tang T.; Odeh L.; Bokenkamp K.; Wagner E. D.; Plewa M. J.; Mitch W. A. Is Genotoxicity Associated with Disinfection Byproducts in Potable Reuse and Conventional Drinking Water Additive?. Environ. Sci. Technol. Lett. 2023, 10 (11), 1075–1081. 10.1021/acs.estlett.3c00655. [DOI] [Google Scholar]
- Stalter D.; O’Malley E.; von Gunten U.; Escher B. I. Fingerprinting the Reactive Toxicity Pathways of 50 Drinking Water Disinfection By-Products. Water Res. 2016, 91, 19–30. 10.1016/j.watres.2015.12.047. [DOI] [PubMed] [Google Scholar]
- Stalter D.; O’Malley E.; von Gunten U.; Escher B. I. Mixture Effects of Drinking Water Disinfection By-Products: Implications for Risk Assessment. Environ. Sci. Water Res. Technol. 2020, 6 (9), 2341–2351. 10.1039/C9EW00988D. [DOI] [Google Scholar]
- McKenna E.; Thompson K. A.; Taylor-Edmonds L.; McCurry D. L.; Hanigan D. Summation of Disinfection By-Product CHO Cell Relative Toxicity Indices: Sampling Bias, Uncertainty, and a Path Forward. Environ. Sci. Process. Impacts 2020, 22 (3), 708–718. 10.1039/C9EM00468H. [DOI] [PubMed] [Google Scholar]
- USEPA . Determination of Haloacetic Acids and Dalapon in Drinking Water by Liquid-Liquid Microextraction, Derivatization, and Gas Chromatography with Electron Capture Detection, 2003. https://nepis.epa.gov/Exe/ZyPDF.cgi/901V0400.PDF?Dockey=901V0400.PDF.
- Wei X.; Yang M.; Zhu Q.; Wagner E. D.; Plewa M. J. Comparative Quantitative Toxicology and QSAR Modeling of the Haloacetonitriles: Forcing Agents of Water Disinfection Byproduct Toxicity. Environ. Sci. Technol. 2020, 54 (14), 8909–8918. 10.1021/acs.est.0c02035. [DOI] [PubMed] [Google Scholar]
- Krasner S. W.; Weinberg H. S.; Richardson S. D.; Pastor S. J.; Chinn R.; Sclimenti M. J.; Onstad G. D.; Thruston A. D. Occurrence of a New Generation of Disinfection Byproducts. Environ. Sci. Technol. 2006, 40 (23), 7175–7185. 10.1021/es060353j. [DOI] [PubMed] [Google Scholar]
- Allen J. M.; Plewa M. J.; Wagner E. D.; Wei X.; Bokenkamp K.; Hur K.; Jia A.; Liberatore H. K.; Lee C.-F. T.; Shirkhani R.; Krasner S. W.; Richardson S. D. Drivers of Disinfection Byproduct Cytotoxicity in U.S. Drinking Water: Should Other DBPs Be Considered for Regulation?. Environ. Sci. Technol. 2022, 56 (1), 392–402. 10.1021/acs.est.1c07998. [DOI] [PubMed] [Google Scholar]
- Furst K. E.; Bolorinos J.; Mitch W. A. Use of Trihalomethanes as a Surrogate for Haloacetonitrile Exposure Introduces Misclassification Bias. Water Res. X 2021, 11, 100089 10.1016/j.wroa.2021.100089. [DOI] [PMC free article] [PubMed] [Google Scholar]
- Szczuka A.; Parker K. M.; Harvey C.; Hayes E.; Vengosh A.; Mitch W. A. Regulated and Unregulated Halogenated Disinfection Byproduct Formation from Chlorination of Saline Groundwater. Water Res. 2017, 122, 633–644. 10.1016/j.watres.2017.06.028. [DOI] [PubMed] [Google Scholar]
- Zeng T.; Plewa M. J.; Mitch W. A. N-Nitrosamines and Halogenated Disinfection Byproducts in U.S. Full Advanced Treatment Trains for Potable Reuse. Water Res. 2016, 101, 176–186. 10.1016/j.watres.2016.03.062. [DOI] [PubMed] [Google Scholar]
- Chuang Y.-H.; Szczuka A.; Mitch W. A. Comparison of Toxicity-Weighted Disinfection Byproduct Concentrations in Potable Reuse Waters and Conventional Drinking Waters as a New Approach to Assessing the Quality of Advanced Treatment Train Waters. Environ. Sci. Technol. 2019, 53 (7), 3729–3738. 10.1021/acs.est.8b06711. [DOI] [PubMed] [Google Scholar]
- Lau S. S.; Feng Y.; Gu A. Z.; Russell C.; Pope G.; Mitch W. A. Cytotoxicity Comparison between Drinking Water Treated by Chlorination with Postchloramination versus Granular Activated Carbon (GAC) with Postchlorination. Environ. Sci. Technol. 2023, 57 (36), 13699–13709. 10.1021/acs.est.3c03591. [DOI] [PMC free article] [PubMed] [Google Scholar]
- Cuthbertson A. A.; Kimura S. Y.; Liberatore H. K.; Summers R. S.; Knappe D. R. U.; Stanford B. D.; Maness J. C.; Mulhern R. E.; Selbes M.; Richardson S. D. Does Granular Activated Carbon with Chlorination Produce Safer Drinking Water? From Disinfection Byproducts and Total Organic Halogen to Calculated Toxicity. Environ. Sci. Technol. 2019, 53 (10), 5987–5999. 10.1021/acs.est.9b00023. [DOI] [PubMed] [Google Scholar]
Associated Data
This section collects any data citations, data availability statements, or supplementary materials included in this article.


