

Abstract
JADE is a core subunit of the HBO1 acetyltransferase complex that regulates developmental and epigenetic programs and promotes gene transcription. Here we describe the mechanism by which JADE facilitates recruitment of the HBO1 complex to chromatin and mediates its enzymatic activity. Structural, genomic and complex assembly in vivo studies show that the PZP (PHD1–zinc-knuckle–PHD2) domain of JADE engages the nucleosome through binding to histone H3 and DNA and is necessary for the association with chromatin targets. Recognition of unmethylated H3K4 by PZP directs enzymatic activity of the complex toward histone H4 acetylation, whereas H3K4 hypermethylation alters histone substrate selectivity. We demonstrate that PZP contributes to leukemogenesis, augmenting transforming activity of the NUP98–JADE2 fusion. Our findings highlight biological consequences and the impact of the intact JADE subunit on genomic recruitment, enzymatic function and pathological activity of the HBO1 complex.
Histone acetylation commonly promotes chromatin decondensation, enabling DNA accessibility for transcription, replication and repair programs1–4. GCN5, CBP/p300 and MYST are the three families of lysine acetyltransferase (KAT) enzymes responsible for acetylation of the bulk of human histones. Among protein complexes harboring the MYST family of enzymes, HBO1 (histone acetyltransferase (HAT) binding to ORC1) is the least characterized, despite being evolutionarily conserved and known to be dysregulated in diseases. Amplifications, mutations and translocations involving HBO1 complex components are linked to prostate, bladder, breast and ovarian cancers and leukemia5–7, and high expression of HBO1 is associated with poor prognosis8. Knockout of the HBO1 catalytic subunit in mice leads to severe defects in embryonic development9. The HBO1 complex plays an important role in cell proliferation and developmental programs, mediates transcription, DNA replication and chromosome remodeling, and is implicated in androgen receptor and NF-kB signaling and maintenance of the hematopoietic system10–13.
The substrate selectivity of the HBO1 complex depends on the key subunit that acts as a platform for the complex assembly and can be either JADE (gene for apoptosis and differentiation) or BRPF (bromodomain plant homeodomain (PHD) finger protein)14,15. The JADE subunit directs enzymatic activity of the HBO1 complex toward acetylation of histone H4, whereas BRPF directs this activity toward acetylation of lysine 14 of histone H3 (refs. 9,14,16). Other core components of the native HBO1 complex include the catalytic subunit that bears the same name, HBO1 (also known as KAT7), and cofactors ING4/5 (inhibitor of growth 4 or 5) and MEAF6 (MYST/Esa1-associated factor 6).
JADEs belong to a three-paralog family of proteins encoded by individual genes JADE1, JADE2 and JADE3. Initially, JADE1 was identified as a binding partner of von Hippel–Lindau (VHL) tumor suppressor, which is mutated in VHL syndrome, renal cell carcinoma and hemangioblastoma, and later found to be essential in a wide array of vital cellular processes, including epigenetic and transcriptional signaling and cell cycle regulation. JADE1 contains a central three zinc finger cluster, named a PZP domain, flanked by two subunit-binding regions that recruit HBO1, ING4/5 and MEAF6. The PZP domain of JADE1 (JADE1PZP) has been shown to possess a histone H3 binding ability12; however, the mechanism by which JADEs are recruited to chromatin and the impact of this recruitment on the assembly and function of the HBO1 complex remain unclear.
In this study, we report the molecular basis underlying chromatin targeting of JADE-containing HBO1 complexes, define the structural organization of the PZP domain and elucidate its nucleosome-binding mechanism. Our findings shed light on the biological consequences and the impact of engagement of JADEs with chromatin on genomic recruitment, enzymatic function and pathological leukemogenic activity of these HBO1 complexes.
Results and discussion
All JADEs form HBO1 complexes
A relatively high amino acid sequence similarity between the three paralogs of JADE (62% identical residues in JADE1 and JADE2, and 59% identical residues in JADE1 and JADE3) suggests that they have similar domain architecture and function. While JADE1 has been shown to associate with other HBO1 complex subunits, the ability of JADE2 and JADE3 to form the complex remains unexplored. We expressed FLAG-tagged JADE1, JADE2 and JADE3 individually in HEK293T cells and immunoprecipitated JADEs together with the associated proteins using anti-FLAG antibodies (Fig. 1b and Supplementary Fig. 1). Western blot analysis then revealed that all JADE paralogs coprecipitate with HBO1, ING5 and MEAF6 subunits, forming HBO1 complexes of comparable stoichiometry. MLL1 (mixed lineage leukemia 1)—a methyltransferase that methylates lysine 4 of histone H3—also associated with each of these HBO1 complexes on chromatin, underscoring a conserved crosstalk between the HBO1 complex harboring either JADE paralog and the MLL1 complex5,7.
Fig. 1 |. All JADEs form HBO1 complexes.
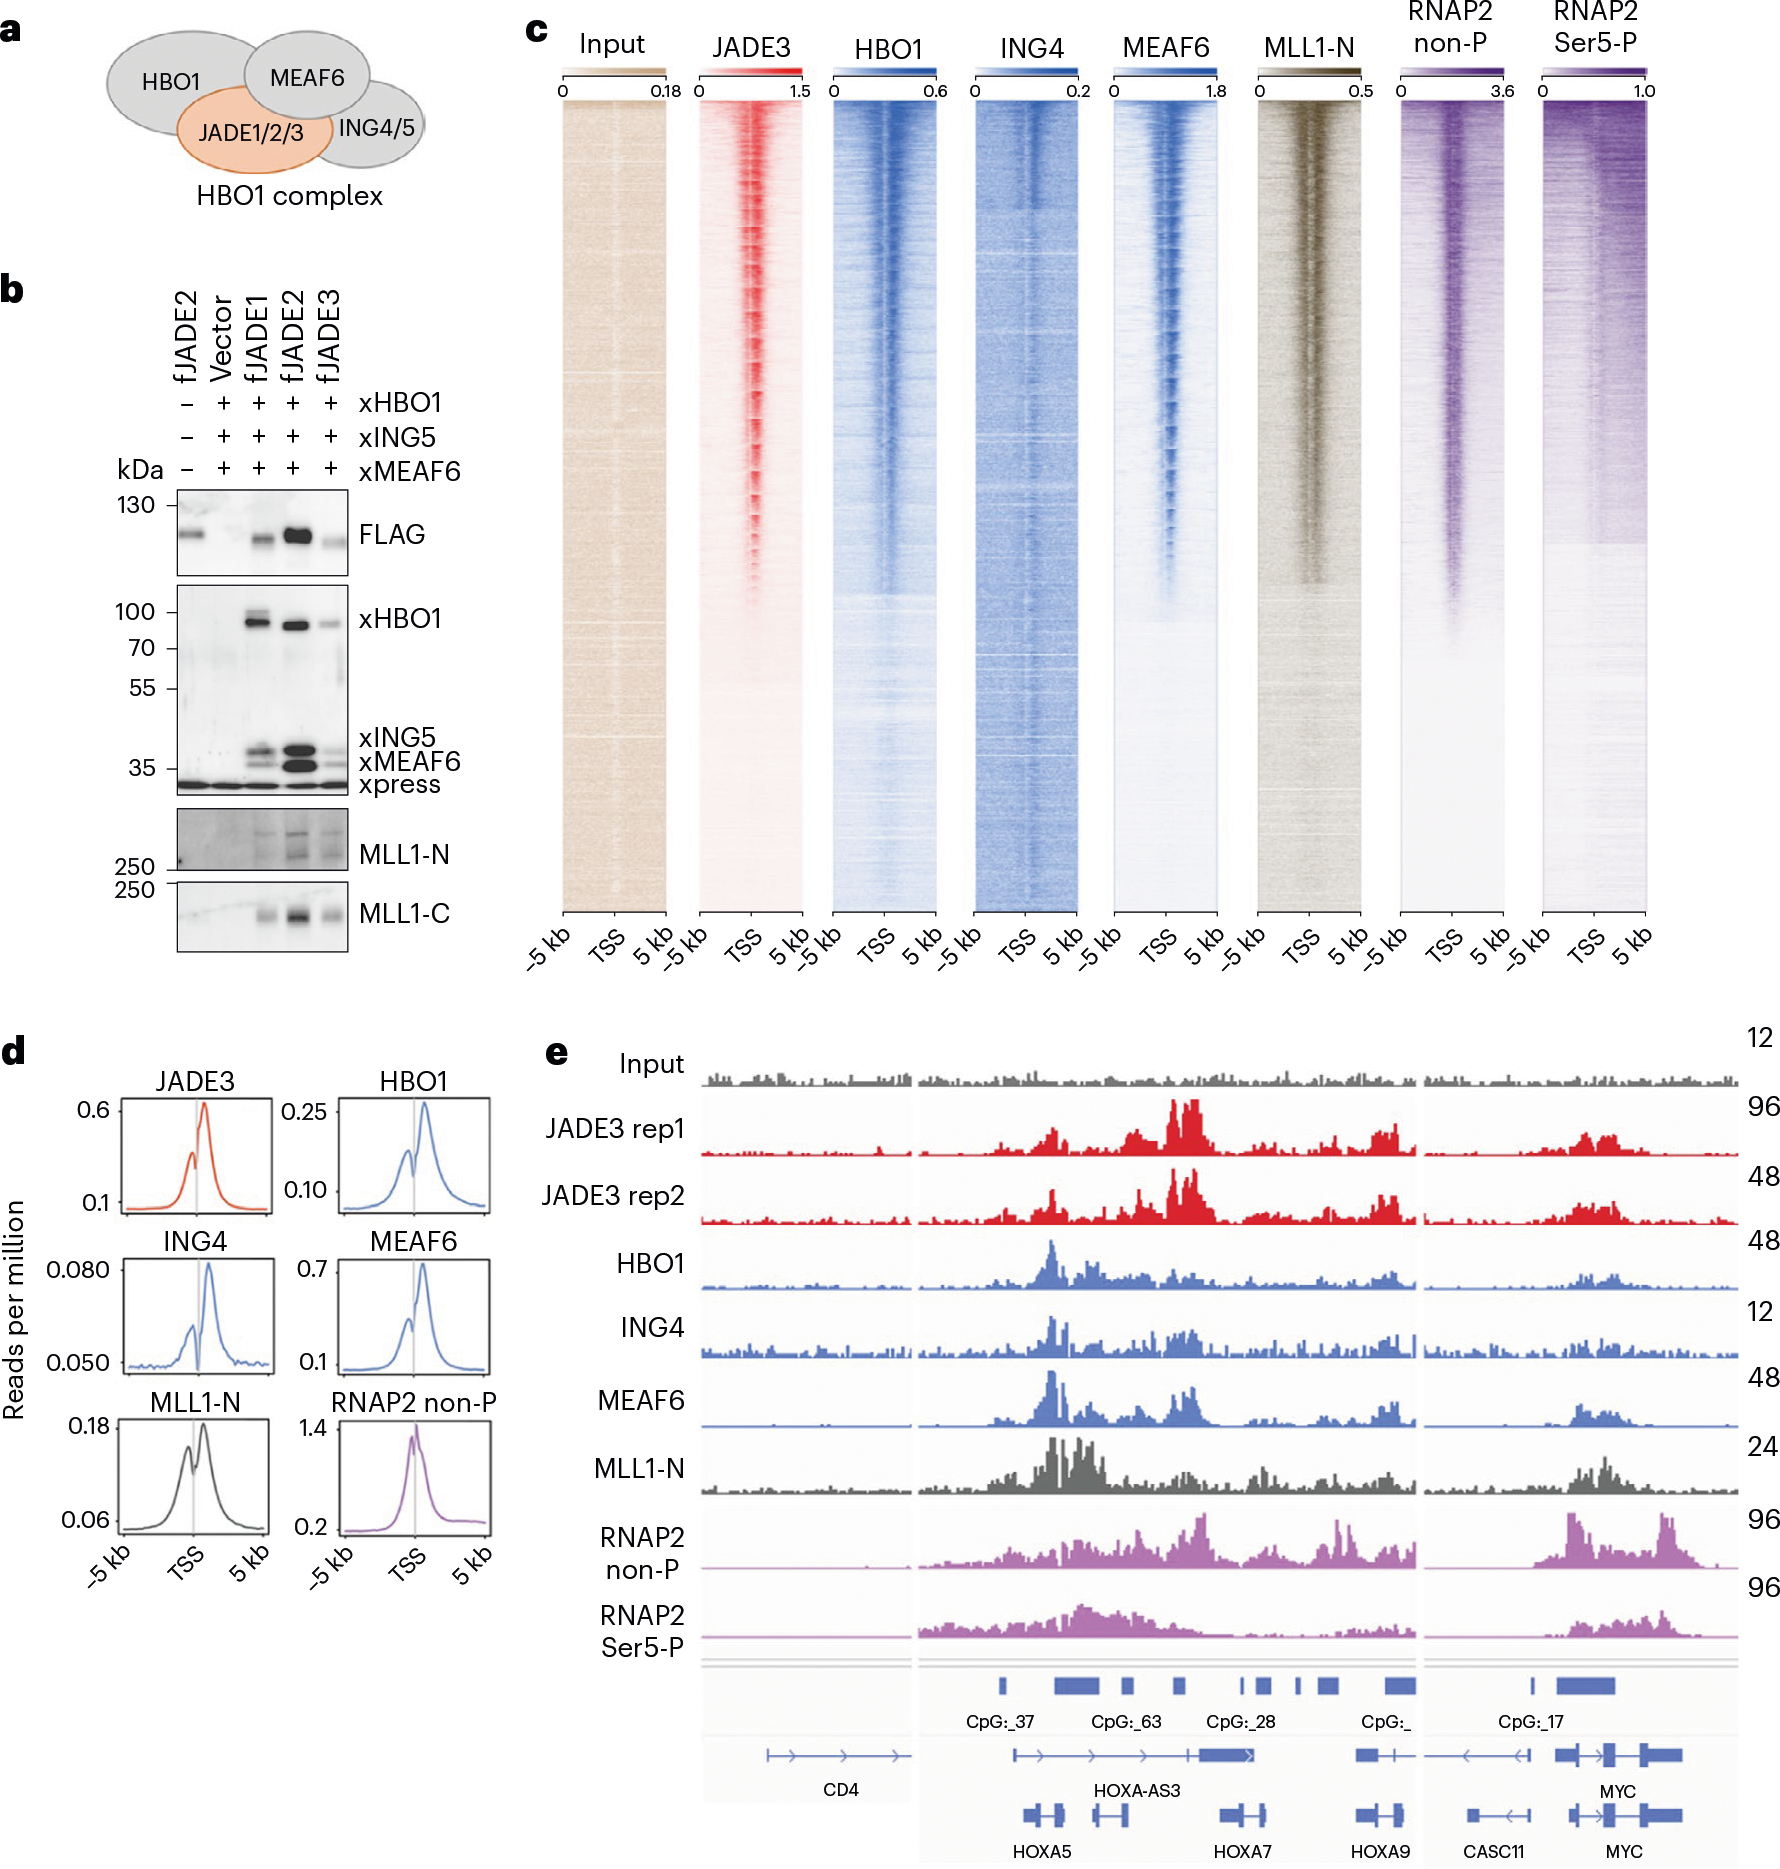
a, Cartoon of HBO1 complex subunits. b, HEK293T cells transiently expressing FLAG-tagged JADE1, JADE2 or JADE3 and Xpress-tagged HBO1, ING5 and MEAF6 were subjected to fanChIP analysis using anti-FLAG antibody. Exogenously expressed proteins and endogenous MLL1 were detected by the antibodies indicated (see Supplementary Fig. 1 for further results). c, Heatmaps of ChIP signal intensities of indicated proteins at the transcription start site (TSS) are shown using ngsplot. d, ChIP signal distribution of endogenous JADE3, HBO1, ING4, MEAF6, MLL1 and RNA polymerase II with nonphosphorylated CTD (RNAP2 non-P) or Ser5-phosphorylated CTD (RNAP2 Ser5-P) within 5 kb of the TSS is shown using ngsplot. e, Representative image of ChIP–seq data at the HOXA locus visualized using Integrative Genomics Viewer (Broad Institute).
Genomic colocalization of the HBO1 complex subunits and MLL1 in chromatin immunoprecipitation (ChIP) followed by deep sequencing (ChIP–seq) assays corroborated the functional link of these complexes7. All HBO1 complex subunits, including HBO1, JADE3, ING4 and MEAF6, together with MLL1, co-occupied promoter-proximal regions genome wide and of specific target genes (Fig. 1c–e and Supplementary Fig. 1c). The HBO1-bound genes were transcriptionally active, as the RNA polymerase II proteins with nonphosphorylated C-terminal domain (CTD) (RNAP2 non-P) or Ser5-phorphorylated CTD (RNAP2 Ser5-P) were detected at the same loci. These results indicated that the JADE proteins form HBO1 complexes and associate with the MLL1 complex at transcriptionally active promoter-proximal regions.
JADE1 recruits HBO1 to the nucleosome
We have previously shown that a single PHD finger of ING4/5 recognizes H3K4me3 (refs. 17–19); however, a low micromolar binding affinity suggests that this interaction may be insufficient to recruit the HBO1 complex to chromatin and stimulate histone acetylation. To identify additional contacts with chromatin, we compared functions of the native HBO1 complexes containing either full-length JADE1 (full-length isoform) or the shorter splice variant, JADE1S, which lacks the C-terminal region and therefore is incapable of binding to ING4/5 and MEAF6 (Fig. 2a). JADE1- and JADE1S-containing HBO1 complexes were purified from K562 cells using tandem affinity steps (3Flag-2Strep) after stable expression from the AAVS1 safe harbor locus and analyzed by gel electrophoresis and western blotting (Fig. 2b,c). While JADE1 formed the common tetrameric complex with HBO1, ING4/5 and MEAF6, JADE1S associated only with the HBO1 subunit.
Fig. 2 |. JADE1 recruits HBO1 to the nucleosome.
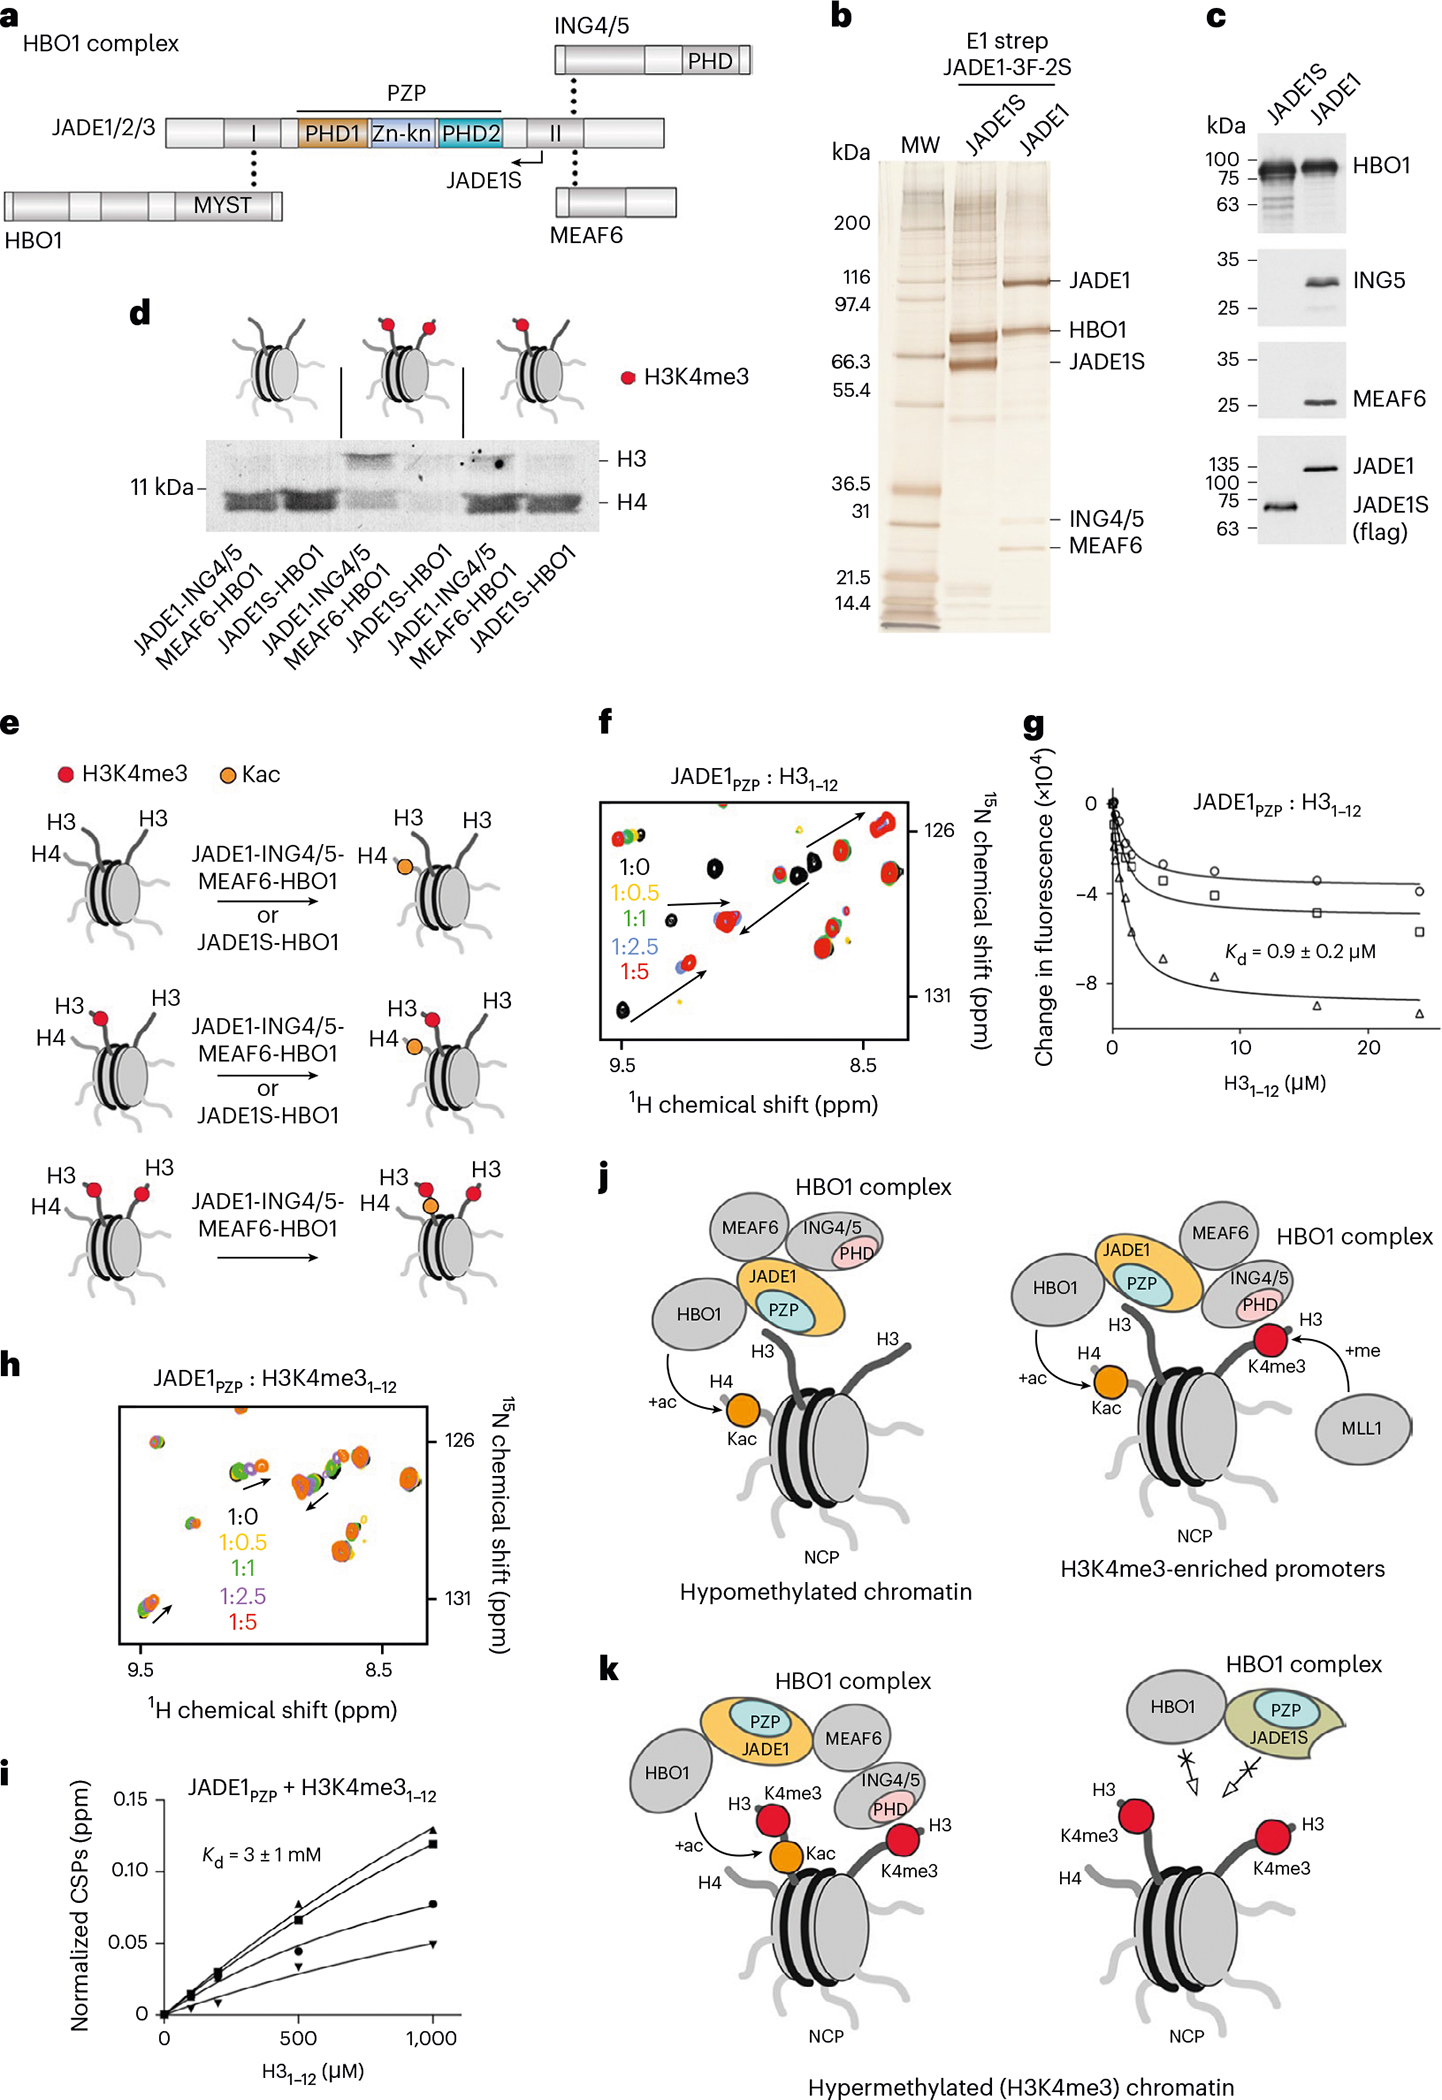
a, Schematic of HBO1 complex subunits with dot lines indicating contacts between subunits. The catalytic MYST domain and histone-binding zinc finger domains are labeled. The naturally occurring splice variant JADE1S is indicated by an arrow. b, JADE1 and JADE1S proteins were stably expressed as 3Flag-2Strep tagged versions from the AAVS1 safe harbor locus in K562 cells and purified from soluble nuclear extracts by tandem affinity chromatography. Silver-stained SDS–PAGE of biotin-eluted fractions is shown with associated protein bands labeled. c, Western blot of the purified JADE1- and JADE1S-containing HBO1 complexes with proteins detected by indicated antibodies. d, HAT assays using the purified HBO1 complexes from b and c with recombinant NCPs unmodified, carrying one (asymmetric) or two (symmetric) H3K4me3 tails (red dots). e, Cartoon summarizing results in d. Kac, acetylated lysine. f, Overlay of 1H,15N HSQC spectra of JADE1PZP in the presence of increasing amounts of H31–12 peptide. Spectra are colored according to the protein:peptide molar ratio. g, Binding curves used to determine by tryptophan fluorescence. is represented as average ± s.d. from three independent experiments (n = 3). h, Overlay of 1H,15N HSQC spectra of JADE1PZP in the presence of increasing amounts of H3K4me31–12 peptide. Spectra are colored according to the protein:peptide molar ratio. i, Binding curves used to determine by NMR. values are represented as average ± s.d. from four signals. j,k, Models of the chromatin association mechanism and function of the JADE1–HBO1 complexes.
Purified native HBO1 complexes containing JADE1, ING4/5 and MEAF6 or only JADE1S were assessed in HAT assays using recombinant nucleosome core particles (NCPs) as substrates. NCPs with two H3K4me3 tails (symmetrically methylated), NCPs with one H3K4me3 tail and one unmodified H3 tail (asymmetrically methylated), and unmodified NCPs were reconstituted and tested (Fig. 2d and Supplementary Figs. 2 and 3a). Unexpectedly, both JADE1–ING4/5–MEAF6-containing and JADE1S-containing HBO1 complexes comparably acetylated H4 on unmodified and asymmetrically methylated NCPs. These data indicated that the JADE1 subunit is dominant in targeting of the catalytic HBO1 subunit to the histone H4 substrate, and that the presence of the H3K4me3-recognizing ING4/5 subunit does not significantly affect the enzymatic activity even on asymmetrically methylated NCPs.
In contrast, acetylation of H4 by JADE1–ING4/5–MEAF6-containing HBO1 complex was decreased on symmetrically methylated nucleosomes, and acetylation of H4 by JADE1S-containing HBO1 complex was inhibited (Fig. 2d,e and Supplementary Fig. 3a). A notable shift in substrate specificity from H4 acetylation toward H3 acetylation was observed for the JADE1–ING4/5–MEAF6-containing HBO1 complex, implying that such a change depends on the ING4/5 subunit that binds H3K4me3 (ref. 13). We found that the shift toward H3 acetylation is reproducible and was observed in HAT assays with the JADE1–ING4/5–MEAF6-containing HBO1 complex when a commercially available symmetrically methylated nucleosome or H3K4me3-rich yeast native chromatin (oligonucleosomes) were used as substrates (Supplementary Fig. 3b,c).
Overall, these data suggest that H3K4 methylation can fine-tune JADE1–HBO1-dependent acetylation, driving H4 acetylation at hypomethylated regions characterized by low and intermediate H3K4me3 levels but shifting selectivity toward H3 acetylation at hypermethylated regions. Analysis of ChIP with quantitative PCR (qPCR) (ChIP–qPCR) assays from HeLa cells stably expressing the JADE proteins or HEK293T cells transiently expressing all components of the HBO1 complexes confirmed that, in vivo, the JADE1–ING4/5–MEAF6–HBO1 complex acetylates H3 and H4 in the active/H3K4me3-enriched promoter of the HBO1–JADE1 target gene FOXP4 (ref. 13), whereas the HBO1–JADE1S complex is impaired in acetylation of either histone (Supplementary Fig. 4).
Because either JADE1- or JADE1S-containing HBO1 complexes acetylated unmodified and asymmetrically methylated NCPs to the same extent, and the intact PZP domain is present in both isoforms, we tested whether the dominant role in targeting of HBO1 to NCPs is attributed to this domain by nuclear magnetic resonance (NMR) and tryptophan fluorescence (Fig. 2f–i). Large chemical shift perturbations (CSPs) in 1H, 15N heteronuclear single quantum coherence (HSQC) spectra of 15N-labeled JADE1PZP were observed upon titration with H31–12 peptide (residues 1–12 of H3) (Fig. 2f). CSPs were in the slow-to-intermediate exchange regime on the NMR timescale, indicating formation of a tight JADE1PZP–H3 complex and, in support of this, a 0.9 μM binding affinity was measured by fluorescence (Fig. 2g). In contrast, titration of H3K4me3 peptide caused small CSPs, indicative of a very weak interaction of JADE1PZP with a dissociation constant of 3 mM (Fig. 2h,i). Together, these results indicate that recognition of unmethylated H3K4 by JADE1PZP drives the HBO1 acetyltransferase activity toward histone H4 (Fig. 2j). However, when JADE1PZP is incapable of binding to the fully H3K4-methylated nucleosome, the HBO1 complex changes substrate selectivity, acetylating histone H3, and this change is likely mediated by ING4/5-dependent recognition of H3K4me3. The inhibition of histone H3 binding activity of JADE1PZP through methylation of H3K4 and the absence of H3K4me3-recognizing ING4/5 subunit probably account for the inability of the JADE1S-containing HBO1 complex to acetylate symmetrically methylated NCP at all (Fig. 2k).
Molecular mechanism of histone recognition by JADE1PZP
To gain insight into the molecular basis of the interaction of JADE1PZP with histone H3, we generated a fusion construct consisting of residues 1–12 of H3 linked to residues 201–373 of JADE1 through a short GSGSS linker. The fusion H3–JADE1PZP protein was crystallized, and the structure of the complex was obtained and refined to a 2.4 Å resolution (Fig. 3 and Table 1). The electron density map was of excellent quality, allowing the entire polypeptide chain, including all residues of H3, PZP and the linker, to be traced. In the complex, JADE1PZP adopts a saddle-like globular fold comprised of five zinc-binding clusters (Fig. 3a). An extensive network of hydrogen bonds, formed between the H3 tail and the protein, stabilizes the complex (Fig. 3b). The A1–Q5 region of the H3 tail occupies an elongated groove of the first PHD finger (PHD1) of JADE1PZP, whereas T6–G12 residues are curved away from the protein surface. The NH3+ group of A1 of H3 is restrained by three hydrogen bonds with the backbone carbonyl groups of P241, E242 and G243 of the protein. The guanidino moiety of R2 is affixed by two hydrogen bonds, one with the side-chain carbonyl oxygen of N227 and another with the side-chain carboxyl group of D201. An additional hydrogen bond with the backbone amide of F222 constrains the backbone carbonyl of R2, whereas backbone amide and the side chain of R2 are engaged in electrostatic contacts with the carboxyl group of D224 of the protein. The side-chain ammonium moiety of K4 forms three hydrogen bonds with the backbone carbonyl groups of D201, V204 and P212, providing a molecular basis for selective recognition of unmethylated H3K4, and the backbone amide of K4 is hydrogen bonded to the backbone carbonyl group of M220. The structure of the H3–JADE1PZP complex superimposes well with the structure of JADE1PZP in the apo state (r.m.s. deviation of 0.4 Å), indicating that the binding of H3 induces only small changes in the JADE1PZP structure and that the H3-binding site is essentially preformed (Fig. 3c).
Fig. 3 |. Structural basis for the recognition of histone H3 by JADE1PZP.

a, Crystal structure of JADE1PZP in complex with H3 tail is shown as a ribbon diagram with PHD1, Zn-kn and PHD2 colored wheat, light blue and cyan, respectively. The A1–A7 region of H3 is shown as green sticks, and the R8–G12 region of H3 is omitted for clarity. Yellow dashed lines and gray spheres indicate hydrogen bonds and zinc ions, respectively. For comparative analysis of PHD and PZP, see refs. 24,25. b, Close-up view of the histone H3-binding site of JADE1PZP. c, Overlay of the crystal structures of the H3–JADE1PZP complex (colored as in a) and the apo state of JADE1PZP (gray).
Table 1 |.
Data collection and refinement statistics (related to Fig. 3)
| JADE1PZP | H3-JADE1PZP | |
|---|---|---|
| (PDB 8GDX) | (PDB 8GE0) | |
| Data collection | ||
| Space group | P213 | P41 21 2 |
| Cell dimensions | ||
| a, b, c (Å) | 81.44, 81.44, 81.44 | 78.2, 78.2, 222.9 |
| α, β, γ (°) | 90, 90, 90 | 90, 90, 90 |
| Resolution (Å) | 2.74 (2.79–2.74)a | 2.4 (2.49–2.40)a |
| Rpim, Rsym or Rmerge | 17.2 (59.9) | 2.8 (38.8) |
| I/σ(I) | 8.5 (2.2) | 28.2 (1.8) |
| Completeness (%) | 99.8 (100) | 99.9 (99.6) |
| Redundancy | 5.2 (5.0) | 39.8 (31.8) |
| Refinement | ||
| Resolution (Å) | 28.79–2.74 | 49.5–2.4 |
| No. reflections | 4,908 | 27,953 |
| Rwork/Rfree | 0.2198/0.2687 | 0.2069/0.2412 |
| No. atoms | 1,286 | 4,298 |
| Protein | 1,256 | 4,180 |
| Zn | 5 | 15 |
| Water | 13 | 103 |
| B-factors | 45.84 | 54.51 |
| Protein | 45.58 | 54.66 |
| Zn | 37.70 | 55.98 |
| Water | 45.17 | 48.56 |
| R.m.s. deviations | ||
| Bond lengths (Å) | 0.002 | 0.004 |
| Bond angles (°) | 0.425 | 0.678 |
| Ramachandran plot | ||
| Most favored (%) | 95.03 | 96.88 |
| Allowed (%) | 4.97 | 3.12 |
| Outliers (%) | 0.0 | 0.0 |
Values in parentheses are for highest-resolution shell.
Recent studies have shown that the PZP domain of AF10 is engaged with a long stretch of H3 tail through binding to the far N-terminal region as well as the middle part of the H3 tail, encompassing residues A21–K27 (refs. 20,21), whereas the PZP domain of BRPF1 does not interact with the middle part of H3 (ref. 22). To test whether JADE1PZP is capable of binding to the middle part of H3 in addition to its binding to the far N-terminal region of H3, we measured its binding affinity to a long H31–31 peptide (residues 1–31 of H3). Analysis of the fluorescence-derived binding curves for the JADE1PZP–H31–31 interaction required a two-site binding model, and the fitting yielded two values of 0.3 μM and 25 μM, suggesting a cooperative engagement21 with two regions of H31–31 (Fig. 4a). Furthermore, H31–31 induced considerable CSPs in NMR spectra of JADE1PZP, and the slow exchange regime indicated that this interaction is stronger than the interaction with H31–12 (Fig. 4b). Addition of H315–34 peptide (residues 15–34 of H3) to the JADE1PZP NMR sample caused a different pattern of CSPs (Fig. 4c), confirming that H31–12 and H315–34 are bound in separate binding sites of JADE1PZP (Fig. 4e,f), but H315–34 formed a weaker complex with JADE1PZP ( of 63 μM) (Fig. 4d,g).
Fig. 4 |. JADE1PZP associates with two regions of the H3 tail.
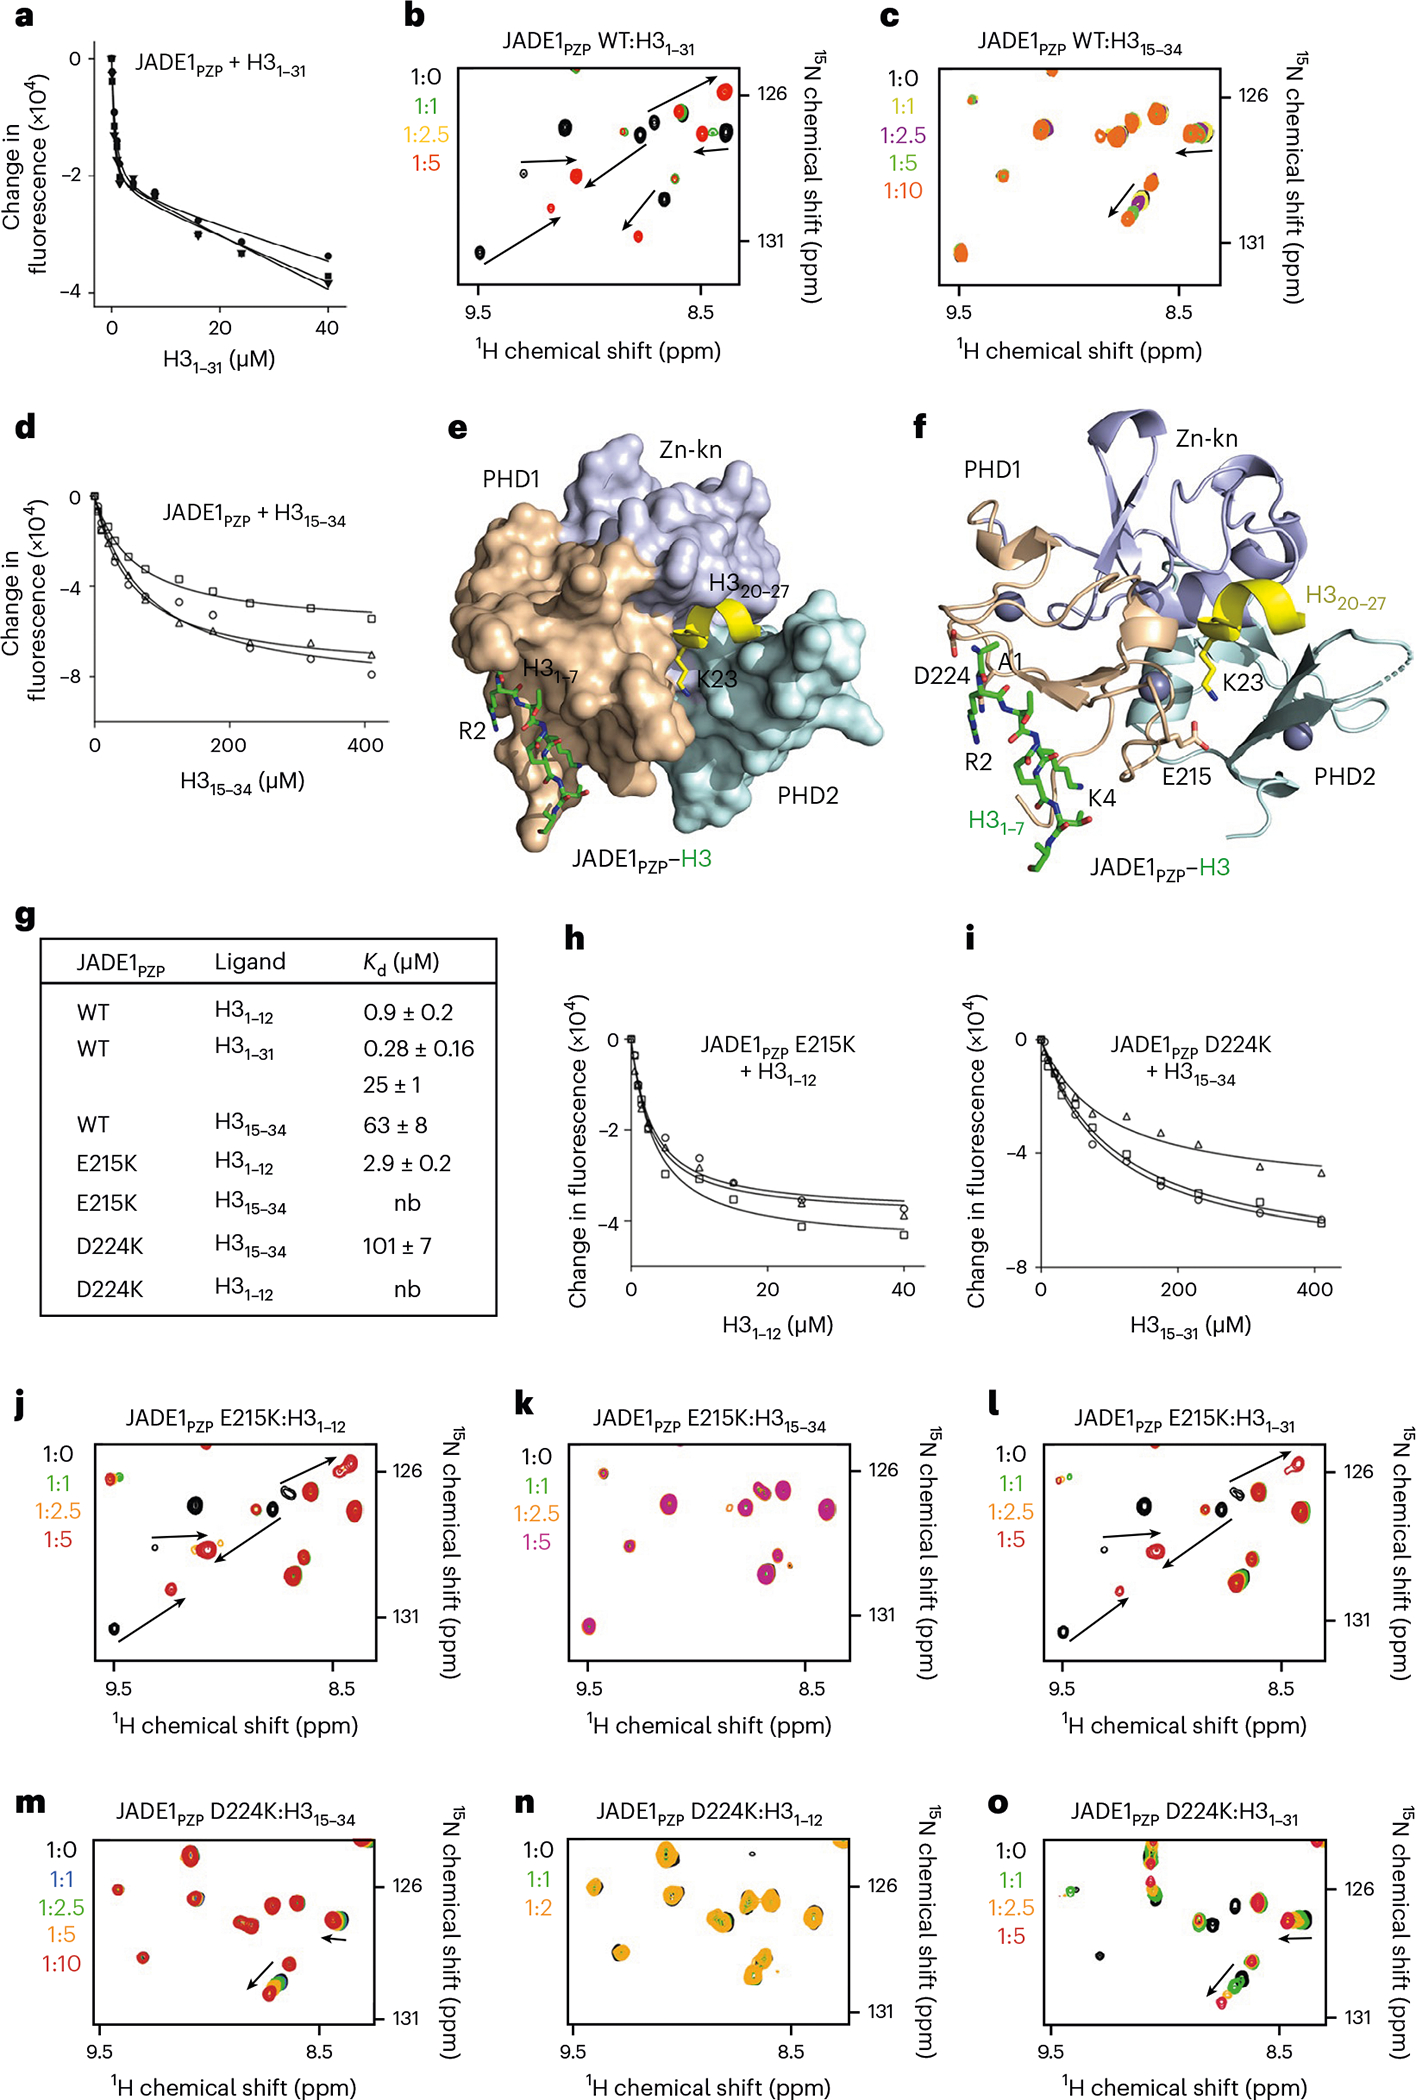
a, Binding affinity of JADE1PZP for the H31–31 peptide as measured by tryptophan fluorescence. is represented as average ± s.d. from three independent experiments (n = 3). b,c, Superimposed 1H,15N HSQC spectra of JADE1PZP collected in the presence of increasing amounts of the indicated H3 peptides. Spectra are color coded according to the protein:peptide molar ratio. d, Binding affinity of JADE1PZP for the H315–34 peptide as measured by tryptophan fluorescence. is represented as average ± s.d. from three independent experiments (n = 3). e,f, Overlay of the structures of the H31–7–JADE1PZP, colored as in Fig. 3, and AF10PZP–H321–27 (PDB 5DAH) complexes, depicted as surface (e) or ribbon (f) with AF10PZP not shown for clarity. The histone regions H31–7 and H321–27 are green and yellow, respectively. The D224 and E215 residues mutated in this study are labeled. g, Binding affinities of JADE1PZP for the indicated histone peptides as measured by tryptophan fluorescence. values are represented as average ± s.d. from three independent experiments (n = 3). nb, no binding. h,i, Binding curves used to determine values in g. j–o, Superimposed 1H,15N HSQC spectra of the JADE1PZP mutants collected upon titration with indicated H3 peptides. Spectra are color coded according to the protein:peptide molar ratio.
Structural analysis was subsequently used to design JADE1PZP mutants impaired in binding to either the A1–Q5 region of the H3 tail or the A21–K27 region of H3 (Fig. 4g–o). As shown in Fig. 4j–l, the E215K mutant of JADE1PZP lost its ability to bind to H315–34 but retained the ability to bind to H31–12 and H31–31 through the interaction with the far N-terminal region of H3. Binding affinity of the E215K mutant for the H31–12 peptide decreased threefold compared with the binding affinity of wild type (WT) JADE1PZP (Fig. 4g,h). Conversely, the D224K mutant of JADE1PZP was defective in binding to H31–12 but retained its ability to associate with H315–34 and H31–31 through interaction with the middle part of H3, although the binding was reduced twofold (Fig. 4g,i,m–o). These data indicate that disruption of either H3-binding site of JADE1PZP decreases but does not eliminate the interaction with H3.
Binding of JADE1PZP to DNA facilitates interaction with NCP
Two highly positively charged patches identified from the electrostatic surface potential of the JADE1PZP–H3 complex suggested a DNA-binding activity. One patch was formed by R272, K276 and K302 of the zinc knuckle (Zn-kn) and another was formed by K331, R334 and K367 of the second PHD finger (PHD2), and both patches were clustered on the side of JADE1PZP that is opposite to the binding site for H3 (Fig. 5a). To determine whether JADE1PZP is capable of binding to DNA, we tested its association with 147 base pair (bp) 601 Widom DNA (DNA147) in an electrophoretic mobility shift assay (EMSA). DNA147 was incubated with increasing amounts of JADE1PZP, and the reaction mixtures were resolved on a native polyacrylamide gel (Fig. 5b). A gradual increase in the amounts of added JADE1PZP caused a shift of the DNA147 band, pointing to direct interaction between JADE1PZP and DNA.
Fig. 5 |. JADE1PZP binds to nucleosomes in a bivalent manner.
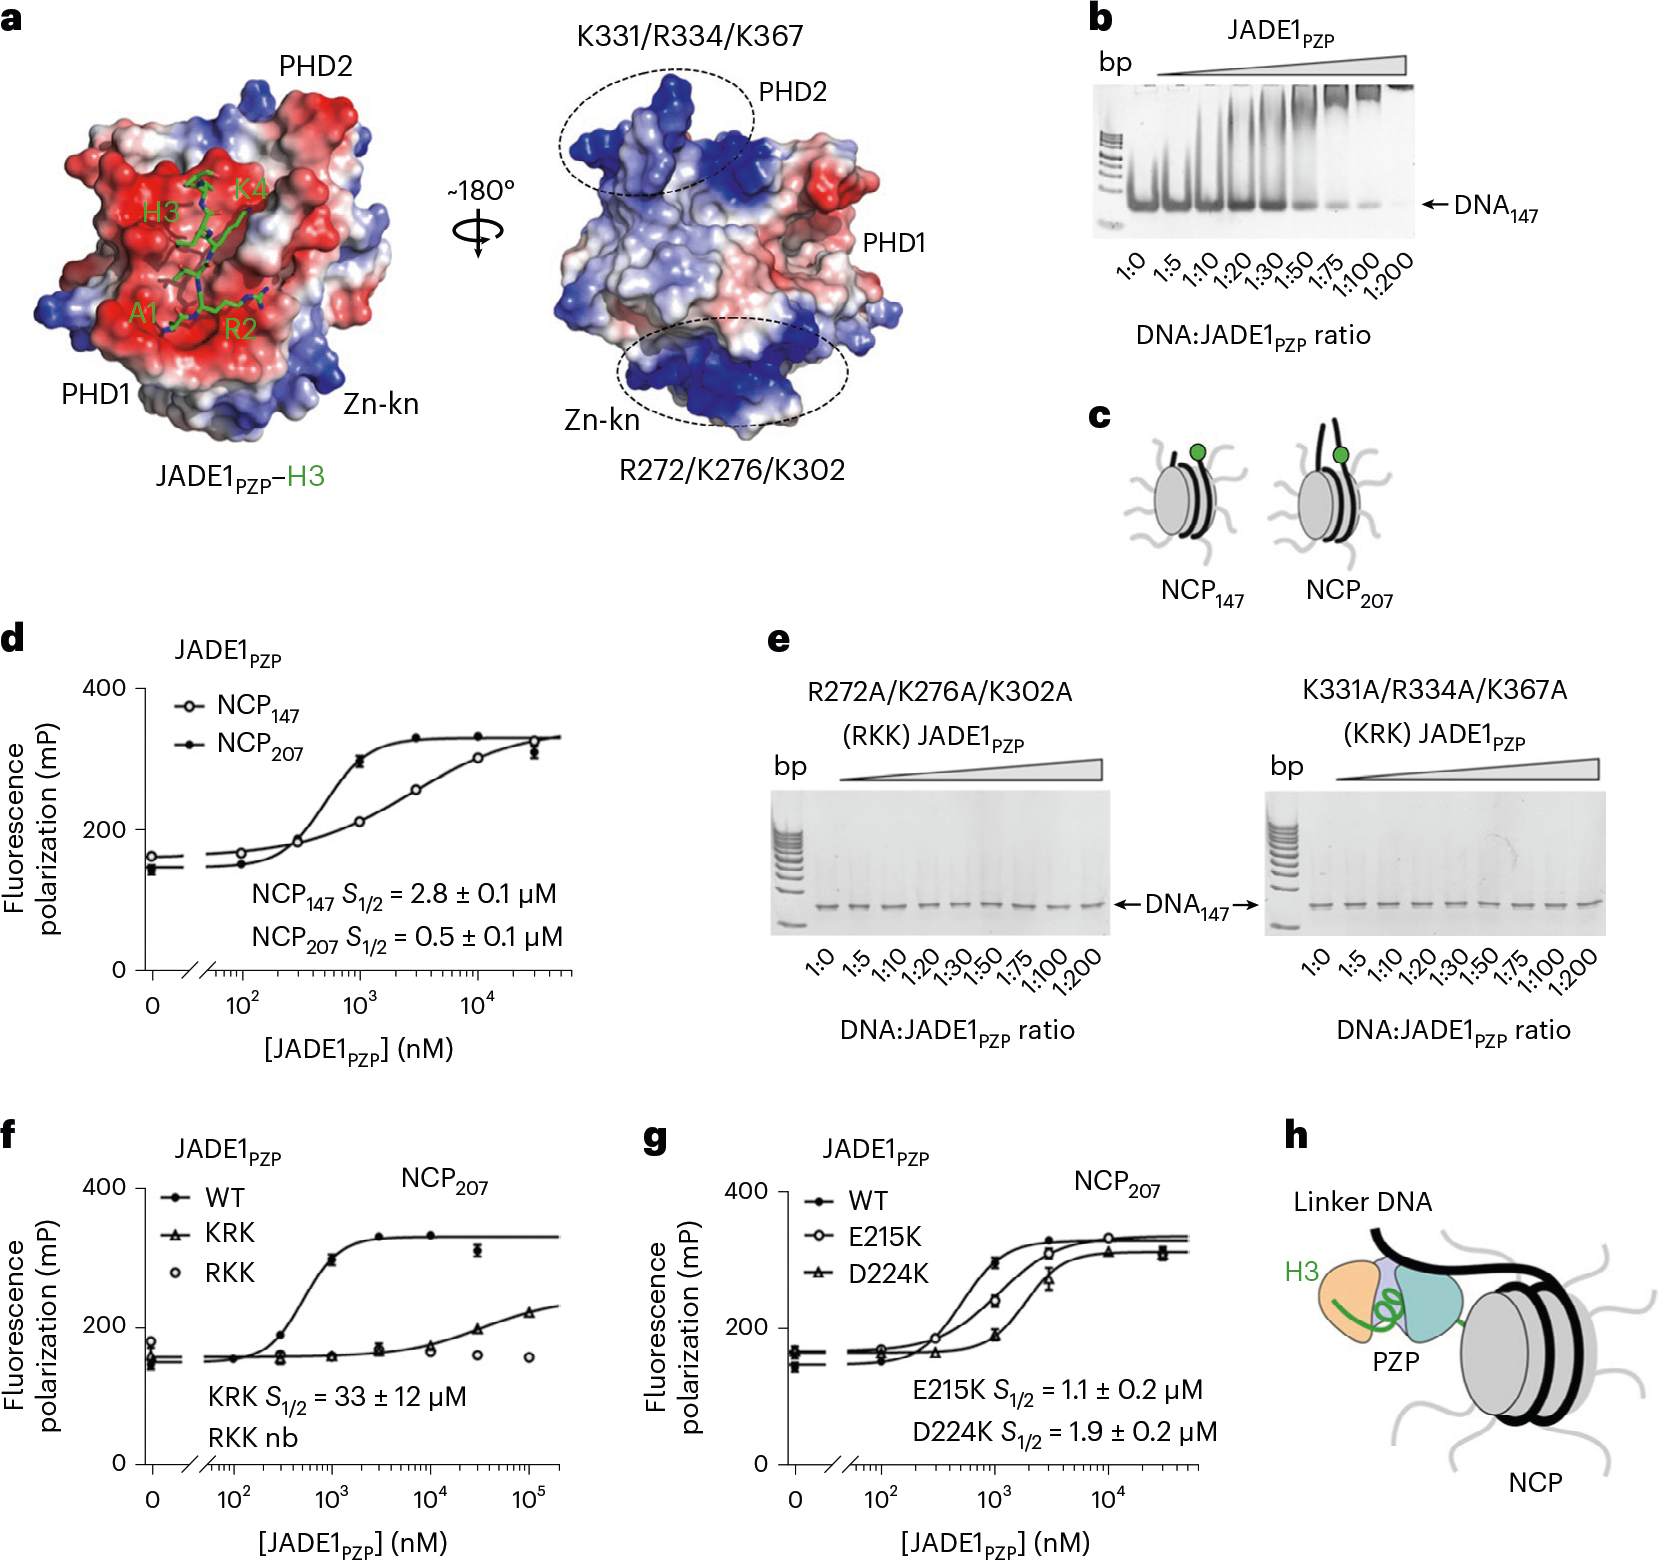
a, Electrostatic surface potential of H3–JADE1PZP with blue and red colors representing positive and negative charges, respectively. The H3 tail is shown as green sticks. Two positively charged regions of JADE1PZP are indicated by dotted ovals, with lysine and arginine residues labeled. b, EMSA of 147 bp 601 DNA in the presence of increasing amounts of JADE1PZP. DNA:protein ratio is shown below the gel image. c, Cartoon of fluorescein-labeled NCPs. d, Binding curves obtained for the interaction of JADE1PZP with indicated NCPs in fluorescence anisotropy assays. Data represent mean ± s.d. of three independent experiments (n = 3). e, EMSA of DNA147 in the presence of increasing amounts of the JADE1PZP mutants. DNA:protein ratio is shown below the gel image. f,g, Binding curves obtained for the interaction of the indicated WT and mutated JADE1PZP with NCP207 in fluorescence anisotropy assays. Data represent mean ± s.d. of three independent experiments (n = 3). h, A model of the bivalent interaction of JADE1PZP with histone H3 (green) of the nucleosome and the linker DNA. PHD1, Zn-kn and PHD2 are colored as in Fig. 3.
To characterize the chromatin binding mode in detail, we investigated the interaction of JADE1PZP with NCPs by fluorescence anisotropy and EMSA. We reconstituted NCPs using a 147 bp 601 DNA fluorescein-labeled on the 5′ end (for NCP147) and a 207 bp DNA in which 147 bp 601 DNA is flanked by 30 bp linker DNA on either side and internally labeled with fluorescein 27 bp in from the 5′ end (for NCP207) (Fig. 5c). Fluorescence anisotropy measurements revealed that JADE1PZP selects for the nucleosome with extranucleosomal linker DNA, as it forms a fourfold tighter complex with NCP207 than with NCP147 (S1/2 of 0.5 μM and 2.8 μM, respectively) (Fig. 5d).
We next tested whether the surface clusters of the positively charged residues of JADE1PZP are involved in binding to DNA. The R272A/K276A/K302A (RKK) and K331A/R334A/K367A (KRK) mutants of JADE1PZP were generated and assayed in EMSA. As shown in Fig. 5e, mutation of either patch residues abrogated binding of JADE1PZP to DNA147. Furthermore, the RKK mutant of JADE1PZP (mutations in Zn-kn) was impaired in binding to NCP207, and binding of the KRK mutant of JADE1PZP (mutations in PHD2) to NCP207 was decreased ~55-fold (Fig. 5f). The E215K and D224K mutations that reduce binding of JADE1PZP to H3 also decreased the association with NCP207 two- to fourfold (Fig. 5g).
Collectively, these data indicate that the two patches of positively charged surface residues in the Zn-kn and PHD2 of JADE1PZP are responsible for binding to DNA, and both H3- and DNA-binding functions are essential for the high-affinity interaction with the nucleosome and for enzymatic activity of the JADE1–ING4/5–MEAF6–HBO1 complex. Eliminating binding to the middle part of H3 and DNA by deleting PHD2 in JADE1 (JADE1ΔPHD2) substantially decreased the HAT activity of the complex in HeLa cells (Supplementary Fig. 4a). The bivalent interaction of JADE1PZP with a large portion of histone H3 and the linker DNA (Fig. 5h) can explain histone substrate selectivity of the HBO1 complex: binding to the almost entire H3 tail (unmethylated at K4) protects this tail from being acetylated; hence, the HBO1 complex acetylates predominantly H4. Methylation of H3K4 disrupts binding of JADE1PZP, removing this protection and making the H3 tail amenable to acetylation and binding of ING4/5. The preference of JADE1PZP for the linker DNA could also have a significant implication as it would stabilize the JADE1–HBO1 complex at regions with more accessible DNA.
JADE1PZP stabilizes the HBO1 complex at chromatin in vivo
HBO1 or ING5 transiently expressed in HEK293T cells localized primarily in the nucleus in immunofluorescence (IF) assays (Fig. 6a). In contrast, JADE1 itself was predominantly cytosolic but translocated to the nucleus when coexpressed with HBO1 and ING5, and colocalized with DNA, HBO1 and ING5, showing punctate IF signals. These results indicate that JADE1 does not have a nuclear import signal but, upon formation of the native complex in vivo, translocates to the nucleus and associates with chromatin. To test whether the PZP domain plays a role in this association, we performed fractionation of HEK293T cells transiently expressing JADE3 or its PZP-deletion mutant (JADE3ΔPZP), separating soluble, chromatin-bound and insoluble nuclear matrix-bound fractions. As shown in Fig. 6b, WT JADE3 was distributed between all three fractions, but JADE3ΔPZP lost its ability to bind chromatin and was found mainly in the soluble fraction. In agreement with IF and cell fractionation data, immunoprecipitation (IP)–western blot analysis of the chromatin fraction showed a stable formation of the HBO1 complex when JADE3 was coexpressed with HBO1, ING5 and MEAF6 (Fig. 6c and Supplementary Fig. 5a,b). However, the HBO1 complex containing JADE3ΔPZP was bound to chromatin to a lesser extent, underscoring the importance of the PZP domain for stabilization of the complex at chromatin. Comparable stoichiometry of the complex subunits and coexpressed MLL1 in either JADE3- or JADE3ΔPZP-containing HBO1 complex indicated that the interaction with MLL1 and the complex assembly are PZP-independent (Fig. 6d and Supplementary Fig. 5c).
Fig. 6 |. JADE1PZP facilitates HBO1 complex association with chromatin in vivo.
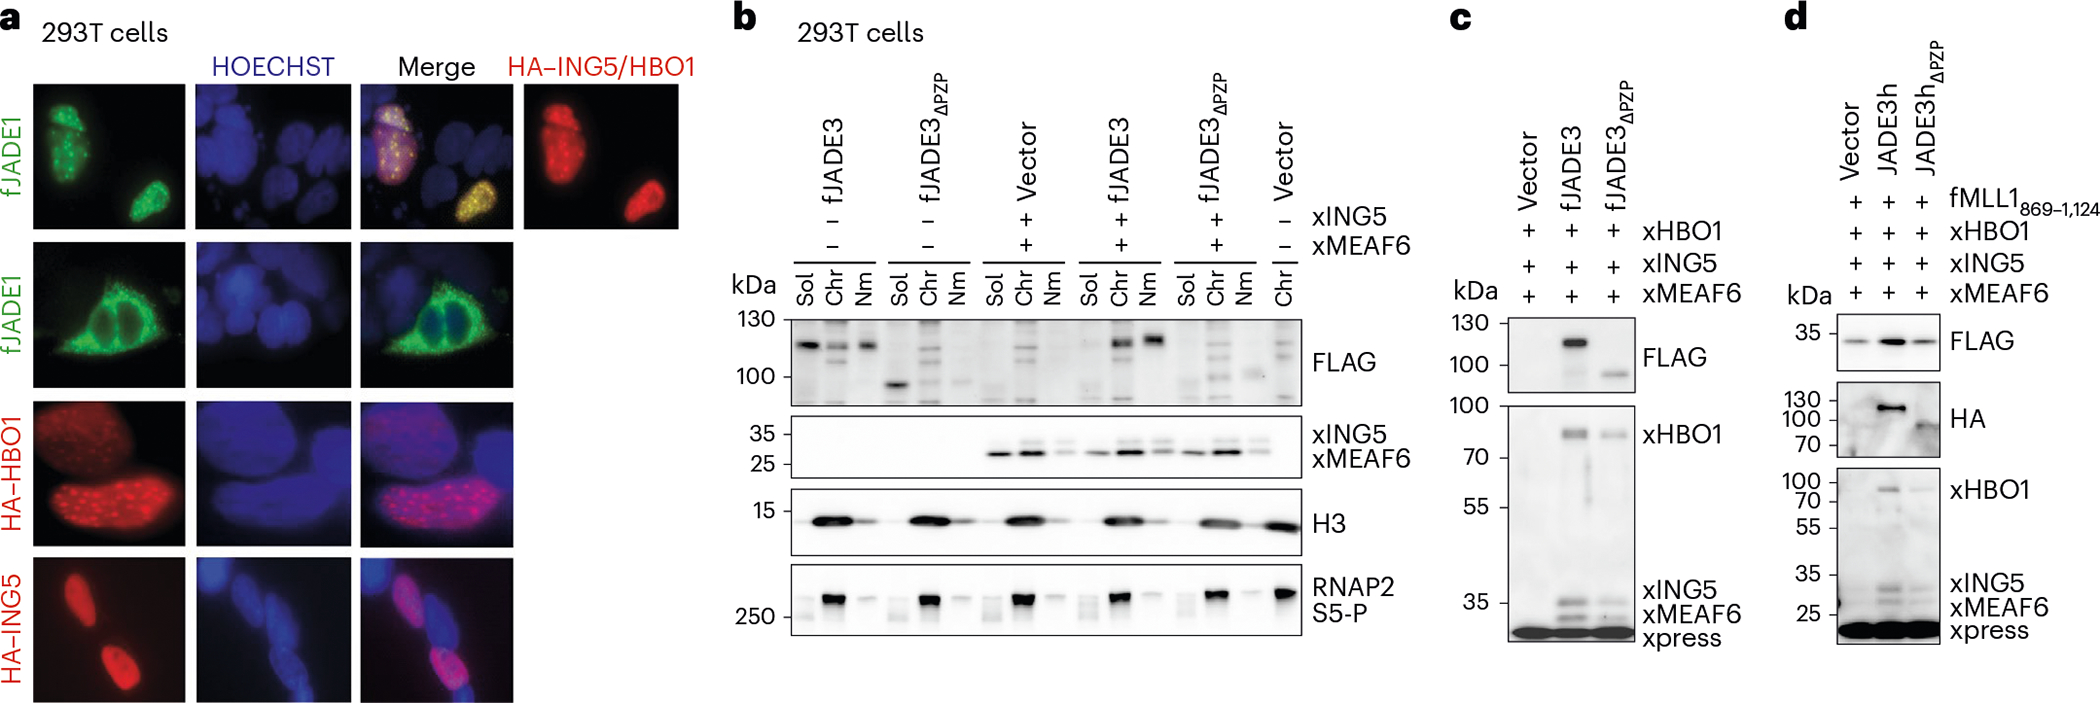
a, HEK293T cells transiently transfected with indicated HBO1 components were analyzed by IF. Magnification used in the images is ×60 except for HBO1, which is ×100. b, HEK293T cells transiently expressing the indicated transgene products were fractionated into three fractions: soluble (Sol), chromatin (Chr) and nuclear matrix (Nm). Proteins in subfractions were visualized using the antibodies indicated. c, HEK293T cells transiently expressing FLAG-tagged JADE3 proteins and Xpress-tagged HBO1, ING5 and MEAF6 were subjected to fanChIP analysis using anti-FLAG antibody. The coprecipitates were visualized using the antibodies indicated. d, HEK293T cells transiently expressing FLAG-tagged MLL1 fragment (amino acids 869–1,124), HA-tagged JADE3 proteins and Xpress-tagged HBO1, ING5 and MEAF6 were subjected to fanChIP analysis using anti-FLAG antibody. The coprecipitates were visualized using the antibodies indicated. See also Supplementary Fig. 5.
ChIP–seq analysis of occupancies of the JADE3- and JADE3ΔPZP-containing HBO1 complexes at the leukemia-related HoxA cluster showed that ChIP signal intensities of JADE3ΔPZP were substantially lower than the ChIP signal intensities of JADE3, corroborating the critical role of JADE3PZP in coupling the HBO1 complex to its target genes (Fig. 7a,b). This difference was even more prominent at the genes bound by JADE3 at relatively low levels in ChIP–seq (Fig. 7c) and was confirmed by ChIP–qPCR analysis of HOXA7, HOXA9 and MYC loci in HEK293T cells transiently expressing JADE proteins and other HBO1 complex components (Fig. 7d). Together, these data indicate that not only the intact JADE3PZP is necessary for the recruitment to, and/or stabilization of, the HBO1 complex at its target gene regions, including promoters, but also that these promoters, while containing H3K4me3, also contain unmethylated H3K4, as JADE3PZP does not bind to fully methylated nucleosomes, and thus the difference JADE3PZP versus JADE3ΔPZP would not be observed.
Fig. 7 |. JADE1PZP enhances the transforming activity of NUP98–JADE2 in vivo.
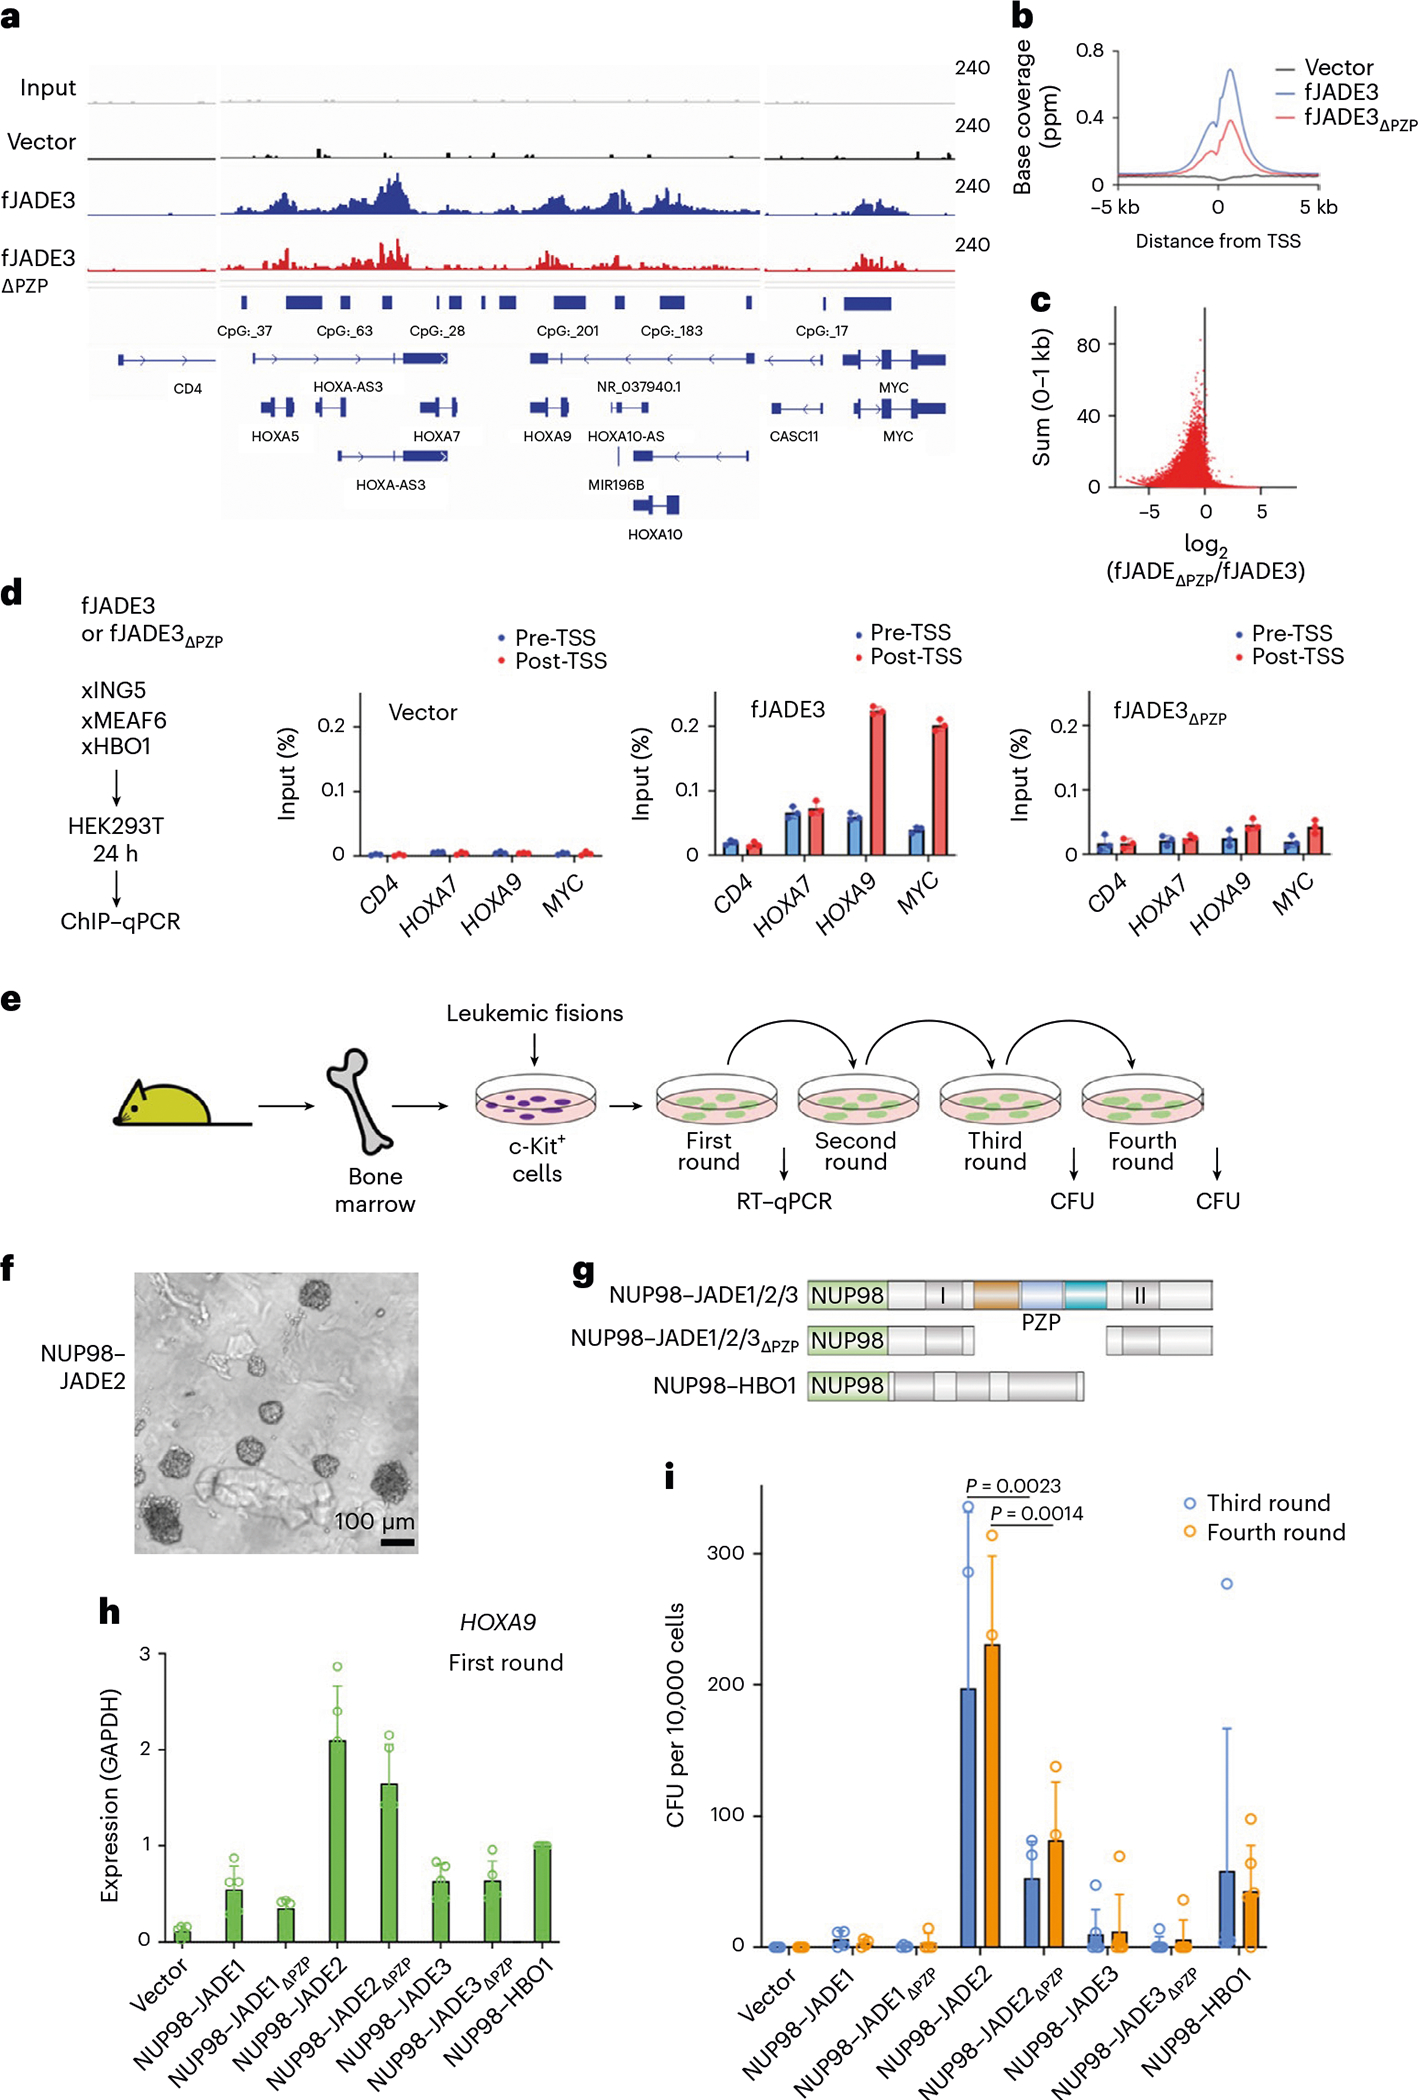
a, Representative image of the ChIP–seq data of JADE3 and its PZP-deletion mutant at the HOXA locus. FLAG-tagged JADE3 proteins were coexpressed with Xpress-tagged HBO1, ING5 and MEAF6 in HEK293T cells and subjected to fanChIP using anti-FLAG antibody. ChIP–seq data were visualized by Integrative Genomics Viewer (Broad Institute). b, Average distribution of JADE3 proteins near TSSs. ChIP signal distribution of FLAG-tagged JADE3 proteins within a 5 kb range of the TSS is shown using ngsplot. c, ChIP–seq tags of FLAG-tagged JADE3 proteins at all genes were clustered into a 1-kb bin (0 to +1 kb from the TSS), and the sum of the WT JADE3 ChIP signals and the ChIP signals of the JADE3 PZP-deletion mutant relative to the WT JADE3 are plotted on the y and x axes, respectively. d, Localization of FLAG-tagged JADE3 proteins 24 h after gene transduction. ChIP–qPCR of the chromatin samples, prepared as in a, was performed on two technical replicates of each genotype for the indicated gene loci using qPCR probes designed for the pre-TSS (−1 to −0.5 kb from TSS) and post-TSS (+1 to +1.5 kb from TSS) regions of each gene. ChIP signals are expressed as a percentage of the input with error bars (mean ± s.d. of three technical replicates). e, Diagram of myeloid progenitor transformation assays for NUP98–JADE fusions. CFU, colony-forming units. f, Representative image of the colonies. g, Schematic of the NUP98 fusion gene constructs. h, Hoxa9 expression in the first-round colonies. Hoxa9 expression normalized to Gapdh in first-round colonies is shown as the relative value of NUP98–HBO1 (arbitrarily set at 1) (mean ± s.d. of five biological replicates, n = 5). i, Leukemic transformation of hematopoietic progenitors by NUP98–JADE fusions. Colony-forming ability at the third- and fourth-round passages is shown with error bars (mean ± s.d. of five biological replicates, n > 4). Statistical analysis was performed using ordinary two-way ANOVA (two-sided, multiple comparison).
JADE2PZP enhances the transforming activity of NUP98–JADE2
The HBO1 complex mediates leukemia stem cell maintenance5, and oncogenic fusions of NUP98 and HBO1 or JADE2 have been reported in leukemia patients6,23. To assess the role of the PZP domain in leukemogenesis, we generated translocation chimeras in which NUP98 is fused with JADE1, JADE1ΔPZP, JADE2, JADE2ΔPZP, JADE3 and JADE3ΔPZP and tested them in NUP98-mediated leukemic transformation assays (Fig. 7e–i and Supplementary Fig. 6). Murine hematopoietic progenitor cells (HPCs) were retrovirally transduced with the fusion constructs and cultured ex vivo in a semisolid medium (Fig. 7f). Expression of NUP98-–JADE2 particularly led to the formation of a large number of colonies with an undifferentiated morphology accompanied by high level expression of HoxA9—a key target gene of NUP98 fusions relevant to leukemic transformation (Fig. 7f,h). Furthermore, undifferentiated colonies from NUP98–JADE2 transformed cells gave rise to colonies in the third and fourth replating experiments, pointing to the potent transforming ability of the NUP98–JADE2 fusion (Fig. 7i). Cells transduced with the NUP98–JADE2ΔPZP mutant also formed colonies in the third and fourth-round passages; however, the colony-forming ability of this mutant was substantially attenuated in comparison with that of NUP98–JADE2. We note that HoxA9 expression in NUP98–JADE1 and NUP98–JADE3 transduced cells was also higher compared with the vector control but lower than HoxA9 expression in NUP98–JADE2 transduced cells. Cells transduced with NUP98–JADE1 and NUP98–JADE3 fusions formed small numbers of colonies in the third and fourth-round passages, indicating that these fusions possess some transforming abilities but are weaker oncoproteins compared with NUP98–JADE2. Still, NUP98–JADE1ΔPZP and NUP98–JADE3ΔPZP transduced cells had no serial replating capacity. These results suggest that the PZP domain of JADEs contributes to leukemogenesis, augmenting the transforming activity of the oncogenic NUP98 fusions.
In conclusion, in this study we describe the critical role of the JADE subunit and its PZP domain in chromatin binding and histone substrate selectivity of the acetyltransferase HBO1/JADE complexes and their action at specific genomic loci in physiological and pathological conditions. We elucidate the molecular mechanism by which JADEPZP recognizes an almost entire unmethylated histone H3 tail and DNA and assess contributions of these binding events, demonstrating that both are required for tight interaction with the nucleosome. Our study suggests the intricate relationship between chromatin binding functions of the JADE and ING4/5 subunits within the HBO1 complex. We propose that JADEPZP provides a critical contact that facilitates genome scanning and stabilization of the JADE-containing HBO1 complexes at chromatin targets. The finding that JADEPZP augments leukemogenic activity of the NUP98–JADE2 translocation suggests that targeting of JADEPZP with small molecule inhibitors could be beneficial in alleviating malignant transformations driven by these oncogenic fusions.
Online content
Any methods, additional references, Nature Portfolio reporting summaries, source data, extended data, supplementary information, acknowledgements, peer review information; details of author contributions and competing interests; and statements of data and code availability are available at https://doi.org/10.1038/s41594-024-01245-2.
Methods
Cell lines
HEK293T cells were purchased from ATCC. Cells were cultured in Dulbecco’s modified Eagles medium (DMEM), supplemented with 10% fetal bovine serum (FBS) and penicillin–streptomycin (PS). The platinum-E (PLAT-E) ecotropic virus-packaging cell line, a gift from T. Kitamura, was cultured in DMEM supplemented with 10% FBS, puromycin, blasticidin and PS. Cells were cultured in an incubator at 37 °C and 5% CO2 and tested routinely for mycoplasma using a MycoAlert Mycoplasma Detection Kit (Lonza). Transduced HeLa S3 cell lines expressing similar levels of JADE1 or JADE1DPHD2 have been described13. For transient transfections, 2 × 10⁶ HEK293T cells were transfected with 8 μg of each expression plasmid (FLAG–JADE1/JADE1S, HA–HBO1/ING5/MEAF6 in pcDNA3)13 by the calcium phosphate method and used 48 h posttransfection. Cell authentication was performed using short tandem repeat analysis by the JCRB cell bank.
DNA cloning and protein purification
Human JADE1PZP (amino acids 201–373) was cloned into the into pDEST15 vector with a GST tag and a TEV cleavage site. All mutants of JADE1PZP were generated using the Stratagene QuickChange Lightning Site Directed Mutagenesis kit and their sequences were confirmed by DNA sequencing. The proteins were expressed in Escherichia coli Rosetta-2 (DE3) pLysS cells grown in minimal medium supplemented with 15NH4Cl (Sigma) or 14NH4Cl (for unlabeled proteins) and ZnCl2. Protein production was induced with 0.2–0.5 mM isopropylthiogalactoside for 18–20 h at 16 °C. Bacteria were harvested by centrifugation and lysed by sonication in buffer (50 mM Tris-HCl pH 7.5, 500 mM NaCl, 0.05% (v/v) Nonident P40, 5 mM dithiothreitol (DTT), 1 mM phenylmethylsulfonyl fluoride (PMSF) and DNase). GST-fusion proteins were purified on glutathione agarose 4B beads (Thermo Fisher Scientific). The GST tag was cleaved with tobacco etch virus (TEV) protease. Proteins were further purified by size exclusion chromatography (SEC) and concentrated in Millipore concentrators (Millipore).
Fractionation-assisted native ChIP
HEK293T cells were subjected to fanChIP26. Cells were suspended in CSK buffer (100 mM NaCl, 10 mM PIPES (pH 6.8), 3 mM MgCl2, 1 mM EGTA, 0.3 M sucrose, 0.5% Triton X-100, 5 mM sodium butyrate, 0.5 mM DTT and protease inhibitor cocktail) and centrifuged (400g for 5 min at 4 °C) to remove the soluble fraction. The pellet was resuspended in MNase buffer (50 mM Tris-HCl (pH 7.5), 4 mM MgCl2, 1 mM CaCl2, 0.3 M sucrose, 5 mM sodium butyrate, 0.5 mM DTT and protease inhibitor cocktail) and treated with MNase at 37 °C for 5 min to obtain oligonucleosomes. The MNase reaction was then stopped by adding EDTA (pH 8.0) to a final concentration of 20 mM. Equal amounts of lysis buffer (250 mM NaCl, 20 mM sodium phosphate (pH 7.0), 30 mM sodium pyrophosphate, 5 mM EDTA, 10 mM NaF, 0.1% NP-40, 10% glycerol, 1 mM DTT, and EDTA-free protease inhibitor cocktail) were added to increase solubility. The chromatin fraction was cleared by centrifugation (17,700g for 5 min at 4 °C) and subjected to immunoprecipitation with specific antibodies and protein-G magnetic microbeads (Invitrogen) or with anti-FLAG M2 antibody-conjugated beads (Supplementary Table 1). The immunoprecipitates were then washed five times with washing buffer (1:1 mixture of lysis buffer and MNase buffer with 20 mM EDTA) and eluted in elution buffer (1% SDS and 50 mM NaHCO3). The eluted material was analyzed by western blotting, qPCR and deep sequencing.
Western blotting
Proteins were separated electrophoretically on an SDS–PAGE gel and transferred to nitrocellulose sheets using a mini transblot cell (Bio-Rad). The nitrocellulose sheets were blocked with 5% skim milk in PBS-T (PBS containing 0.1% Tween 20) for 1 h, rinsed twice with PBS-T and incubated with the primary antibodies listed in Supplementary Table 1 in a 5% skim milk and PBS-T suspension overnight. The blots were then washed twice with PBS-T and incubated with the peroxidase-conjugated secondary antibodies listed in Supplementary Table 1 for 2 h in a suspension of 5% skim milk in PBS-T. Chemiluminescence was performed using an enhanced chemiluminescence reagent (GE Healthcare). The antibodies used in this study are listed in Supplementary Table 1. The uncropped scans of the blots are included in the Source Data file.
ChIP–seq and ChIP–qPCR
The material eluted by fanChIP was extracted using phenol/chloroform/isoamyl alcohol. DNA was precipitated with glycogen, dissolved in TE buffer and analyzed by qPCR (ChIP–qPCR) or deep sequencing (ChIP–seq). The qPCR probe/primer sequences are listed in Supplementary Table 2. For deep sequencing, the DNA was further fragmented (~150 bp) using a Covaris M220 DNA shearing system (M&M Instruments Inc.). Deep sequencing was then performed using a TruSeq ChIP Sample Prep Kit (Illumina). Data were visualized using Integrative Genomics Viewer (Broad Institute). Raw reads in FASTQ format were trimmed using Cutadapt and aligned to the reference genome hg19 using BWA27,28. Accession numbers and sample IDs are listed in Supplementary Table 3.
For ChIP–qPCR from HeLa and 293T cells, 200 μg of cross-linked chromatin was used for immunoprecipitation with appropriate antibodies (H4K8ac (Abcam), H3K9/14ac, H4hyperac ‘penta’, H3K14ac (Millipore) and H3 (C terminus, Abcam)) and processed as described previously13.
Reconstitution of symmetrically and asymmetrically methylated nucleosomes
Symmetrical H3K4me3 and unmodified octamers were reconstituted as previously described29. Briefly, equimolar amounts of histones H2A, H2B, H3 and H4 were mixed to a final concentration of 1 mg ml−1 in unfolding buffer (50 mM Tris-HCl pH 8, 6.3 M guanidine-HCl, 10 mM 2-mercaptoethanol, 4 mM EDTA). Subsequently, histones were loaded into 3,500 Da molecular weight cutoff dialysis tubing (Pierce Snakeskin) and dialyzed in 1,000 volumes of refolding buffer (20 mM Tris-HCl pH 7.5, 2 M NaCl, 1 mM EDTA, 5 mM DTT), overnight at 4 °C. Dialyzed crude octamer was 0.22 μm filtered (Millipore), and octamers were resolved by S200 gel filtration chromatography (Superdex 200 10/300 GL, GE Healthcare) using refolding buffer as the mobile phase. Eluted octamer fractions were pooled and concentrated using centrifugal filters (Amicon Ultra-4, 10 kDa molecular weight cutoff, Millipore) to a final concentration of 5–15 μM, diluted with one volume of octamer storage buffer (20 mM Tris-HCl pH 7.5, 2 M NaCl, 1 mM EDTA, 5 mM DTT, 55% glycerol), and stored at −20 °C. Concentration of octamer was measured spectroscopically using concentrator flowthrough as a blank, ε280nm = 44,700 M−1cm−1, Moct ≈ 108,500 g−1mol−1. Octamers were visualized using 18% separating (4% stacking) discontinuous Laemmli SDS–PAGE in a Mini-Protean gel running system (Bio-Rad) run for 70 min at 22 mA, 200 V max.
Asymmetrical H3K4me3 octamers were reconstituted as above with the following differences. Equimolar amounts of histone H2A, H2B, H3 and H4 were mixed in unfolding buffer to a total of 1–2 mg, where 90% of histone H3 traceless semisynthetic H3K4me3 and the remaining 10% was unmodified with a hexahistidine-tag at N-terminus flanked by a TEV cleavage site, such that, upon cleavage, a native N′ terminus is furnished. Octamers were reconstituted overnight by dialysis in 1,000 volumes of phosphate refolding buffer (50 mM NaH2PO4 pH 7.5, 2 M NaCl, 1 mM EDTA, 5 mM DTT) at 4 °C. Octamers were purified by S200 gel filtration chromatography, and His-tagged octamers were isolated using cobalt-based immobilized metal affinity chromatography Dynabeads magnetic particles. Octamers were incubated with magnetic beads for 10 min at 4 °C on a rotator, followed by two 1 ml washes (50 mM NaH2PO4 pH 7.5, 2 M NaCl, 10 mM imidazole) and eluted with 50 μl of elution buffer (50 mM NaH2PO4 pH 7.5, 2 M NaCl, 250 mM imidazole, 1 mM EDTA, 1 mM DTT). The elution step was repeated six times, fractions were characterized spectroscopically, pooled, diluted with one volume of octamer storage buffer and stored in −20 °C.
Nucleosomes were reconstituted using 601 DNA amplified by PCR. DNA (400 pmol) and histone octamers were mixed in 1:1 ratio, at a final concentration >1 μM, and dialyzed in dialysis buttons (Hampton Research) against a nonlinear gradient of sodium chloride 2 M NaCl → 0.2 M NaCl in a buffer containing 20 mM Tris-HCl pH 7.5, 1 mM EDTA, 10 mM 2-mercaptoethanol over the course of 12–16 h. Afterwards nucleosomes were recovered, diluted with one volume of 2× storage buffer (20 mM sodium cacodylate pH 7.5, 10% v/v glycerol, 1 mM EDTA, 1× RL Protease Inhibitor Cocktail (1 mM PMSF, 1 mM 4-benzenesulfonyl fluoride hydrochloride, 0.8 μM aprotinin, 20 μM leupeptin, 15 μM pepstatin A, 40 μM bestatin, 15 μM E-64)), and stored at −20 °C. Nucleosome concentration was measured by densitometry of 2% agarose gels, 1× Tris-borate-EDTA (89 mM Tris-base, 89 mM boric acid, 2 mM EDTA) run for 30 min in 5 V cm−1 electrical field gradient, followed by staining with 1× SYBR Gold (Invitrogen) for >30 min. Before electrophoresis, nucleosomes were disassembled with 2 M NaCl, roughly 1 pmol of nucleosomes were loaded per well and measured in triplicate against a known quantity of free DNA of the same size.
Purification of native complexes and immunoblotting
Native JADE1 and JADE1S complexes were purified from K562 cells expressing a 3×Flag–2×Strep (3Flag-2Strep)-tagged JADE1/JADE1S from the AAVS1 locus as previously described30. The subunits of purified JADE1 and JADE1S complexes were detected by immunoblotting following SDS–PAGE and transfer to nitrocellulose membrane. Anti-Flag M2 conjugated to horseradish peroxidase (HRP, Sigma) was used at a 1:10,000 dilution, and the immunoblots were visualized using a Western Lightning plus-enhanced chemiluminescence reagent (PerkinElmer). Anti-ING5 (Sigma catalog no. HPA042685, rabbit polyclonal), anti-MEAF6 (Abcam catalog no. Ab42472, rabbit polyclonal) and anti-HBO1 (Abcam catalog no. Ab70183, rabbit polyclonal) antibodies were used at a 1:1,000 dilution. Horseradish peroxidase-conjugated secondary goat anti-rabbit antibody (Sigma) was used at a 1:10,000 dilution.
HAT assays
HBO1 acetyltransferase activities of purified native JADE1 and JADE1S complexes were measured with 0.125 μCi of 3H-labeled Ac-CoA (2.1 Ci mmol−1; PerkinElmer Life Sciences). Approximately equivalent amounts of the purified JADE1 and JADE1S complexes were used in the HAT assays based on the anti-Flag immunoblot. The HAT reactions were performed in a volume of 20 μl using 0.85 μg of reconstituted NCPs or 0.5 mg of native chromatin in HAT buffer (50 mM Tris-HCl pH 8, 10 mM sodium butyrate, 5% glycerol, 0.1 mM EDTA, 1 mM DTT, 1 mM PMSF) in the presence of 60 mM NaCl and 20 mM KCl for 1 h at 30 °C. The reactions were then captured on P81 filter paper, the free 3H-labeled Ac-CoA was washed away and the paper analyzed using Liquid Scintillation. The 3H counts were used to evaluate HBO1 acetyltransferase activity. Histone acetylation levels were also measured by loading the reactions on 12% SDS–PAGE. The gel was incubated in EN3HANCE solution (PerkinElmer) and dried to perform autoradiography on X-ray film. Native chromatin was purified from yeast cells as described31.
X-ray crystallography
The H3–GSGSS–JADE1PZP construct (amino acids 1–12 of histone H3, a GSGSS linker and amino acids 201–373 of JADE1) was cloned into a pDEST15 vector with a glutathione S-transferase (GST tag) and a TEV cleavage site. The linked protein was produced as above. Following cleavage of the GST tag with TEV protease and further purification by SEC, the linked H3–PZP protein was concentrated in 50 mM Tris-HCl pH 7.5, 500 mM NaCl, 5 mM DTT. Crystals were obtained using sitting-drop vapor diffusion at 18 °C in 25 mM Tris-HCl pH 7.5, 150 mM NaCl, 5 mM DTT by mixing 0.6 μl of protein with 0.6 μl of reservoir solution composed 0.2 M sodium chloride, 0.1 M HEPES pH 7.0, 20% w/v PEG 6000. Crystals were cryoprotected with 30% (v/v) glycerol. X-ray diffraction data were collected at the Advanced Light Source 4.2.2 Beamline, Berkeley. Indexing and scaling were completed using the X-ray detector software XDS32. The phase solution was found using single-wavelength anomalous dispersion method with Zn anomalous signal in Phenix33. Model building was carried out with Coot34 and refinement was performed with Phenix refine33.
Crystals of the apo form of JADE1PZP were obtained using the sitting-drop diffusion method at 4 °C by mixing 1 μl protein solution with 1 μl reservoir containing 2 M ammonium sulfate, 0.1 M sodium acetate, pH 4.6. Although peptide (threefold of H31–31) was added, no electron density of the peptide was observed. Crystals were soaked with 30% glycerol. The datasets were collected on Rigaku Micromax 007 high-frequency microfocus X-ray generator in the CU Anschutz X-ray crystallography core facility. Integration and scaling were completed with HKL2000. The structure was solved by the Phaser MR program in CCP4 using PDB 5ERC as the search model. COOT and PHENIX program were used for the refinement. Crystallographic statistics for the structures of JADE1PZP in complex with H3 and in the apo state are listed in Table 1.
NMR experiments
NMR experiments were performed at 298 K on Bruker 600 MHz and Varian 600 MHz spectrometers equipped with cryogenic probes. 1H,15N HSQC spectra of 0.1–0.2 mM uniformly 15N-labeled WT or mutant JADE1PZP in 50 mM Tris-HCl pH 7.5 buffer, supplemented with 150 mM NaCl, 5 mM DTT and 8–10% D2O were collected in the absence and presence of increasing amount of H3 peptides (synthesized by Synpeptide). NMR data were processed and analyzed with NMRPipe and NMRDraw as previously described35.
The dissociation constant was determined by a nonlinear least-squares analysis using the equation
where is concentration of the peptide, is concentration of the protein, is the observed chemical shift change and is the normalized chemical shift change at saturation. Normalized chemical shift changes were calculated using the equation , where is the change in chemical shift in parts per million (ppm).
Tryptophan fluorescence
Spectra were recorded at 25 °C on a Fluoromax-3 spectrofluorometer (HORIBA) as described36 with the following modifications: samples containing 0.5–1 μM WT or mutant JADE1PZP and progressively increasing concentrations of H3 peptides (amino acids 1–12, 15–34 and 1–31 of H3) were excited at 295 nm. All experiments were performed in buffer containing 20 mM Tris-HCl pH 7.5, 150 mM NaCl, 5 mM DTT. Emission spectra were recorded over a range of wavelengths between 310 and 380 nm with a 0.5 nm step size and a 0.5 s integration time. The values for the interaction of JADE1PZP with H31–12 and H315–31 peptides were determined using a nonlinear least-squares analysis and the following equation:
where is the concentration of the histone peptide, is the protein concentration, is the observed change of signal intensity and is the difference in signal intensity of the free and bound states of the domain. The value for the interaction of JADE1PZP with H31–31 was determined using a nonlinear least-squares analysis and the two-site binding equation
where , , and are as above. The values were averaged over three independent experiments, with the error calculated as the s.d. between the runs.
NCP assembly
Human H2A, H2B, H3.2 and H4 histone proteins were expressed in E. coli BL21 (DE3) pLysS cells, separated from inclusion bodies and purified using SEC and ion exchange chromatography37. Histones were then combined in 7 M guanidine-HCl, 20 mM Tris-HCl pH 7.5 and 10 mM DTT in appropriate molar ratios and refolded into octamer by slow dialysis into 2 M NaCl, 20 mM Tris-HCl pH 7.5, 1 mM EDTA pH 8.0 and 2 mM β-mercaptoethanol. The octamer was purified from tetramer and dimer by SEC. Octamer was then mixed with DNA (147 bp or 207 bp 601 Widom sequence) in 5–10 mM Tris pH 8.0, 2 M NaCl and 0.5–1.0 mM EDTA, and NCPs were reconstituted by slow desalting dialysis into 5–10 mM Tris pH 8.0 and 0.5–1.0 mM EDTA. DNAs used in fluorescence polarization were 147 bp 601 Widom DNA fluorescein-labeled on the 5′ end (for NCP147) and 207 bp DNA (147 bp 601 DNA flanked with 30 bp linker DNA on either side and internally labeled with fluorescein 27 bp in from the 5′ end) (for NCP207). NCPs were separated from free DNA via sucrose gradient purification. When necessary, NCPs were purified by SEC and peak fractions were pooled. All NCPs were confirmed by SDS– and native–PAGE.
Fluorescence anisotropy
Fluorescence polarization measurements were carried out by mixing increasing amounts of JADE1PZP, WT or mutants with 5 nM NCP207 or NCP147 in 75 mM NaCl, 25 mM Tris-HCl pH 7.5, 0.00625% Tween 20 and 5 mM DTT in a 30 μl reaction volume. The samples were loaded into a Corning round-bottom polystyrene plate and allowed to incubate at 4 °C for 30 min. Polarization measurements were acquired with a Tecan infinite M1000Pro plate reader by exciting at 470 nm and measuring polarized emission at 519 nm with 5 nm excitation and emission bandwidths. Fluorescence polarization was calculated from the emission polarized parallel and perpendicular to the polarized excitation light as described previously38. The data were then fit to a binding isotherm with varying Hill coefficient to determine S1/2. The S1/2 values were averaged over three separate experiments with error calculated as the s.d. between runs.
DNA purification and EMSA
Double-stranded DNA containing the 601 Widom sequence cloned into the pJ201 plasmid (147 bp) was transformed into E. coli DH5α cells. The plasmids were purified either as previously described39 or by the PureLink HiPure Expi Plasmid Gigaprep Kit (Invitrogen, catalog no. K210009XP). Separation of the individual sequences was completed by digestion of the plasmid with EcoRV followed by PEG and ethanol precipitation.
EMSAs were performed by mixing increasing amounts of JADE1PZP, WT or mutants with 10 nM 601 DNA per lane in 20–25 mM Tris-HCl pH 7.5 buffer, 150 mM NaCl, 5 mM DTT in a 10 μl reaction volume. Reaction mixtures were incubated for 1 h on ice. Electrophoresis was performed in 0.2× Tris-borate-EDTA on ice. The gels were stained with SYBR Gold (Thermo Fisher Scientific) for 10 min and visualized by Blue LED (UltraThin LED Illuminator-GelCompany).
Immunofluorescence
JADE1, HBO1 and ING5 constructs were generated by PCR amplification of the corresponding DNAs, which were cloned into pcDNA3 vector encoding a N-terminal Flag tag using BglII/XhoI sites or a hemagglutinin (HA) tag. HEK293T cells grown on a Lab-Tek II Chamber Slide system (Nalge Nunc International) were cotransfected by the calcium phosphate method for protein complex overexpression with HA–HBO1/HA–ING5 and full-length Flag–JADE1 (amino acids 1–842). At 48 h posttransfection, cells were fixed with 2% paraformaldehyde for 10 min, washed two times with PBS and permeabilized in PBS + 0.2% Triton X-100 for 5 min at 4 °C. After two washes with PBS + 0.1% FBS, cells were blocked with 5% FBS in PBS for 30 min, then incubated with anti-HA 3F10 (Roche, rat) and anti-Flag M2 (Sigma, mouse) diluted 1:300 in PBS + 0.1% FBS for 1 h at room temperature. After four washes in PBS + 0.1% FBS, AlexaFluor 594 conjugated anti-rat for HA (1:100 dilution, Invitrogen, catalog no. A11007) and FITC conjugated anti-mouse (1:100 dilution) were added for 1 h at room temperature protected from light. Mounting medium consisted of 50% glycerol with 0.2 M glycine pH 8.
Subcellular fractionation
Subcellular fractions of HEK293T cells transiently expressing transgenes were obtained by CSK buffer (100 mM NaCl, 10 mM PIPES (pH 6.8), 3 mM MgCl2, 1 mM EGTA (pH 7.6), 0.3 M sucrose, 0.5% Triton X-100, 5 mM sodium butyrate, 0.5 mM DTT, EDTA-free protease inhibitor cocktail (Roche)) extraction and MNase treatment40. Cells cultured in a 10-cm dish were resuspended in 1 ml of CSK buffer, incubated on ice for 5 min, and then centrifuged (400g, 4 °C, 4 min). The supernatant (soluble fraction) was transferred to a new tube, and the pellet was resuspended in 1 ml of MNase buffer (50 mM Tris-HCl (pH 7.5), 4 mM MgCl2, 1 mM CaCl2, 0.3 M sucrose, 5 mM sodium butyrate, 0.5 mM DTT and protease inhibitor cocktail). MNase (0.5 U, Sigma) was added to the suspension, and the mixture was incubated at 37 °C for 5 min to obtain oligonucleosomes. The MNase reaction was stopped by adding EDTA (pH 8.0) at a final concentration of 20 mM. Equal amounts of lysis buffer (250 mM NaCl, 20 mM sodium phosphate (pH 7.0), 30 mM sodium pyrophosphate, 5 mM EDTA, 10 mM NaF, 0.1% NP-40, 10% glycerol, 1 mM DTT and EDTA-free protease inhibitor cocktail) were added to increase solubility. The chromatin fraction was cleared by centrifugation (17,700g for 5 min at 4 °C). The mixture was centrifuged (13,000 rpm, 4 °C, 5 min) to separate the supernatant (chromatin fraction) and the pellet. The pellet was resuspended in elution buffer (1% SDS, 50 mM NaHCO3) as the nuclear matrix fraction.
Separation of nuclear and cytosolic fractions
HEK293T cells transiently expressing transgenes were subjected to fractionation as previously described41. Cells were harvested by centrifugation (400g for 5 min) and were washed once with PBS. Nuclei were prepared by suspending in isotonic buffer (150 mM NaCl, 1.5 mM MgCl2, 10 mM Tris-HCl pH 7.5, 0.5% NP-40, EDTA-complete protease inhibitor cocktail (Roche)) and incubating on ice for 5 min, followed by sedimentation at 400g for 5 min. The nuclei were then dissolved in elution buffer (1% SDS and 50 mM NaHCO3). Each fraction was then subjected to western blotting.
Myeloid progenitor transformation assay
The myeloid progenitor transformation assay was performed as previously described42. Bone marrow cells were harvested from the femurs and tibiae of 5-week-old female C57BL/6J mice. c-Kit+ cells were enriched using magnetic beads conjugated with an anti-c-Kit antibody (Miltenyi Biotec), transduced with a recombinant retrovirus by spinoculation and plated (4 × 10⁴ cells per sample) in a methylcellulose medium (IMDM, 20% FBS, 1.6% methylcellulose and 100 μM β-mercaptoethanol) containing murine SCF, IL-3 and GM-CSF (10 ng ml−1 each). During the first culture passage, G418 (1 mg ml−1) was added to the culture medium to select the transduced cells. Hoxa9 expression was quantified using RT–qPCR after the first passage. Cells were then replated once every 5 days with a fresh medium. Colony-forming units were quantified per 104 plated cells for each passage.
Virus production
Ecotropic retroviruses were produced using PLAT-E packaging cells (a gift from T. Kitamura). Lentiviruses were produced in HEK293T cells using the pMDLg/pRRE, pRSV-rev and pMD2.G vectors, all of which were gifts from D. Trono. Virus-containing media were harvested 24–48 h after transfection and were used for viral transduction.
RT–qPCR
Total RNA was isolated using an RNeasy Mini Kit (Qiagen) and reverse-transcribed using a Superscript III First Strand cDNA Synthesis System (Thermo Fisher Scientific) with oligo (dT) primers. Gene expression was analyzed by qPCR using TaqMan probes (Thermo Fisher Scientific). Relative expression levels were normalized to those of Gapdh and determined using a standard curve and relative quantification method, as per the manufacturer’s instructions (Thermo Fisher Scientific). The commercially available PCR probe sets used in this study are listed in Supplementary Table 1.
Statistics and reproducibility
Statistical analysis was performed using GraphPad Prism v.8 and Microsoft Excel software. Data are presented as mean ± s.d. Multiple comparisons were performed using two-way ANOVA; all statistical tests were two-sided. All the experiments with western blot analysis, colony pictures and EMSA were performed independently at least twice and confirmed their reproducibility.
Supplementary Material
Acknowledgements
We thank H. Sato, I. Yokoyama, K. Ito, E. Kanai and A. Yokoyama for technical assistance. This work was supported in part by grants from the National Institutes of Health: HL151334, GM135671, GM125195, CA252707 and AG067664 to T.G.K., GM131626 and GM139564 to M.G.P., from the Japan Society for the Promotion of Science (JSPS) KAKENHI grants (22H03109 and 22KK0119) to A.Y. and A.K. and from the Canadian Institutes of Health Research (CIHR) (FDN-143314, PJT-178367) to J.C. This work was also supported in part by research funds to A.Y. from the Yamagata prefectural government and the city of Tsuruoka.
Footnotes
Competing interests
The authors declare no competing interests.
Additional information
Supplementary information The online version contains supplementary material available at https://doi.org/10.1038/s41594-024-01245-2.
Peer review information Nature Structural & Molecular Biology thanks Jun Qin and the other, anonymous, reviewer(s) for their contribution to the peer review of this work. Peer reviewer reports are available. Primary Handling Editors: Sara Osman and Carolina Perdigoto, in collaboration with the Nature Structural & Molecular Biology team.
Reprints and permissions information is available at www.nature.com/reprints.
Reporting summary
Further information on research design is available in the Nature Portfolio Reporting Summary linked to this article.
Code availability
This paper does not report original code.
Data availability
Coordinates and structure factors have been deposited in the Protein Data Bank under accession numbers 8GDX and 8GE0. All other relevant data supporting the key findings of this study are available within the paper, its Supplementary Information or from the corresponding authors upon reasonable request. Source data are provided with this paper.
References
- 1.Grunstein M Histone acetylation in chromatin structure and transcription. Nature 389, 349–352 (1997). [DOI] [PubMed] [Google Scholar]
- 2.Schubeler D et al. Nuclear localization and histone acetylation: a pathway for chromatin opening and transcriptional activation of the human beta-globin locus. Genes Dev 14, 940–950 (2000). [PMC free article] [PubMed] [Google Scholar]
- 3.Kuo MH & Allis CD Roles of histone acetyltransferases and deacetylases in gene regulation. Bioessays 20, 615–626 (1998). [DOI] [PubMed] [Google Scholar]
- 4.Mizzen CA & Allis CD Linking histone acetylation to transcriptional regulation. Cell. Mol. Life Sci. 54, 6–20 (1998). [DOI] [PMC free article] [PubMed] [Google Scholar]
- 5.MacPherson L et al. HBO1 is required for the maintenance of leukaemia stem cells. Nature 577, 266–270 (2020). [DOI] [PubMed] [Google Scholar]
- 6.Hayashi Y et al. NUP98-HBO1-fusion generates phenotypically and genetically relevant chronic myelomonocytic leukemia pathogenesis. Blood Adv. 3, 1047–1060 (2019). [DOI] [PMC free article] [PubMed] [Google Scholar]
- 7.Takahashi S et al. HBO1-MLL interaction promotes AF4/ENL/P-TEFb-mediated leukemogenesis. eLife 10, e65872 (2021). [DOI] [PMC free article] [PubMed] [Google Scholar]
- 8.Wang Y et al. High-expression HBO1 predicts poor prognosis in gastric cancer. Am. J. Clin. Pathol. 152, 517–526 (2019). [DOI] [PubMed] [Google Scholar]
- 9.Kueh AJ, Dixon MP, Voss AK & Thomas T HBO1 is required for H3K14 acetylation and normal transcriptional activity during embryonic development. Mol. Cell. Biol. 31, 845–860 (2011). [DOI] [PMC free article] [PubMed] [Google Scholar]
- 10.Yang Y et al. The histone lysine acetyltransferase HBO1 (KAT7) regulates hematopoietic stem cell quiescence and self-renewal. Blood 139, 845–858 (2022). [DOI] [PubMed] [Google Scholar]
- 11.Miotto B & Struhl K HBO1 histone acetylase activity is essential for DNA replication licensing and inhibited by Geminin. Mol Cell 37, 57–66 (2010). [DOI] [PMC free article] [PubMed] [Google Scholar]
- 12.Avvakumov N et al. Conserved molecular interactions within the HBO1 acetyltransferase complexes regulate cell proliferation. Mol. Cell. Biol. 32, 689–703 (2012). [DOI] [PMC free article] [PubMed] [Google Scholar]
- 13.Saksouk N et al. HBO1 HAT complexes target chromatin throughout gene coding regions via multiple PHD finger interactions with histone H3 tail. Mol. Cell 33, 257–265 (2009). [DOI] [PMC free article] [PubMed] [Google Scholar]
- 14.Lalonde ME et al. Exchange of associated factors directs a switch in HBO1 acetyltransferase histone tail specificity. Genes Dev. 27, 2009–2024 (2013). [DOI] [PMC free article] [PubMed] [Google Scholar]
- 15.Han J et al. The scaffolding protein JADE1 physically links the acetyltransferase subunit HBO1 with its histone H3-H4 substrate. J. Biol. Chem. 293, 4498–4509 (2018). [DOI] [PMC free article] [PubMed] [Google Scholar]
- 16.Feng YP et al. BRPF3-HBO1 regulates replication origin activation and histone H3K14 acetylation. EMBO J. 35, 176–192 (2016). [DOI] [PMC free article] [PubMed] [Google Scholar]
- 17.Peña PV et al. Molecular mechanism of histone H3K4me3 recognition by plant homeodomain of ING2. Nature 442, 100–103 (2006). [DOI] [PMC free article] [PubMed] [Google Scholar]
- 18.Champagne KS et al. The crystal structure of the ING5 PHD finger in complex with an H3K4me3 histone peptide. Proteins 72, 1371–1376 (2008). [DOI] [PMC free article] [PubMed] [Google Scholar]
- 19.Hung T et al. ING4 mediates crosstalk between histone H3 K4 trimethylation and H3 acetylation to attenuate cellular transformation. Mol. Cell 33, 248–256 (2009). [DOI] [PMC free article] [PubMed] [Google Scholar]
- 20.Chen S et al. The PZP domain of AF10 Senses unmodified H3K27 to regulate DOT1L-mediated methylation of H3K79. Mol. Cell 60, 319–327 (2015). [DOI] [PMC free article] [PubMed] [Google Scholar]
- 21.Klein BJ et al. The role of the PZP domain of AF10 in acute leukemia driven by AF10 translocations. Nat. Commun. 12, 4130 (2021). [DOI] [PMC free article] [PubMed] [Google Scholar]
- 22.Klein BJ et al. Molecular basis for the PZP domain of BRPF1 association with chromatin. Structure 28, 105–110 e3 (2020). [DOI] [PMC free article] [PubMed] [Google Scholar]
- 23.Cheng CK et al. A novel NUP98-JADE2 fusion in a patient with acute myeloid leukemia resembling acute promyelocytic leukemia. Blood Adv. 6, 410–415 (2022). [DOI] [PMC free article] [PubMed] [Google Scholar]
- 24.Andrews FH, Strahl BD & Kutateladze TG Insights into newly discovered marks and readers of epigenetic information. Nat. Chem. Biol. 12, 662–668 (2016). [DOI] [PMC free article] [PubMed] [Google Scholar]
- 25.Musselman CA & Kutateladze TG Handpicking epigenetic marks with PHD fingers. Nucleic Acids Res. 39, 9061–9071 (2011). [DOI] [PMC free article] [PubMed] [Google Scholar]
- 26.Miyamoto R & Yokoyama A Protocol for fractionation-assisted native ChIP (fanChIP) to capture protein-protein/DNA interactions on chromatin. STAR Protoc. 2, 100404 (2021). [DOI] [PMC free article] [PubMed] [Google Scholar]
- 27.Martin M Cutadapt removes adapter sequences from high-throughput sequencing reads. EMBnet J. 17, 10–12 (2011). [Google Scholar]
- 28.Li H & Durbin R Fast and accurate short read alignment with Burrows–Wheeler transform. Bioinformatics 25, 1754–1760 (2009). [DOI] [PMC free article] [PubMed] [Google Scholar]
- 29.Ruthenburg AJ et al. Recognition of a mononucleosomal histone modification pattern by BPTF via multivalent interactions. Cell 145, 692–706 (2011). [DOI] [PMC free article] [PubMed] [Google Scholar]
- 30.Dalvai M et al. A scalable genome-editing-based approach for mapping multiprotein complexes in human cells. Cell Rep. 13, 621–633 (2015). [DOI] [PubMed] [Google Scholar]
- 31.Altaf M et al. Interplay of chromatin modifiers on a short basic patch of histone H4 tail defines the boundary of telomeric heterochromatin. Mol. Cell 28, 1002–1014 (2007). [DOI] [PMC free article] [PubMed] [Google Scholar]
- 32.Minor W, Cymborowski M, Otwinowski Z & Chruszcz M HKL-3000: the integration of data reduction and structure solution—from diffraction images to an initial model in minutes. Acta Crystallogr. D Biol. Crystallogr. 62, 859–866 (2006). [DOI] [PubMed] [Google Scholar]
- 33.Adams PD et al. PHENIX: a comprehensive Python-based system for macromolecular structure solution. Acta Crystallogr. D Biol. Crystallogr. 66, 213–221 (2010). [DOI] [PMC free article] [PubMed] [Google Scholar]
- 34.Emsley P, Lohkamp B, Scott WG & Cowtan K Features and development of Coot. Acta Crystallogr. D Biol. Crystallogr. 66, 486–501 (2010). [DOI] [PMC free article] [PubMed] [Google Scholar]
- 35.Klein BJ et al. The histone-H3K4-specific demethylase KDM5B binds to its substrate and product through distinct PHD fingers. Cell Rep. 6, 325–335 (2014). [DOI] [PMC free article] [PubMed] [Google Scholar]
- 36.Gatchalian J et al. Dido3 PHD modulates cell differentiation and division. Cell Rep. 4, 148–158 (2013). [DOI] [PMC free article] [PubMed] [Google Scholar]
- 37.Becht DC et al. MORF and MOZ acetyltransferases target unmethylated CpG islands through the winged helix domain. Nat. Commun. 14, 697 (2023). [DOI] [PMC free article] [PubMed] [Google Scholar]
- 38.Tencer AH et al. Covalent modifications of histone H3K9 promote binding of CHD3. Cell Rep. 21, 455–466 (2017). [DOI] [PMC free article] [PubMed] [Google Scholar]
- 39.Musselman CA et al. Binding of PHF1 tudor to H3K36me3 enhances nucleosome accessibility. Nat. Commun. 4, 2969 (2013). [DOI] [PMC free article] [PubMed] [Google Scholar]
- 40.Yokoyama A, Kawaguchi Y, Kitabayashi I, Ohki M & Hirai K The conserved domain CR2 of Epstein-Barr virus nuclear antigen leader protein is responsible not only for nuclear matrix association but also for nuclear localization. Virology 279, 401–413 (2001). [DOI] [PubMed] [Google Scholar]
- 41.Yokoyama A et al. Leukemia proto-oncoprotein MLL forms a SET1-like histone methyltransferase complex with menin to regulate Hox gene expression. Mol. Cell. Biol. 24, 5639–5649 (2004). [DOI] [PMC free article] [PubMed] [Google Scholar]
- 42.Okuda H & Yokoyama A Myeloid progenitor transformation assay. Bio Protoc. 7, e2626 (2017). [DOI] [PMC free article] [PubMed] [Google Scholar]
Associated Data
This section collects any data citations, data availability statements, or supplementary materials included in this article.
Supplementary Materials
Data Availability Statement
Coordinates and structure factors have been deposited in the Protein Data Bank under accession numbers 8GDX and 8GE0. All other relevant data supporting the key findings of this study are available within the paper, its Supplementary Information or from the corresponding authors upon reasonable request. Source data are provided with this paper.