

Abstract
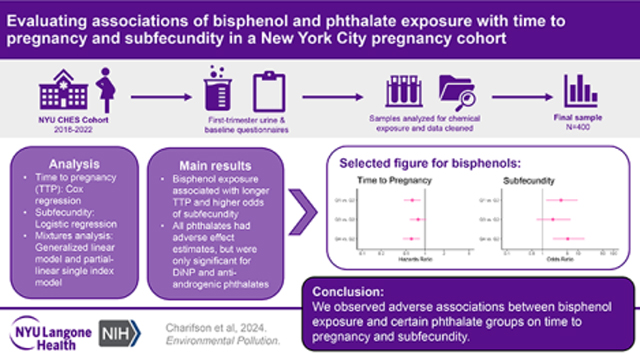
It is important to understand the impact of consumer chemical exposure and fecundity, a couple’s measure of probability of successful conception, given approximately 15% of couples experience infertility. Prior research has generally found null associations between bisphenol and phthalate exposure and fecundability, measured via time to pregnancy (TTP). However, this research has not been updated with current chemical exposures and have often lacked diversity in their study populations. We evaluated the associations between common bisphenol and phthalate chemical exposure groups and TTP as well as subfecundity (TTP>12 months) in the New York University Children’s Health Study, a diverse pregnancy cohort from 2016 onward. Using first-trimester spot-urine samples to measure chemical exposure and self-reported TTP from first-trimester questionnaires, we observed a significant adverse association between total bisphenol exposure and certain phthalate groups on TTP and odds of subfecundity. Furthermore, in a mixtures analysis to explore the joint effects of the chemical groups on the outcomes, we found evidence of a potential interaction between total bisphenol exposure and low-molecular weight phthalates on TTP. Future research should continue to update our knowledge regarding the complex and potentially interacting effects of these chemicals on reproductive health.
Keywords: Fecundability, fertility, subfecundity, consumer chemicals, bisphenols, phthalates
Graphical Abstract
1. Introduction:
An estimated 15% of couples struggle with infertility, commonly defined as the inability for a couple to conceive after 12 months of regular unprotected heterosexual intercourse.[1–3] While infertility may result from male and female fertility factors, a study from the National Survey of Family Growth predicted that by 2025 the number of women experiencing infertility in the United States will range from 5.4 to 7.7 million individuals.[4] The personal impacts of infertility and/or subfertility, more broadly defined as delayed conception or a long time to pregnancy (TTP), are far-reaching with acute interpersonal, mental health and financial consequences for those experiencing it, as well as, longer-term associations with adverse health outcomes later in life.[5–9] Furthermore, research has found evidence that Black and other non-White racial and ethnic groups are more likely to experience underlying reproductive health factors that contribute to infertility, while simultaneously being less likely to have access to infertility treatment, making infertility not only a public health concern but also a health equity concern.[2, 10, 11]
Many chemicals found in plastics and other consumer products are known endocrine disruptors that have been shown to have adverse effects on reproductive health.[12] Two classes of chemicals that are of particular concern are bisphenols and phthalates.[13–16] Bisphenols, most notably bisphenol A (BPA), are found in polycarbonate plastics, epoxy resins, and thermal papers, which are in turn found in consumer products such as plastic dishware, canned food containers, and cash register receipts, respectively.[17] The ubiquity of bisphenols in the environment cannot be understated, with one study observing that among National Health and Nutrition Examination Study (NHANES) participants, a representative sample the of United States (US) general population, 92.6% had detectable levels of BPA in their urine.[18] BPA acts as an estrogen agonist and androgen antagonist, and is associated with increased risk of heart disease, diabetes, and disrupted ovarian function and hormone levels.[19, 20] Phthalates are diesters of phthalic (1,2-benzenedicarboxylic) acid commonly found in PVC plastics, personal care products, packaging materials, children’s toys, and medical devices.[21, 22] More specifically, high-molecular weight (HMW) phthalates are generally found in flexible vinyl plastics such as those used in floor and wall coverings and in medical tubing, while low molecular weight (LMW) phthalates are frequently used as solvents in cosmetics, perfumes, lacquers, and varnishes.[22] Similar to BPA, phthalates are widely detected (>75%) in the US general population based on data from NHANES and have been observed to have endocrine-disrupting effects.[23, 24]
Prior research has not generated strong evidence in support of associations of bisphenol and phthalate exposure with fecundability, measured via TTP or subfecundity (TTP ≥12 months).[13, 14, 16] Based on our own review of the literature and prior systematic review by Hipwell et al. 2018, there have been two prospective and two retrospective cohort studies of associations of BPA with TTP, none of which reported a significant association.[25–28] Among the six studies (three prospective, three retrospective) to examine associations of phthalates with TTP, [25–30] only one reported a statistically significant finding for longer TTP. In a prospective study of women trying to conceive, Thomsen et al. observed that monoethyl phthalate (MEP), was associated with longer TTP.[29] Two studies[26, 30] found some (albeit not statistically significant) evidence of shorter TTP for some phthalate metabolites. While Philips et al. did not detect significant associations of either bisphenols or phthalates with TTP in general, when they stratified by preconception folic acid use, they found those who did not use supplements had slightly longer TTP in relation to bisphenol and phthalic acid exposure.[27]
Despite the studies and reviews described above, there are still gaps in the literature to be addressed on the relations of bisphenol and phthalate exposure with fecundity. While prior studies have been conducted, the latest was published in 2018 and exposure to chemicals in consumer products has changed greatly in recent years. Due to growing concern with health effects of BPA and certain HMW phthalates, manufacturers have substituted chemical analogues such as bisphenol S (BPS) for BPA and di-n-octyl phthalate (DnOP) and diisononyl phthalate (DiNP) in place of di-2-ethylhexyl phthalate (DEHP).[18] The shifting chemical environment necessitates continuous investigation of the impacts of consumer chemicals on human health. Additionally, most of the prior research was conducted among majority non-Hispanic White, European, highly educated populations. However, prior research has found Black, Hispanic, and low-income communities are at higher risk of exposure to these and other chemicals.[31–34] Therefore, prior results may not be generalizable to populations who have higher exposure to these consumer chemicals and may also very with respect to other factors that influence fecundability. Finally, because these two chemical classes coexist in many consumer products and individuals are continuously exposed to both through daily activities, it is important to assess their combined effects. However, none of the prior studies deployed mixtures analysis in their assessment of the impact of bisphenols and phthalates on fecundity.
The goal of this study is to use both single-pollutant and mixtures models to examine the relation of bisphenols and phthalates with two measures of reproductive potential, TTP and subfecundity, in the sociodemographically diverse New York University (NYU) Children’s Health and Environment Study (CHES), which has been enrolling participants in early pregnancy since 2016. We hypothesize that higher chemical exposure will be associated with longer TTP and higher odds of subfecundity.
2. Methods:
2.1. Study Population
The study population consisted of pregnant participants in the NYU CHES cohort. The NYU CHES cohort is described in detail elsewhere.[35] Briefly, starting in March 2016, pregnant patients at three NYU-affiliated hospitals were enrolled at <18 weeks gestation and followed throughout pregnancy and the postpartum period. Prenatally, questionnaire responses and biospecimens are collected during each trimester and at birth.
By October 2022, 4,144 participants had enrolled in the NYU CHES cohort (Figure 1). Of these, 2,772 provided first-trimester urine and, of these, 995 had their sample analyzed for bisphenols and phthalates by the time we began our analysis. Selection of samples for processing was done based on enrollment date and was limited due to cost, time, and resources. The TTP question was added to the baseline questionnaire in July 2017 and, of the 995, 493 were enrolled after that date and could have provided outcome data. Of these, additional exclusions were due to skipping the TTP question (n=48), non-numeric TTP responses (n=5), and use of assisted reproductive technologies (n=40). Therefore, the final sample consisted of 400 participants with complete exposure and outcome data. Because all participants in our sample conceived naturally without the use of assisted reproductive technologies, our results are only generalizable to similar populations.
Figure 1:

Sample Size Flowchart
The study population includes patients enrolled in the New York University Children’s Health and Environment Study between July 2017 and October 2022. Data loss occurred when participants were missing outcome data, first trimester urine or had not had their first trimester urine sample yet analyzed for bisphenols and phthalate concentrations. Participants were also excluded if they conceived via assisted reproductive technologies.
2.2. Measurement of chemicals
Chemicals were measured in urine samples after recruitment at clinical visits before 18 weeks gestation. Participants self-collected urine during their routine prenatal visit. Mean gestational age at urine collection was 10 weeks (standard deviation = 6 weeks). Despite the rapid metabolism and excretion of bisphenols and phthalates, individuals are continuously exposed to these two chemical classes through diet and routine consumer product use. Hence, we used first trimester chemical concentrations as a proxy for preconception exposure, as others have done previously.[26, 27, 36] Samples were aliquoted into polyethylene containers and stored in −80 °C. Urine samples were thawed and prepared for analysis according to a standardized laboratory procedure as previously described in detail.[37, 38] Liquid chromatography with tandem mass spectrometry (LC-MS/MS) was used to quantify 22 phthalate metabolite and 8 bisphenol concentrations.[35, 38] A full list of analytes and their abbreviations can be found in Table 1. For statistical analysis, phthalate metabolites detected in >50% of the samples were grouped by molecular weight (∑LMWP, <250 Da, and ∑HMWP, >250 Da), parent diester (∑DEHP, ∑DnOP, ∑DiNP) or function (∑Anti-androgenic phthalates,[39] ∑AAP) and weighted molar sums were calculated to represent the concentrations of the groupings. We also examined exposure to phthalic acid (PA), which is the final common metabolite of phthalate chemicals and reflects overall phthalate exposure. Two bisphenols, BPA and BPS, were detected in >50% of the study sample and were analyzed separately and as a molar sum to approximate total bisphenol exposure (∑BP). For samples below the limit of detection (LOD), chemical concentrations were imputed using LOD/√2.[40] Adjustment for urine dilution was performed via the Boeniger et al. method using creatinine.[41] Specifically, we multiplied the observed chemical concentrations by the ratio of the batch-specific median creatinine concentration for the study sample to the observed creatinine concentration. Creatinine was measured using high performance LC-MS/MS according to laboratory procedures previously described elsewhere.[38]
Table 1:
Median and Interquartile ranges (IQR) for first-trimester bisphenol and phthalate metabolites (n=400)
| Chemical or Chemical Group | % <LOD | Median (IQR) | |
|---|---|---|---|
| ∑Bisphenols (∑BP)b | - | 5.37 (7.42) | |
| Bisphenol A (BPA)a | 17.75 | 0.92 (1.09) | |
| Bisphenol S (BPS)a | 23.75 | 0.51 (0.78) | |
| Low molecular weight phthalates (∑LMWP)b | - | 181.23 (409.43) | |
| Mono-ethyl phthalate (mEP)a | 0.25 | 35.24 (79.67) | |
| Mono-isobutyl phthalate (mIBP)a | 1.5 | 7.42 (12.51) | |
| Mono-n-butyl phthalate (mBP) | 0.25 | 12.81 (19.27) | |
| High molecular weight phthalates (∑HMWP)b | - | 111.98 (161.13) | |
| Di-(2-ethylhexyl) phthalate (∑DEHP)b | - | 70.11 (98.17) | |
| Mono-(2-ethylhexyl) phthalate (mEHP)a | 26.5 | 2.18 (3.81) | |
| Mono-(2-ethyl-5-oxohexyl) phthalate (mEOHP)a | 1.0 | 3.37 (4.76) | |
| Mono-(2-ethyl-5-hydroxyhexyl) phthalate (mEHHP)a | 0.25 | 6.66 (9.39) | |
| Mono-(7-carboxyheptyl) phthalate (mCMHP)a | 13 | 2.78 (4.03) | |
| Mono-(2-ethyl-5-carboxypentyl) phthalate (mECPP)a | 0.5 | 5.97 (8.15) | |
| Di-n-octyl phthalate (∑DnOP)a | - | 4.39 (7.62) | |
| Mono-(3-carboxypropyl) phthalate (mCPP)a | 18.25 | 0.89 (1.03) | |
| Mono-(7-carboxyheptyl) phthalate (mCHpP)a | 48.25 | 0.79 (2.12) | |
| Diisononyl phthalate (∑DiNP)b | - | 4.90 (8.56) | |
| Mono-(carboxyisooctyl) phthalate (mCiOP)a | 2.75 | 1.62 (2.78) | |
| Anti-androgenic phthalate (∑AntiAnd)b,c | - | 198.33 (267.18) | |
| Other HMW | |||
| Mono-(carboxyisononyl) phthalate (mCiNP)a | 6.25 | 1.59 (2.83) | |
| Benzylbutyl phthalate (mBzP)a | 40.00 | 4.78 (6.79) | |
| Phthalic acida | 2.0 | 16.47 (20.59) | |
Units are ng/mL;
Units are nmol/mL,
Anti-androgenic phthalate is composed of mEHHP, mEHP, mEOHP, mECPP, mBP, miBP, mBzP.
2.3. Fecundity measures
TTP is a continuous measure of a couple fecundity that is operationalized as fecundability, the probability of conception in a menstrual cycle given unprotected heterosexual intercourse.[42] In their first trimester, participants were asked to recall: “How many months did you have regular unprotected intercourse before becoming pregnant?” If participants reported conceiving while on birth control, they were assigned a TTP of one. Recalled TTP is commonly used in fecundity research.[42] Although prior studies have found that individuals can accurately recall TTP within 24 months of conception with 91% accuracy,[43] we chose a more conservative approach and censored TTP at 12 months to minimize misclassification.[42] Subfecundity was defined dichotomously as 0 if a participant reported conceiving within 12 months of unprotected intercourse and 1 if conception occurred at or after 12 months.
2.4. Participant Characteristics
Participant characteristics were collected via questionnaire and abstracted from the electronic medical record. Based on systematic reviews of prior studies and our own review of the literature, we identified several characteristics as potential confounders of the chemical-TTP relationship via directed acyclic graph.[13, 14, 16] We confirmed the potential for a confounding effect for most of these via bivariate associations with exposures and outcome. Covariates included in the final adjustment set for multivariable regression are hospital site (NYU Manhattan, NYU Brooklyn, Bellevue), age (continuous), body mass index (continuous), parous (yes/no), race/ethnicity (Non-Hispanic [NH] White, NH Black, NH Asian, Hispanic, Other/Multiracial), nativity (born in the US/born outside the US), preconception alcohol use (yes/no) and preconception vitamin or folic acid use (yes/no). Given the strong associations between sociodemographic variables (educational attainment, insurance status, employment status and nativity) and hospital site, we were concerned about potential multicollinearity (Supplementary Table 1). When we compared models with and without sociodemographic variables, model fit based on AIC was not significantly improved so sociodemographic variables were not included in the interest of parsimony. Hospital site (n=3) was included as a fixed effect.
2.5. Statistical Analyses
We conducted descriptive statistics for all exposures, all covariates, and both outcomes, then visually inspected distributions. Bivariate analyses were conducted comparing all covariate-exposure and covariate-outcome pairs using Kruskal-Wallis tests and Spearman correlations, as appropriate. Single-pollutant models (∑BP, ∑LMWP, ∑HWMP, ∑DEHP, ∑DnOP, ∑DiNP, ∑AAP, PA) were conducted with TTP and subfecundity as separate outcomes. We assessed the relation between chemical exposures and TTP using Gompertz discrete-time regression models, which yield the hazard of event (in this case, conception) given that the event did not occur in the prior time period (month). We confirmed a linear effect of time on the hazards of pregnancy and evaluated the deviance residuals of the main models to assess model fit. The effect estimate from this type of analysis represents the fecundability hazard ratio (HR), such that a HR >1 indicates a longer TTP (i.e., lower fecundability) and vice versa. We modeled subfecundity using logistic regression models. The effect estimate from this type of analysis represents the odds of conceiving in less than 12 months (subfecundity=0) versus in 12 months or more (subfecundity=1).
Mixtures analysis was conducted using generalized linear models (GLM) and partial-linear single-index (PLSI) models with c-loglog/logit link, respectively, to investigate the relation between chemical mixtures and TTP/subfecundity. A mixtures analysis performed via GLM allows exploration of whether a single chemical exposure has a significant effect when controlling for the presence of other chemical exposures but assumes that all exposure-outcome relations are linear and there is no interaction between exposures. The mixtures analysis performed via the PLSI model quantifies the complex effects of multiple and simultaneous environment exposure on health outcomes by reducing the multiple exposures into a single linear combination of exposures.[44]
We selected the GLM modelling approach because, if valid, it offers intuitive interpretations of chemical mixtures. The PLSI modelling approach allows us to test the assumption that an additive linear combination of chemicals in the GLM is appropriate for modelling our chemical mixtures. When the link function for the PLSI model is linear and PLSI estimates coincide with GLM estimates, it suggests interpretations of the GLM mixtures models are valid. On the other hand, non-linear link functions or discrepant PLSI and GLM effect estimates might suggest more complex relationships such as interactions between exposures.[44] Thus, we utilized both GLM and PLSI approaches in our mixtures analysis of chemical groups and TTP/subfecundity. Given overlap between metabolites included in the ∑HWMP and ∑AAP chemical groups and other groups, these groups were not included in these models. Our final models included ∑LMWP, ∑DEHP, ∑DiNP, ∑DnOP, and ∑BP.
Models were conducted both unadjusted for and adjusted for covariates. All continuous covariates (age, body mass index) were centered at their mean. With <10% of the data missing for any given covariate, multiple imputation via predictive mean matching was employed to impute missing values using the mice package in R.[45] As previously stated, chemical concentrations were creatinine-adjusted and observations below the LOD were imputed using LOD/√2. For all models, the chemical exposures were treated as quartiles of exposure to allow for the exploration of potential non-linear effects. Given prior evidence that adverse health effects of bisphenol exposure can occur at the lowest level of exposure, we were interested in low-dose effects of bisphenols and therefore assigned the second lowest level of bisphenol exposure (Q2) as the reference level.[46] For phthalates, the lowest level of exposure (Q1) was treated as the reference. We accounted for multiple comparisons by controlling for the family-wise error rate from Li et al. 2012, which divides the statistical significance threshold (p <0.05) by the effective number of independent tests (Meff = 5) determined via eigenvalues of the correlation matrix among the main exposure groups, which resulted in a statistical significance threshold of p <0.01.[47]
We performed several sensitivity analyses to assess the potential for bias in our effect estimates. We re-ran single-pollutant models for both outcomes excluding those who conceived while using birth control (i.e., contraceptive failure) (n=76) in case they represent a highly fertile subpopulation and biased effect estimates.[42] We also performed TTP analysis restricted to the last three cycles prior to conception. This allowed us to test whether extrapolating our exposure measure to the entire conception attempt window might bias results. Finally, we tested the possibility that 6 months as opposed to 12 months was a better threshold for censoring in the TTP analysis and defining subfecundity. All data manipulation and analyses were conducted in R (V4.3.3)[48] using the RStudio IDE (Version 2022.07.2, Build 576).
3. Results
3.1. Sample Characteristics
Of the 400 participants with both urinary chemical concentrations and information on TTP, 348 conceived in under 12 months (87%) contributing a total of 1425 person-months of observation time prior to censoring at 12 months for the TTP analysis. At least half of the total study population was parous (54.8%), was Hispanic (59.0%), held a college degree (50.0%), was publicly insured (59.0%), was born outside the US (55.3%), was employed (60.2%), drank alcohol prior to pregnancy (59.8%), and did not take vitamins or folic acid prior to conception (59.4%). Average maternal pre-conception age was 31.1 years (standard deviation (SD) = 5.58) and average body mass index was 26.46 kg/m2 (SD = 5.84). Full sample characteristics can be found in Table 2. Participants with complete data were more likely to be nulliparous but no other differences in sample characteristics were detected between participants with complete and incomplete data.
Table 2:
Time to Pregnancy and Sample Characteristics
| Total (N=400) | <3 months (N=236) | 3–6 months (N=69) | 6–12 months (N=43) | >12 months (N=52) | p value | |
|---|---|---|---|---|---|---|
| Hospital Site | 0.012 | |||||
| Bellevue | 113 (28.2%) | 73 (30.9%) | 13 (18.8%) | 13 (30.2%) | 14 (26.9%) | |
| NYU Brooklyn | 129 (32.2%) | 74 (31.4%) | 17 (24.6%) | 13 (30.2%) | 25 (48.1%) | |
| NYU Manhattan | 158 (39.5%) | 89 (37.7%) | 39 (56.5%) | 17 (39.5%) | 13 (25.0%) | |
| Parity | 0.009 | |||||
| Nulliparous | 181 (45.2%) | 112 (47.5%) | 39 (56.5%) | 15 (34.9%) | 15 (28.8%) | |
| Parous | 219 (54.8%) | 124 (52.5%) | 30 (43.5%) | 28 (65.1%) | 37 (71.2%) | |
| Race/Ethnicity | 0.015 | |||||
| Asian | 30 (7.5%) | 22 (9.3%) | 5 (7.2%) | 2 (4.7%) | 1 (1.9%) | |
| Hispanic | 236 (59.0%) | 142 (60.2%) | 30 (43.5%) | 24 (55.8%) | 40 (76.9%) | |
| Multiracial/Other | 11 (2.8%) | 5 (2.1%) | 5 (7.2%) | 1 (2.3%) | 0 (0.0%) | |
| NH Black | 16 (4.0%) | 8 (3.4%) | 2 (2.9%) | 3 (7.0%) | 3 (5.8%) | |
| NH White | 107 (26.8%) | 59 (25.0%) | 27 (39.1%) | 13 (30.2%) | 8 (15.4%) | |
| Age (years) | 0.042 | |||||
| Mean (SD) | 31.10 (5.58) | 30.56 (5.55) | 31.52 (5.62) | 32.84 (5.65) | 31.57 (5.40) | |
| Median (Q1, Q3) | 31.80 (27.10, 35.08) | 31.11 (26.84, 34.44) | 32.41 (29.04, 34.94) | 34.12 (29.20, 36.90) | 31.74 (28.12, 35.70) | |
| Min - Max | 18.05 – 43.33 | 18.05 – 43.33 | 18.72 – 43.06 | 18.38 – 42.96 | 20.76 – 40.38 | |
| Body Mass Index (kg/m^2) | 0.480 | |||||
| Mean (SD) | 26.46 (5.84) | 26.42 (5.76) | 25.82 (5.54) | 26.34 (5.76) | 27.57 (6.58) | |
| Median (Q1, Q3) | 25.04 (22.07, 29.33) | 25.10 (22.20, 28.70) | 24.45 (21.69, 28.41) | 25.03 (22.06, 28.96) | 26.05 (22.53, 31.53) | |
| Range | 17.62 – 50.05 | 17.62 – 50.05 | 18.47 – 45.07 | 18.30 – 41.55 | 17.63 – 45.14 | |
| Educational Attainment a | 0.129 | |||||
| High school or less | 158 (39.9%) | 91 (39.1%) | 21 (30.4%) | 17 (39.5%) | 29 (56.9%) | |
| Some college | 44 (11.1%) | 25 (10.7%) | 8 (11.6%) | 5 (11.6%) | 6 (11.8%) | |
| Associate | 31 (7.8%) | 18 (7.7%) | 3 (4.3%) | 6 (14.0%) | 4 (7.8%) | |
| Bachelor’s | 76 (19.2%) | 49 (21.0%) | 14 (20.3%) | 8 (18.6%) | 5 (9.8%) | |
| Post-graduate | 87 (22.0%) | 50 (21.5%) | 23 (33.3%) | 7 (16.3%) | 7 (13.7%) | |
| Insurance Type a | 0.171 | |||||
| Private | 164 (41.0%) | 95 (40.3%) | 35 (50.7%) | 18 (41.9%) | 16 (30.8%) | |
| Public | 236 (59.0%) | 141 (59.7%) | 34 (49.3%) | 25 (58.1%) | 36 (69.2%) | |
| Born in US? a | 0.049 | |||||
| No | 198 (55.3%) | 120 (56.9%) | 25 (40.3%) | 23 (59.0%) | 30 (65.2%) | |
| Yes | 160 (44.7%) | 91 (43.1%) | 37 (59.7%) | 16 (41.0%) | 16 (34.8%) | |
| Employment Status a | 0.464 | |||||
| Employed | 241 (60.2%) | 135 (57.2%) | 46 (66.7%) | 28 (65.1%) | 32 (61.5%) | |
| Unemployed | 159 (39.8%) | 101 (42.8%) | 23 (33.3%) | 15 (34.9%) | 20 (38.5%) | |
| Preconception Vitamin/Folic Acid Use? | 0.159 | |||||
| No | 218 (59.4%) | 135 (62.5%) | 30 (46.9%) | 25 (62.5%) | 28 (59.6%) | |
| Yes | 149 (40.6%) | 81 (37.5%) | 34 (53.1%) | 15 (37.5%) | 19 (40.4%) | |
| Preconception Alcohol Use? | 0.042 | |||||
| No | 145 (40.2%) | 92 (43.4%) | 16 (25.0%) | 15 (38.5%) | 22 (47.8%) | |
| Yes | 216 (59.8%) | 120 (56.6%) | 48 (75.0%) | 24 (61.5%) | 24 (52.2%) |
Missing variables: body mass index (n=3), educational attainment (n=6), born in US? (n=49), insurance type (n=1), employment status (n=1), preconception vitamin/folic acid use (n=34), preconception alcohol use (n=43).
NH: Non-Hispanic; SD: standard deviation.
These variables are presented in sample characteristics but ultimately were not selected for covariate adjustment due to lack of statistically significant bivariate associations and concerns about multicollinearity.
3.2. Single-Pollutant Models
3.2.A. Time to pregnancy
We observed an association between ∑BP and longer TTP at low (Q1 vs. Q2) and high doses (Q4 vs. Q2) of exposure adjusted for potential confounders and multiple comparisons (HR = 0.62, 95% CI: 0.46, 0.85; HR = 0.60, 95% CI: 0.44, 0.83, respectively) (Figure 2a). All phthalate chemical groupings showed associations between higher exposure levels and longer TTP, although most effect estimates included the null within their confidence interval (Figure 2a). Significant effects among phthalates that remained after adjusting for potential confounders and controlling for multiple comparisons were: ∑AAP Q4 vs. Q1 (HR = 0.65, CI: 0.48, 0.89) and ∑DiNP Q3 vs. Q1 (HR = 0.66, CI: 0.49, 0.90). Full results can be found in Table 3.
Figure 2:
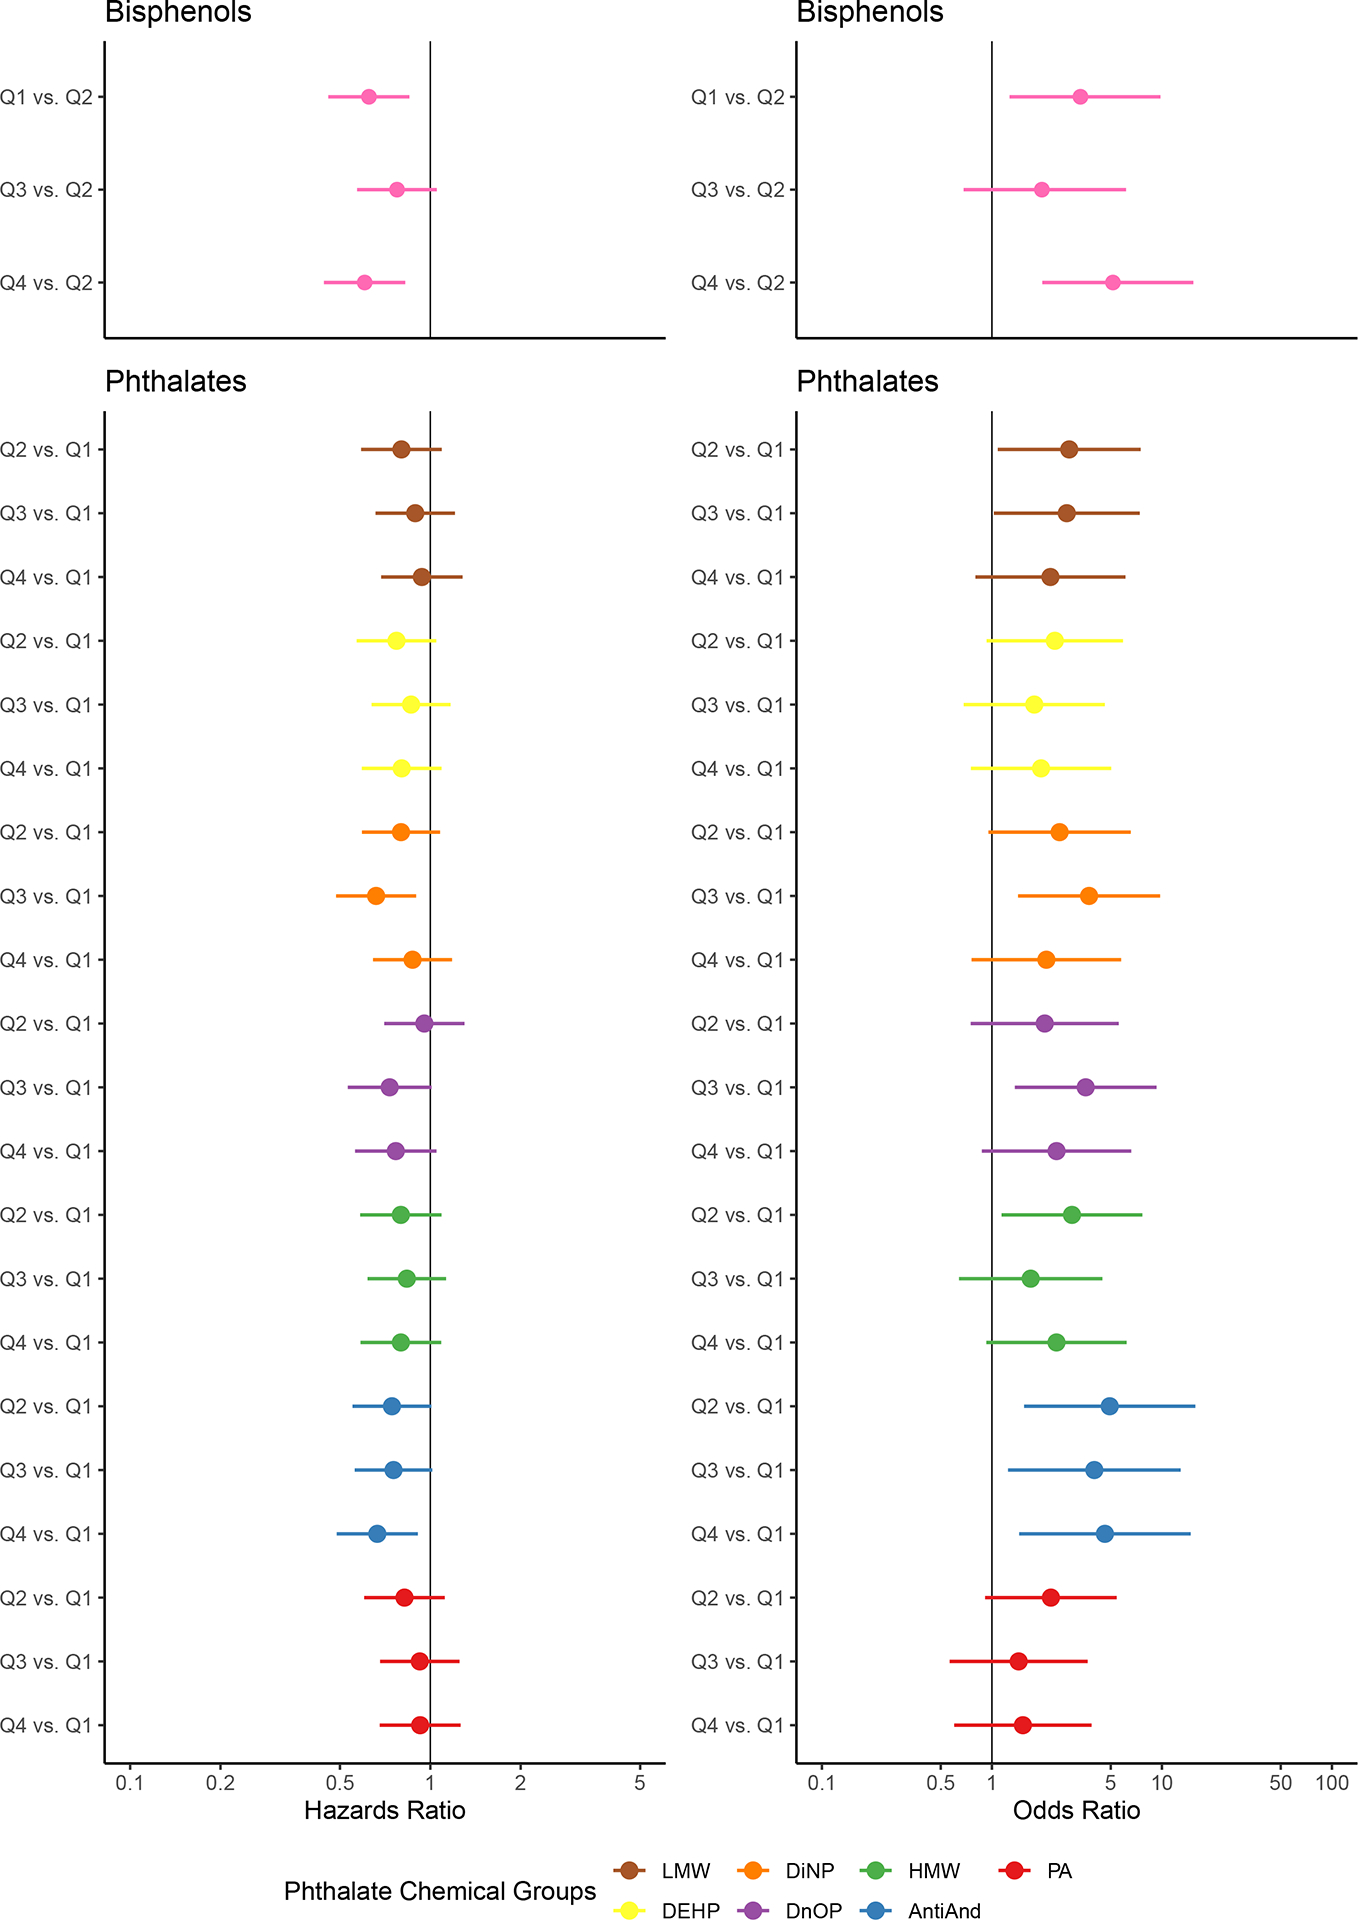
Association between single-pollutant groups and time to pregnancy (left) and subfecundity (right)
Effect estimates for (a) time to pregnancy and (b) subfecundity and their 95% confidence intervals are visualized on each graph. The ratio indicated on the y-axis represents the effect of the quartile of chemical exposure of interest (Q1 [lowest], Q2, Q3, or Q4 [highest]) versus the reference quartile on the outcome. The color indicates the exposure group specified in the legend.
Table 3:
Single-Pollutant Model Results
| Exposure Level | Time to Pregnancy (n=1425 person-months) | Subfecundity (n=400 participants) | |||||||
|---|---|---|---|---|---|---|---|---|---|
| Unadjusted | Adjusted | Unadjusted | Adjusted | ||||||
| Chemical Group | Quartile | HR1 | 95% CI1 | HR1 | 95% CI1 | OR1 | 95% CI1 | OR1 | 95% CI1 |
| ∑BP | Q2 | — | — | — | — | — | — | — | — |
| Q1 | 0.63 | 0.46, 0.85 | 0.62 | 0.46, 0.85 | 3.21 | 1.27, 9.24 | 3.32 | 1.27, 9.81 | |
| Q3 | 0.81 | 0.60, 1.08 | 0.77 | 0.57, 1.05 | 1.74 | 0.62, 5.30 | 1.97 | 0.68, 6.15 | |
| Q4 | 0.63 | 0.47, 0.85 | 0.60 | 0.44, 0.83 | 3.67 | 1.47, 10.5 | 5.15 | 1.98, 15.3 | |
| ∑LMWP | Q1 | — | — | — | — | — | — | — | — |
| Q2 | 0.77 | 0.57, 1.04 | 0.80 | 0.59, 1.09 | 2.72 | 1.11, 7.34 | 2.85 | 1.12, 7.96 | |
| Q3 | 0.86 | 0.64, 1.15 | 0.89 | 0.66, 1.21 | 2.34 | 0.94, 6.40 | 2.76 | 1.06, 7.84 | |
| Q4 | 0.93 | 0.69, 1.25 | 0.94 | 0.68, 1.29 | 1.99 | 0.78, 5.50 | 2.21 | 0.82, 6.42 | |
| ∑DEHP | Q1 | — | — | — | — | — | — | — | — |
| Q2 | 0.76 | 0.57, 1.03 | 0.77 | 0.57, 1.05 | 2.19 | 0.91, 5.65 | 2.34 | 0.95, 6.19 | |
| Q3 | 0.84 | 0.63, 1.14 | 0.86 | 0.63, 1.17 | 1.72 | 0.69, 4.53 | 1.77 | 0.69, 4.80 | |
| Q4 | 0.75 | 0.56, 1.01 | 0.80 | 0.59, 1.09 | 2.03 | 0.84, 5.27 | 1.94 | 0.77, 5.25 | |
| ∑DiNP | Q1 | — | — | — | — | — | — | — | — |
| Q2 | 0.79 | 0.59, 1.07 | 0.80 | 0.59, 1.08 | 2.34 | 0.94, 6.40 | 2.50 | 0.98, 6.95 | |
| Q3 | 0.67 | 0.50, 0.90 | 0.66 | 0.48, 0.90 | 2.92 | 1.20, 7.82 | 3.73 | 1.48, 10.4 | |
| Q4 | 0.86 | 0.64, 1.15 | 0.87 | 0.64, 1.18 | 1.81 | 0.70, 5.06 | 2.09 | 0.77, 6.04 | |
| ∑DnOP | Q1 | — | — | — | — | — | — | — | — |
| Q2 | 0.88 | 0.66, 1.19 | 0.96 | 0.70, 1.30 | 1.99 | 0.78, 5.50 | 2.04 | 0.77, 5.86 | |
| Q3 | 0.71 | 0.52, 0.95 | 0.73 | 0.53, 1.01 | 3.12 | 1.30, 8.32 | 3.56 | 1.42, 9.89 | |
| Q4 | 0.77 | 0.57, 1.03 | 0.77 | 0.56, 1.05 | 1.99 | 0.78, 5.50 | 2.40 | 0.89, 6.94 | |
| ∑HMWP | Q1 | — | — | — | — | — | — | — | — |
| Q2 | 0.82 | 0.60, 1.10 | 0.80 | 0.58, 1.09 | 2.19 | 0.91, 5.65 | 2.96 | 1.17, 8.04 | |
| Q3 | 0.86 | 0.64, 1.16 | 0.84 | 0.62, 1.13 | 1.57 | 0.62, 4.17 | 1.69 | 0.65, 4.64 | |
| Q4 | 0.76 | 0.56, 1.02 | 0.80 | 0.58, 1.09 | 2.19 | 0.91, 5.65 | 2.40 | 0.95, 6.49 | |
| ∑AAP | Q1 | — | — | — | — | — | — | — | — |
| Q2 | 0.72 | 0.53, 0.97 | 0.74 | 0.55, 1.01 | 4.57 | 1.60, 16.4 | 4.93 | 1.68, 18.1 | |
| Q3 | 0.73 | 0.54, 0.98 | 0.75 | 0.56, 1.02 | 3.91 | 1.34, 14.2 | 4.00 | 1.34, 14.8 | |
| Q4 | 0.65 | 0.48, 0.87 | 0.67 | 0.49, 0.91 | 5.27 | 1.88, 18.8 | 4.62 | 1.57, 17.0 | |
| PA | Q1 | — | — | — | — | — | — | — | — |
| Q2 | 0.85 | 0.63, 1.14 | 0.82 | 0.60, 1.12 | 1.84 | 0.81, 4.39 | 2.22 | 0.93, 5.60 | |
| Q3 | 0.95 | 0.70, 1.27 | 0.92 | 0.68, 1.25 | 1.23 | 0.50, 3.05 | 1.44 | 0.56, 3.73 | |
| Q4 | 0.92 | 0.68, 1.24 | 0.93 | 0.68, 1.26 | 1.34 | 0.56, 3.30 | 1.52 | 0.60, 3.95 | |
HR = Hazard Ratio, OR = Odds Ratio, CI = Confidence Interval
Models were adjusted for age, body mass index, parity, race/ethnicity, nativity, preconception alcohol and folic acid use, and hospital site. 95% CIs were constructed using 500 runs of bootstrapping samples data. Bolded effect estimates indicate statistical significance after controlling for multiple comparisons (p<0.01).
3.2.B. Subfecundity
For all effect estimates related to subfecundity, we observed wide confidence intervals, likely owing to the small number of participants who were categorized as sub-fecund (n=52, 13%). As with TTP, the highest quartile of ∑BP exposure was associated with higher odds of subfecundity when compared with Q2 after controlling for potential confounders and multiple comparisons (OR = 5.15, 95% CI: 1.98, 15.30) (Figure 2b). All phthalate chemical groupings were associated with higher odds of subfecundity (Figure 2b), although many of these effects had wide confidence intervals that included the null. After controlling for confounders and multiple comparisons, we found significant associations for ∑DiNP (Q3 vs. Q1 OR = 3.73, 95% CI: 1.48, 10.40), ∑DnOP (Q3 vs. Q1 OR: 3.56, 95% CI: 1.42, 9.89), and ∑AAP (Q2 vs. Q1 OR = 4.93, 95% CI: 1.68, 18.10; Q4 vs. Q1 OR = 4.62, 95% CI: 1.57, 17.00). Full results can be found in Table 3.
3.3. Mixtures Analyses
We performed both GLM and PLSI models with all chemical groups included as exposures (excluding ∑HWMP and ∑AAP) and compared effect estimates for each outcome. We observed discrepancies between the joint effects resulting from the GLM model and the effects from the PLSI model (Supplementary Tables 2 and 3). Additionally, the link function plots for the PLSI models were non-linear (Supplementary Figures 1 and 2), which could be indicative of interactions between exposures.[44]
Given these findings, we plotted interactions between quartiles of chemical quartile exposures and visually inspected them for potential interactions. We noted interactions between ∑BP and ∑LMWP and therefore, re-ran the GLM models with interaction terms between the quartiles of ∑BP and ∑LMWP. This approach yielded evidence of a significant interaction between BP-Q3 and LMW-Q3 (beta = 0.30, p-value = 0.006) on TTP (Supplementary Table 4), indicating that having combined high exposure to both chemical groups has an inverse effect on fecundability (longer TTP) relative to lower exposure levels in each chemical group. The full results of the GLM and PLSI mixture models can be found in Supplementary Tables 2 and 3.
3.4. Sensitivity Analyses
Due to concerns that participants who conceived while using birth control (n=324, 1349 person-months) may represent a highly fecund sub-population, single-pollutant models were re-run excluding those participants, but results were not meaningfully different.
Our exposure was measured in the first trimester of pregnancy, under the assumption that chemical exposure in the first trimester is consistent with chemical exposure throughout the entire TTP window. This assumption could result in exposure misclassification if participants’ chemical exposures changed over the course of the TTP window.[14] To account for this, a sensitivity analysis was run restricted to only the 3 months prior to conception. This more conservative approach posits that each participant’s chemical exposure in first trimester is consistent with their chemical exposure in the three months (i.e., season) prior to conception. This restriction reduced our sample size to 677 person-intervals of observation. All effects were attenuated with wider confidence intervals although all in the same direction as our original findings, which is to be expected due to the smaller sample size and reduced person-time contribution from the participants with the longest TTP. This could imply participants with longer TTP are, in fact, driving the significant associations observed in the main results.
Finally, we re-ran our analyses censoring TTP at 6 months (n=1117 person-months) and redefining subfecundity as taking more than 6 months to conceive (n=400, 82% fecund vs. 18% subfecund). Doing so did not meaningfully change our effect estimates or confidence intervals for the TTP models but produced slightly narrower confidence intervals for the subfecundity models. This is likely due to the increased power in the subfecundity models, by including more participants in the subfecund outcome category. We also observed some attenuated effect estimates for the subfecundity models, which might once again suggest that those with the longest TTP (>12 months) are driving the associations.
Results from all sensitivity analyses can be found in Supplementary Tables 5 and 6.
4. Discussion
4.1. Summary
The purpose of this study was to investigate the relation between bisphenol and phthalate exposure and couple fecundity. Prior literature has generally found null associations between bisphenol (specifically, BPA) exposure and TTP.[13, 14, 16] There have been conflicting findings between phthalate exposure and TTP, although largely null with a few exceptions.[13, 16, 29] In contrast to those findings, we found a robust inverse association between exposure to total bisphenols and select phthalates in relation to TTP and odds of subfecundity. Additionally, in mixtures analyses we found evidence that higher quartiles (Q3) of ∑BP and ∑LMWP may positively interact to lengthen TTP.
There are many reasons why our study may have yielded different results from prior research, which generally observed only null associations. In particular, we investigated replacement chemicals (DiNP and DnOP) and grouped chemicals by various factors (i.e., parent diester, molecular weight, and biochemical function) that could amplify signals. Our use of quartiles of exposure also allowed us to detect nonlinear associations that would have otherwise produce null findings if treated as linear exposures (as some prior studies did). Additionally, our decision to set the reference level of BP to the second quartile, allowed us to detect low-level exposure effects previously described in the literature.
In terms of biological plausibility, there are numerous mechanisms by which bisphenols and phthalates have been empirically shown to impact the female reproductive axis. Specifically, numerous human, animal model and in-vitro studies have found evidence that BPA exposure is associated with lower peak estradiol levels, fewer total and mature oocytes, and lower likelihood of implantation of a fertilized oocyte.[15, 17, 24, 49] Notably, the CLARITY-BPA program, a large National Institutes of Health-funded study of the effects of BPA, found the strongest adverse effects at the lowest level of exposures, concluding that low-dose exposure may be most relevant biologically to humans.[46] This is consistent with our observation of a positive association with TTP and higher odds of subfecundity when comparing Q1 to Q2.
With respect to phthalates, animal and laboratory studies have found that phthalates can impair folliculogenesis at almost all stages and disrupt hormone steroidogenesis as well as the aromatase enzyme which converts androgens to estrogens.[15, 16, 50] There is also some evidence that phthalates can disrupt implantation and immunomodulation at implantation, further potentially impacting fecundity.[15, 16, 50] Most of the experimental literature on the biological impacts of phthalates on the female reproductive axis highlight the adverse effects of DEHP and DiNP.[16, 50] Specifically, DEHP has been shown to be associated with reduced follicle pool, accelerated primordial follicle recruitment, and increased antral follicle atresia. DiNP is often and increasingly used as a DEHP replacement and has demonstrated similar effects to DEHP in animal models.[50] We observed significant associations of DiNP and anti-androgenic phthalates with longer TTP and subfecundity.
4.2. Strengths & Limitations
Our study had numerous strengths that distinguish it from prior analyses of bisphenols and phthalates in relation to fecundity. In contrast to prior research, we employed a mixtures analysis in acknowledgment of the multidimensional ways in which people are exposed to chemicals as recommended by Hipwell et al. (2019) & Kim et al. (2019).[14, 16] While exploratory, our mixtures analyses found suggestive evidence of an interaction between two chemical groups, ∑BP and ∑LMWP, which warrants further investigation. We also performed several sensitivity analyses to address some of the common limitations of TTP research without observing meaningful changes relative to our main findings.
As for limitations, we acknowledge that our study is underpowered to detect small effect sizes. While we were able to detect large and meaningful effects for some chemical groups even after accounting for multiple hypothesis testing, it is possible that smaller effects were missed in our data given our limited sample size. Future studies that are better powered are warranted to confirm and build upon these findings. It is also important to note that this study cohort selected for pregnancy status as participants were only enrolled once pregnant. This is a common limitation among pregnancy cohorts for whom all participants did eventually conceive, compared to the general population, some of whom will never conceive. Consequently, our study population and findings have potentially poor generalizability to sterile couples, who are not represented in our cohort.[42]
While we adjusted for all potential sources of confounding for which we had available data, residual confounding is still a valid concern. Notably, we did not have access to paternal characteristics, which would be informative given that fecundability is a couple-based measure. This is particularly important given delays in conception are often related to male factors and there is evidence that these chemical exposures are associated with semen quality.[13, 14] Relatedly, TTP was recalled and self-reported in this study. To address potential inaccuracy of TTP recalled beyond 12 months, we censored continuous TTP after 12 months and made a binary category for subfecundity to analyze participants who reported conceiving in 12 or more months without using their exact, and potentially imprecise, number of months.[42] Importantly, we included both planned and unplanned pregnancies (the latter being those who experienced contraceptive failure), which is more representative of the general pregnant population.[14, 42]
To minimize exposure misclassification, an ideal study of this nature would prospectively collect and measure chemical concentrations in first-morning, cycle-specific urine samples from the initial pregnancy attempt through conception. Our exposures were collected from spot urine samples taken in the first trimester of pregnancy and then assumed to be representative of the entire TTP window. This may result in exposure misclassification given that bisphenol and phthalates are non-persistent chemicals and exposure/excretion may vary widely from day to day or even over the course of a day.[14, 16] However, greater noise in our exposure measurement is unlikely to explain our observed effects as there is no reason to believe this misclassification would be differential with respect to the outcome, and nondifferential misclassification would only bias toward the null. In fact, we might hypothesize the opposite to be true: participants who struggled to conceive early on may have changed consumer habits to increase their chances of conception, leading to lower exposure concentrations in early pregnancy relative to the entire TTP window.
Finally, our study was conducted among a diverse cohort of pregnant people in New York City. Relative to prior research among predominately non-Hispanic White, European, highly educated populations, this is an underrepresented study population. As the landscape of consumer chemicals is constantly changing, research reflective of the current exposure levels on reproductive health are continuously needed. Furthermore, chemical exposure disproportionately impacts low-income communities of color, not only through the ever-present impacts of structural racism and environmental injustice but also because of the presence of endocrine-disrupting chemicals in personal and household products marketed to minoritized populations.[31, 34, 51] Such observations make studying such research questions in more diverse populations of critical importance. The fact that prior null associations were not replicated in our study might suggest a lack of transportability across populations of varied demographic and socioeconomic contexts.
4.3. Conclusions
In contrast to prior studies that reported mostly null findings, we observed associations of total bisphenols and select phthalates with longer TTP and higher odds of subfecundity that were robust to numerous sensitivity analyses. In the case of bisphenols, we found evidence suggestive of nonlinear effects that were not considered in prior analyses. We also examined newer replacement chemicals and performed a mixtures analysis that found an interaction between bisphenols and LMW phthalates. We hope that future studies conducted among contemporary, diverse populations will be able to replicate our findings and further update our knowledge about the impacts of these ubiquitous chemicals and other environmental pollutants on reproductive health.
Supplementary Material
Supplementary Figure 1: Estimated link function of the time to pregnancy partial-linear single index model
The estimated link function for time to pregnancy does not appear to be linear, which could indicate potential complex higher-order effects or interactions among exposure groups.
Supplementary Figure 2: Estimated link function of the subfecundity partial-linear single index model
The estimated link function for subfecundity does not appear to be linear, which could indicate potential complex higher-order effects or interactions among exposure groups.
Highlights.
Prior research has found inconsistent effects of consumer chemicals on fecundity.
We found bisphenol and phthalate exposure was linked to longer time-to-pregnancy.
These exposures were also associated with higher odds of subfecundity.
We used a partial linear single-index model to investigate chemical mixtures.
We found a potential interaction between these chemicals on time-to-pregnancy.
Acknowledgements
We would like to acknowledge the contributions of all CHES participants who made the findings from this study possible. We also thank the CHES staff, volunteers, Vice Dean for Science Dafna Bar-Sagi, and the NYU Grossman School of Medicine’s Office of Science and Research, as well as Drs. Catherine Manno and David Keefe.
Funding:
NYU CHES is supported by institutional funds of NYU Grossman School of Medicine as well as the NIH Office of the Director (UG3/UH3OD023305). MC received funding from the National Science Foundation Graduate Research Fellowship Program (20-A0-00-1005789). ML, ES, and YW acknowledges support from the National Institute of Environmental Health Sciences (R01ES032808). LGK acknowledges support from the National Institutes of Health/National Institute of Environmental Health Sciences (R00ES030403).
Declaration of interests
Mia Charifson reports financial support was provided by National Science Foundation. Mengling Liu reports financial support was provided by National Institute of Environmental Health Sciences. Eunsil Seok reports financial support was provided by National Institute of Environmental Health Sciences. Yuyan Wang reports financial support was provided by National Institute of Environmental Health Sciences. Leonardo Trasande reports financial support was provided by National Institutes of Health Office of the Director. Linda Kahn reports financial support was provided by National Institute of Environmental Health Sciences. If there are other authors, they declare that they have no known competing financial interests or personal relationships that could have appeared to influence the work reported in this paper.
Footnotes
Publisher's Disclaimer: This is a PDF file of an unedited manuscript that has been accepted for publication. As a service to our customers we are providing this early version of the manuscript. The manuscript will undergo copyediting, typesetting, and review of the resulting proof before it is published in its final form. Please note that during the production process errors may be discovered which could affect the content, and all legal disclaimers that apply to the journal pertain.
Conflicts of Interest: None to declare.
References
- 1.Thoma ME, McLain AC, Louis JF, King RB, Trumble AC, Sundaram R, Buck Louis GM. Prevalence of infertility in the United States as estimated by the current duration approach and a traditional constructed approach. Fertility and Sterility. 2013;99(5):1324-. doi: 10.1016/j.fertnstert.2012.11.037. [DOI] [PMC free article] [PubMed] [Google Scholar]
- 2.Kessler LM, Craig BM, Plosker SM, Reed DR, Quinn GP. Infertility evaluation and treatment among women in the United States. Fertility and Sterility. 2013;100(4):1025–32.e2. doi: 10.1016/J.FERTNSTERT.2013.05.040. [DOI] [PMC free article] [PubMed] [Google Scholar]
- 3.Chandra A, Copen CE, Stephen EH. Infertility service use in the United States: data from the National Survey of Family Growth, 1982–2010. National Health Statistics Report. 2014;73:1–21. [PubMed] [Google Scholar]
- 4.Stephen EH, Chandra A. Updated projections of infertility in the United States: 1995–2025. [DOI] [PubMed]
- 5.Hanson B, Johnstone E, Dorais J, Silver B, Peterson CM, Hotaling J. Female infertility, infertility-associated diagnoses, and comorbidities: a review. Journal of Assisted Reproduction and Genetics. 2017;34(2):167–77. doi: 10.1007/S10815-016-0836-8/TABLES/5. [DOI] [PMC free article] [PubMed] [Google Scholar]
- 6.Luk BHK, Loke AY. The Impact of Infertility on the Psychological Well-Being, Marital Relationships, Sexual Relationships, and Quality of Life of Couples: A Systematic Review. Journal of sex & marital therapy. 2015;41(6):610–25. doi: 10.1080/0092623X.2014.958789. [DOI] [PubMed] [Google Scholar]
- 7.Wu AK, Elliott P, Katz PP, Smith JF. Time Costs of Fertility Care: The Hidden Hardship of Building a Family. Fertility and sterility. 2013;99(7):2025-. doi: 10.1016/J.FERTNSTERT.2013.01.145. [DOI] [PMC free article] [PubMed] [Google Scholar]
- 8.Wise LA, Mikkelsen EM, Sørensen HT, Rothman KJ, Hahn KA, Riis AH, Hatch EE. Prospective study of time to pregnancy and adverse birth outcomes. Fertility and Sterility. 2015;103(4):1065–73.e2. doi: 10.1016/J.FERTNSTERT.2015.01.024. [DOI] [PMC free article] [PubMed] [Google Scholar]
- 9.Messerlian C, MacLagan L, Basso O. Infertility and the risk of adverse pregnancy outcomes: a systematic review and meta-analysis. Human Reproduction. 2013;28(1):125–37. doi: 10.1093/HUMREP/DES347. [DOI] [PubMed] [Google Scholar]
- 10.Bitler M, Schmidt L. Health disparities and infertility: impacts of state-level insurance mandates. Fertility and Sterility. 2006;85(4):858–65. doi: 10.1016/J.FERTNSTERT.2005.11.038. [DOI] [PubMed] [Google Scholar]
- 11.Jackson-Bey T, Morris J, Jasper E, Velez Edwards DR, Thornton K, Richard-Davis G, Plowden TC. Systematic review of racial and ethnic disparities in reproductive endocrinology and infertility: where do we stand today? F&S Reviews. 2021;2(3):169–88. doi: 10.1016/J.XFNR.2021.05.001. [DOI] [Google Scholar]
- 12.Di Renzo GC, Conry JA, Blake J, Defrancesco MS, Denicola N, Martin JN, et al. International Federation of Gynecology and Obstetrics opinion on reproductive health impacts of exposure to toxic environmental chemicals. International Journal of Gynecology & Obstetrics. 2015;131(3):219–25. doi: 10.1016/J.IJGO.2015.09.002. [DOI] [PMC free article] [PubMed] [Google Scholar]
- 13.Green MP, Harvey AJ, Finger BJ, Tarulli GA. Endocrine disrupting chemicals: Impacts on human fertility and fecundity during the peri-conception period. Environmental Research. 2021;194:110694-. doi: 10.1016/J.ENVRES.2020.110694. [DOI] [PubMed] [Google Scholar]
- 14.Hipwell AE, Kahn LG, Factor-Litvak P, Porucznik CA, Siegel EL, Fichorova RN, et al. Exposure to non-persistent chemicals in consumer products and fecundability: a systematic review. Human Reproduction Update. 2019;25(1):51–71. doi: 10.1093/HUMUPD/DMY032. [DOI] [PMC free article] [PubMed] [Google Scholar]
- 15.Mínguez-Alarcón L, Gaskins AJ. Female exposure to endocrine disrupting chemicals and fecundity: a review. Current opinion in obstetrics & gynecology. 2017;29(4):202–11. doi: 10.1097/GCO.0000000000000373. [DOI] [PMC free article] [PubMed] [Google Scholar]
- 16.Kim YR, Pacella RE, Harden FA, White N, Toms LML. A systematic review: Impact of endocrine disrupting chemicals exposure on fecundity as measured by time to pregnancy. Environmental Research. 2019;171:119–33. doi: 10.1016/J.ENVRES.2018.12.065. [DOI] [PubMed] [Google Scholar]
- 17.Pelch K, Wignall JA, Goldstone AE, Ross PK, Blain RB, Shapiro AJ, et al. A scoping review of the health and toxicological activity of bisphenol A (BPA) structural analogues and functional alternatives. Toxicology. 2019;424:152235-. doi: 10.1016/J.TOX.2019.06.006. [DOI] [PubMed] [Google Scholar]
- 18.Calafat AM. The U.S. National Health and Nutrition Examination Survey and human exposure to environmental chemicals. International Journal of Hygiene and Environmental Health. 2012;215:99–101. doi: 10.1016/j.ijheh.2011.08.014. [DOI] [PubMed] [Google Scholar]
- 19.Karwacka A, Zamkowska D, Radwan M, Jurewicz J. Exposure to modern, widespread environmental endocrine disrupting chemicals and their effect on the reproductive potential of women: an overview of current epidemiological evidence. https://doiorg/101080/1464727320171358828. 2017;22(1):2–25. doi: 10.1080/14647273.2017.1358828. [DOI] [PubMed] [Google Scholar]
- 20.Melzer D, Rice NE, Lewis C, Henley WE, Galloway TS. Association of Urinary Bisphenol A Concentration with Heart Disease: Evidence from NHANES 2003/06. PLOS ONE. 2010;5(1):e8673–e. doi: 10.1371/JOURNAL.PONE.0008673. [DOI] [PMC free article] [PubMed] [Google Scholar]
- 21.Metcalfe CD, Bayen S, Desrosiers M, Muñoz G, Sauvé S, Yargeau V. An introduction to the sources, fate, occurrence and effects of endocrine disrupting chemicals released into the environment. Environmental Research. 2022;207:112658-. doi: 10.1016/J.ENVRES.2021.112658. [DOI] [PubMed] [Google Scholar]
- 22.Meeker JD, Sathyanarayana S, Swan SH. Phthalates and other additives in plastics: human exposure and associated health outcomes. Philosophical Transactions of the Royal Society B: Biological Sciences. 2009;364(1526):2097–113. doi: 10.1098/RSTB.2008.0268. [DOI] [PMC free article] [PubMed] [Google Scholar]
- 23.Silva MJ, Barr DB, Reidy JA, Malek NA, Hodge CC, Caudill SP, et al. Urinary levels of seven phthalate metabolites in the U.S. population from the National Health and Nutrition Examination Survey (NHANES) 1999–2000. Environmental Health Perspectives. 2004;112(3):331–8. doi: 10.1289/EHP.6723. [DOI] [PMC free article] [PubMed] [Google Scholar]
- 24.Singh S, Li SSL. Bisphenol A and phthalates exhibit similar toxicogenomics and health effects. Gene. 2012;494(1):85–91. doi: 10.1016/J.GENE.2011.11.035. [DOI] [PubMed] [Google Scholar]
- 25.Buck Louis GM, Sundaram R, Sweeney AM, Schisterman EF, Maisog J, Kannan K. Urinary bisphenol A, phthalates, and couple fecundity: the Longitudinal Investigation of Fertility and the Environment (LIFE) Study. Fertility and Sterility. 2014;101(5):1359–66. doi: 10.1016/J.FERTNSTERT.2014.01.022. [DOI] [PMC free article] [PubMed] [Google Scholar]
- 26.Vélez MP, Arbuckle TE, Fraser WD. Female exposure to phenols and phthalates and time to pregnancy: the Maternal-Infant Research on Environmental Chemicals (MIREC) Study. Fertility and Sterility. 2015;103(4):1011–20.e2. doi: 10.1016/J.FERTNSTERT.2015.01.005. [DOI] [PubMed] [Google Scholar]
- 27.Philips EM, Kahn LG, Jaddoe VWV, Shao Y, Asimakopoulos AG, Kannan K, et al. First Trimester Urinary Bisphenol and Phthalate Concentrations and Time to Pregnancy: A Population-Based Cohort Analysis. The Journal of clinical endocrinology and metabolism. 2018;103(9):3540–7. doi: 10.1210/JC.2018-00855. [DOI] [PMC free article] [PubMed] [Google Scholar]
- 28.Jukic AM, Calafat AM, McConnaughey DR, Longnecker MP, Hoppin JA, Weinberg CR, et al. Urinary Concentrations of Phthalate Metabolites and Bisphenol A and Associations with Follicular-Phase Length, Luteal-Phase Length, Fecundability, and Early Pregnancy Loss. Environmental Health Perspectives. 2015;124(3):321–8. doi: 10.1289/EHP.1408164. [DOI] [PMC free article] [PubMed] [Google Scholar]
- 29.Thomsen AML, Riis AH, Olsen J, Jönsson BAG, Lindh CH, Hjollund NH, et al. Female exposure to phthalates and time to pregnancy: a first pregnancy planner study. Human Reproduction. 2017;32(1):232–8. doi: 10.1093/HUMREP/DEW291. [DOI] [PubMed] [Google Scholar]
- 30.Specht IO, Bonde JP, Toft G, Lindh CH, Jönsson BAG, Jørgensen KT. Serum Phthalate Levels and Time to Pregnancy in Couples from Greenland, Poland and Ukraine. PLOS ONE. 2015;10(3):e0120070–e. doi: 10.1371/JOURNAL.PONE.0120070. [DOI] [PMC free article] [PubMed] [Google Scholar]
- 31.James-Todd TM, Chiu Y-H, Zota AR. Racial/Ethnic Disparities in Environmental Endocrine Disrupting Chemicals and Women’s Reproductive Health Outcomes: Epidemiological Examples Across the Life Course. Current Epidemiology Reports 2016 3:2. 2016;3(2):161–80. doi: 10.1007/S40471-016-0073-9. [DOI] [PMC free article] [PubMed] [Google Scholar]
- 32.Chan M, Mita C, Bellavia A, Parker M, James-Todd T. Racial/Ethnic Disparities in Pregnancy and Prenatal Exposure to Endocrine-Disrupting Chemicals Commonly Used in Personal Care Products. Current Environmental Health Reports. 2021;8(2):98–112. doi: 10.1007/S40572-021-00317-5/TABLES/3. [DOI] [PMC free article] [PubMed] [Google Scholar]
- 33.Nguyen VK, Kahana A, Heidt J, Polemi K, Kvasnicka J, Jolliet O, Colacino JA. A comprehensive analysis of racial disparities in chemical biomarker concentrations in United States women, 1999–2014. Environment International. 2020;137:105496-. doi: 10.1016/J.ENVINT.2020.105496. [DOI] [PMC free article] [PubMed] [Google Scholar]
- 34.Smarr MM, Avakian M, Lopez AR, Onyango B, Amolegbe S, Boyles A, et al. Broadening the Environmental Lens to Include Social and Structural Determinants of Women’s Health Disparities. 2024. doi: 10.1289/EHP12996. [DOI] [PMC free article] [PubMed]
- 35.Trasande L, Ghassabian A, Kahn LG, Jacobson MH, Afanasyeva Y, Liu M, et al. The NYU Children’s Health and Environment Study. European Journal of Epidemiology. 2020;35(3):305–20. doi: 10.1007/s10654-020-00623-6. [DOI] [PMC free article] [PubMed] [Google Scholar]
- 36.Garlantézec R, Warembourg C, Monfort C, Labat L, Pulkkinen J, Bonvallot N, et al. Urinary Glycol Ether Metabolites in Women and Time to Pregnancy: The PELAGIE Cohort. Environmental Health Perspectives. 2013;121(10):1167–73. doi: 10.1289/EHP.1206103. [DOI] [PMC free article] [PubMed] [Google Scholar]
- 37.Cowell W, Jacobson MH, Long SE, Wang Y, Kahn LG, Ghassabian A, et al. Maternal urinary bisphenols and phthalates in relation to estimated fetal weight across mid to late pregnancy. Environment International. 2023;174:107922-. doi: 10.1016/J.ENVINT.2023.107922. [DOI] [PMC free article] [PubMed] [Google Scholar]
- 38.Gaylord A, Kannan K, Lakuleswaran M, Zhu H, Ghassabian A, Jacobson MH, et al. Variability and correlations of synthetic chemicals in urine from a New York City-based cohort of pregnant women. Environmental Pollution. 2022;309:119774-. doi: 10.1016/J.ENVPOL.2022.119774. [DOI] [PMC free article] [PubMed] [Google Scholar]
- 39.Shoaff JR, Calafat AM, Schantz SL, Korrick SA. Endocrine disrupting chemical exposure and maladaptive behavior during adolescence. Environmental Research. 2019;172:231–41. doi: 10.1016/J.ENVRES.2018.12.053. [DOI] [PMC free article] [PubMed] [Google Scholar]
- 40.Ortega-Villa AM, Liu D, Ward MH, Albert PS. New insights into modeling exposure measurements below the limit of detection. Environmental Epidemiology. 2021;5(1). doi: 10.1097/EE9.0000000000000116. [DOI] [PMC free article] [PubMed] [Google Scholar]
- 41.Boeniger MF, Lowry LK, Rosenberg J. Interpretation of urine results used to assess chemical exposure with emphasis on creatinine adjustments: a review. http://dxdoiorg/101080/15298669391355134. 2010;54(10):615–27. doi: 10.1080/15298669391355134. [DOI] [PubMed] [Google Scholar]
- 42.Joffe M, Key J, Best N, Keiding N, Scheike T, Jensen TK. Studying Time to Pregnancy by Use of a Retrospective Design. American Journal of Epidemiology. 2005;162(2):115–24. doi: 10.1093/AJE/KWI172. [DOI] [PubMed] [Google Scholar]
- 43.Joffe M, Villard L, Li Z, Plowman R, Vessey M. Long-term recall of time-to-pregnancy. 1993;60(1). [DOI] [PubMed] [Google Scholar]
- 44.Wang Y, Wu Y, Jacobson MH, Lee M, Jin P, Trasande L, Liu M. A family of partial-linear single-index models for analyzing complex environmental exposures with continuous, categorical, time-to-event, and longitudinal health outcomes. Environmental health: a global access science source. 2020;19(1). doi: 10.1186/S12940-020-00644-4. [DOI] [PMC free article] [PubMed] [Google Scholar]
- 45.Sterne JAC, White IR, Carlin JB, Spratt M, Royston P, Kenward MG, et al. Multiple imputation for missing data in epidemiological and clinical research: potential and pitfalls. The BMJ. 2009;338(7713):157–60. doi: 10.1136/BMJ.B2393. [DOI] [PMC free article] [PubMed] [Google Scholar]
- 46.Heindel JJ, Belcher S, Flaws JA, Prins GS, Ho SM, Mao J, et al. Data integration, analysis, and interpretation of eight academic CLARITY-BPA studies. Reproductive Toxicology. 2020;98:29–60. doi: 10.1016/J.REPROTOX.2020.05.014. [DOI] [PMC free article] [PubMed] [Google Scholar]
- 47.Li MX, Yeung JMY, Cherny SS, Sham PC. Evaluating the effective numbers of independent tests and significant p-value thresholds in commercial genotyping arrays and public imputation reference datasets. Human Genetics. 2012;131(5):747–56. doi: 10.1007/S00439-011-1118-2/TABLES/6. [DOI] [PMC free article] [PubMed] [Google Scholar]
- 48.Team RC. R: A language and environment for statistical computing. Vienna, Austria: R Foundation for Statistical Computing; 2023. [Google Scholar]
- 49.Czubacka E, Wielgomas B, Klimowska A, Radwan M, Radwan P, Karwacka A, et al. Urinary Bisphenol A Concentrations and Parameters of Ovarian Reserve among Women from a Fertility Clinic. International journal of environmental research and public health. 2021;18(15). doi: 10.3390/IJERPH18158041. [DOI] [PMC free article] [PubMed] [Google Scholar]
- 50.Basso CG, de Araújo-Ramos AT, Martino-Andrade AJ. Exposure to phthalates and female reproductive health: A literature review. Reproductive toxicology (Elmsford, NY). 2022;109:61–79. doi: 10.1016/J.REPROTOX.2022.02.006. [DOI] [PubMed] [Google Scholar]
- 51.Brulle RJ, Pellow DN. Environmental Justice: Human Health and Environmental Inequalities. http://dxdoiorg/101146/annurevpublhealth27021405102124. 2006;27:103–24. doi: 10.1146/annurev.publhealth.27.021405.102124. [DOI] [PubMed] [Google Scholar]
Associated Data
This section collects any data citations, data availability statements, or supplementary materials included in this article.
Supplementary Materials
Supplementary Figure 1: Estimated link function of the time to pregnancy partial-linear single index model
The estimated link function for time to pregnancy does not appear to be linear, which could indicate potential complex higher-order effects or interactions among exposure groups.
Supplementary Figure 2: Estimated link function of the subfecundity partial-linear single index model
The estimated link function for subfecundity does not appear to be linear, which could indicate potential complex higher-order effects or interactions among exposure groups.