

Abstract
Introduction:
Determining industry of decedents and victim-perpetrator relationships is crucial to inform and evaluate occupational homicide prevention strategies. In this study, we examine occupational homicide rates in North Carolina (NC) by victim characteristics, industry, and victim-perpetrator relationship from 1992 to 2017.
Methods:
Occupational homicides were identified from records of the NC Office of the Chief Medical Examiner system and the NC death certificate. Sex, age, race, ethnicity, class of worker, manner of death, victim-perpetrator relationship, and industry were abstracted. Crude and age standardized homicide rates were calculated as the number of homicides that occurred at work divided by an estimate of worker-years (w-y). Rate ratios and 95% CIs were calculated, and trends over calendar time in occupational homicide rates were examined overall and by industry.
Results:
456 homicides over 111,573,049 w-y were observed. Occupational homicide rates decreased from 0.82 per 100,000 w-y for the period 1992–1995 to 0.21 per 100,000 w-y for the period 2011–2015, but increased to 0.32 per 100,000 w-y in the period 2016–2017. Fifty five percent (252) of homicides were perpetrated by strangers. Taxi drivers experienced an occupational homicide rate that was 110 times (95%CI: 76.52, 160.19) the overall occupational homicide rate in NC; however, this rate declined by 76.5% between 1992–2017. Disparities were observed among workers 65+ years old, racially and ethnically minoritized workers, and self-employed workers.
Conclusion:
Our findings identify industries and worker demographics that experienced high occupational homicide fatality rates. Targeted and tailored mitigation strategies among vulnerable industries and workers are recommended.
INTRODUCTION
Workplace violence resulting in worker fatalities imposes significant social, economic, health care, and litigation costs.[1] The National Safe Workplace Initiative suggests that workplace violence leads to an approximately $4 billion expenditure each year,[2] which does not account for the negative psychological impact on surviving employees, victims’ families, and communities. Approximately 9–14% of all occupational fatalities at work are due to homicides,[3,4] second only to motor vehicle crashes.[5]
Epidemiologic studies from North Carolina (NC) have previously reported occupational homicides by industry,[1] employee class of worker (i.e., self, private, or government employed),[6] and racial disparities[7] among workers between 1978–1991. Prior studies did not examine circumstantial information, including victim-perpetrator relationship and firearm use among occupational homicide cases, which are important to target prevention programs to the most vulnerable workers.[8] Since the last descriptive epidemiologic study by industry in NC, major economic and demographic shifts have occurred. Industries have shifted away from manufacturing jobs to service industries. Additionally, the state population has increased from 6.6 to 10.4 million people, with an annual growth rate of 8.8% in Hispanic residents between 1990 to 2020.[9] Due to these changes, an updated epidemiologic profile of occupational homicides by industry, worker, and victim-perpetrator relationship was undertaken.
The purpose of this study is to examine occupational homicide rates in NC by victim characteristics, industry, and victim-perpetrator relationship between 1992 and 2017. This epidemiologic study will provide an update to previous literature to inform workplace policy and safety intervention programs in a state with changing demographics and industries.
METHODS
Study Design and Data
We conducted a retrospective cohort study to examine trends of occupational homicide deaths in NC using data abstracted from the NC Office of the Chief Medical Examiner (OCME) system from 1992–2017. All subjects in the study were deceased so informed consent was not necessary following review by the University of North Carolina Office of Human Research Ethics. Occupational homicides were defined as an intentional fatality that occurred as a result of an assault on a NC worker engaged in legal work for pay. OCME data consists of medical examiner (ME) investigative reports of fatal injuries that occur in NC’s 100 counties. MEs identify the cause and circumstances of each death, determine if the fatality occurred “on the job,” and fill out the official death certificate. To increase sensitivity, we combined the NC death certificate data from the NC State Center for Health Statistics (SCHS) along with the OCME data. The death certificate data also include an “at work” flag. Any death that was either flagged “on the job” in the OCME data or “at work” on the death certificate and had cause of death listed as homicide on the death certificate was eligible. In addition, we sought out news reports, court transcripts, and publicly available information about the deaths. If a fatality was “flagged” as occupational in either database, the case was eligible for review. Cases where only one of the two flags was present were adjudicated by at least two study investigators and the project manager before making a determination of “occupational” death. We excluded deaths among active-duty military members.
Patient and public involvement statement
No patients were involved in setting the research question, or design. Study results are shared with the US National Institute for Occupational Safety and Health Administration (OSHA), North Carolina OCME, and the Injury and Violence Prevention Branch of the Division of Public Health in the NC Department of Health and Human Services, who engage with employers, representatives, members of the public, and advocacy groups. Findings are communicated with advisory bodies to inform patient and public materials.
Variables
Victim Characteristics
Sex was classified as male, female. Age was abstracted in integer years and subsequently categorized as 18–24, 25–34, 35–44, 45–54, 55–64, and 65+ years old. Race (white, black/African American, American Indian or Alaska Native, Asian and Pacific Islander, and other race), and Ethnicity (Hispanic, Non-Hispanic) were originally abstracted as separate variables and subsequently reclassified as Hispanic, non-Hispanic black, non-Hispanic white, and a combined group of non-Hispanic, non-black, non-white to avoid cross-classification of Hispanic victims by race in accordance with recommendations[10] and to allow robust interpretation of estimates from groups with small number of outcomes. Class of worker consisted of self-employed, privately employed, or government employed. Industry of employment at time of fatal injury of the victim was abstracted and coded according to the United States Census year 2000 guidelines.[11]
Victim-Perpetrator Relationship
Information on the victim-perpetrator relationship was abstracted from OCME case files and supplemental sources and classified as ‘stranger’, ‘customer or client’, ‘co-worker’, ‘personal relation’, or ‘unknown.’[12] If the victim-perpetrator relationship included two categories (e.g. a co-worker and a personal relation), these cases were classified into the category deemed the closest degree of relationship (e.g., a case listed as ‘customer or client’ and ‘stranger’ was classified as a customer or client).
Population at Risk
Annual estimates of the NC work force were derived from the 1990, 2000 and 2010 decennial US Census. Estimates were calculated for age group, sex (male, female), race (white, black, or other), ethnicity (Hispanic, non-Hispanic), and industry groups (51 groups based on census codes). These population estimates were used to approximate worker-years (w-y) at risk in each stratum overall and by calendar year.
Statistical Analyses
Data were assessed for missingness prior to analyses, with no missingness observed for all variables. Homicides by demographics, firearm use, and time frame (1992–1995, 1996–2000, 2001–2005, 2006–2010, 2011–2015, 2016–2017) were reported as counts and percentages.
Homicide rates were calculated for categories of sex, age group, race/ethnicity, and class of worker, where the rate was defined as the number of occupational homicides observed in that group divided by an estimate of the worker-years (w-y) at risk, expressed as events per 100,000 worker years. For analyses stratified by industry, crude and age standardized homicide rates were calculated as the number of homicides at work divided by an estimate of the NC population employed in the particular industry per 100,000 worker years. Rate ratios and 95% confidence intervals (CIs) were calculated for the specified industry compared to all industries. Strata that included less than 5 cases were suppressed in the tables to ensure results were not identifiable. Victim-perpetrator relationship was reported as count and percentages by industry. All data management and statistical analyses were performed in SAS version 9.4 (SAS Institute, Cary NC). The Strengthening the Reporting of Observational Studies in Epidemiology (STROBE) guidelines were used for reporting.[13]
RESULTS
Between 1992 and 2017, 456 homicide deaths occurred over 111,573,049 w-y. Occupational homicide rates decreased over the study period, from 0.82 per 100,000 w-y during 1992–1995 to 0.21 per 100,000 w-y during 2011–2015, but increased to 0.32 per 100,000 w-y during 2016–2017. The largest numbers of homicides were observed among males (378, 83%), people aged 35–44 years (125, 27%), non-Hispanic white (289, 63%), and privately employed (263, 58%) (Table 1). However, the highest homicide rates were among self-employed workers (1.22 per 100,000 w-y) and workers 65 years and older (0.90 per 100,000 w-y) (Table 1). All racially and ethnically minoritized groups demonstrated higher rates of homicide compared to white non-Hispanic workers (Hispanic: 0.70 per 100,000 w-y; non-Hispanic black: 0.53 per 100,000 w-y; non-Hispanic, non-white, non-black: 0.60 per 100,000 w-y, white non-Hispanic workers: 0.36 per 100,000 w-y), with Hispanic workers experiencing nearly two times the rate of occupational homicide compared to non-Hispanic white workers (1.94, 95% CI: 0.95, 3.96) (Table 1). Firearm use was reported in 81% (369) of all occupational homicide deaths (Appendix Table 1).
Table 1:
Victim Characteristics of Occupational Homicide Deaths in North Carolina, 1992–2017
| Characteristic | N (%) | Worker-Years | Rate per 100K worker-years | Rate Ratio | |
|---|---|---|---|---|---|
| Calendar period | 1992–1995 | 115 (25) | 13,940,991 | 0.82 | 1.0 |
| 1996–2000 | 99 (22) | 18,696,593 | 0.53 | 0.63 (0.48, 0.82) | |
| 2001–2005 | 80 (18) | 20,408,833 | 0.39 | 0.47 (0.35, 0.63) | |
| 2006–2010 | 76 (17) | 22,609,774 | 0.34 | 0.40 (0.30, 0.54) | |
| 2011–2015 | 53 (12) | 25,125,266 | 0.21 | 0.25 (0.18, 0.35) | |
| 2016–2017 | 35 (8) | 10,791,592 | 0.32 | 0.38 (0.26, 0.56) | |
| Sex | Male | 378 (83) | 58,257,318 | 0.65 | 1.0 |
| Female | 78 (17) | 51,207,112 | 0.15 | 0.23 (0.18, 0.30) | |
| Age | <25 years | 44 (10) | 13,575,189 | 0.32 | 1.0 |
| 25–34 years | 92 (21) | 25,579,298 | 0.36 | 1.11 (1.04, 1.18) | |
| 35–44 years | 125 (27) | 29,157,868 | 0.43 | 1.32 (1.25, 1.40) | |
| 45–54 years | 87 (19) | 25,436,509 | 0.34 | 1.06 (0.99, 1.12) | |
| 55–64 years | 72 (16) | 11,719,994 | 0.61 | 1.90 (1.81, 1.98) | |
| 65+ years | 36 (8) | 3,995,572 | 0.90 | 2.78 (2.67, 2.89) | |
| Race and ethnicity | Non-Hispanic White | 289 (63) | 79,850,257 | 0.36 | 1.0 |
| Non-Hispanic Black | 106 (23) | 20,169,998 | 0.53 | 1.45 (1.16, 1.82) | |
| Hispanic | 31 (6) | 4,424,975 | 0.70 | 1.94 (0.95, 3.96) | |
| Non-Hispanic, non-white, non-black | 30 (7) | 5,019,200 | 0.60 | 1.65 (1.07, 2.56) | |
| Native American* | 5 | - | - | ||
| Asian* | 25 | - | - | ||
| Class of worker | Privately employed | 263 (58) | 82,352,763 | 0.32 | 1.0 |
| Government employed | 56 (12) | 15,926,684 | 0.35 | 1.10 (0.81, 1.50) | |
| Self employed | 137 (30) | 11,184,983 | 1.22 | 3.8 (3.17, 4.64) | |
Population estimates for the denominator (worker-years) were not available for Native American, Asian individuals
Homicide By Industry
The occupational homicide rate experienced in the taxi industry (crude: 39.7 per 100,000 w-y; industry standardized: 46.12 per 100,000 w-y) was over 110 times (95% CI: 76.52, 160.19) the overall occupational homicide rate in NC (Table 2); however, this rate declined markedly over the study period by 76.5% (Figure 1). Homicide rates were also relatively high among gasoline service station workers (crude: 18.5 per 100,000 w-y; age standardized: 20.0 per 100,000 w-y; standardized RR: 48.0, 95% CI: 35.2, 65.4), and workers in grocery, dairy, and food store industries (crude: 3.4 per 100,000 w-y; age standardized: 3.7 per 100,000 w-y; age standardized RR: 8.8, 95% CI: 6.9, 11.3). Gasoline service station workers demonstrated a minimal reduction of occupational homicide rates (12.9%), whereas grocery, dairy, and food store workers saw an 88.8% decline over the study time frame. (Figure 1). Workers 65 years and older experienced high incidence of occupational homicide in the grocery, dairy, and food store industry (5.8 per 100,000 w-y) or in the general retail trade industry (2.79 per 100,000 w-y) (Appendix Table 2). Crude homicide rates among self-employed gasoline service station workers (self-employed: 48.7 per 100,000 w-y; privately employed: 14.8 per 100,000 w-y) and self-employed workers in grocery, dairy, and food store industries (self-employed: 28.6 per 100,000 w-y; privately employed: 1.87 per 100,000 w-y) were higher than privately employed workers (Appendix Table 3). Table 2 provides further occupational homicide rate comparisons by industry.
Table 2:
Incidence of Homicide by Industry
| Industry | n | Worker Years | Crude Rate | Standardized Rate (95% CI) | Standardized RR |
|---|---|---|---|---|---|
| Grocery, Dairy, & Food Stores- Retail | 75 | 2,204,413 | 3.4 | 3.68 (2.81, 4.54) | 8.82 (6.91, 11.27) |
| Eating & Drinking Places- Retail | 56 | 4,724,083 | 1.19 | 1.61 (1.15, 2.07) | 3.87 (2.93, 5.11) |
| Justice, Public Order, & Safety | 47 | 1,936,155 | 2.43 | 2.61 (1.80, 3.43) | 6.28 (4.65, 8.48) |
| General Retail Trade | 46 | 8,016,534 | 0.57 | 0.54 (0.38, 0.70) | 1.3 (0.96, 1.76) |
| Gasoline Service Stations- Retail | 44 | 238,521 | 18.45 | 19.99 (13.93, 26.06) | 48 (35.23, 65.40) |
| Transport- Taxi | 30 | 75,555 | 39.71 | 46.12 (28.64, 63.61) | 110.71 (76.52, 160.19) |
| Finance, Insurance, & Real Estate | 21 | 6,374,051 | 0.33 | 0.34 (0.19, 0.46) | 0.81 (0.53, 1.26) |
| Construction | 12 | 9,283,708 | 0.13 | 0.13 (0.06, 0.21) | 0.31 (0.18, 0.56) |
| Auto Sales & Services- Retail & Repair | 12 | 2,265,559 | 0.53 | 0.52 (0.22, 0.82) | 1.25 (0.71, 2.22) |
| Personal Services | 11 | 2,094,897 | 0.53 | 0.57 (0.23, 0.90) | 1.36 (0.78, 2.47) |
| Professional & Related Services | 11 | 27,125,926 | 0.04 | 0.04 (0.02, 0.07) | 0.1 (0.05, 0.18) |
| Wholesale Trade | 9 | 3,595,792 | 0.25 | 0.24 (0.08, 0.40) | 0.58 (0.30, 1.13) |
| Entertainment & Recreation Services | 9 | 1,174,008 | 0.77 | 0.98 (0.32, 1.64) | 2.34 (1.21, 4.53) |
| Lodging Services | 8 | 943,037 | 0.85 | 0.98 (0.29, 1.66) | 2.34 (1.16, 4.71) |
| Business & Repair Services | 7 | 4,026,242 | 0.17 | 0.17 (0.04, 0.30) | 0.41 (0.19, 0.86) |
| Warehouse, Storage, & Transport SVCS | 6 | 816,021 | 0.74 | 0.75 (0.15, 1.35) | 1.8 (0.80, 4.03) |
| Agriculture | 5 | 1,218,537 | 0.41 | 0.43 (0.05, 0.81) | 1.04 (0.43, 2.51) |
| Printing & Publishing | 5 | 1,061,344 | 0.47 | 0.48 (0.05, 0.91) | 1.15 (0.48, 2.78) |
| Detective & Protective Services | 5 | 387,203 | 1.29 | 1.38 (0.16, 2.59) | 3.31 (1.37, 7.98) |
95% CI, 95% Confidence Interval; RR, Rate Ratio; MFG, Manufacturing; Prod, Production; Misc, Miscellaneous Age Standardized RR= Select Industry standardized RR/standardized RR combined industries
Agriculture Services, Fishing, Hunting & Trapping, Mining & Oil, Tobacco Manufactures, Apparel & Finished Textile Prod-MFG, Paper & Allied Prod-MFG, Sawmills Planing & Misc Wood Prod-MFG, Wood Buildings & Mobile Homes - MFG, Primary Metal-MFG, Computer, Medical, ETC, Equip-MFG, Transport- Railroad, Water, Air, Auto repair & related services: 0 occupational homicides over 9,493,493 w-y
Figure 1.
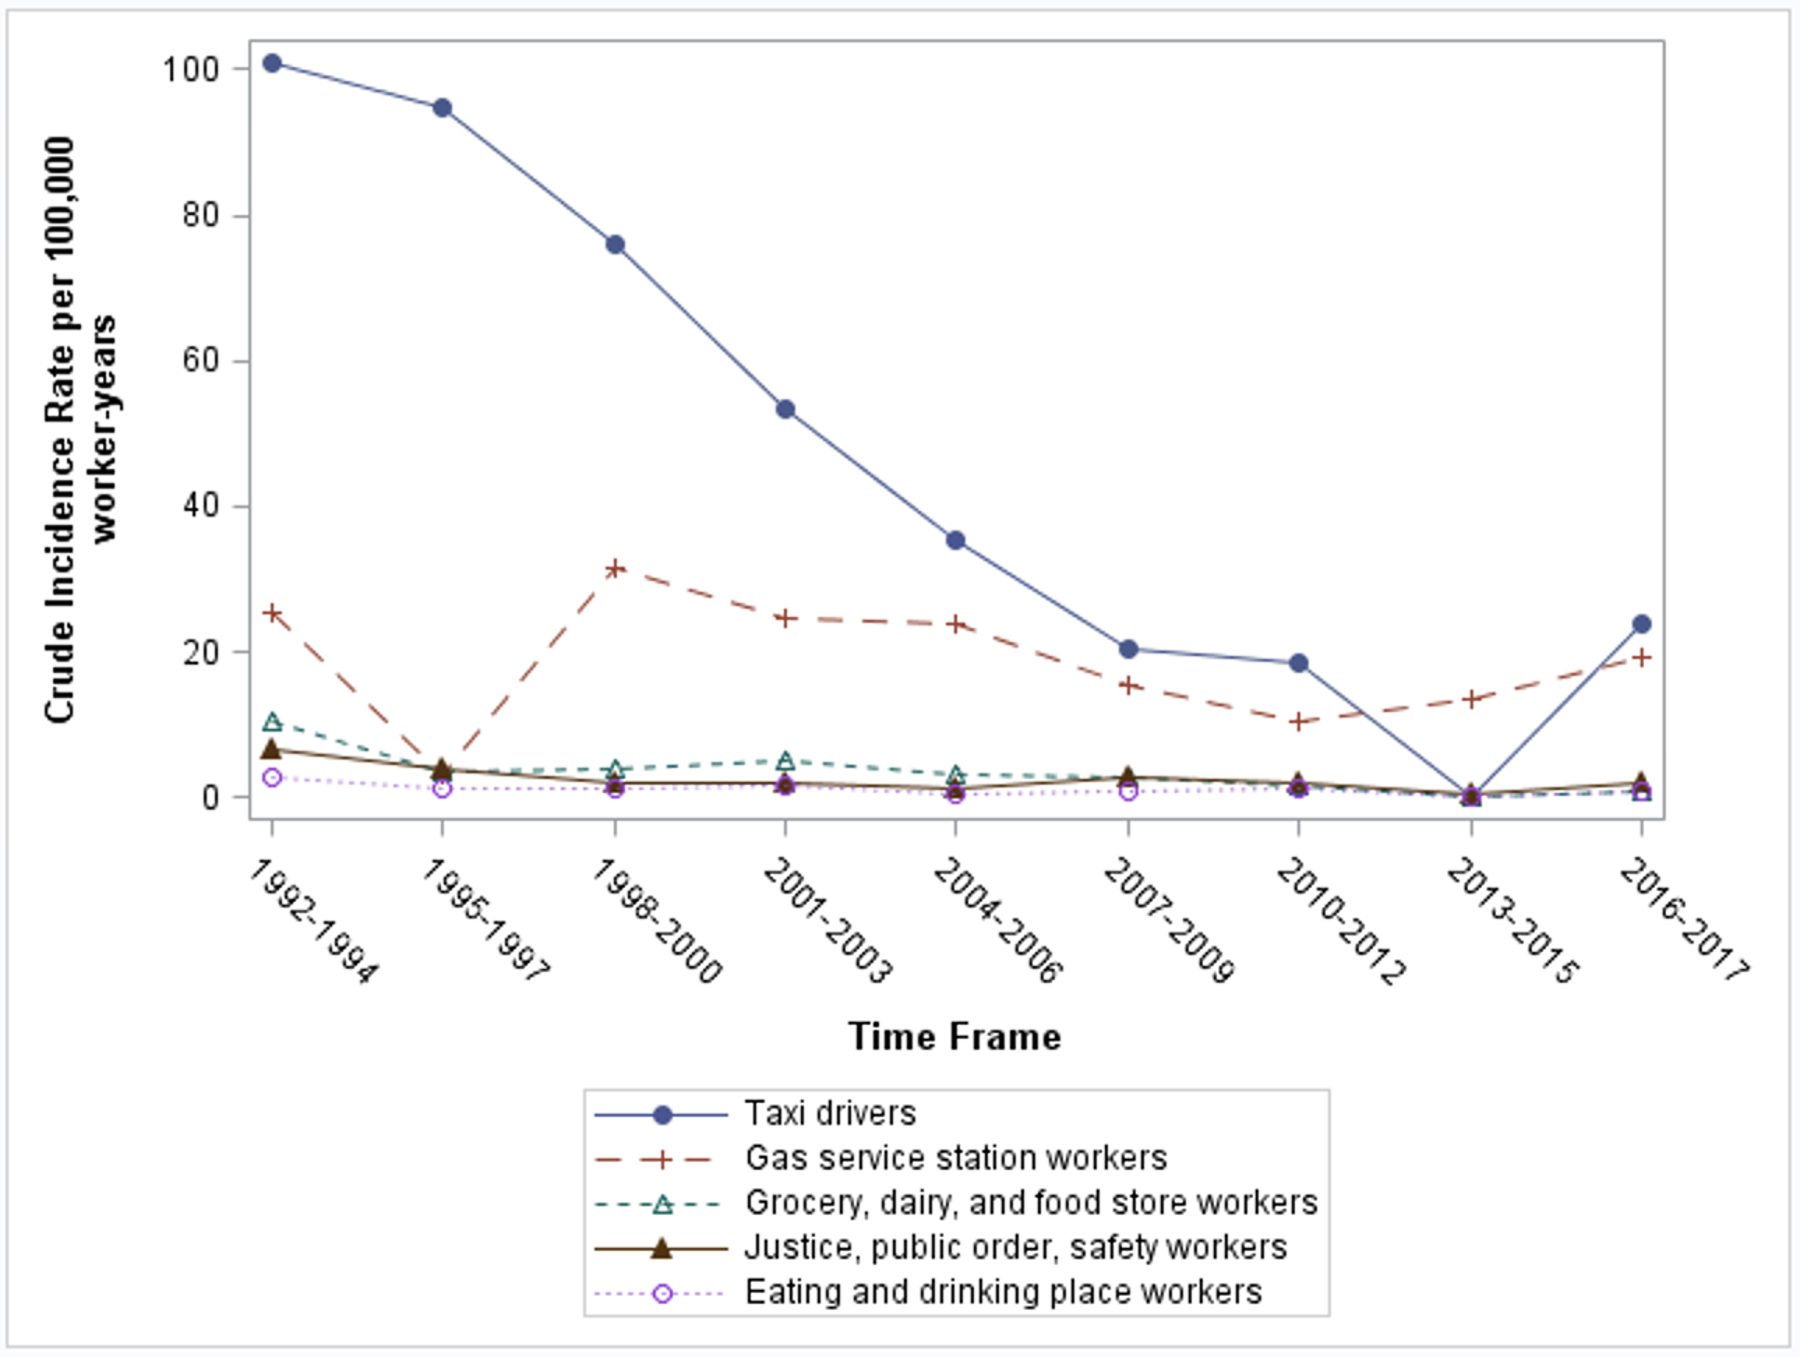
Occupational homicide mortality trends among top five most vulnerable industries.
Victim-Perpetrator Relationship
Across all industries, most occupational homicides were perpetrated by strangers (252, 55%), followed by customers or clients (12%), personal acquaintances (10%), and co-workers (9%) (Appendix Table 5). This was consistent among the industries with the highest incidence rates (grocery, dairy, and food store workers: 59, 79% stranger v-p relationship; gasoline service station workers: 39, 89%) with the exception of taxi drivers where customers or clients were most common (11, 37%), followed by strangers (10, 33%). (Appendix Table 5). In approximately 13% of occupational homicides, there was insufficient information to classify the victim-perpetrator relationship.
DISCUSSION
In NC between 1992 to 2017, occupational homicide rates declined from 0.82 per 100,000 w-y in 1992–1995 to 0.21 per 100,000 w-y during 2011–2015, before an upwards trend was observed, increasing to 0.32 per 100,000 w-y during 2016–2017. Despite this decline, individuals employed in the taxi, gas station, grocery, dairy, and food store industries are still experiencing high rates of homicides compared to combined industry rates. Workers over the age of 65 years old and racially and ethnically minoritized workers, had the highest rates of occupational homicides. Further disparities are noted among self-employed workers, particularly workers employed in the gas station, and grocery, dairy, and food store industries compared to privately employed workers in the same industry.
Overall Homicide Trends
Previous findings of occupational homicide rates in NC demonstrated 0.83 homicides per 100,000 w-y between 1977 and 1991.[1] This is similar to the incidence rate noted between 1992–1995 (0.81 per 100,000 w-y), but by 2011–2015, occupational homicide rates reached the lowest observed rate at 0.21 per 100,000 w-y. Similar trends were observed nationally by the Bureau of Justice Statistics, which observed the period 1992–2019 and reported that peak occupational homicide rates occurred in 1994 with 1,080 homicides, but dropped 58% by 2019.[14] However, the current study demonstrated a slight increase in occupational homicides during 2016–2017, similar to national trends that have found an 11% increase in occupational homicides from 2014–2019.[14] Firearm use continues to be the lethal weapon used in more than 80% of occupational homicides with over half of these crimes committed by a stranger. Previous literature suggests that workplace homicides with a firearm have increased 16.4% between 2014 and 2015, and an additional 11.4% between 2015 and 2016.[8] These workplace homicides committed by a stranger may be the result of robberies.[8] Additionally, a 21% budget reduction for the Department of Labor in 2017, and the elimination of OSHA’s worker safety and health training program in March 2017 was observed.[8] Furthermore, the general public’s access to firearms has increased since the mid 1990s.[8] From 1994–1998, employers in NC that permitted employees to carry a firearm demonstrated five times the odds of an occupational homicide event.[15] Other potential contributors that have been documented include increased substance use,[16] and economic challenges contributing to income in-equality.[17] Thus, the combination of budgetary cuts for health and worker safety, increased access to firearms, substance use, and economic challenges may in part explain the increase in occupational homicide during the 2016–2017 timeframe. Due to these factors, continued monitoring is needed to determine if occupational homicides trend down or will continue to rise to inform policy.
Homicide Rate by Industry
Although an overall decline in occupational homicides was noted across the study time frame, disparities between industries persisted. Taxi drivers experienced a lower crude (39.7 per 100,000 w-y) and standardized (46.12 per 100,000 w-y) rate of occupational homicide compared to previous reported incidence rates between 1979–1991 (66.1 per 100,000 w-y),[1] but still experience 110 times the rate of homicides compared to all industries in NC. However, this rate declined by 76.5% over the study time frame. Similar nationwide declines were observed between 1993–2002.[3] NIOSH and OSHA have provided non-mandatory recommendations to minimize homicides among taxi drivers, including maintaining a well-lit interior, removing unneeded signage, minimizing cash exchange, and bullet resistant barrier and camera installation.[18] Previous studies that investigated camera system installation mandates saw a significant reduction in homicides.[19] Although NC does not have any laws mandating the use of a camera system,[20] individual taxi companies[21] and local municipalities[22] adopted camera systems during the study time frame, which may have influenced the decline, along with possible adoption of NIOSH And OSHA recommendations.
Gas station worker homicide rates remain elevated compared to previous national estimates between 1980–1989, (1980–1989: 5.56 per 100,000 w-y; 1991–2017: 20.0 per 100,000 w-y).[23] In contrast, although grocery, dairy, and food store workers are vulnerable to homicides, the rate appears to be declined by 88.8% over the study time frame. In both industries, 79–89% of homicides were committed by strangers, despite declines in homicides committed by a stranger in previous literature across aggregate industry data.[3] Self-employed persons in these industries are at a higher risk of violent crime.[24] Other risk factors identified in this worker population include limited entrance visibility, cash availability, violent incident history, and no bullet-resistant shielding, security cameras, or robbery prevention employee training.[24,25] Compared to larger, privately owned businesses, self-employed businesses may have less access to prevention programs and suffer larger personal financial losses when violent acts occur. However, intervention programs aimed at self-employed liquor stores in California that addressed these risk factors demonstrated a 20–87.1% reduction of all types of crime pre-post intervention.[25] Other interventions that have led to a reduction in crime include de-escalation training for employees, increased visibility of store fronts, and surveillance camera installation.[26] Given higher stranger-perpetrated homicide rates among self-employed workers in the gas station and grocery, food, and dairy store industries, researchers and policymakers should consider aforementioned strategies that target these sub-sectors of workers.
Occupational Homicide and Age
Workers 65 years or older demonstrated the highest rate of occupational homicide by age group. Previous literature has demonstrated higher occurrence of injuries among older workers across various industries.[27,28] Although this group makes up a small proportion of the working population, these workers may be more vulnerable to work place violence.[27,28] The proportion of older workers have gradually increased overtime in NC.[29] Older workers who experienced negative financial implications (i.e., shifting industries from previous trades, applying for a secondary job due to financial losses) may be predisposed to work place violence with re-entry into the workplace. Furthermore, the older worker may enter industries that are vulnerable to occupational homicides.[27,28] In particular, this study demonstrated a high rate of occupational homicide among grocery, dairy, and food store workers (5.8 per 100,000 w-y). Continued data monitoring is needed to determine if the current industry trends continue, or if further age disparities across other industries arise.
Occupational Homicide and Race, Ethnicity
Racially and ethnically minoritized workers, particularly Hispanic workers, experienced the highest rate of occupational homicide, with nearly two times the rate of homicide compared to non-Hispanic white workers. Black and Hispanic individuals have historically worked in riskier work environments, with higher rates of fatal occupational injury in NC from 2000–2017.[30] Similarly, the US Bureau of Labor Statistics found that Hispanic and black workers have the highest fatality rates compared to non-Hispanic white workers.[31,32,33] These work place deaths most commonly occur among jobs deemed to be the most physically demanding, such as construction and agriculture. [30,31] However, these physically demanding jobs were not among industries most vulnerable to occupational homicides. Yet, Hispanic workers were still more vulnerable to homicides on the job compared to non-Hispanic white workers. Similarly, non-Hispanic black workers, and those representing minoritized racial groups had higher workplace homicide rates than non-Hispanic whites in NC. Future research is needed to determine which specific industries demonstrate racial disparities to better target prevention policies among racial minority groups.
Limitations
Our study has limitations. First, this surveillance data is limited to information abstracted from administrative data, and therefore cannot be used to make inferences about multiple factors that may contribute to occupational homicide risk (i.e., employee access to firearm). Second, documentation bias may be present in the medical examiners’ documentation of race and ethnicity.[34] Those from minoritized racial and ethnic backgrounds may be underrepresented or misclassified. Third, due to the low numbers of homicides across industries (i.e. less than 5 homicides), some industry, age group, and race and ethnicity by industry strata were not reported to ensure de-identification is maintained. Fourth, for the strata of industry where low numbers of occupational homicide occurred with large census estimates, wide confidence intervals were observed. Confidence intervals were estimated using standardized methods for observational studies, but these methods are based on methods that assume a probability sample, such as simple random sampling. Our population count data represents a full census of workers, but out counts of observed homicides come from a separate source (OCME system). Thus, the statistical imprecision in these estimates does not reflect uncertainty in the number of occupational homicides observed.
CONCLUSION
This study documented that occupational homicide rates have declined between 1992 to 2017, though an increase was noted in the 2016 to 2017 timeframe. This increase from 2016 to 2017 suggests further monitoring is needed as policy around firearms, substance use, and economic factors evolve. Specific industries and worker demographics, including self-employed, older, and racialized minority workers, experienced high occupational homicide fatality rates compared to privately employed, non-Hispanic white, and younger counterparts. Targeted and tailored mitigation strategies among vulnerable workers are recommended.
Supplementary Material
What is already known on this topic:
Previous literature provided a robust description of the epidemiology of occupational homicides in North Carolina between 1977–1991, highlighting vulnerable industries and victim characteristics.
What this study adds:
North Carolina has seen profound changes in economic and demographic factors that influence worker safety, including workplace violence initiatives. This study demonstrated decline in occupational homicide until the period 2016–2017, indicating a need for continued monitoring. This study highlights industries and vulnerable populations who are still vulnerable to occupational homicide in the state of North Carolina.
How this study might affect research, practice or policy:
This study aids in targeting and tailoring mitigation programs among specific industries, older workers, racially and ethnically minoritized workers, and self-employed workers.
ACKNOWLEDGEMENTS
This study was supported by award R01 OH011256–01A1 from the National Institute for Occupational Safety and Health. The University of North Carolina Injury Prevention Research Center is partially supported by award R49/CE002479 from the National Center for Injury Prevention and Control, Centers for Disease Control and Prevention.
The authors would like to thank the Office of the Chief Medical Examiner, the North Carolina Department of Health and Human Services, and the State Centre for Health Statistics for providing mortality data.
Funding, Financial Disclosure:
This study was supported by awards T42 OH008673 and R01 OH011256 from the National Institute for Occupational Safety and Health. The University of North Carolina Injury Prevention Research Center is partially supported by award R49/CE002479 from the National Center for Injury Prevention and Control, Centers for Disease Control and Prevention. Mortality data were provided by the Office of the Chief Medical Examiner, North Carolina Department of Health and Human Services.
Author ASM is supported additionally by NIOSH T42OH008673.
Footnotes
All authors report no further financial disclosures or conflicts of interest.
REFERENCES
- 1.Moracco KE, Runyan CW, Loomis DP, Wolf SH, Napp D, Butts JD. Killed on the clock: A population-based study of workplace homicide, 1977–1991. American Journal of Industrial Medicine. Published online June 1, 2000. [DOI] [PubMed] [Google Scholar]
- 2.Breaking Point: The Workplace Violence Epidemic and What to Do About It | Office of Justice Programs. Accessed March 18, 2023. https://www.ojp.gov/ncjrs/virtual-library/abstracts/breaking-point-workplace-violence-epidemic-and-what-do-about-it [Google Scholar]
- 3.Hendricks SA, Jenkins EL, Anderson KR. Trends in workplace homicides in the U.S., 1993–2002: a decade of decline. Am J Ind Med. 2007;50(4):316–325. doi: 10.1002/ajim.20442 [DOI] [PubMed] [Google Scholar]
- 4.Homicides and other workplace assaults by gender in 2019 : The Economics Daily: U.S. Bureau of Labor Statistics. Accessed March 18, 2023. https://www.bls.gov/opub/ted/2021/homicides-and-other-workplace-assaults-by-gender-in-2019.htm [Google Scholar]
- 5.Census of Fatal Occupational Injuries (CFOI) - Current and Revised Data : U.S. Bureau of Labor Statistics. Accessed March 18, 2023. https://www.bls.gov/iif/fatal-injuries-tables.htm [Google Scholar]
- 6.Mirabelli MC, Loomis D, Richardson DB. Fatal occupational injuries among self-employed workers in North Carolina. Am J Ind Med. 2003;44(2):182–190. doi: 10.1002/ajim.10244 [DOI] [PMC free article] [PubMed] [Google Scholar]
- 7.Loomis D, Richardson D. Race and the risk of fatal injury at work. Am J Public Health. 1998;88(1):40–44. doi: 10.2105/ajph.88.1.40 [DOI] [PMC free article] [PubMed] [Google Scholar]
- 8.Doucette ML, Bulzacchelli MT, Frattaroli S, Crifasi CK. Workplace homicides committed by firearm: recent trends and narrative text analysis. Inj Epidemiol. 2019;6:5. doi: 10.1186/s40621-019-0184-0 [DOI] [PMC free article] [PubMed] [Google Scholar]
- 9.North Carolina population by year, county, race, & more | USAFacts. Accessed March 18, 2023. https://usafacts.org/data/topics/people-society/population-and-demographics/our-changing-population/state/north-carolina?endDate=2020-01-01&startDate=1990-01-01 [Google Scholar]
- 10.Bonham VL, Green ED, Pérez-Stable EJ. Examining how race, ethnicity, and ancestry data are used in biomedical research. JAMA. 2018;320(15):1533–1534. doi: 10.1001/jama.2018.13609 [DOI] [PMC free article] [PubMed] [Google Scholar]
- 11.IPUMS USA | 2000 Occupation Codes (OCC). Accessed May 8, 2023. https://usa.ipums.org/usa/volii/occ2000.shtml
- 12.Workplace Violence Prevention Strategies and Research Needs. U.S. Department of Health and Human Services, Public Health Service, Centers for Disease Control and Prevention, National Institute for Occupational Safety and Health; 2006. doi: 10.26616/NIOSHPUB2006144 [DOI] [Google Scholar]
- 13.von Elm E, Altman DG, Egger M, et al. The Strengthening the Reporting of Observational Studies in Epidemiology (STROBE) statement: guidelines for reporting observational studies. Epidemiology. 2007;18(6):800–804. doi: 10.1097/EDE.0b013e3181577654 [DOI] [PubMed] [Google Scholar]
- 14.Archived | Joint Study on Workplace Violence | Office of Justice Programs. Accessed March 15, 2023. https://www.ojp.gov/files/archives/pressreleases/2022/joint-study-workplace-violence [Google Scholar]
- 15.Loomis D, Marshall SW, Ta ML. Employer policies toward guns and the risk of homicide in the workplace. Am J Public Health. 2005;95(5):830–832. doi: 10.2105/AJPH.2003.033535 [DOI] [PMC free article] [PubMed] [Google Scholar]
- 16.Trends in Substance Use Disorders Among Adults Aged 18 or Older. Accessed May 16, 2023. https://www.samhsa.gov/data/sites/default/files/report_2790/ShortReport-2790.html [PubMed]
- 17.Williams KR. Economic sources of homicide: reestimating the effects of poverty and inequality. Am Sociol Rev. 1984;49(2):283. doi: 10.2307/2095577 [DOI] [PubMed] [Google Scholar]
- 18.NIOSH Fast Facts: Taxi Drivers - How to Prevent Robbery and Violence. U.S. Department of Health and Human Services, Public Health Service, Centers for Disease Control and Prevention, National Institute for Occupational Safety and Health; 2019. doi: 10.26616/NIOSHPUB2020100revised112019 [DOI] [Google Scholar]
- 19.Menéndez CC, Amandus H, Damadi P, Wu N, Konda S, Hendricks S. Cities with camera-equipped taxicabs experience reduced taxicab driver homicide rates: United States, 1996–2010. Crime Sci. 2014;3(1). doi: 10.1186/s40163-014-0004-3 [DOI] [PMC free article] [PubMed] [Google Scholar]
- 20.SECTION 1. Chapter 20 of the General Statutes is amended by adding a new. [Google Scholar]
- 21.Charlotte taxi company installs video cameras inside cabs – WSOC TV. Accessed March 16, 2023. https://www.wsoctv.com/news/local/charlotte-taxi-company-installs-video-cameras-insi/335035408/ [Google Scholar]
- 22.Raleigh cab drivers face changes. Accessed March 16, 2023. https://www.wral.com/news/local/story/6359313/
- 23.Castillo DN, Jenkins EL. Industries and occupations at high risk for work-related homicide. J Occup Med. 1994;36(2):125–132. doi: 10.1097/00043764-199402000-00006 [DOI] [PubMed] [Google Scholar]
- 24.Hendricks SA, Landsittel DP, Amandus HE, Malcan J, Bell J. A matched case-control study of convenience store robbery risk factors. J Occup Environ Med. 1999;41(11):995–1004. doi: 10.1097/00043764-199911000-00012 [DOI] [PubMed] [Google Scholar]
- 25.Casteel C, Peek-Asa C, Howard J, Kraus JF. Effectiveness of crime prevention through environmental design in reducing criminal activity in liquor stores: a pilot study. J Occup Environ Med. 2004;46(5):450–458. doi: 10.1097/01.jom.0000126025.14847.b1 [DOI] [PubMed] [Google Scholar]
- 26.Davis J, Casteel C, Menéndez CC. Impact of a crime prevention ordinance for small retail establishments. Am J Ind Med. 2021;64(6):488–495. doi: 10.1002/ajim.23239 [DOI] [PMC free article] [PubMed] [Google Scholar]
- 27.Jeong BY. Occupational deaths and injuries in the construction industry. Appl Ergon. 1998;29(5):355–360. doi: 10.1016/s0003-6870(97)00077-x [DOI] [PubMed] [Google Scholar]
- 28.Chi C-F, Wu M-L. Fatal occupational injuries in Taiwan — Relationship between fatality rate and age. Saf Sci. 1997;27(1):1–17. doi: 10.1016/S0925-7535(97)00046-5 [DOI] [Google Scholar]
- 29.Richey MM, Golightly Y, Marshall SW, et al. Trends in fatal occupational injury rates among older workers before and after the Great Recession of 2008. Occup Environ Med. 2023;80(3):154–159. doi: 10.1136/oemed-2022-108587 [DOI] [PubMed] [Google Scholar]
- 30.Richey MM, Golightly Y, Marshall SW, et al. Trends in fatal occupational injuries in Latino/a workers relative to other groups, North Carolina 2000–2017. Am J Ind Med. 2022;65(4):242–247. doi: 10.1002/ajim.23331 [DOI] [PubMed] [Google Scholar]
- 31.Census of Fatal Occupational Injuries Summary, 2021 – 2021 A01 Results. Accessed March 31, 2023. https://www.bls.gov/news.release/cfoi.nr0.htm
- 32.Orrenius PM, Zavodny M. Do immigrants work in riskier jobs? Demography. 2009;46(3):535–551. doi: 10.1353/dem.0.0064 [DOI] [PMC free article] [PubMed] [Google Scholar]
- 33.Richardson DB, Loomis D, Bena J, Bailer AJ. Fatal occupational injury rates in southern and non-southern States, by race and Hispanic ethnicity. Am J Public Health. 2004;94(10):1756–1761. doi: 10.2105/ajph.94.10.1756 [DOI] [PMC free article] [PubMed] [Google Scholar]
- 34.McClure ES, Gartner DR, Bell RA, et al. Challenges with misclassification of American Indian/Alaska Native race and Hispanic ethnicity on death records in North Carolina occupational fatalities surveillance. Front Epidemiol. 2022;2. doi: 10.3389/fepid.2022.878309 [DOI] [PMC free article] [PubMed] [Google Scholar]
Associated Data
This section collects any data citations, data availability statements, or supplementary materials included in this article.